Article

Integrated Transcriptome and Metabolome Analysis Reveals the Regulatory Mechanisms of FASN in Geese Granulosa Cells

1
Farm Animal Genetic Resources Exploration and Innovation Key Laboratory of Sichuan Province, College of Animal Science and Technology, Sichuan Agricultural University, Chengdu 611130, China
2
Key Laboratory of Agricultural Information Engineering of Sichuan Province, College of Information Engineering, Sichuan Agricultural University, Yaan 625014, China
*
Author to whom correspondence should be addressed.
Int. J. Mol. Sci. 2022, 23(23), 14717; https://doi.org/10.3390/ijms232314717
Submission received: 30 October 2022 / Revised: 23 November 2022 / Accepted: 23 November 2022 / Published: 25 November 2022
(This article belongs to the Section Molecular Genetics and Genomics)

Abstract

:
FASN plays a critical role in lipid metabolism, which is involved in regulating ovarian follicular development. However, the molecular mechanisms of how FASN regulate the function of ovarian follicular cells still remain elusive. In this study, by overexpression or interference of FASN in pre-hierarchical follicle granulosa cells (phGCs) and hierarchical follicle granulosa cells (hGCs), we analyzed their effects on the granulosa cell transcriptome and metabolome profiles using RNA-Seq and LC-MS/MS, respectively. The results showed that overexpression of FASN promoted proinflammatory factors expression by activating TLR3/IRF7 and TLR3/NF-κB pathways in phGCs, but only by activating TLR3/IRF7 pathways in hGCs. Then, necroptosis and apoptosis were triggered through the JAK/STAT1 pathway (induced by inflammatory factors) and BAK/caspase-7 pathway, respectively. The combined analysis of the metabolome and transcriptome revealed that FASN affected the demand of GCs for 5-hydroxytryptamine (5-HT) by activating the neuroactive ligand-receptor interaction pathway in two categorized GCs and only altering the metabolic pathway of tryptophan in phGCs, and ultimately participated in regulating the physiological function of geese GCs. Taken together, this study showed that the mechanisms of FASN regulating the physiological function of geese phGCs and hGCs were similar, but they also had some different characteristics.

1. Introduction

As the critical component of ovarian follicles, GCs play an important role in maintaining follicular development. Most of the previous studies have focused on the apoptosis and steroidogenesis of GCs, but less attention has been paid to the de novo lipogenesis (DNL) process in GCs. As a committed step in the process of lipid metabolism, DNL plays an important role in various physiological processes in cells. DNL in mammalian GCs has been a research hotspot over recent years, but the study of DNL in avian GCs is very limited compared with mammals. However, DNL in avian GCs may be more complex because the follicular maturation is accompanied by the accumulation of yolks, which requires a large amount of lipids. Our previous studies demonstrated that fatty acid synthase (FASN), a key rate-limiting enzyme in DNL, showed a developmental-stage dependent expression pattern in the GCs of geese with different sized follicles [1]. Therefore, we hypothesize that FASN-mediated lipid metabolism may be involved in the regulation of geese follicular development.
FASN catalyzes the formation of palmitic acid, which is a kind of saturated fatty acids (SFA), from acetyl-CoA and malonyl-CoA in the presence of coenzyme Ⅱ reduced tetrasodium salt (NADPH). Several lines of evidence have proven that FASN or palmitic acid participate in the regulation of GC function. In bovine GCs cultured in vitro, the inhibition of FASN by C75 (an inhibitor of FASN) reduced progesterone (P4) biosynthesis through inhibiting the cholesterol biosynthesis and repressing the cell proliferation through downregulating the expression of cyclin-D2 [2]. In addition, it was reported that the addition of 150, 300, or 500 mM of palmitic acid could inhibit the bovine GC proliferation through inducing apoptosis, and stimulated the biosynthesis of oestradiol-17β (E2) by stimulating ovarian NADPH dependent enzymes such as the aromatase enzyme complex [3]. Otherwise, palmitic acid was reported to induce the apoptosis of human GCs due to its lipotoxicity [4]. Moreover, our recent research suggests that FASN interference inhibited P4 biosynthesis of geese GCs through repressing the expression of steroidogenic acute regulatory protein (STAR), while FASN overexpression promoted their apoptosis due to the lipotoxicity of the product of FASN [5]. The mechanisms, however, of how FASN regulates geese GC physiological function remain largely unknown.
Transcriptomics is an important means to study gene expression at the RNA level [6]; as an extension of it, metabolomics reveals the mechanism of its participation in life activities through the changes in small molecule metabolites. There have been many reports of using transcriptome or metabolome independently to study GC function, however, the application of combined transcriptome and metabolome techniques in avian GCs has not been reported thus far.
The present study investigated the metabolome and mRNA transcriptome profiling of FASN-overexpressed and FASN-interfered geese GCs through LC-MS/MS and RNA-Seq, respectively for the first time. This comprehensive analysis is expected to elucidate the similarities and differences of the underlying mechanisms by which FASN regulates phGC and hGC function, and also identifies the critical metabolites in these mentioned regulations.

2. Results

2.1. Efficiency of FASN Overexpression and Interference

In order to determine the efficiency of transfection, pEGFP-N1-FASN, pEGFP-N1, siRNA-FASN, and siRNA-NC were transfected into phGCs and hGCs, respectively. Then, the efficiency of FASN overexpression and interference were verified by qRT-PCR. For the overexpression group, the expression levels of FASN increased to almost 78- and 330-fold compared to the control in phGCs and hGCs, respectively. For the interference group, the expression levels of FASN decreased to 0.42- and 0.37-fold compared to the control in phGCs and hGCs, respectively [5].

2.2. Metabolomics Analysis

After quality control, 1700 kinds of metabolites in total were obtained from 48 detected GC samples by using LC-MS/MS. In this study, 63 and 54 metabolites were identified in FASN-overexpressed phGCs and hGCs, respectively. Thirty-six and 35 metabolites were identified in the FASN-interfered phGCs and hGCs, respectively (Table 1). The corresponding quantitative data concerning these identified metabolites are summarized in Table S1.
To explore the potential metabolic pathways that were affected by FASN, the roles of the differential metabolites were determined by KEGG pathway enrichment analysis using the hypergeometric test (Table 2). Eight, 13, two, and 23 KEGG pathways were enriched by differential metabolites in these four groups, respectively (Table S2). Pyrimidine metabolism and the amino sugar and nucleotide sugar metabolism pathways were significantly enriched by the differential metabolites in FASN-overexpressed phGCs. However, there was no significantly enriched KEGG pathway in the FASN-overexpressed hGCs. The biotin metabolism pathway was significantly enriched by the differential metabolites in the FASN-interfered phGCs. Serotonergic synapse, neuroactive ligand-receptor interaction, gap junction, taste transduction, inflammatory mediator regulation of TRP channels, cAMP signaling pathway, synaptic vesicle cycle, PPAR signaling pathway, adrenergic signaling in cardiomyocytes, vascular smooth muscle contraction, renin secretion, and salivary secretion pathways were significantly enriched by the differential metabolites in the FASN-interfered hGCs.

2.3. Expression Profile of DEGs

To reveal the transcriptional changes caused by the FASN overexpression or interference in geese GCs, RNA-Seq analysis was performed. The results showed that after FASN overexpression, 1099 and 591 DEGs were identified in the phGCs and hGCs, respectively. After FASN interference, 224 and 161 DEGs were identified in the phGCs and hGCs, respectively (Table 3). These results demonstrate that a higher transcriptome diversification was presented when performing FASN overexpression rather than interference. To verify the accuracy of RNA-Seq, twelve genes were selected for qRT-PCR and the results showed similar expression patterns to RNA-Seq for these genes (Figure 1).

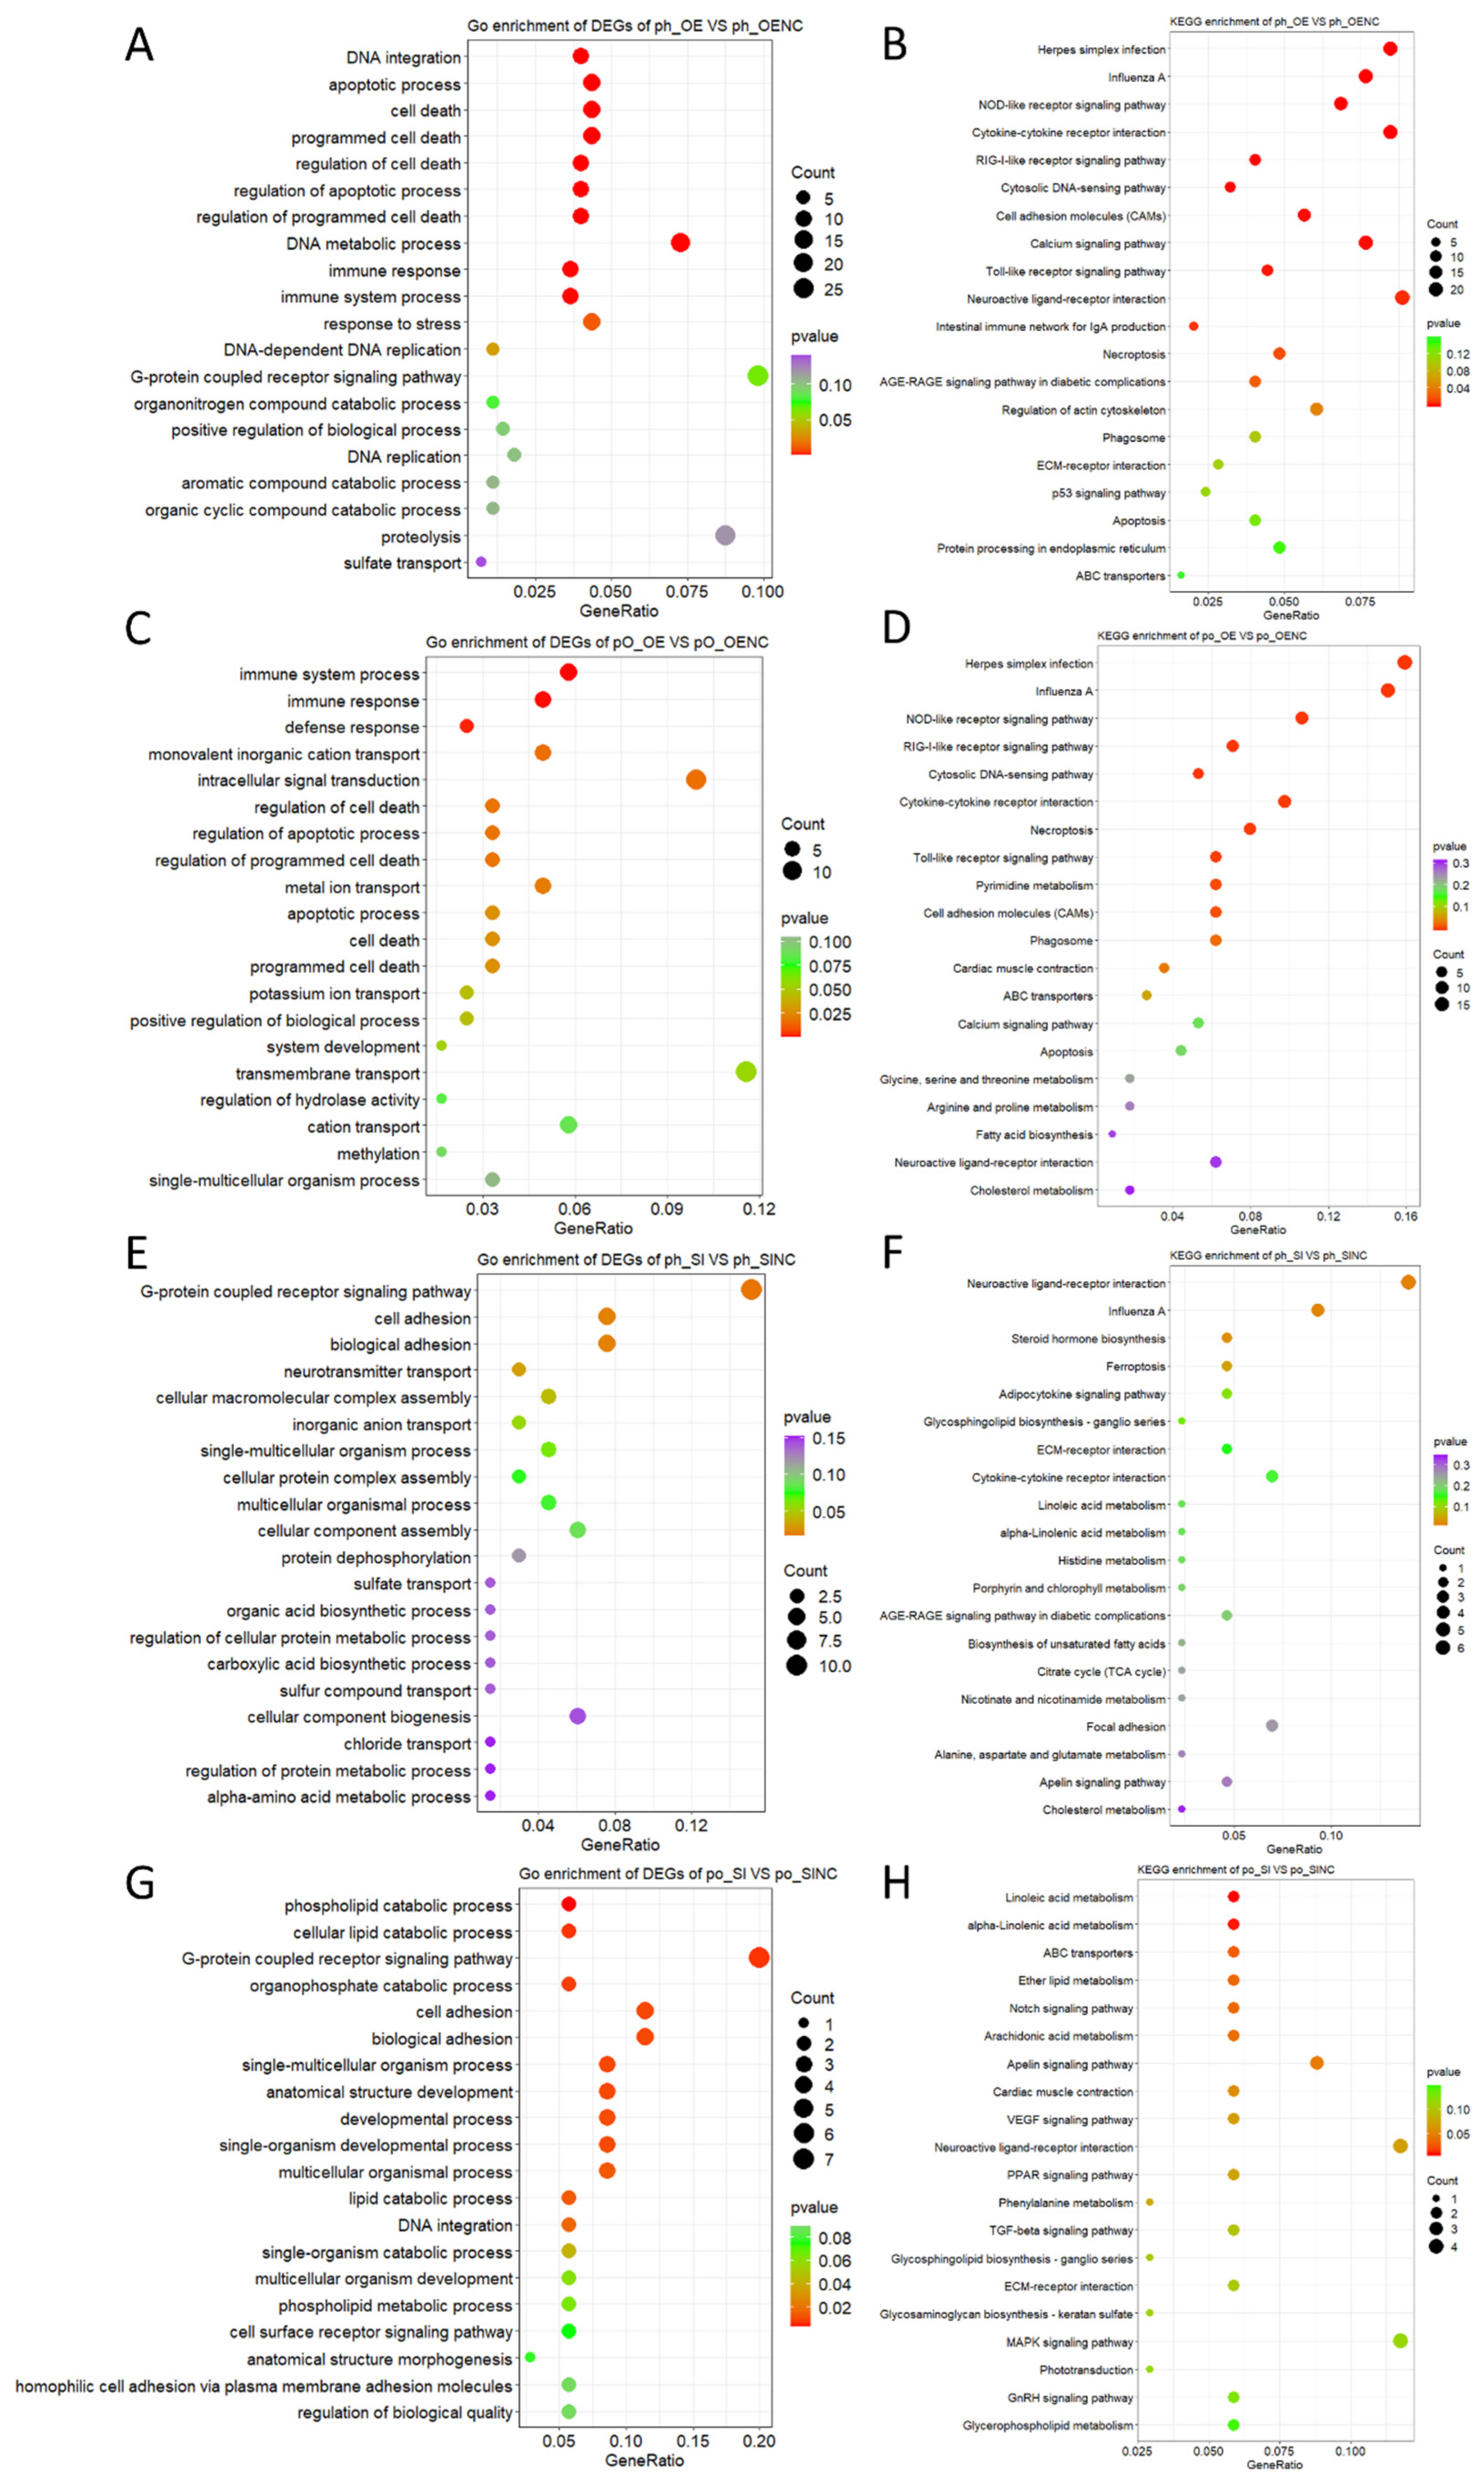
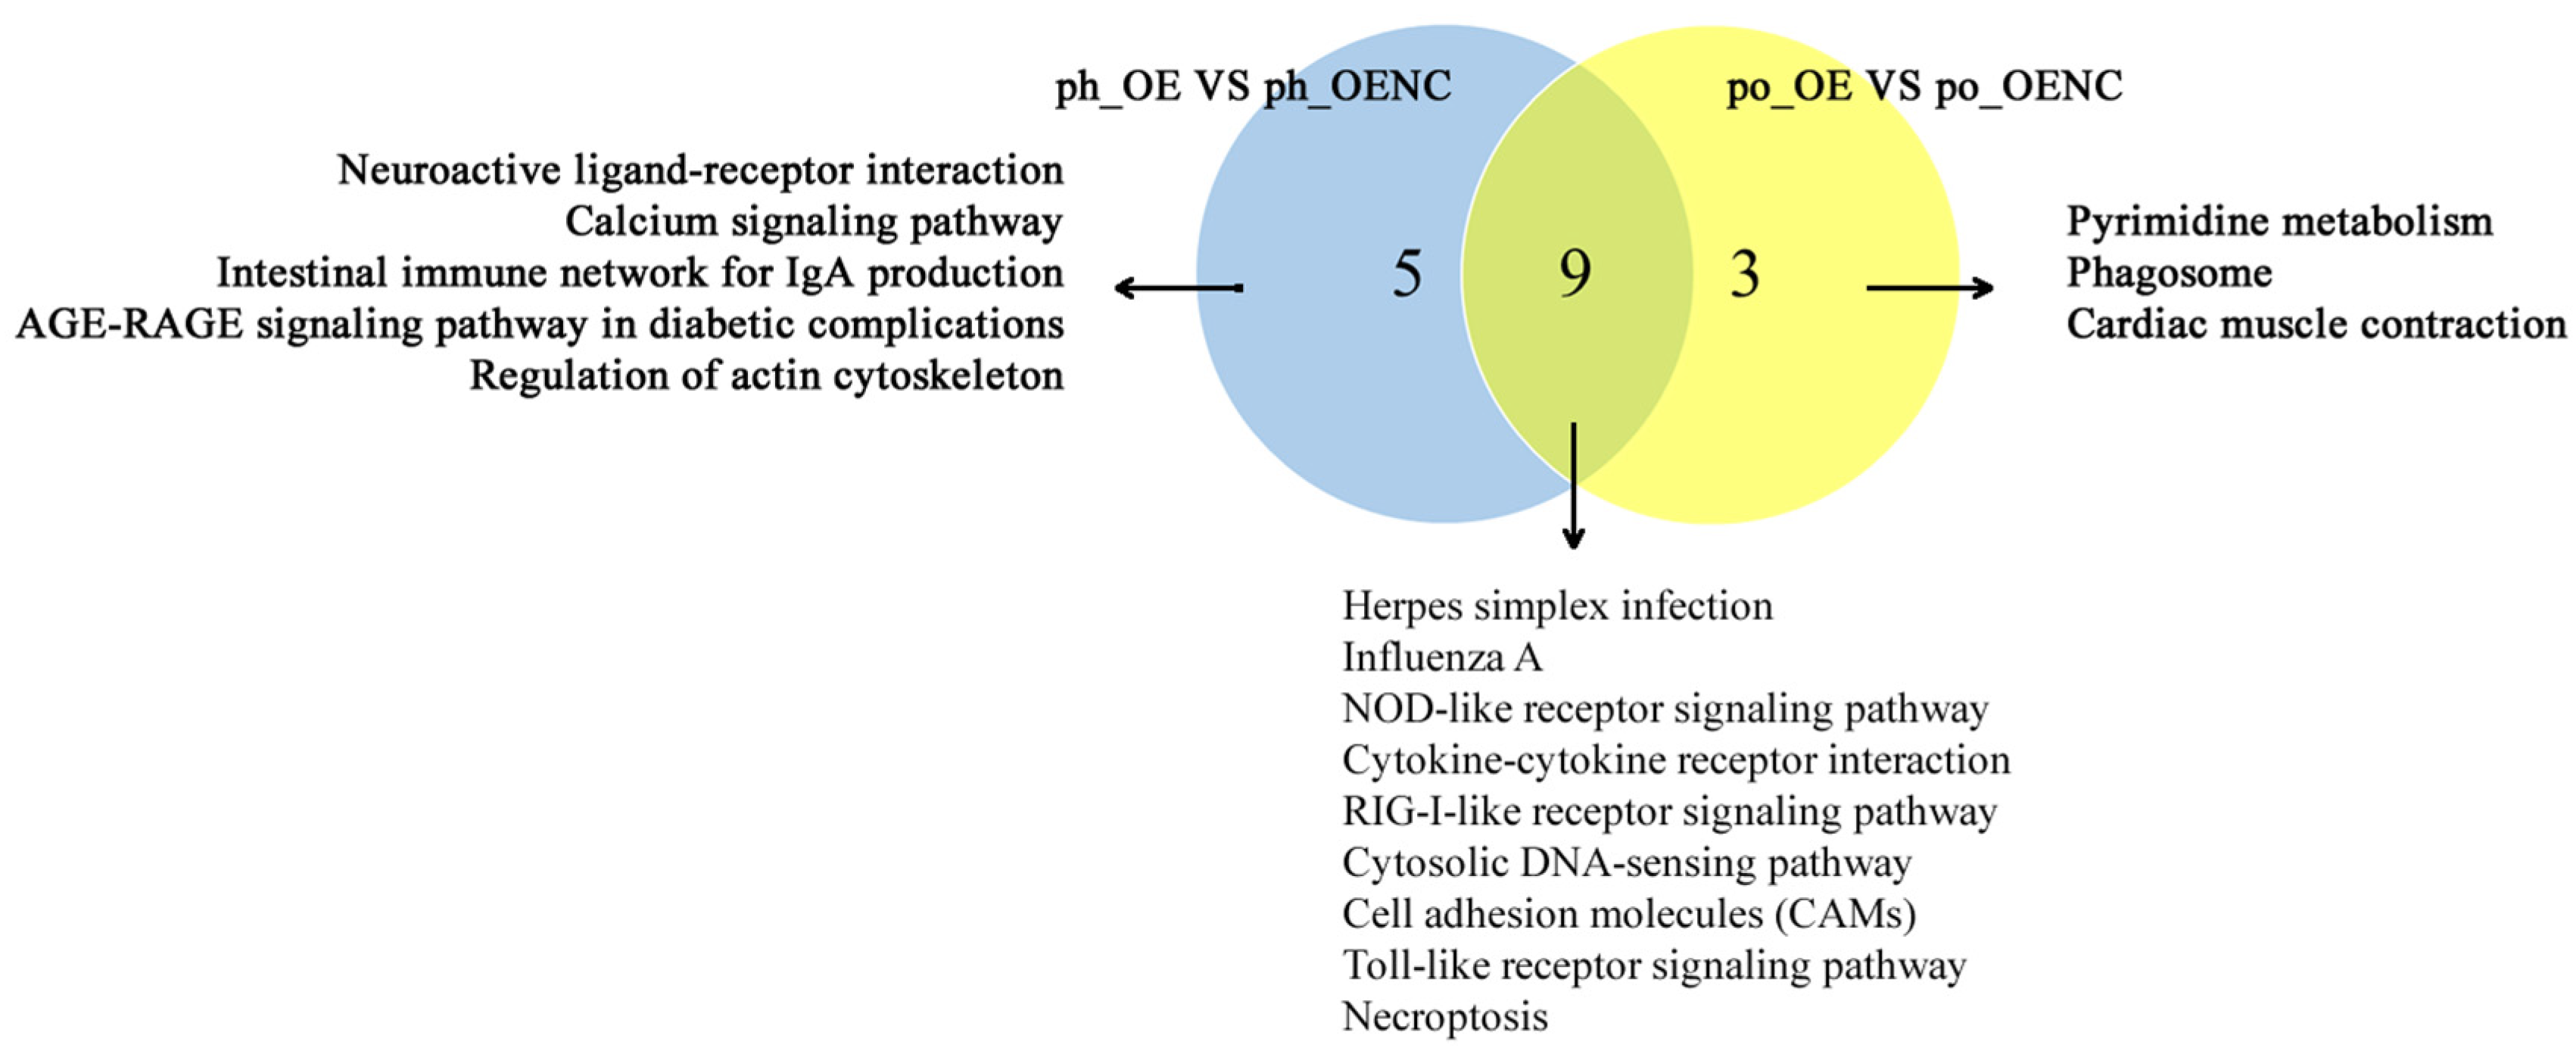
2.4. Functional Enrichment Analysis of DEGs

To identify the effects of FASN on geese GC function, all DEGs were selected for GO enrichment and the KEGG pathway analysis. The first 20 GO terms and KEGG pathways enriched by DEGs in the four groups are listed in Table S3 and Table S4, respectively.
The biological process terms significantly enriched by DEGs in FASN-overexpressed phGCs and hGCs included the apoptotic process, cell death, immune response, immune system process, and so on (Figure 2A,C). It suggests that FASN overexpression might have an important impact on the immune and apoptosis of GCs. The KEGG pathways significantly enriched by these DEGs in the two categorized GCs included herpes simplex infection, influenza A, NOD-like receptor signaling pathway, Toll-like receptor signaling pathway, neuroactive ligand-receptor interaction, and so on (Figure 2B,D).
The biological process terms significantly enriched by DEGs in the FASN-interfered phGCs included the G-protein coupled receptor signaling pathway, cell adhesion, biological adhesion, and so on (Figure 2E). It suggests that FASN interference might have an important impact on the transmembrane signal transduction of phGCs. The KEGG pathways significantly enriched by these DEGs included neuroactive ligand-receptor interaction, influenza A, steroid hormone biosynthesis, and ferroptosis (Figure 2F).
The biological process terms significantly enriched by DEGs in the FASN-interfered hGCs included the phospholipid catabolic process, cellular lipid catabolic process, G-protein coupled receptor signaling pathway, and so on (Figure 2G). It suggests that FASN interference might have an important impact on the lipid metabolism and transmembrane signal transduction of hGCs. The KEGG pathways significantly enriched by these DEGs included linoleic acid metabolism, alpha-linolenic acid metabolism, and so on (Figure 2H).

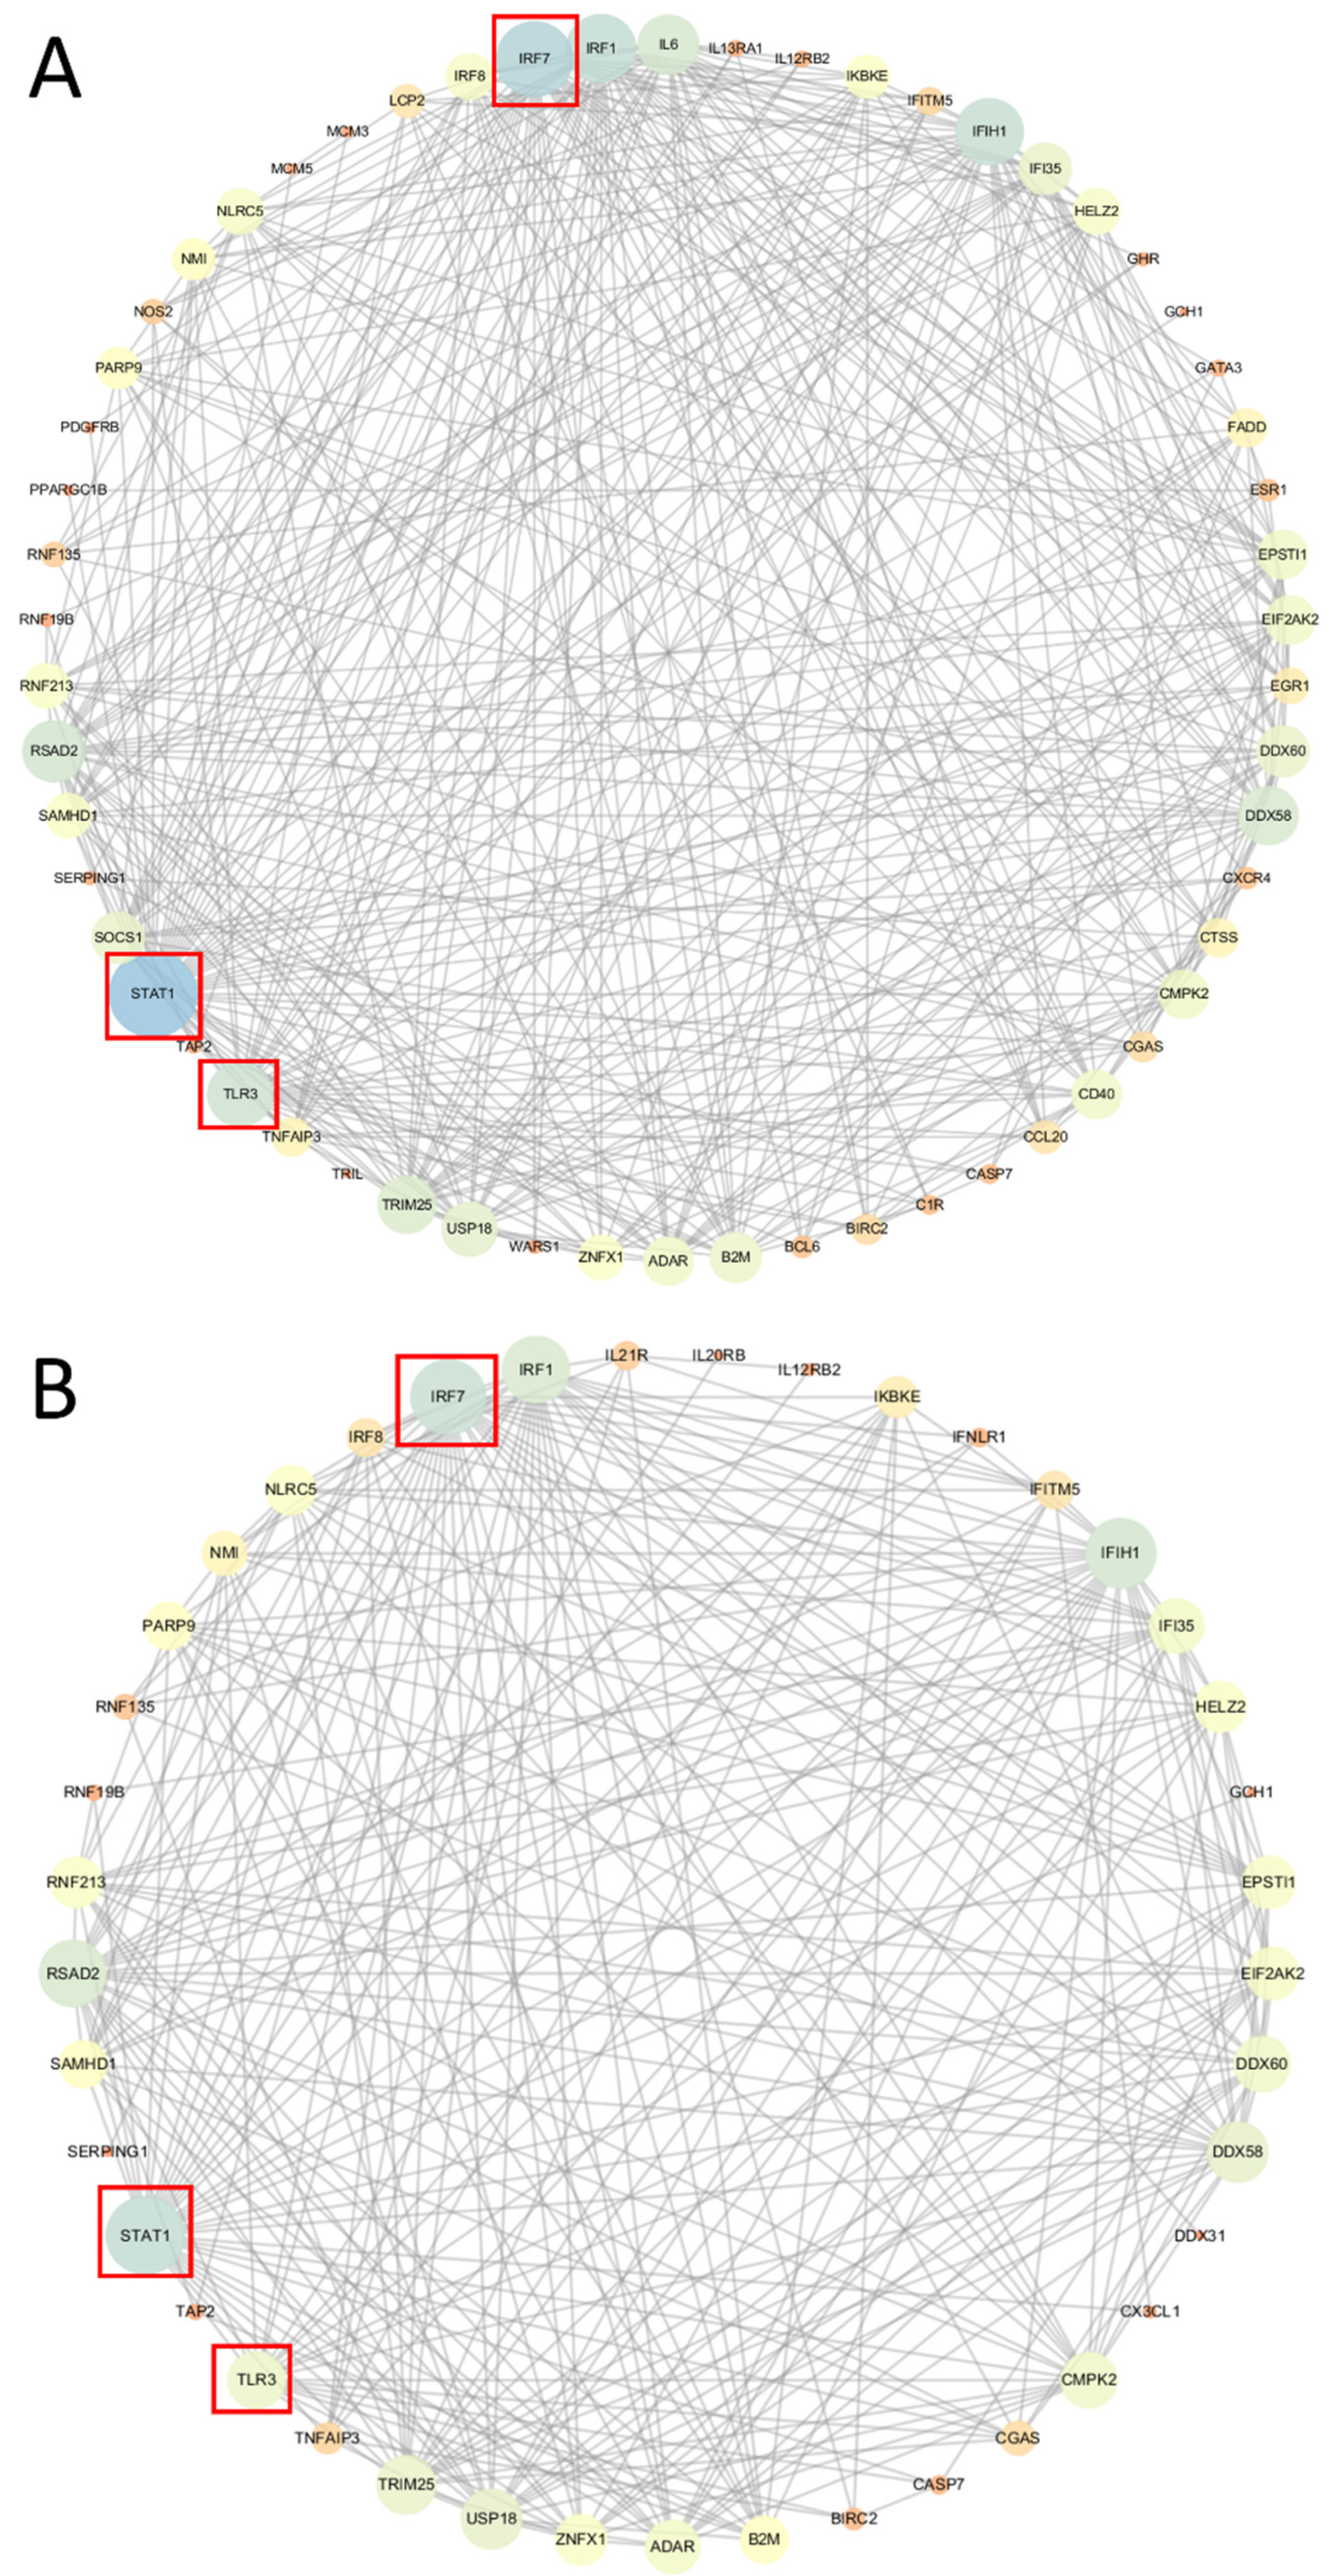
2.5. Network Analysis for DEGs in FASN-Overexpressed phGCs and hGCs

The common KEGG pathways enriched by DEGs in FASN-overexpressed phGCs and hGCs were screened including herpes simplex infection, influenza A, the NOD-like receptor signaling pathway, cytokine-cytokine receptor interaction, RIG-I-like receptor signaling pathway, cytosolic DNA-sensing pathway, cell adhesion molecules (CAMs), Toll-like receptor signaling pathway, and necroptosis (Figure 3). These nine pathways were all related to immune or necroptosis.
To further explore the interaction among DEGs, the DEGs in these nine pathways were singled out and the interaction network was constructed using Cytoscape software (v 3.7.1, (National Institute of General Medical Sciences (NIGMS), Bethesda, Maryland, USA)). According to the score (ranked by degree method) of the nodes (Table S5), signal transducer and activator of transcription 1 (STAT1), interferon regulatory factor 7 (IRF7), and Toll-like receptors 3 (TLR3) were identified as the top three hub genes in the interaction networks of the FASN-overexpressed phGCs and hGCs. Then, we separated DEGs that interacted with STAT1, IRF7, and TLR3 to draw the network diagram. In phGCs, the network showed that interactions mainly occurred among 16 immune-, seven cytokine-cytokine receptor interaction-, seven necroptosis-, and five apoptosis-related genes, respectively (Figure 4A). In hGCs, the network showed that interactions mainly occurred among 15 immune-, six necroptosis-, four apoptosis-, and five cytokine-cytokine receptor interaction-related genes, respectively (Figure 4B). However, the interaction networks of the FASN-interfered phGCs and hGCs were not constructed due to the small number of DEGs identified in the significantly enriched KEGG pathways.

2.6. Combined Metabolome and Transcriptome Analysis

RNA-Seq analysis showed that FASN overexpression activated the neuroactive ligand-receptor interaction signal pathway in phGCs, upregulated the expression of HTR4, HTR 6, and HTR7 (5-HT receptor 4, 6 and 7, the members of neuroactive ligand-receptor interaction signal pathway). In addition, FASN overexpression increased the content of 5-hydroxytryptophol (the metabolite of 5-HT), however, the content of 5-HT in the culture media of phGCs did not decrease (Figure 5A).
FASN interference also activated the neuroactive ligand-receptor interaction signal pathway in hGCs and downregulated the expression of HTR1B and HTR4 (5-HT receptor 1B and 4, the members of neuroactive ligand-receptor interaction signal pathway). In addition, FASN interference increased the content of 5-HT in the culture media of hGCs (Figure 5B).

3. Discussion

In this study, we reported a comprehensive analysis of the transcriptome and metabolome of FASN-overexpressed GCs and FASN-interfered GCs for the identification of the mechanism of FASN regulating geese GC function.
Our results showed that the DEGs identified in the FASN-overexpressed phGCs and hGCs were both enriched in multiple immune related pathways such as the Toll-like receptor signaling pathway. FASN overexpression upregulated the expression of TLR3 in the two categorized GCs. Endogenous molecules of nonmicrobial origin including SFAs were reported to modulate the activation of TLRs, which means that TLRs might be involved in sterile inflammation and immune response [7]. TLRs could mediate the expression of inflammatory cytokines such as interleukin-6 (ILs), interferons (IFNs), and tumor necrosis factors (TNFs) through the activation of transcription factors such as nuclear factor kappa β (NF-kB) and interferon regulatory factor (IRFs) [8,9]. Basically consistent with these above conclusions, our result showed that with the activation of TLR3 induced by FASN overexpression, IRF7 was upregulated in the two categorized GCs and NF-kB2 was upregulated only in phGCs. It has been reported that exogenous SFAs were considered to be potential proinflammatory mediators and could induce the secretion of IL-6 through stimulating the Toll-like receptor signaling pathway [10]. Thus, it could be speculated that the excessive SFAs induced by FASN overexpression triggered the inflammatory response through activating TLR3. Then, TLR3 subsequently enhanced the expression of the pro-inflammatory cytokines via the TLR3/IRF7 pathway in the two categorized GCs, and only via the TLR3/IRF7 signal pathways in hGCs. Our previous study revealed that the innate and acquired immunity in the geese ovary is closely related to reproductive performance [11]. There was evidence indicated that inflammatory cytokines participated in the regulation of GC function, for instance, IL-6 was confirmed to be involved in the production of E2 and P4 in human GCs [12]. It could be inferred that this might also be one of the ways by which FASN regulates GCs function and indirectly affected the egg performance of geese.
We further identified the common top three hub genes (namely STAT1, IRF7, and TLR3) in the FASN-overexpressed phGCs and hGCs. These three genes were all upregulated by FASN overexpression and enriched into most immune- or necroptosis-related pathways. Necroptosis is the defense mechanism or escape route of cells in the face of infection or damage, which is inflammatory. After the activation of necroptosis, the exudation of the cell contents also triggers immune response. A previous study showed that the activation of TLR3 could induce apoptosis in mice GCs [13]. STAT1 is generally considered as a tumor suppressor, and the activation of STAT1 has been confirmed to induce the apoptosis of porcine GCs [14]. In this study, our results suggest that the expression of BAK (BCL-2 homologous antagonist/killer) and caspase-7 were upregulated by FASN overexpression in both phGCs and hGCs. BAK can trigger apoptosis by inducing mitochondrial outer membrane permeability (MOMP) [15]. MOMP promotes the release of cytochrome C and other factors from the membrane gap to form apoptotic bodies, and then activates the caspase cascade, which irreversibly leads to cell death [16,17]. This was basically consistent with the conclusion of the research in mice and porcine GCs, as above-mentioned.
After FASN interference, two transcriptional subtypes of DEGs, namely, aromatase and 3βHSD, were enriched into the steroid hormone biosynthesis pathway in phGCs. These two enzymes are responsible for E2 [18] and P4 synthesis [19]. Therefore, it could be speculated that FASN interference might inhibit the steroidogenesis of phGCs. Several fatty acid metabolic pathways were enriched by DEGs in FASN-interfered hGCs including linoleic acid metabolism, alpha-linolenic acid metabolism, and so on. PLA2G4F (PLA2, group IVF) was one of the DEGs enriched into these above pathways, and its expression was downregulated by FASN interference. The activation of PLA2G4F could induce the release of polyunsaturated fatty acids from cell membrane phospholipids [20]. However, this process in hGCs was inhibited by FASN interference. It was speculated that this may be an adjustment made by hGCs in order to minimize the hydrolysis of membrane phospholipids and give priority to maintaining the structure and function of cell membranes when DNL is inhibited.
Next, we performed a combined analysis for the results of the transcriptome and metabolome, and confirmed that the neuroactive ligand-receptor interaction pathway was crucial for FASN to regulate the function of geese phGCs and hGCs. Several transcriptome studies have confirmed the important role of the neuroactive ligand-receptor interaction pathway in the regulation of reproductive activities such as studies in hen [21], pig [22], and goat [23]. In addition, our previous study suggested that the neuroactive ligand-receptor interaction pathway, especially the HTRs family, was pivotal for geese egg performance [11]. In this study, the results showed that FASN interference downregulated the expression of HTR1B and HTR4 in hGCs, resulting in decreased metabolic demand for 5-HT in hGCs. Meanwhile, we detected that the content of 5-HT in the culture medium of FASN-interfered hGCs increased. FASN overexpression upregulated the expression of HTR4, HTR6, and HTR7 in phGCs, resulting in an increased metabolic demand for 5-HT in phGCs. Meanwhile, we detected that the content of 5-hydroxytryptophol (a metabolite of 5-HT), in the culture medium of FASN-overexpressed phGCs increased. Interestingly, however, with the enhanced metabolism of 5-HT in FASN-overexpressed phGCs, no decrease in 5-HT content was detected in the culture medium. Combined with the transcriptome results, this might be caused by the change in tryptophan metabolism in the phGCs. 5-HT is derived from tryptophan, and brain-derived 5-HT accounts for about 5% of the total 5-HT in the body, while the remaining 95% of 5-HT is produced by peripheral organs [24]. The excessive free fatty acids (FFAs) in plasma have been reported to stimulate platelets to secrete more 5-HT, resulting in an increase in the concentration of 5-HT in plasma [25]. Our transcriptome results showed that in phGCs, the expression of WAR (tryptophan tRNA synthetase) was downregulated by FASN overexpression, which meant that the amount of tryptophan involved in protein synthesis decreased. It could be speculated that this part of tryptophan may be used for 5-HT synthesis and continuously secreted into the culture medium to make up for the consumption of 5-HT. This revealed that FASN overexpression activated the tryptophan metabolic pathway of phGCs, inducing phGCs to improve the ability to metabolize tryptophan to 5-HT, so as to adapt to the change of 5-HT demand caused by FASN overexpression. However, more in-depth researches are needed to further understand the role of 5-HT and HTRs in the GC function and egg performance of geese.

4. Materials and Methods

4.1. Experimental Animals

The maternal line of Tianfu meat geese (35–40 weeks of age) laying in regular sequences of at least 2–3 eggs were selected for this study. These geese were kept under the same conditions of light and temperature and were allowed ad libitum to feed and water at the Waterfowl Breeding Experimental Farm at Sichuan Agricultural University (Sichuan, China). Individual laying cycles were monitored and recorded, and the healthy geese were euthanized by cervical dislocation 6–8 h ahead of oviposition. All experiments were conducted according to the institutional ethical guidelines for animal experiments of the National Defense Medical College. These experiments were approved by the Sichuan Agricultural University Animal Welfare Committee (approval number: 20190035, date of approval 12 March 2019).

4.2. GC Culture and Transfection

The granulosa layers separated from the pre-hierarchical follicles (6–10 mm) and hierarchical follicles (F4-F1) were washed with PBS (Solar bio, Beijing, China), respectively. GCs were isolated by 0.1% collagenase Ⅱ (Sigma, Aldrich, Burlington, MA, USA) digestion, then counted and cultured as previously described [26]. At 70~80% confluence, GCs were transfected with pEGFP-N1-FASN (2 μg/mL), pEGFP-N1 (2 μg/mL, control) and siRNA-FASN (90 pmol/mL), siRNA-NC (90 pmol/mL, control) individually using lipofectamine 3000 (Invitrogen, Carlsbad, CA, USA) according to the manufacturer’s instructions, and assayed at 48 h post-transfection [5].

4.3. Metabolomics Detection

We divided 48 samples into four groups, and each group was further divided into two groups (experimental group and control group) (Table 4). A total of 100 μL of each sample was added to a 1.5 mL Eppendorf tube and then resuspended with prechilled 80% methanol and 0.1% formic acid by well vortexing. The samples were incubated on ice for 5 min and then centrifuged at 15,000 rpm, 4 °C for 5 min. Some of the supernatant was diluted to a final concentration containing 60% methanol by LC-MS grade water. The samples were subsequently transferred to a fresh Eppendorf tube with a 0.22 μm filter and then centrifuged at 15,000× g, 4 °C for 10 min. Finally, the filtrate was injected into the LC-MS/MS system analysis. In addition, the QC sample was prepared by mixing equal aliquots of all samples to generate a pooled sample.
LC-MS/MS analyses were performed using a Vanquish UHPLC system (Thermo Fisher, Waltham, MA, USA) coupled with an Orbitrap Q Exactive HF-X mass spectrometer (Thermo Fisher, Waltham, MA, USA). Samples were injected onto a Hyperil Gold column (100 × 2.1 mm, 1.9 μm) using a 16-min linear gradient at a flow rate of 0.2 mL/min. The eluents for the positive polarity mode were eluent A (0.1% FA in water) and eluent B (methanol). The eluents for the negative polarity mode were eluent A (5 mM ammonium acetate, pH 9.0) and eluent B (methanol). The solvent gradient was set as follows: 2% B, 1.5 min; 2–100% B, 12.0 min; 100% B, 14.0 min; 100–2% B, 14.1 min; 2% B, 16 min. Q Exactive HF-X mass spectrometer was operated in positive/negative polarity mode with a spray voltage of 3.2 kV, capillary temperature of 320 °C, sheath gas flow rate of 35 arb, and aux gas flow rate of 10 arb.

4.4. Metabolites Identification

The raw data files generated by UHPLC-MS/MS were processed using the Compound Discoverer 3.0 (CD 3.0, Thermo Fisher, Waltham, MA, USA) to perform peak alignment, peak picking, and quantitation for each metabolite. The main parameters were set as follows: retention time tolerance, 0.2 min; actual mass tolerance, 5 ppm; signal intensity tolerance, 30%; signal/noise ratio, 3; and minimum intensity, 100,000. Afterward, the peak intensities were normalized to the total spectral intensity. The normalized data were used to predict the molecular formula based on additive ions, molecular ion peaks, and fragment ions. Then, the peaks were matched with the mzCloud (https://www.mzcloud.org/ (accessed on 15 September 2019), HighChem LLC, Kashiwa, Chiba, Japan) and ChemSpider (http://www.chemspider.com/ (accessed on 15 September 2019), Royal Society of Chemistry, Science Park, Milton Road, Cambridge, UK) database to obtain accurate qualitative and relative quantitative results.

4.5. Differential Metabolite Analysis

Projection to partial least-squares-discriminant analysis (PLS-DA) was further conducted to obtain a high level of group separation and to better understand the variables responsible for group classification. To guard against overfitting, the default 7-fold cross-validation was applied and permutation tests with 200 iterations were performed to further validate the supervised model. Based on the combination of a statistically significant threshold of variable influence on the projection values (VIP > 1) calculated from the PLA-DA model and the p-value (p < 0.05), the differential metabolites were selected.

4.6. RNA-Seq and Functional Analysis of the DEGs

We divided 32 samples into four groups, and each group was further divided into two groups (experimental group and control group) (Table 4), and the total RNA was extracted using a RNeasy Mini Kit (Qiagen, Germany) at Novogene (Tianjin, China). The integrity of total RNA was detected with the RNA Nano 6000 Assay Kit of the Bioanalyzer 2100 system (Agilent Technologies, Santa Clara, CA, USA).
Then, the cDNA libraries were constructed using the NEBNext® UltraTM RNA Library Prep Kit for Illumina® (NEB, Ipswich, MA, USA) following the manufacturer’s recommendations and sequenced on an Illumina Hiseq platform. The adaptor reads, poly-N contained reads (N% >10%), and low-quality reads were removed, and the clean reads were mapped onto geese reference genome (anscyg_prjna183603_v1.0) by Hisat2 (v2.0.5). The read numbers mapped to each gene were counted using featureCounts v1.5.0-p3, then the fragments per kilobases per million mapped reads (FPKM) of each gene was calculated based on the length of the gene and reads count mapped to this gene. Comparisons of FPKM in the four groups were performed using the DESeq2 R package (1.16.1), and the genes with a fold change (FC) more than 1.5 and p-value less than 0.05 were defined as DEGs. Next, the DEGs were subjected to Gene Ontology (GO) and Kyoto Encyclopedia of Genes and Genomes (KEGG) analysis by the clusterProfiler R package, and the GO terms and KEGG pathways with a p-value less than 0.05 were considered significantly enriched by DEGs.

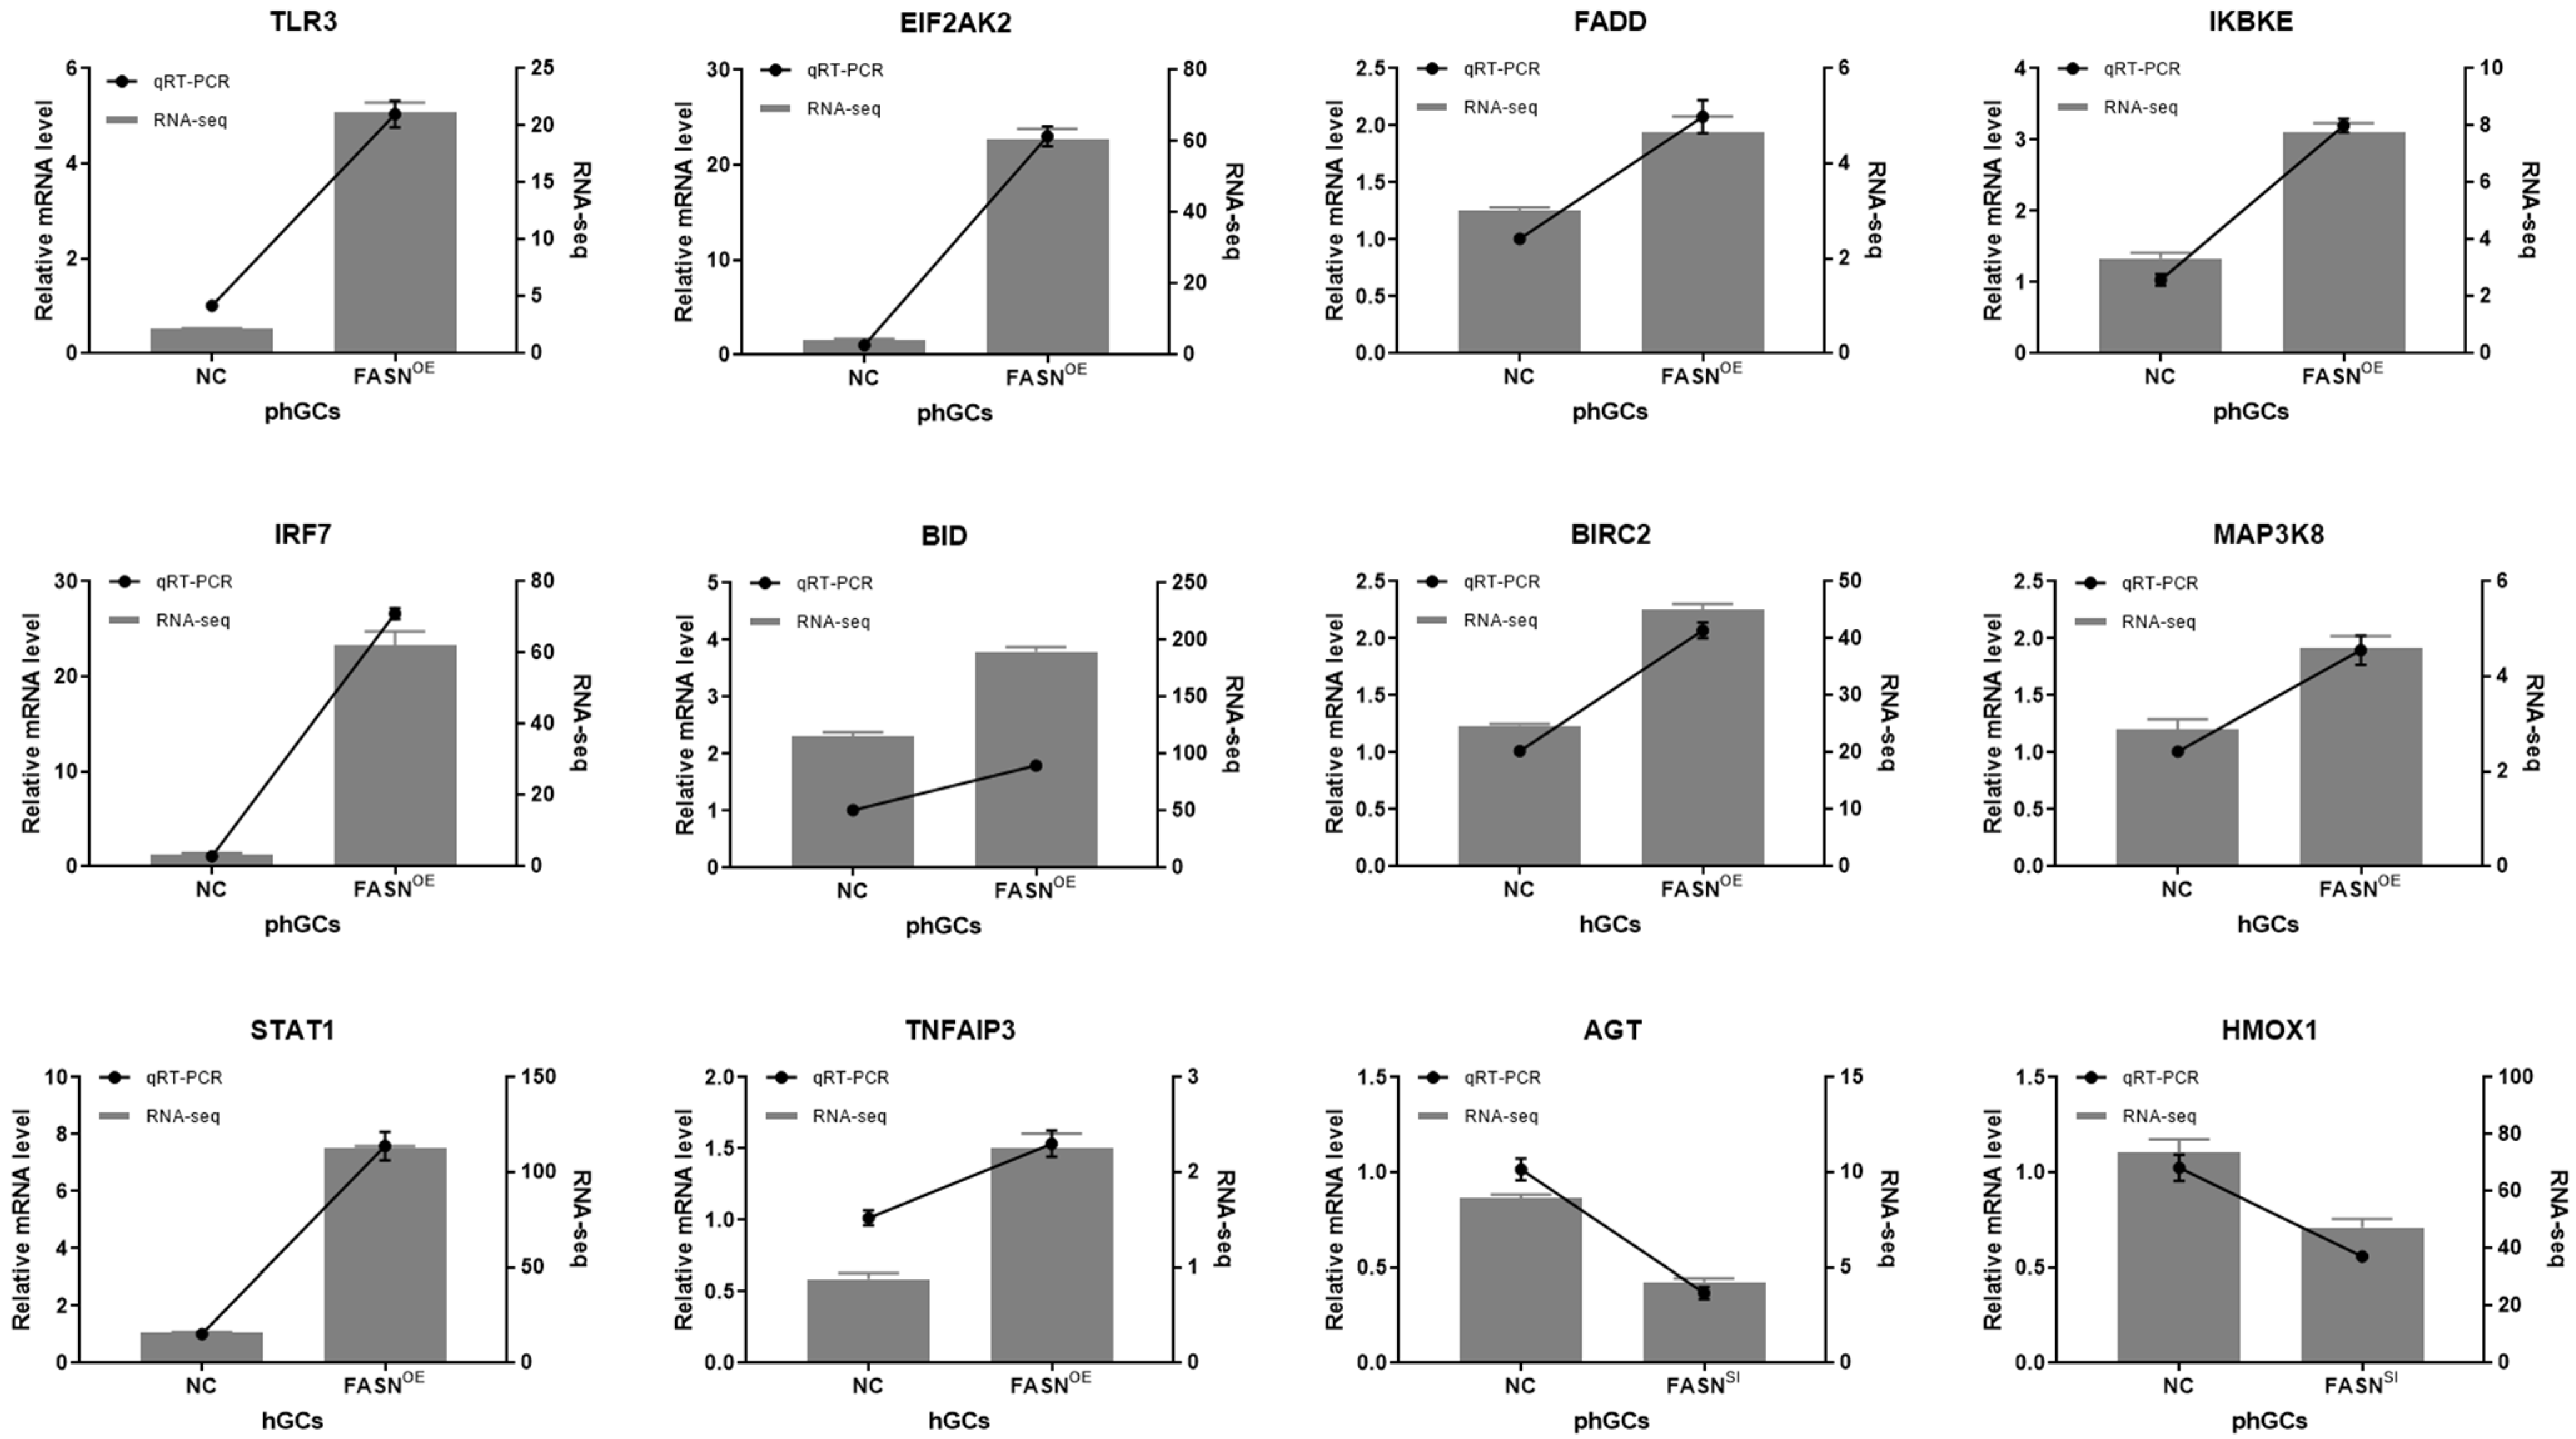
4.7. qRT-PCR for Validation of the DEGs

Twelve genes (TLR3, EIF2AK2, FADD, IKBKE, IRF7, BID, BIRC2, MAP3K8, STAT1, TNFAIP3, AGT, HMOX1) were selected for validation by qRT-PCR using 2 × SYBR Premix Ex Taq II (TaKaRa, Dalian, China). The reaction solutions were prepared in a total volume of 12.5 μL containing 1 μL cDNA, 6.25 μL of 2 × SYBR Premix Ex Taq, 4.25 μL of ddH2O, and 0.5 μL of each gene-specific primer (10 μM). For each sample, the analysis was conducted in triplicate and normalized to β-actin by the 2−ΔΔCt method [27]. The control was set as one. The primers for qRT-PCR are summarized in Table 5.

5. Conclusions

We showed that the DEGs in the FASN-overexpressed phGCs and hGCs were mostly enriched into immunity- and necroptosis-related pathways, especially the Toll-like receptor signal pathway. FASN overexpression could promote proinflammatory factor expression by activating the TLR3/IRF7 and TLR3/NF-κB signal pathways in phGCs, and only by activating the TLR3/IRF7 signal pathways in hGCs. These proinflammatory factors could induce the necroptosis of geese GCs by activating the JAK/STAT1 signaling pathway. In addition, FASN overexpression also induced the apoptosis of geese GCs by activating the BAK/caspase-7 signaling pathway. The combined analysis of the metabolome and transcriptome revealed that FASN affected the demand of GCs for 5-HT by activating the neuroactive ligand-receptor interaction pathway in two categorized GCs and only altering the metabolic pathway of tryptophan in phGCs, and ultimately participated in regulating the physiological function of geese GCs and follicle development. Based on these findings, the obtained results provide a theoretical basis for further analyzing the mechanism of lipid metabolism involved in the regulation of GC function and follicular development in geese. However, further studies are needed to gain a deeper understanding of the roles of 5-HT and HTRs in the GC function and egg performance of geese.

Supplementary Materials

The following supporting information can be downloaded at: https://www.mdpi.com/article/10.3390/ijms232314717/s1.

Author Contributions

Methodology, Software, Validation, Formal analysis, Investigation, Resources, Writing—original draft preparation, Writing—review and editing, Visualization, X.C.; Software, Investigation, K.H.; Conceptualization, Data curation, Writing—review and editing, Funding acquisition, Project administration, S.H.; Investigation, G.L.; Investigation, X.G.; Investigation, S.G.; Investigation, Y.D.; Investigation, J.H.; Investigation, L.L.; Investigation, B.H.; Investigation, H.H.; Investigation, H.L.; Investigation, L.X.; Supervision, Project administration, Funding acquisition J.W. All authors have read and agreed to the published version of the manuscript.

Funding

This research was supported by the National Natural Science Foundation of China (Grant No. 31972567), the China Agricultural Research System (Grant No. CARS-42-4), and the Key Technology Support Program of Sichuan Province (Grant No. 2021YFYZ0014).

Institutional Review Board Statement

All experiments were conducted according to the institutional ethical guidelines for animal experiments of the National Defense Medical College. These experiments were approved by the Sichuan Agricultural University Animal Welfare Committee (approval number: 20190035, date of approval 12 March 2019).

Informed Consent Statement

Not applicable.

Data Availability Statement

The data in this study can be shared upon reasonable request from the corresponding author.

Acknowledgments

We thank Qingyuan Ouyang for her assistance.

Conflicts of Interest

The authors declare that the research was conducted in the absence of any commercial or financial relationships that could be construed as potential conflicts of interest.

References

  1. Wen, R.; Gan, X.; Hu, S.; Gao, S.; Deng, Y.; Qiu, J.; Sun, W.; Li, L.; Han, C.; Hu, J.; et al. Evidence for the existence of de novo lipogenesis in goose granulosa cells. Poult. Sci. 2019, 98, 1023–1030. [Google Scholar] [CrossRef] [PubMed]
  2. Elis, S.; Desmarchais, A.; Maillard, V.; Uzbekova, S.; Monget, P.; Dupont, J. Cell proliferation and progesterone synthesis depend on lipid metabolism in bovine granulosa cells. Theriogenology 2015, 83, 840–853. [Google Scholar] [CrossRef] [PubMed]
  3. Vanholder, T.; Leroy, J.; Van Soom, A.; Opsomer, G.; Maes, D.; Coryn, M.; de Kruif, A. Effect of non-esterified fatty acids on bovine granulosa cell steroidogenesis and proliferation in vitro. Anim. Reprod. Sci. 2005, 87, 33–44. [Google Scholar] [CrossRef] [PubMed]
  4. Mu, Y.; Yanase, T.; Nishi, Y.; Tanaka, A.; Saito, M.; Jin, C.H.; Mukasa, C.; Okabe, T.; Nomura, M.; Goto, K.; et al. Saturated FFAs, Palmitic Acid and Stearic Acid, Induce Apoptosis in Human Granulosa Cells. Endocrinology 2001, 142, 3590–3597. [Google Scholar] [CrossRef]
  5. Chen, X.; Huang, K.; Hu, S.; Lan, G.; Gan, X.; Gao, S.; Deng, Y.; Hu, J.; Li, L.; Hu, B.; et al. FASN-Mediated Lipid Metabolism Regulates Goose Granulosa Cells Apoptosis and Steroidogenesis. Front. Physiol. 2020, 11, 600. [Google Scholar] [CrossRef]
  6. Griffiths, W.; Wang, Y. Mass spectrometry: From proteomics to metabolomics and lipidomics. Chem. Soc. Rev. 2009, 38, 1882–1896. [Google Scholar] [CrossRef]
  7. Weatherill, A.; Lee, J.; Zhao, L.; Lemay, D.; Youn, H.; Hwang, D. Saturated and polyunsaturated fatty acids reciprocally modulate dendritic cell functions mediated through TLR4. J. Immunol. 2005, 174, 5390–5397. [Google Scholar] [CrossRef] [Green Version]
  8. Lemaitre, B.; Nicolas, E.; Michaut, L.; Reichhart, J.; Hoffmann, J. The dorsoventral regulatory gene cassette spätzle/Toll/cactus controls the potent antifungal response in Drosophila adults. Cell 1996, 86, 973–983. [Google Scholar] [CrossRef] [Green Version]
  9. Takeda, K.; Akira, S. TLR signaling pathways. Semin. Immunol. 2004, 16, 3–9. [Google Scholar] [CrossRef] [PubMed]
  10. Frommer, K.; Schäffler, A.; Rehart, S.; Lehr, A.; Müller-Ladner, U.; Neumann, E. Free fatty acids: Potential proinflammatory mediators in rheumatic diseases. Ann. Rheum. Dis. 2015, 74, 303–310. [Google Scholar] [CrossRef] [PubMed]
  11. Ouyang, Q.; Hu, S.; Wang, G.; Hu, J.; Zhang, J.; Li, L.; Hu, B.; He, H.; Liu, H.; Xia, L.; et al. Comparative Transcriptome Analysis Suggests Key Roles for 5-Hydroxytryptamlne Receptors in Control of Goose Egg Production. Genes 2020, 11, 455. [Google Scholar] [CrossRef] [PubMed] [Green Version]
  12. Salmassi, A.; Lü, S.; Hedderich, J.; Oettinghaus, C.; Jonat, W.; Mettler, L. Interaction of interleukin-6 on human granulosa cell steroid secretion. J. Endocrinol. 2001, 170, 471–478. [Google Scholar] [CrossRef] [PubMed] [Green Version]
  13. Yan, K.; Cheng, L.; Liu, P.; Liu, Z.; Zhao, S.; Zhu, W.; Wang, Q.; Wu, H.; Han, D. Polyinosinic-Polycytidylic Acid Perturbs Ovarian Functions Through Toll-Like Receptor 3-Mediated Tumor Necrosis Factor A Production in Female Mice. Biol. Reprod. 2015, 93, 11. [Google Scholar] [CrossRef] [PubMed] [Green Version]
  14. Benco, A.; Sirotkin, A.V.; Vasícek, D.; Pavlová, S.; Zemanová, J.; Kotwica, J.; Darlak, K.; Valenzuela, F. Involvement of the transcription factor STAT1 in the regulation of porcine ovarian granulosa cell functions treated and not treated with ghrelin. Reproduction 2009, 138, 553–560. [Google Scholar] [CrossRef] [Green Version]
  15. Ma, X.; Yu, M.; Hao, C.; Yang, W. Shikonin induces tumor apoptosis in glioma cells via endoplasmic reticulum stress, and Bax/Bak mediated mitochondrial outer membrane permeability. J. Ethnopharmacol. 2020, 263, 113059. [Google Scholar] [CrossRef]
  16. Kalkavan, H.; Green, D.R. MOMP, cell suicide as a BCL-2 family business. Cell Death Differ. 2017, 25, 46–51. [Google Scholar] [CrossRef] [PubMed]
  17. Dadsena, S.; King, L.E.; García-Sáez, A. Apoptosis regulation at the mitochondria membrane level. Biochim. Biophys. Acta (BBA) Biomembr. 2021, 1863, 183716. [Google Scholar] [CrossRef] [PubMed]
  18. Strohmeier, K.; Hofmann, M.; Jacak, J.; Narzt, M.; Wahlmueller, M.; Mairhofer, M.; Schaedl, B.; Holnthoner, W.; Barsch, M.; Sandhofer, M.; et al. Multi-Level Analysis of Adipose Tissue Reveals the Relevance of Perivascular Subpopulations and an Increased Endothelial Permeability in Early-Stage Lipedema. Biomedicines 2022, 10, 1163. [Google Scholar] [CrossRef] [PubMed]
  19. Conley, A.; Legacki, E.; Corbin, C.; Stanley, S.; Dahlen, C.; Reynolds, L. Serum and tissue pregnanes and pregnenes after dexamethasone treatment of cows in late gestation. Reproduction 2019, 157, 413–422. [Google Scholar] [CrossRef]
  20. Das, U. “Cell Membrane Theory of Senescence” and the Role of Bioactive Lipids in Aging, and Aging Associated Diseases and Their Therapeutic Implications. Biomolecules 2021, 11, 241. [Google Scholar] [CrossRef]
  21. Zhang, T.; Chen, L.; Han, K.; Zhang, X.; Zhang, G.; Dai, G.; Wang, J.; Xie, K. Transcriptome analysis of ovary in relatively greater and lesser egg producing Jinghai Yellow Chicken. Anim. Reprod. Sci. 2019, 208, 106114. [Google Scholar] [CrossRef] [PubMed]
  22. Xu, S.; Wang, D.; Zhou, N.; Lin, Y.; Che, L.; Fang, Z.; Wu, D. Reproductive Hormone and Transcriptomic Responses of Pituitary Tissue in Anestrus Gilts Induced by Nutrient Restriction. PLoS ONE 2015, 10, e0143219. [Google Scholar] [CrossRef] [PubMed]
  23. Su, F.; Guo, X.; Wang, Y.; Wang, Y.; Cao, G.; Jiang, Y. Genome-Wide Analysis on the Landscape of Transcriptomes and Their Relationship With DNA Methylomes in the Hypothalamus Reveals Genes Related to Sexual Precocity in Jining Gray Goats. Front. Endocrinol. 2018, 9, 501. [Google Scholar] [CrossRef] [PubMed] [Green Version]
  24. Berger, M.; Gray, J.; Roth, B. The expanded biology of serotonin. Annu. Rev. Med. 2009, 60, 355–366. [Google Scholar] [CrossRef] [PubMed] [Green Version]
  25. Chen, Y.W. Effects of free fatty acids on serotonin 2C receptor and calcium homeostasis in pancreatic beta cells. In Proceedings of the Annual Meeting of The Japanese Pharmacological Society, Kyoto, Japan, 4 July 2018; 2018. WCP2018, PO2-7-17. [Google Scholar]
  26. Deng, Y.; Gan, X.; Chen, D.; Huang, H.; Yuan, J.; Qiu, J.; Hu, S.; Hu, J.; Wang, J. Comparison of growth characteristics of in vitro cultured granulosa cells from geese follicles at different developmental stages. Biosci. Rep. 2018, 38, BSR20171361. [Google Scholar] [CrossRef] [Green Version]
  27. Livak, K.J.; Schmittgen, T.D. Analysis of Relative Gene Expression Data Using Real-Time Quantitative PCR and the 2-ΔΔCt Method. Methods 2000, 25, 402–408. [Google Scholar] [CrossRef] [PubMed]
Figure 1. Validation analysis of twelve DEGs by qRT-PCR (line) and RNA-Seq (bar). OE is the abbreviation for overexpression. The expression of genes detected by qRT-PCR were normalized by β-actin and the control was set as one. Results were presented as the mean ± SEM of four samples.
Ijms 23 14717 g001
Figure 2. Functional enrichment analysis of the DEGs. (A,B) GO and KEGG analysis of DEGs in FASN-overexpressed phGCs, respectively. (C,D) GO and KEGG analysis of DEGs in FASN-overexpressed hGCs. (E,F) GO and KEGG analysis of DEGs in the FASN-interfered phGCs, respectively. (G,H) GO and KEGG analysis of DEGs in the FASN-interfered hGCs, respectively.
Ijms 23 14717 g002
Figure 3. The intersection of significantly enriched pathways in the FASN-overexpressed phGCs and hGCs. ph_OE and po_OE are the abbreviations of the FASN-overexpressed phGCs and hGCs, respectively, while ph_OENC and po_OENC are the corresponding control groups, respectively. The number “9” indicate the significantly enriched pathways present both in the FASN-overexpressed phGCs and hGCs, while the number “5” and “3” indicate the significantly enriched pathways present only in the FASN-overexpressed phGCs and hGCs, respectively.
Ijms 23 14717 g003
Figure 4. Network diagram of hub genes. (A,B) Network diagram of the top three hub genes in the FASN-overexpressed phGCs and hGCs, respectively. The nodes in the figure were proteins, and the connections were interactions. In the interaction network diagram, the size of the node was proportional to the degree of this node, where the greater the degree, the larger the node. The hub genes were circled in red.
Ijms 23 14717 g004
Figure 5. Effects of FASN on the function of geese GCs. (A) Effects of FASN overexpression on the function of phGCs. (B) Effects of FASN interference on the function of hGCs. This figure was drawn by Figdraw (www.figdraw.com (accessed on 15 April 2022)).
Ijms 23 14717 g005
Table 1. The number of differential metabolites.
Compared SamplesNum. of Total Sig.Num. of Sig. UpNum. of Sig. Down
ph_OE vs. ph_OENC63594
po_OE vs. po_OENC543321
ph_SI vs. ph_SINC361917
po_SI vs. po_SINC351718
Note: ph_OE and po_OE are the abbreviations of FASN-overexpressed phGCs and hGCs, respectively, while ph_OENC and po_OENC are the corresponding control groups, respectively. ph_SI and po_SI are the abbreviations of FASN-interfered phGCs and hGCs, respectively, while ph_SINC and po_SINC are the corresponding control groups, respectively.
Table 2. Significantly enriched KEGG pathway by differential metabolites.
GroupMap IDMap Titlep-Value
ph_OE vs. ph_OENCmap00240Pyrimidine metabolism0.019931862
map00520Amino sugar and nucleotide sugar metabolism0.042016807
map00480Glutathione metabolism0.031746032
ph_SI vs. ph_SINCmap00780Biotin metabolism0.015873016
po_SI vs. po_SINCmap04726Serotonergic synapse0.001424299
map04080Neuroactive ligand-receptor interaction0.001914757
map04540Gap junction0.004199855
map04742Taste transduction0.004199855
map04750Inflammatory mediator regulation of TRP channels0.004199855
map04024cAMP signaling pathway0.008255516
map04721Synaptic vesicle cycle0.008255516
map03320PPAR signaling pathway0.042016807
map04261Adrenergic signaling in cardiomyocytes0.042016807
map04270Vascular smooth muscle contraction0.042016807
map04924Renin secretion0.042016807
map04970Salivary secretion0.042016807
Note: ph_OE and po_OE are the abbreviations of the FASN-overexpressed phGCs and hGCs, respectively, while ph_OENC and po_OENC are the corresponding control groups, respectively. ph_SI and po_SI are the abbreviations of the FASN-interfered phGCs and hGCs, respectively, and ph_SINC and po_SINC are the corresponding control groups, respectively.
Table 3. The number of DEGs.
GroupNum. of DEGNum. of Sig. UpNum. of Sig. Down
ph_OE vs. ph_OENC1099724375
po_OE vs. po_OENC591373128
ph_SI vs. ph_SINC224102122
po_SI vs. po_SINC1617091
Note: ph_OE and po_OE are the abbreviations of the FASN-overexpressed phGCs and hGCs, respectively, and ph_OENC and po_OENC are the corresponding control groups, respectively. ph_SI and po_SI are the abbreviations of the FASN-interfered phGCs and hGCs, respectively, and ph_SINC and po_SINC are the corresponding control groups, respectively.
Table 4. The grouping situation in this study.
GroupExperimental GroupControl Group
ph_OE vs. ph_OENCphGCs transfected with pEGFP-N1-FASNphGCs transfected with pEGFP-N1
po_OE vs. po_OENChGCs transfected with pEGFP-N1-FASNhGCs transfected with pEGFP-N1
ph_SI vs. ph_SINCphGCs transfected with siRNA-FASNphGCs transfected with siRNA-NC
po_SI vs. po_SINChGCs transfected with siRNA-FASNhGCs transfected with siRNA-NC
Note: ph_OE and po_OE are the abbreviations of the FASN-overexpressed phGCs and hGCs, respectively, and ph_OENC and po_OENC are the corresponding control groups, respectively. ph_SI and po_SI are the abbreviations of the FASN-interfered phGCs and hGCs, respectively, and ph_SINC and po_SINC are the corresponding control groups, respectively.
Table 5. Primers for qRT-PCR.
GenesAccessionNumberPrimer (5′-3′)Tm (°C)Size (bp)
TLR3KC292270.1F:CCCCCAGACTGAAGGAGGTAR:TGACATTGCTTTCCGACCGA63129
EIF2AK2XM_013170695.1F:GACCTCACCATGTGGACCAGR:CTTCTTTTGCAGCGGCTTGT63227
FADDXM_013194898.1F:ACCATGGACCCGTTTCTGACR:AGGAAGTTGAAGAGCTCCGC63149
IKBKEXM_013189616.1F:GGAGCATCGAGTGGAGCTAC R:TCGAACCCCCAGCATTTCTC65124
IRF7XM_013174398.1F:CAGCAGCGACATCGAGATCTR:TCGCTGTTCTTGGAGTGGTC63156
BIDXM_013172977.1F:CGAGAGAAGGCCATGTTGGTR:GCTGGAGATCTCTCACTCGC63162
BIRC2XM_013178135.1F:CTCTGGTACCTGGAGCTCCT R:AGAATGGACTCACTGCTGGC63179
MAP3K8XM_013191750.1F:ATTCCTCGGGGAGCTTTTGGR:GATGGATCGTCTCGTCCCAC63184
STAT1XM_013187488.1F:GGATCTCAAAACGAGCCCCAR:ATGTAGCCGTTTCCCTTGGG63245
TNFAIP3XM_013175520.1F:GACAGCCCGAAAGAACAGGAR:CACAGCTCCTCACTTCTGCA63107
AGTXM_048045900.1F:AAACAGGGATGAGGAGCTGCR:TGGCCTCCACAAAGGTGTTT63182
HMOX1XM_013181078.2F:GGAGGAGGCCAAGAAAGCATR:GCCTTTGACTGCACAAGGTG63105
β-actin *M26111.1F:CAACGAGCGGTTCAGGTGTR:TGGAGTTGAAGGTGGTCTCG60170
Note: F: sense primers; R: antisense primers. * House-keeping gene for data normalization.
Publisher’s Note: MDPI stays neutral with regard to jurisdictional claims in published maps and institutional affiliations.

