
Quasispecies Fitness Partition to Characterize the Molecular Status of a Viral Population. Negative Effect of Early Ribavirin Discontinuation in a Chronically Infected HEV Patient

 ,
,  , ,
, ,  ,
,  , , , , and
Abstract
:1. Introduction
2. Results
3. Discussion
4. Materials and Methods
4.1. Samples
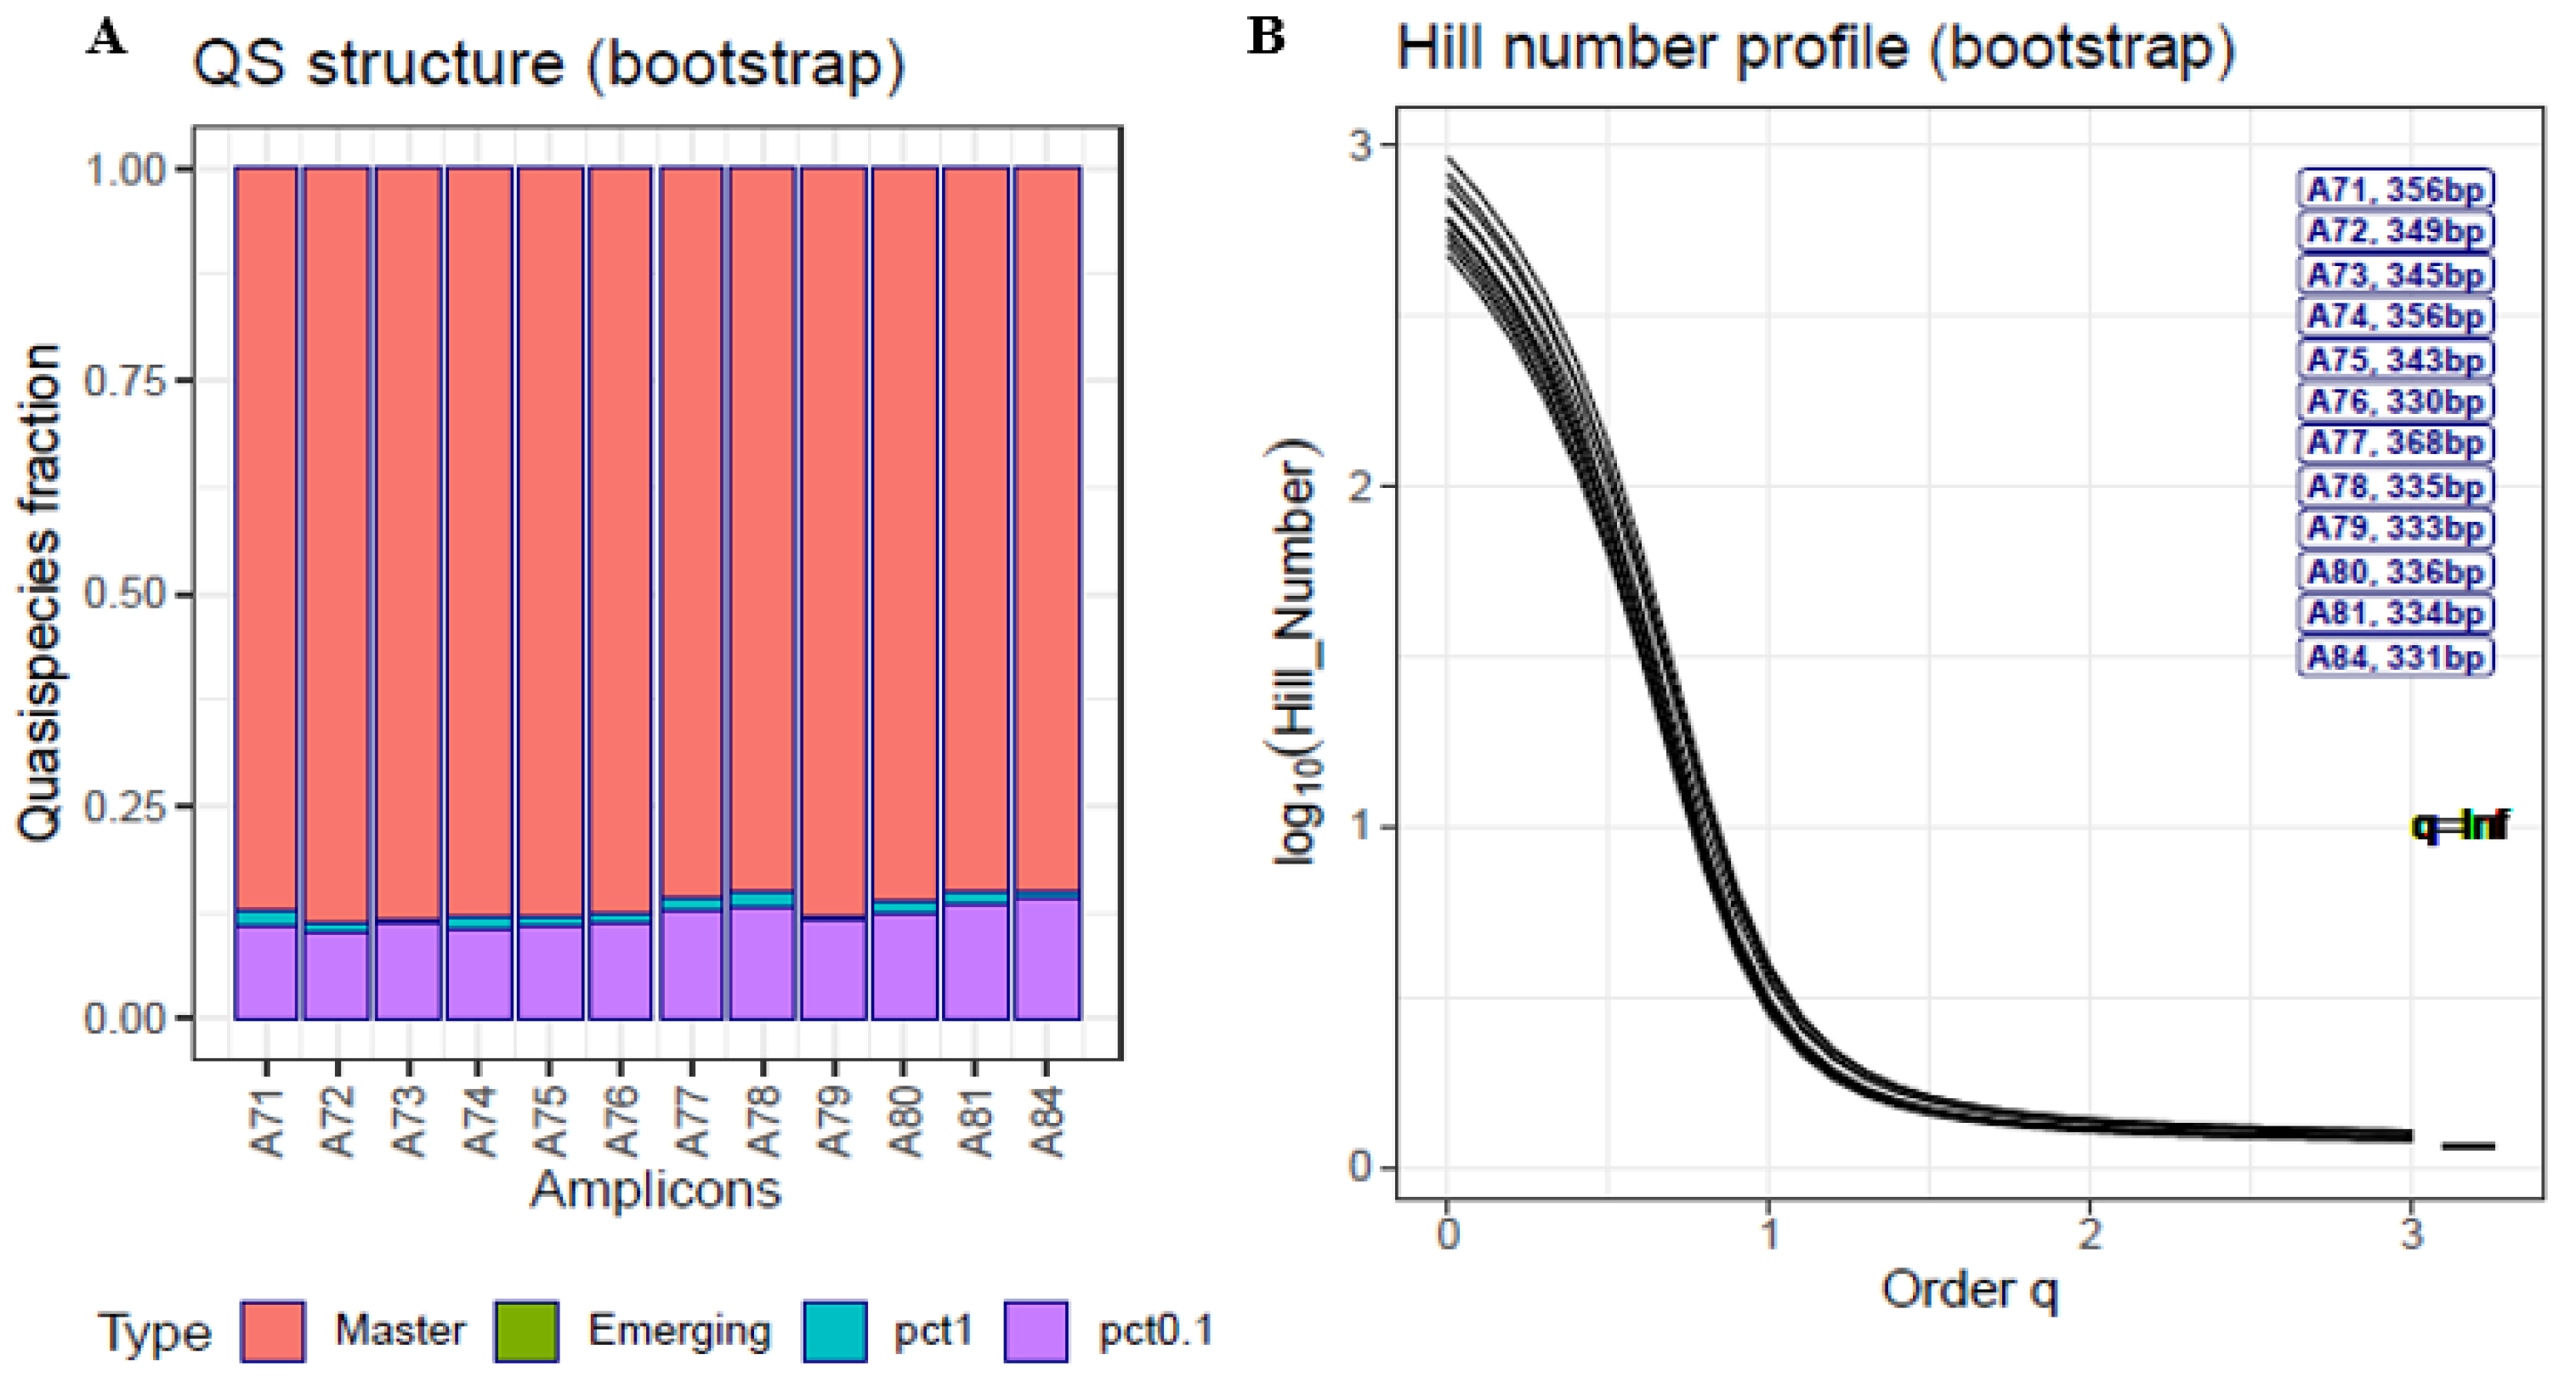
- A technical clone of the SARS-CoV-2 S gene (Twist Synthetic SARS-CoV-2 RNA Control 2 MN908947.3, TWIST Biosciences, South San Francisco, CA, USA) sequenced in 12 amplicons [17]. Commercial Twist Synthetic SARS-CoV-2 RNA controls consist of six non-overlapping 5-Kb fragments generated from in vitro transcription of gene fragments. The synthetic controls were diluted at 1:10 to a concentration of 1 × 10⁵ copies per microliter, PCR-amplified following the Sub-ARTIC v3 protocol [41] using a set of 28 primers (A71 to A84) covering the full S gene, and sequenced on a MiSeq Illumina system [42]. The haplotypes and corresponding frequencies in this analysis included all haplotypes common to both DNA strands after a previous filter at 2 reads. That is, at a minimum of 2 + 2 reads.
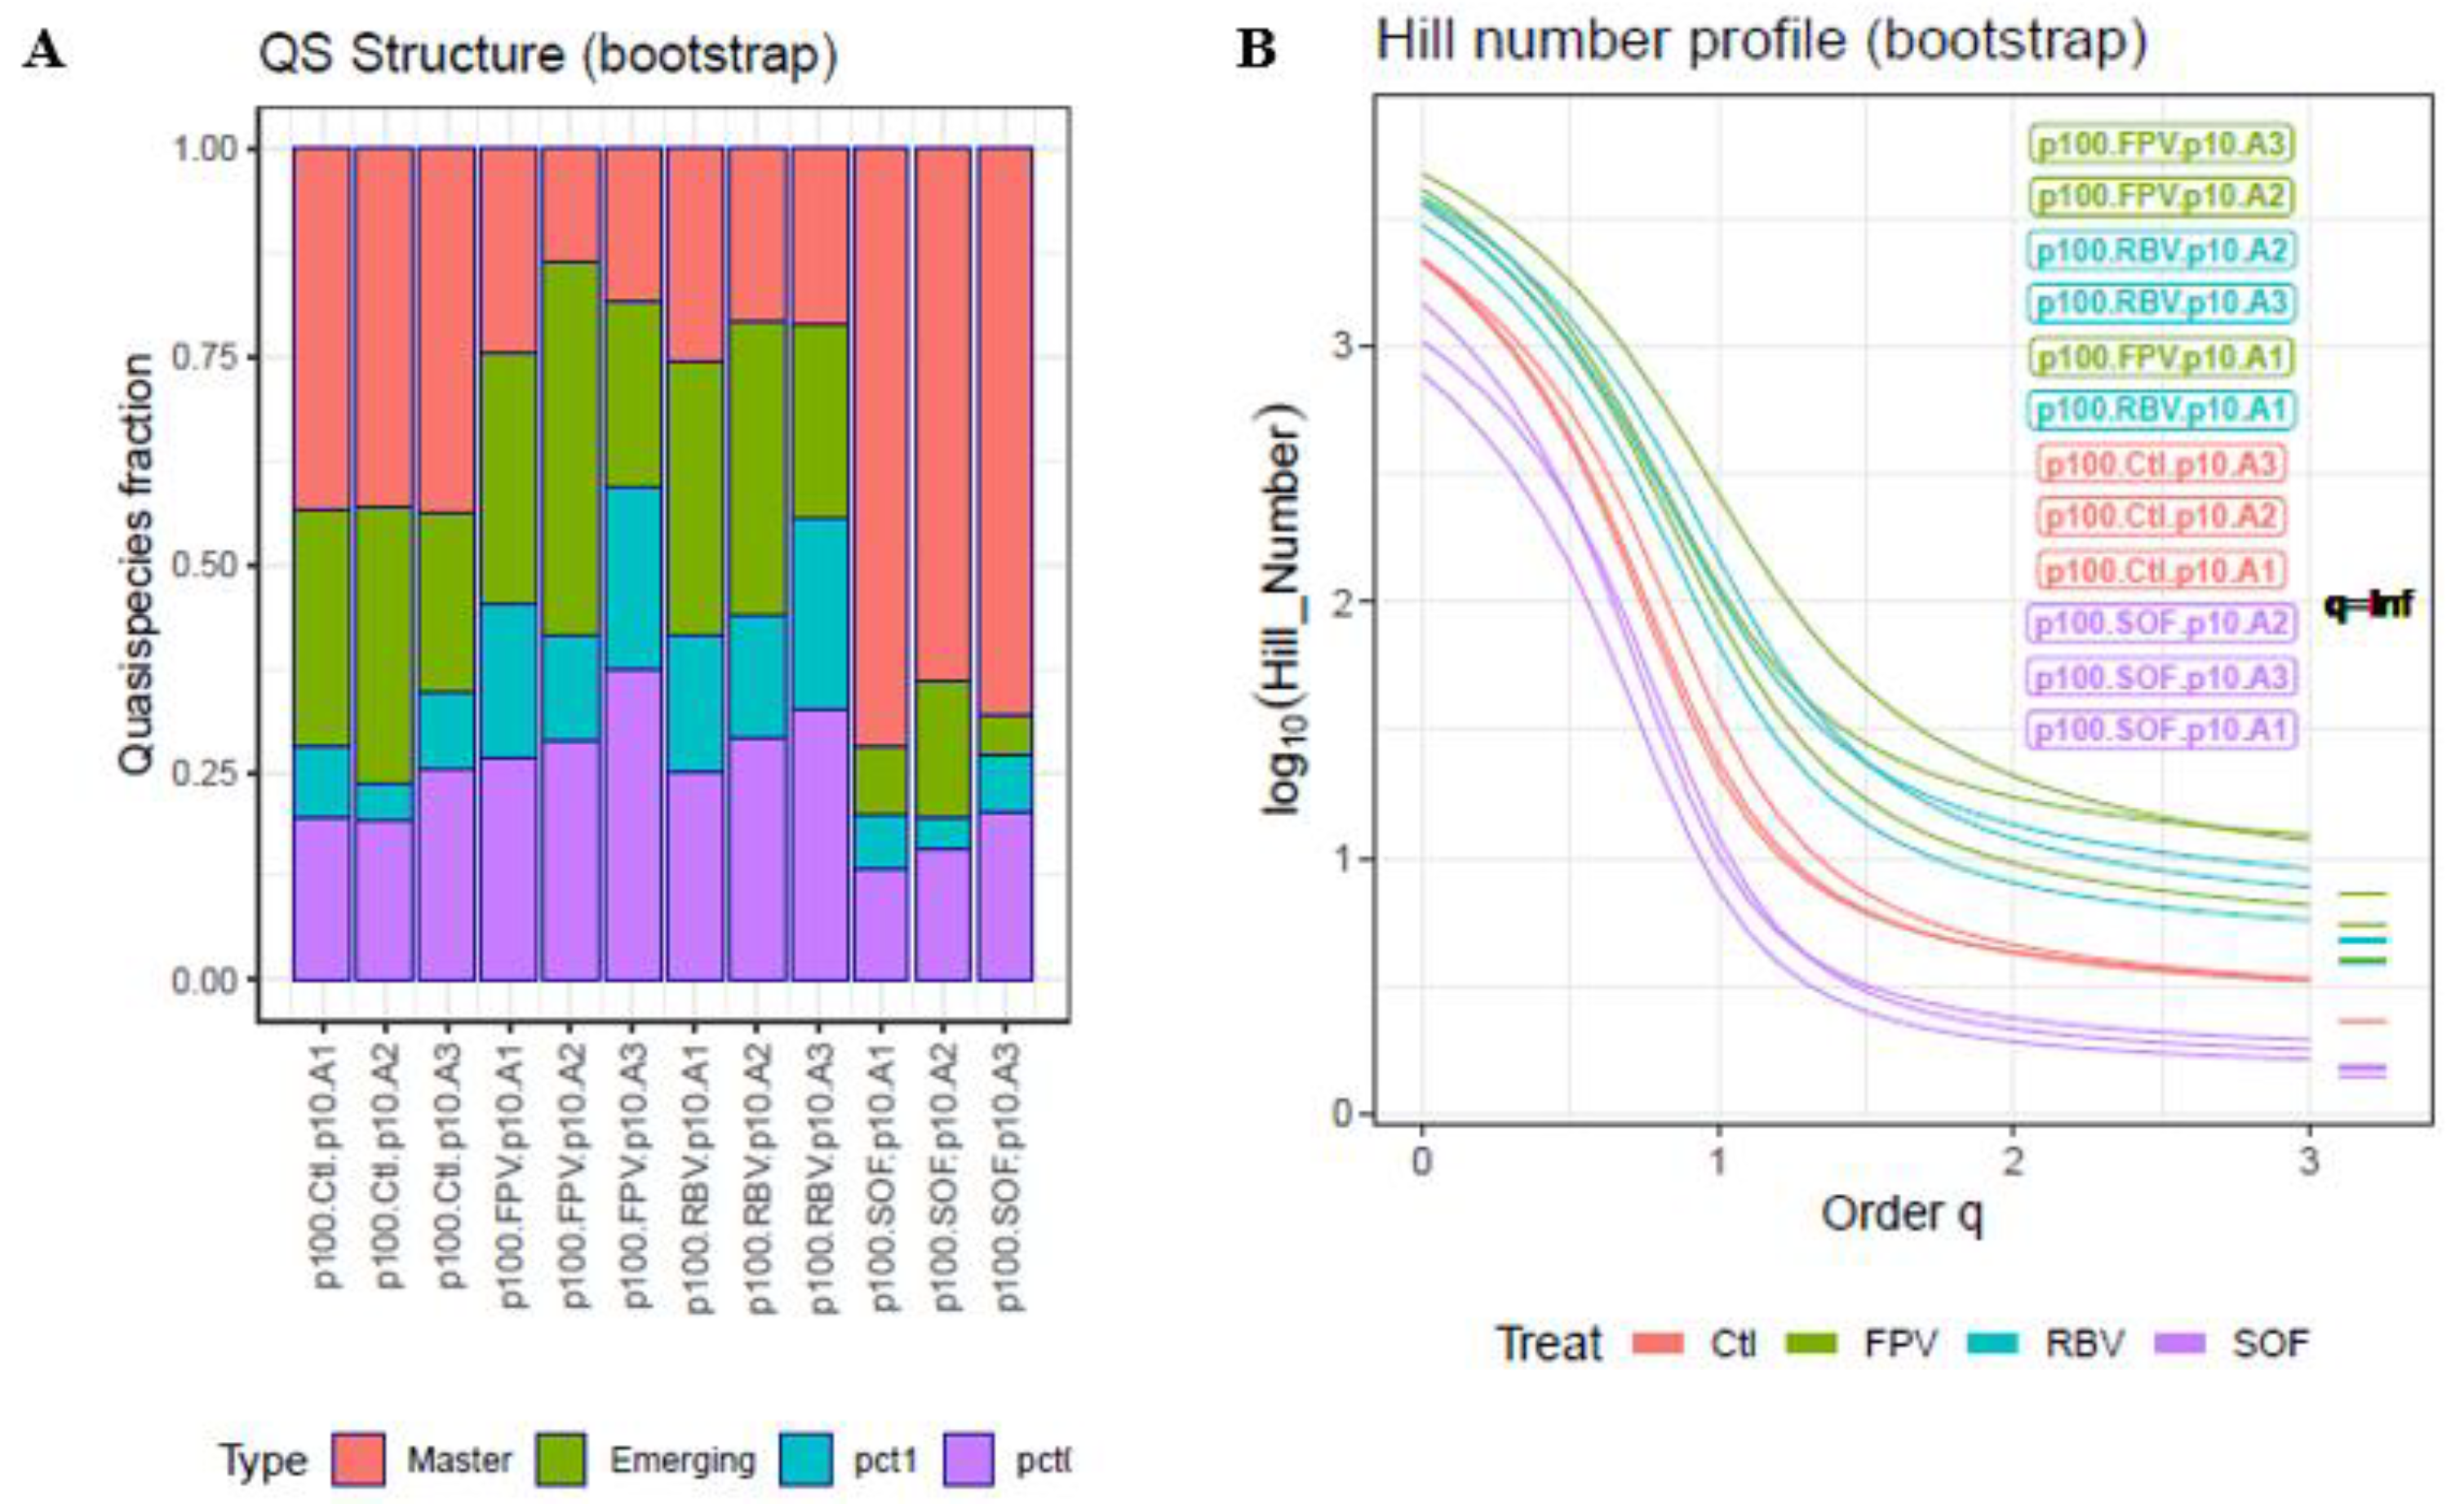
- Three HCV amplicons from samples taken from a controlled experiment, in which HCV-infected human hepatoma cells were observed in the presence or absence of RBV, favipiravir, or sofosbuvir [43,44]. Briefly, HCV p0 was the parental viral population obtained by electroporation of a transcript of plasmid Jc1FLAG2(p7-nsGluc2A) (a chimera of J6 and JFH-1, genotype 2a) [45] into Huh-7.5-Lunet cells and amplification in Huh-7.5 cells [46]. HCV p100 resulted from passaging the HCV p0 population 100 times in Huh-7.5 reporter cells [47]. HCV p100 was subsequently passaged 10 additional times in the presence of favipiravir (T-705) (Atomax Chemicals Co., Ltd., Shenzhen, China), RBV (Sigma, Kawasaki, Japan), or sofosbuvir. Drug concentrations were adjusted to produce comparable inhibition of HCV p0 progeny production. The amplicons sequenced covered the following HCV genomic regions: A1, spanning genomic residues 7626 to 7962; A2, residues 7941 to 8257; and A3, residues 8229 to 8653. The haplotypes and corresponding frequencies in this analysis included all haplotypes common to both strands, with no previous abundance filter; that is, a minimum of 1 + 1 reads.
4.2. Processing the Sequencing Data
- Obtain Fastq files with Illumina 2 × 300-bp paired-end reads;
- Recover full amplicon reads with FLASH [48] (min. 20-bp overlap, max. 10% mismatches). The 300-bp reads, when overlapped, result in reads covering complete ~400–500 bp amplicons;
- Remove full reads with 5% or more bases below a Phred score of Q30;
- Demultiplex and trim primers (max three differences accepted);
- Collapse reads (molecules) to haplotypes (amplicon-genomes) and their frequencies. The frequencies were calculated per haplotype of each amplicon;
- In certain cases, remove all haplotypes below a fixed frequency threshold;
- Remove all haplotypes that are not common to both DNA strands.
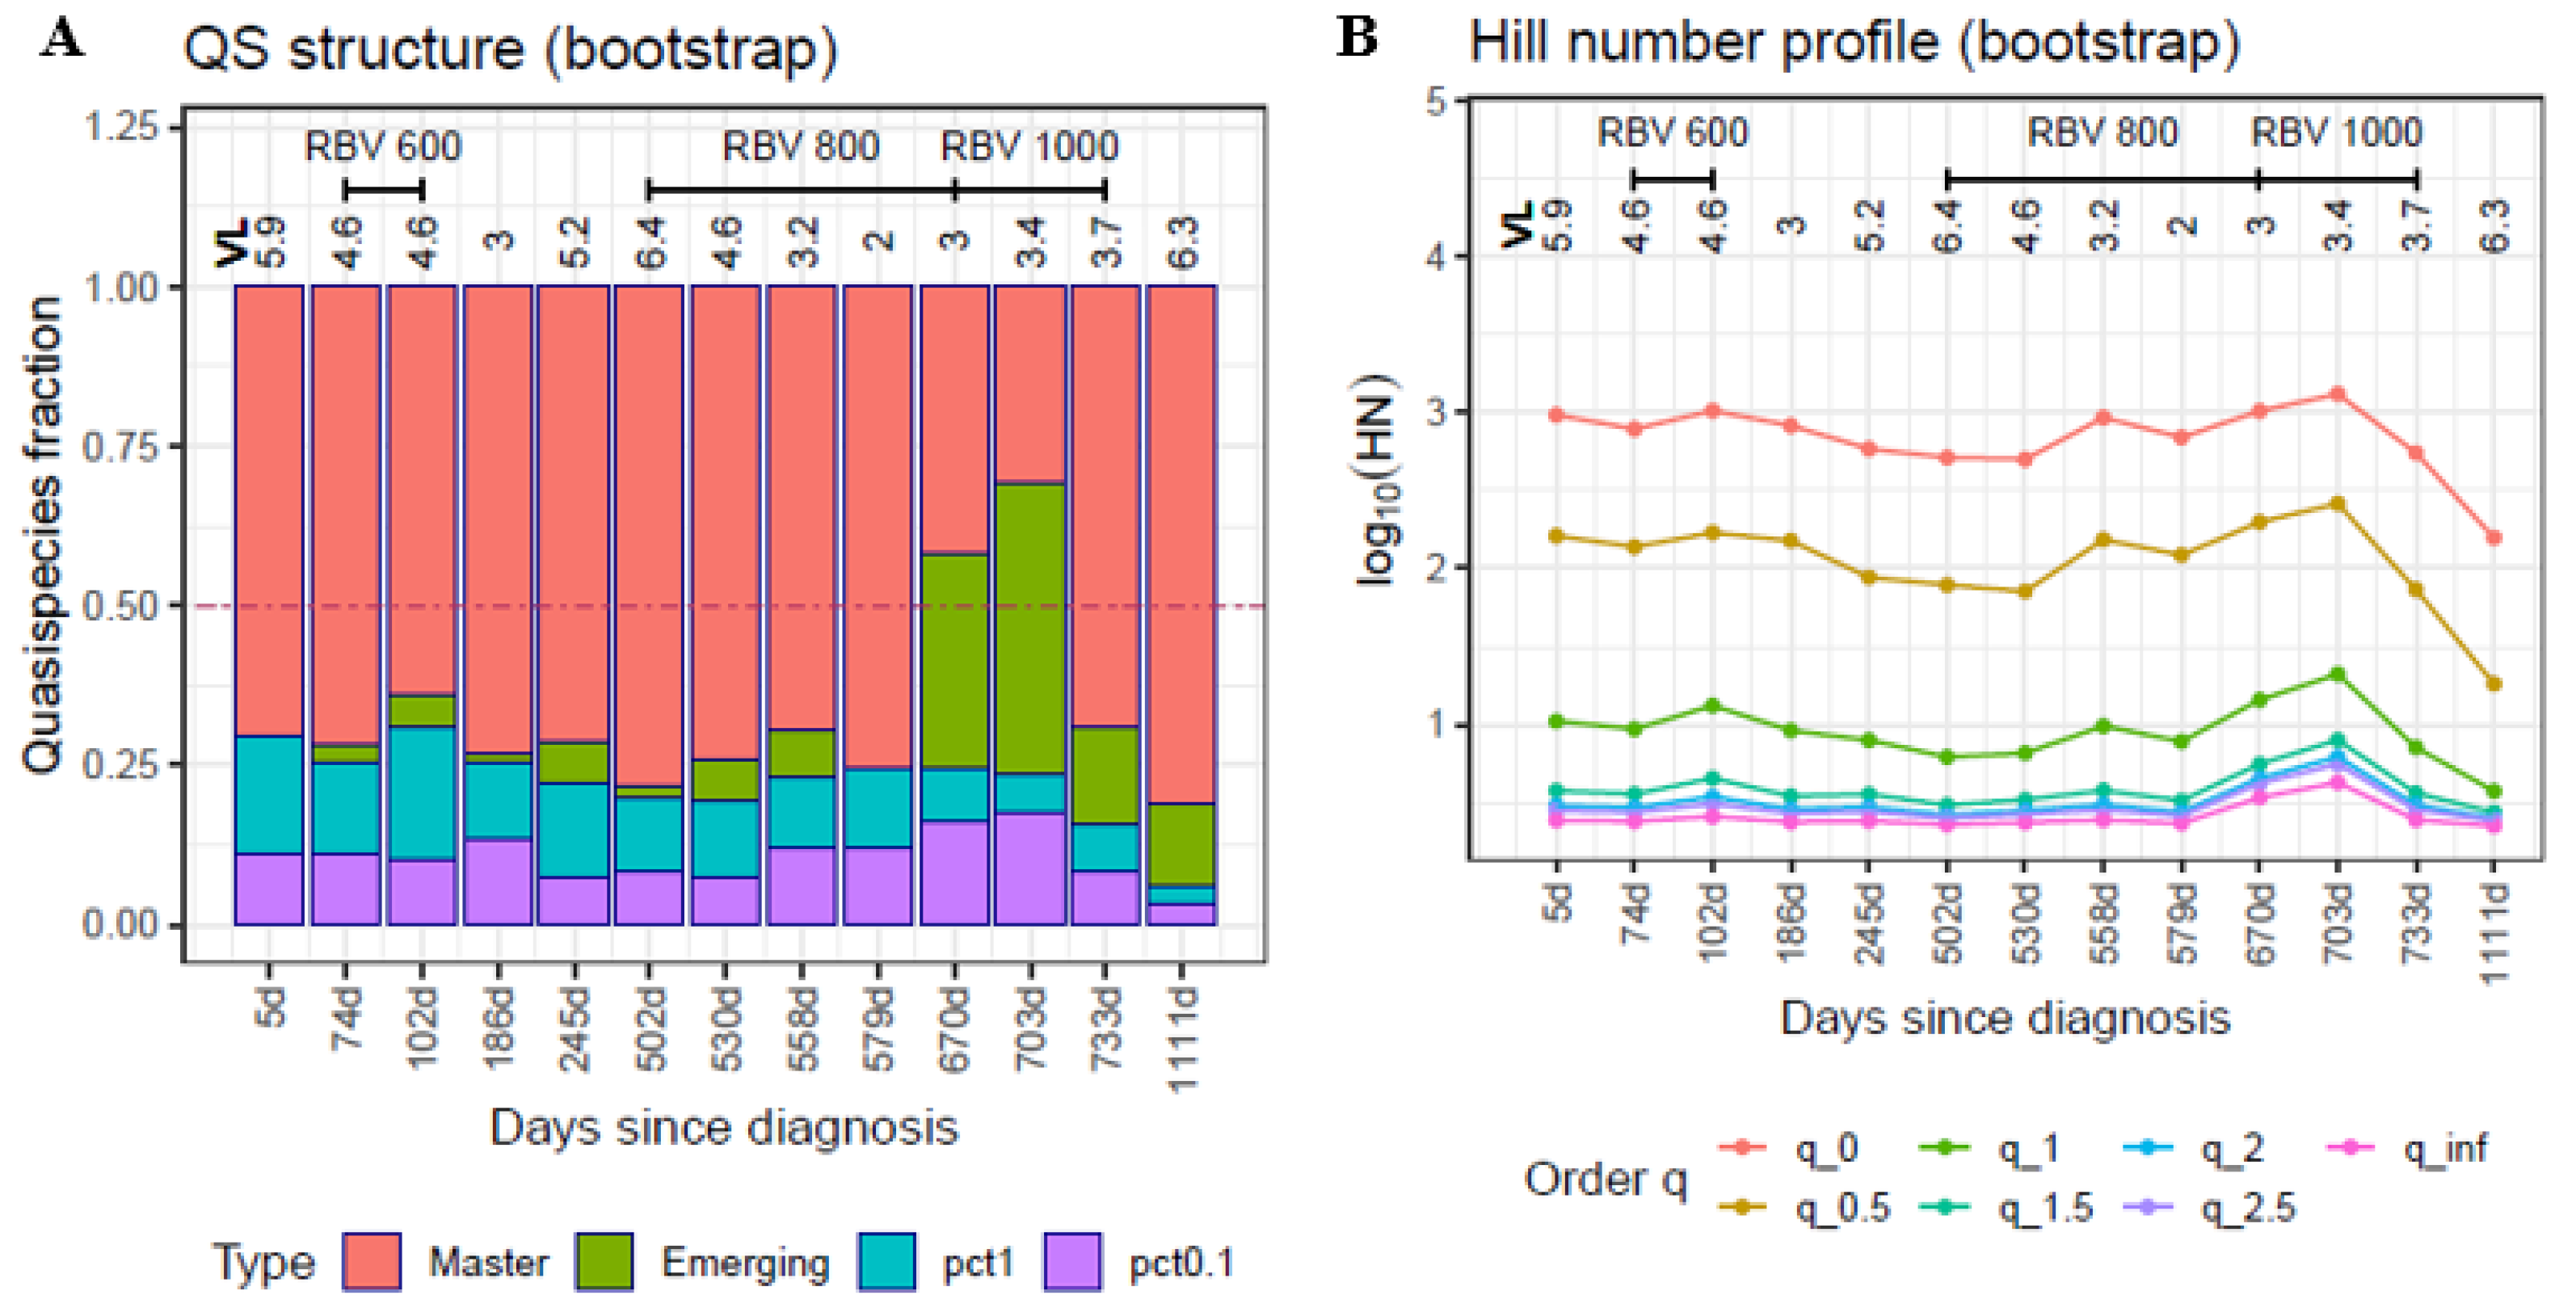
4.3. Quasispecies Fitness Partitions
- Master: the fraction of molecules belonging to the most frequent haplotype; that is, the one present at the highest percentage (p′1 = p1);
- Emerging: the fraction of molecules present at a frequency > 0.1% and less than the master percentage, belonging to haplotypes that are able to compete with the predominant one and possibly replace it (p′2);
- Low fitness: the fraction of molecules present at frequencies from 1% to 0.1%, belonging to haplotypes that have a low probability of progressing to higher frequencies (p′3);
- Very low fitness: the fraction of molecules present at frequencies < 0.1% belonging to haplotypes with very low fitness and to defective genomes. The likely fate of these molecules individually is degradation, but the fraction is continuously fed with new very low fitness genomes produced by replication errors or by host editing activities (p′4).
4.4. Hill Numbers
- At q = 0, the Hill number is the number of haplotypes;
- at q = 1, it corresponds to the exponential of Shannon entropy;
- at q = 2, it is the inverse of the Simpson index; and
- at q = ∞, it is the inverse of the predominant haplotype.
4.5. Abundance Filter Effect on Haplotype Distribution
4.6. Sample Size Dependence
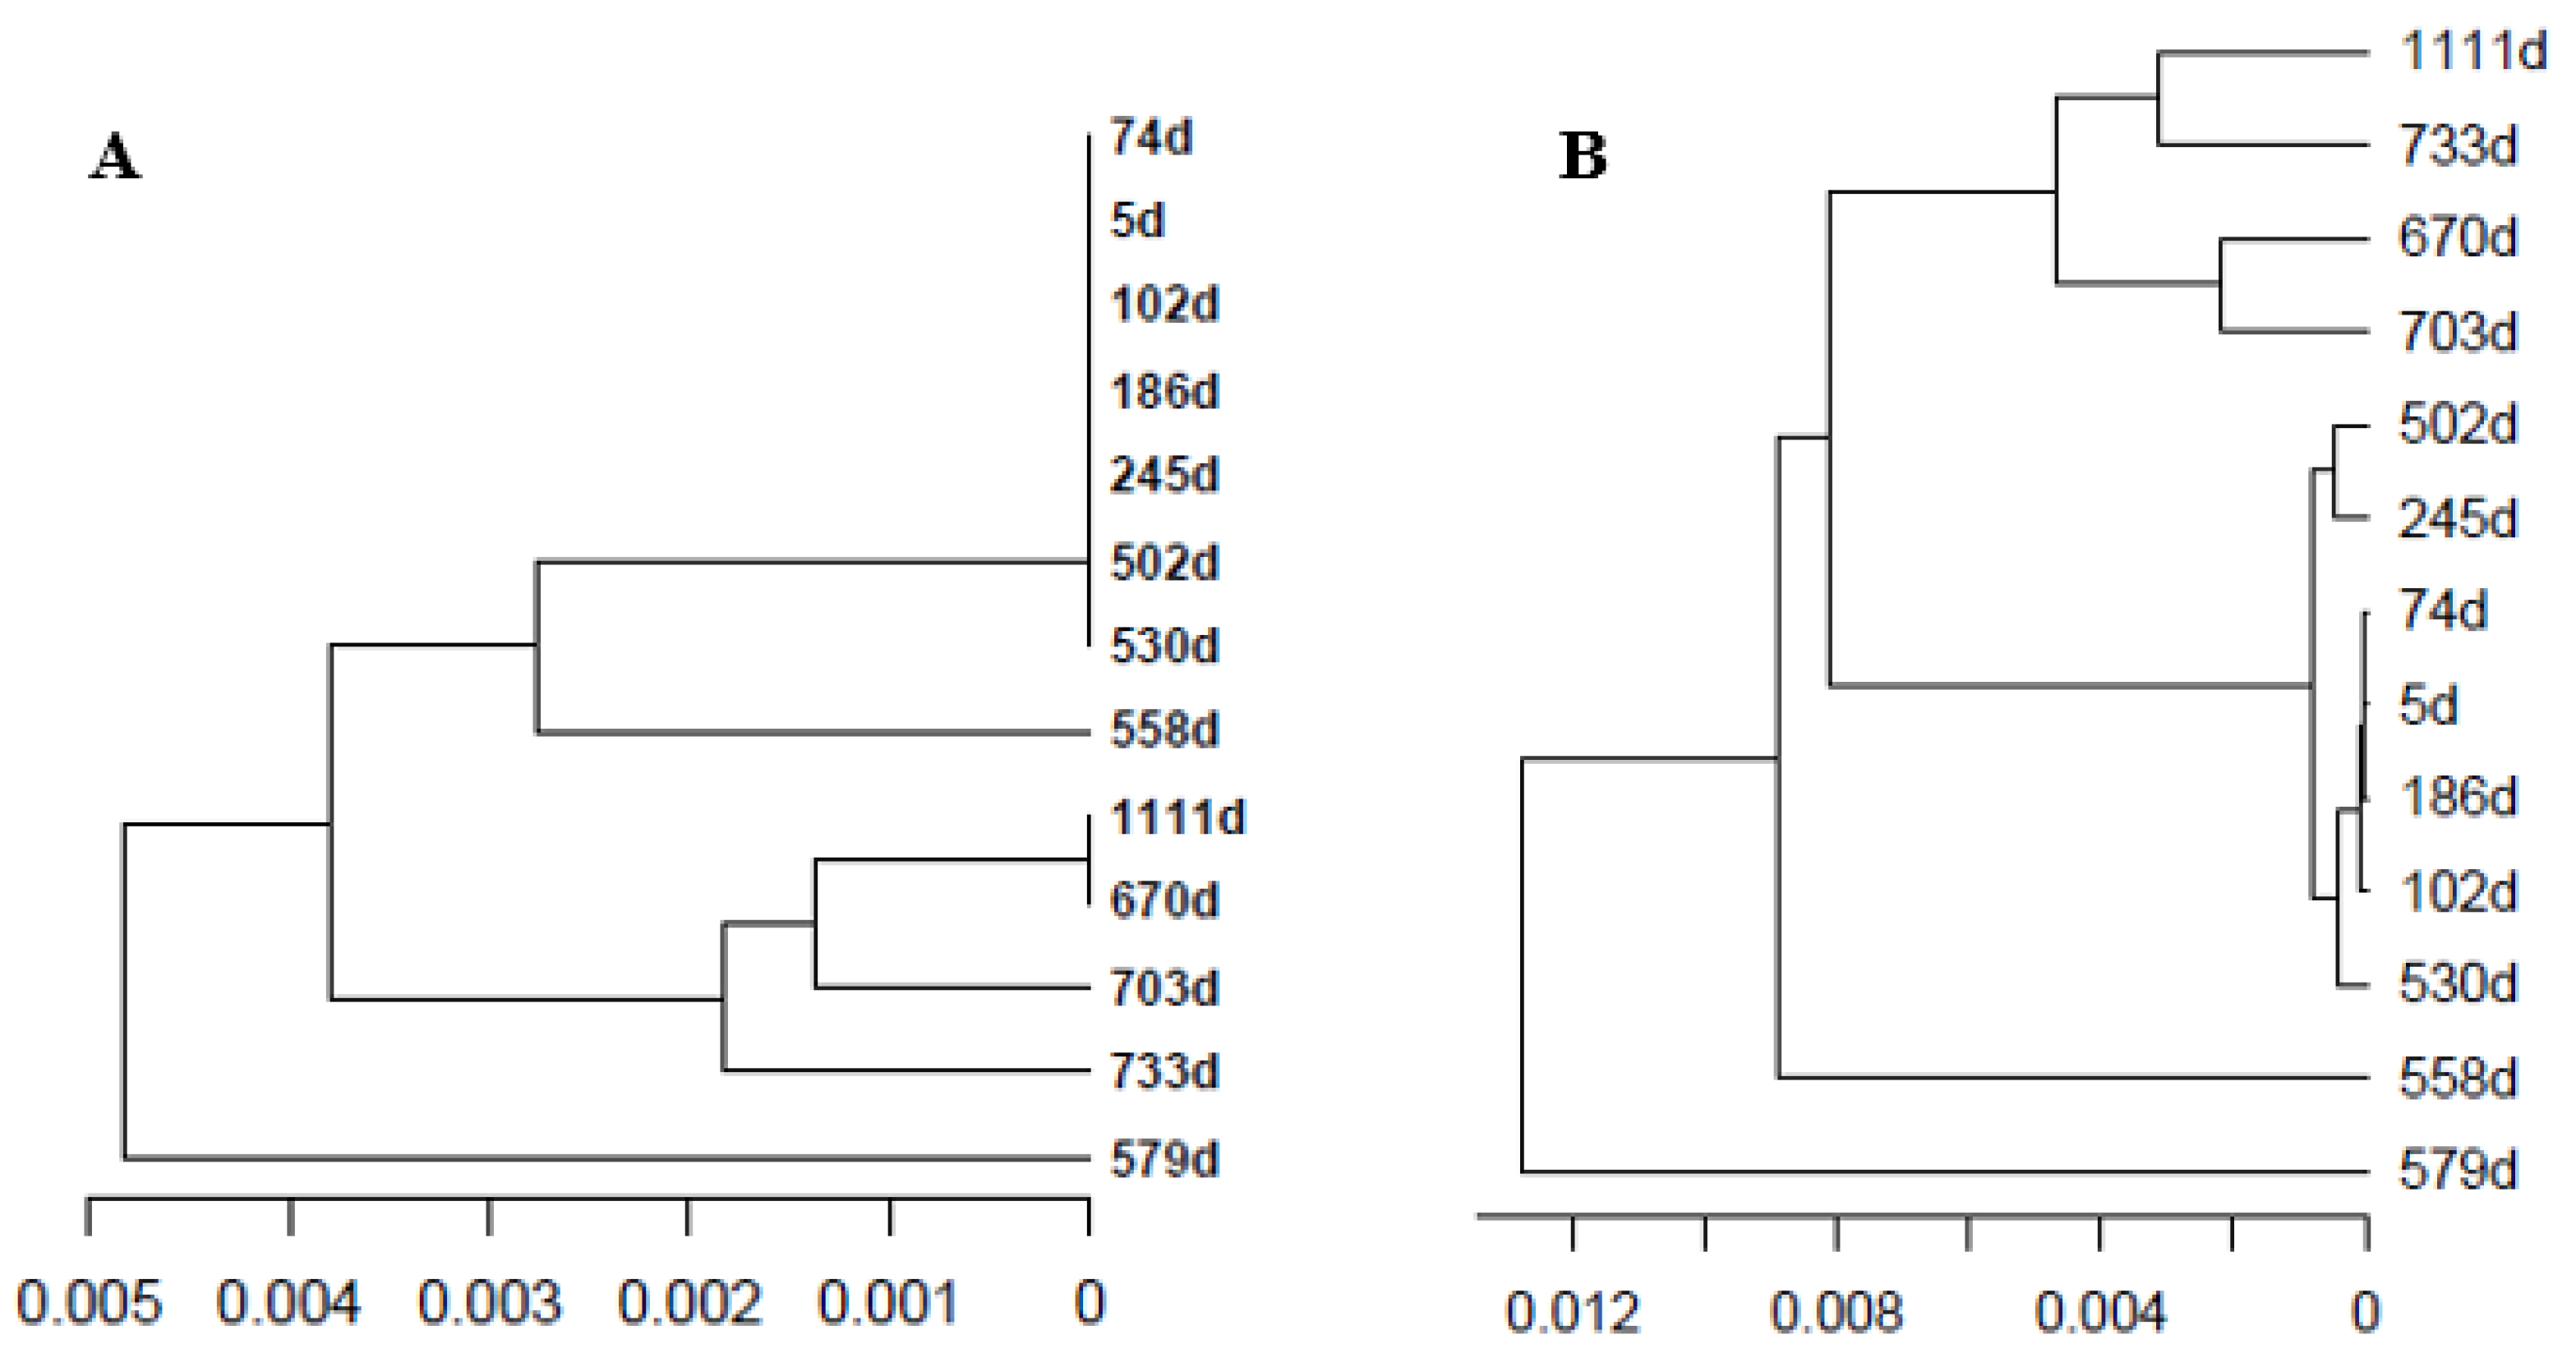
4.7. Distance between Quasispecies, Quasispecies Dendrograms, and Multidimensional Scale Plots (MDS)
4.8. Software and Statistics
Supplementary Materials
Author Contributions
Funding
Institutional Review Board Statement
Informed Consent Statement
Data Availability Statement
Acknowledgments
Conflicts of Interest
References
- Domingo, E.; Escarmis, C.; Lazaro, E.; Manrubia, S.C. Quasispecies dynamics and RNA virus extinction. Virus Res. 2005, 107, 129–139. [Google Scholar] [CrossRef]
- Domingo, E. Virus as Populations. Composition, Complexity, Dynamics and Biological Implications. In Virus as Populations, 1st ed.; Academic Press: Cambridge, MA, USA; Elsevier: London, UK, 2016; pp. 1–412. [Google Scholar]
- Gregori, J.; Salicru, M.; Domingo, E.; Sanchez, A.; Esteban, J.I.; Rodriguez-Frias, F.; Quer, J. Inference with viral quasispecies diversity indices: Clonal and NGS approaches. Bioinformatics 2014, 30, 1104–1111. [Google Scholar] [CrossRef] [Green Version]
- Gregori, J.; Perales, C.; Rodriguez-Frias, F.; Esteban, J.I.; Quer, J.; Domingo, E. Viral quasispecies complexity measures. Virology 2016, 493, 227–237. [Google Scholar] [CrossRef] [PubMed]
- Vellas, C.; Del Bello, A.; Debard, A.; Steinmeyer, Z.; Tribaudeau, L.; Ranger, N.; Jeanne, N.; Martin-Blondel, G.; Delobel, P.; Kamar, N.; et al. Influence of treatment with neutralizing monoclonal antibodies on the SARS-CoV-2 nasopharyngeal load and quasispecies. Clin. Microbiol. Infect. Off. Publ. Eur. Soc. Clin. Microbiol. Infect. Dis. 2022, 28, 139.e5–139.e8. [Google Scholar] [CrossRef] [PubMed]
- Perales, C.; Martín, V.; Ruiz-Jarabo, C.M.; Domingo, E. Monitoring sequence space as a test for the target of selection in viruses. J. Mol. Biol. 2005, 345, 451–459. [Google Scholar] [CrossRef] [PubMed]
- Gregori, J.; Soria, M.E.; Gallego, I.; Guerrero-Murillo, M.; Esteban, J.I.; Quer, J.; Perales, C.; Domingo, E. Rare haplotype load as marker for lethal mutagenesis. PLoS ONE 2018, 13, e0204877. [Google Scholar] [CrossRef]
- Perales, C.; Gallego, I.; de Ávila, A.I.; Soria, M.E.; Gregori, J.; Quer, J.; Domingo, E. The increasing impact of lethal mutagenesis of viruses. Future Med. Chem. 2019, 11, 1645–1657. [Google Scholar] [CrossRef]
- Nakano, K.; Shiroma, A.; Shimoji, M.; Tamotsu, H.; Ashimine, N.; Ohki, S.; Shinzato, M.; Minami, M.; Nakanishi, T.; Teruya, K.; et al. Advantages of genome sequencing by long-read sequencer using SMRT technology in medical area. Hum. Cell 2017, 30, 149–161. [Google Scholar] [CrossRef] [Green Version]
- Bull, R.A.; Eltahla, A.A.; Rodrigo, C.; Koekkoek, S.M.; Walker, M.; Pirozyan, M.R.; Betz-Stablein, B.; Toepfer, A.; Laird, M.; Oh, S.; et al. A method for near full-length amplification and sequencing for six hepatitis C virus genotypes. BMC Genom. 2016, 17, 247. [Google Scholar] [CrossRef] [PubMed] [Green Version]
- Dilernia, D.A.; Chien, J.T.; Monaco, D.C.; Brown, M.P.S.; Ende, Z.; Deymier, M.J.; Yue, L.; Paxinos, E.E.; Allen, S.; Tirado-Ramos, A.; et al. Multiplexed highly-accurate DNA sequencing of closely-related HIV-1 variants using continuous long reads from single molecule, real-time sequencing. Nucleic Acids Res. 2015, 43, e129. [Google Scholar] [CrossRef] [PubMed]
- Stoler, N.; Nekrutenko, A. Sequencing error profiles of Illumina sequencing instruments. NAR Genom. Bioinforma. 2021, 3, lqab019. [Google Scholar] [CrossRef]
- Amarasinghe, S.L.; Su, S.; Dong, X.; Zappia, L.; Ritchie, M.E.; Gouil, Q. Opportunities and challenges in long-read sequencing data analysis. Genome Biol. 2020, 21, 30. [Google Scholar] [CrossRef] [Green Version]
- Wenger, A.M.; Peluso, P.; Rowell, W.J.; Chang, P.C.; Hall, R.J.; Concepcion, G.T.; Ebler, J.; Fungtammasan, A.; Kolesnikov, A.; Olson, N.D.; et al. Accurate circular consensus long-read sequencing improves variant detection and assembly of a human genome. Nat. Biotechnol. 2019, 37, 1155–1162. [Google Scholar] [CrossRef] [PubMed]
- Hill, M.O. Diversity and Evenness: A Unifying Notation and Its Consequences. Ecology 1973, 54, 427–432. [Google Scholar] [CrossRef] [Green Version]
- Carcereny, A.; Martínez-Velázquez, A.; Bosch, A.; Allende, A.; Truchado, P.; Cascales, J.; Romalde, J.L.; Lois, M.; Polo, D.; Sánchez, G.; et al. Monitoring Emergence of the SARS-CoV-2 B.1.1.7 Variant through the Spanish National SARS-CoV-2 Wastewater Surveillance System (VATar COVID-19). Environ. Sci. Technol. 2021, 55, 11756–11766. [Google Scholar] [CrossRef]
- Twist Synthetic SARS-CoV-2 RNA Control 2 MN908947.3. Available online: https://www.twistbioscience.com/es/resources/product-sheet/twist-synthetic-sars-cov-2-rna-controls (accessed on 12 November 2022).
- Cubero, M.; Gregori, J.; Esteban, J.I.; Garcia-Cehic, D.; Bes, M.; Perales, C.; Domingo, E.; Rodriguez-Frias, F.; Sauleda, S.; Casillas, R.; et al. Identification of host and viral factors involved in a dissimilar resolution of a hepatitis C virus infection. Liver Int. 2014, 34, 896–906. [Google Scholar] [CrossRef] [PubMed]
- Baccam, P.; Thompson, R.J.; Fedrigo, O.; Carpenter, S.; Cornette, J.L. PAQ: Partition Analysis of Quasispecies. Bioinformatics 2001, 17, 16–22. [Google Scholar] [CrossRef] [PubMed] [Green Version]
- Töpfer, A.; Marschall, T.; Bull, R.A.; Luciani, F.; Schönhuth, A.; Beerenwinkel, N. Viral quasispecies assembly via maximal clique enumeration. PLoS Comput. Biol. 2014, 10, e1003515. [Google Scholar] [CrossRef]
- Skums, P.; Zelikovsky, A.; Singh, R.; Gussler, W.; Dimitrova, Z.; Knyazev, S.; Mandric, I.; Ramachandran, S.; Campo, D.; Jha, D.; et al. QUENTIN: Reconstruction of disease transmissions from viral quasispecies genomic data. Bioinformatics 2018, 34, 163–170. [Google Scholar] [CrossRef] [Green Version]
- Ahn, S.; Ke, Z.; Vikalo, H. Viral quasispecies reconstruction via tensor factorization with successive read removal. Bioinformatics 2018, 34, i23–i31. [Google Scholar] [CrossRef] [PubMed]
- Henningsson, R.; Moratorio, G.; Bordería, A.V.; Vignuzzi, M.; Fontes, M. DISSEQT-DIStribution-based modeling of SEQuence space Time dynamics. Virus Evol. 2019, 5, vez028. [Google Scholar] [CrossRef] [PubMed] [Green Version]
- Beerenwinkel, N.; Zagordi, O. Ultra-deep sequencing for the analysis of viral populations. Curr.Opin.Virol. 2011, 1, 413–418. [Google Scholar] [CrossRef] [PubMed]
- Lorenzo-Redondo, R.; Delgado, S.; Morán, F.; Lopez-Galindez, C. Realistic three dimensional fitness landscapes generated by self organizing maps for the analysis of experimental HIV-1 evolution. PLoS ONE 2014, 9, e88579. [Google Scholar] [CrossRef] [PubMed] [Green Version]
- Delgado, S.; Perales, C.; García-Crespo, C.; Soria, M.E.; Gallego, I.; de Ávila, A.I.; Martínez-González, B.; Vázquez-Sirvent, L.; López-Galíndez, C.; Morán, F.; et al. A Two-Level, Intramutant Spectrum Haplotype Profile of Hepatitis C Virus Revealed by Self-Organized Maps. Microbiol. Spectr. 2021, 9, e0145921. [Google Scholar] [CrossRef] [PubMed]
- Gregori, J.; Cortese, M.F.; Piñana, M.; Campos, C.; Garcia-Cehic, D.; Andrés, C.; Abril, J.F.; Codina, M.G.; Rando, A.; Esperalba, J.; et al. Host-dependent editing of SARS-CoV-2 in COVID-19 patients. Emerg. Microbes Infect. 2021, 10, 1777–1789. [Google Scholar] [CrossRef]
- Martínez-González, B.; Soria, M.E.; Vázquez-Sirvent, L.; Ferrer-Orta, C.; Lobo-Vega, R.; Mínguez, P.; de la Fuente, L.; Llorens, C.; Soriano, B.; Ramos-Ruíz, R.; et al. SARS-CoV-2 Mutant Spectra at Different Depth Levels Reveal an Overwhelming Abundance of Low Frequency Mutations. Pathogens 2022, 11, 662. [Google Scholar] [CrossRef]
- De Avila, A.I.; Gallego, I.; Soria, M.E.; Gregori, J.; Quer, J.; Ignacio Esteban, J.; Rice, C.M.; Domingo, E.; Perales, C. Lethal mutagenesis of hepatitis C virus induced by favipiravir. PLoS ONE 2016, 11, e0164691. [Google Scholar] [CrossRef] [Green Version]
- Perales, C.; Agudo, R.; Tejero, H.; Manrubia, S.C.; Domingo, E. Potential benefits of sequential inhibitor-mutagen treatments of RNA virus infections. PLoS Pathog. 2009, 5, e1000658. [Google Scholar] [CrossRef] [Green Version]
- Githaka, J.M. Molnupiravir Does Not Induce Mutagenesis in Host Lung Cells during SARS-CoV-2 Treatment. Bioinform. Biol. Insights 2022, 16, 11779322221085076. [Google Scholar] [CrossRef]
- Gordon, C.J.; Tchesnokov, E.P.; Schinazi, R.F.; Götte, M. Molnupiravir promotes SARS-CoV-2 mutagenesis via the RNA template. J. Biol. Chem. 2021, 297, 100770. [Google Scholar] [CrossRef] [PubMed]
- Cameron, C.E.; Castro, C. The mechanism of action of ribavirin: Lethal mutagenesis of RNA virus genomes mediated by the viral RNA-dependent RNA polymerase. Curr. Opin. Infect. Dis. 2001, 14, 757–764. [Google Scholar] [CrossRef] [PubMed]
- Dietz, J.; Schelhorn, S.-E.; Fitting, D.; Mihm, U.; Susser, S.; Welker, M.-W.; Füller, C.; Däumer, M.; Teuber, G.; Wedemeyer, H.; et al. Deep sequencing reveals mutagenic effects of ribavirin during monotherapy of hepatitis C virus genotype 1-infected patients. J. Virol. 2013, 87, 6172–6181. [Google Scholar] [CrossRef] [Green Version]
- Cuevas, J.M.; González-Candelas, F.; Moya, A.; Sanjuán, R. Effect of ribavirin on the mutation rate and spectrum of hepatitis C virus in vivo. J. Virol. 2009, 83, 5760–5764. [Google Scholar] [CrossRef] [Green Version]
- Todt, D.; Meister, T.L.; Steinmann, E. Hepatitis E virus treatment and ribavirin therapy: Viral mechanisms of nonresponse. Curr. Opin. Virol. 2018, 32, 80–87. [Google Scholar] [CrossRef]
- Todt, D.; Gisa, A.; Radonic, A.; Nitsche, A.; Behrendt, P.; Suneetha, P.V.; Pischke, S.; Bremer, B.; Brown, R.J.P.; Manns, M.P.; et al. In vivo evidence for ribavirin-induced mutagenesis of the hepatitis E virus genome. Gut 2016, 65, 1733–1743. [Google Scholar] [CrossRef] [Green Version]
- Debing, Y.; Gisa, A.; Dallmeier, K.; Pischke, S.; Bremer, B.; Manns, M.; Wedemeyer, H.; Suneetha, P.V.; Neyts, J. A mutation in the hepatitis E virus RNA polymerase promotes its replication and associates with ribavirin treatment failure in organ transplant recipients. Gastroenterology 2014, 147, 1006–1008. [Google Scholar] [CrossRef] [PubMed]
- Lhomme, S.; Kamar, N.; Nicot, F.; Ducos, J.; Bismuth, M.; Garrigue, V.; Petitjean-Lecherbonnier, J.; Ollivier, I.; Alessandri-Gradt, E.; Goria, O.; et al. Mutation in the Hepatitis E Virus Polymerase and Outcome of Ribavirin Therapy. Antimicrob. Agents Chemother. 2015, 60, 1608–1614. [Google Scholar] [CrossRef] [Green Version]
- Debing, Y.; Ramière, C.; Dallmeier, K.; Piorkowski, G.; Trabaud, M.-A.; Lebossé, F.; Scholtès, C.; Roche, M.; Legras-Lachuer, C.; de Lamballerie, X.; et al. Hepatitis E virus mutations associated with ribavirin treatment failure result in altered viral fitness and ribavirin sensitivity. J. Hepatol. 2016, 65, 499–508. [Google Scholar] [CrossRef] [PubMed]
- ARTIC Network. Available online: https://artic.network/ncov-2019 (accessed on 12 November 2022).
- Andrés, C.; Garcia-Cehic, D.; Gregori, J.; Piñana, M.; Rodriguez-Frias, F.; Guerrero-Murillo, M.; Esperalba, J.; Rando, A.; Goterris, L.; Codina, M.G.; et al. Naturally occurring SARS-CoV-2 gene deletions close to the spike S1/S2 cleavage site in the viral quasispecies of COVID19 patients. Emerg. Microbes Infect. 2020, 9, 1900–1911. [Google Scholar] [CrossRef]
- Gallego, I.; Gregori, J.; Soria, M.E.; Garcia-Crespo, C.; Garcia-Alvarez, M.; Gomez-Gonzalez, A.; Valiergue, R.; Gomez, J.; Esteban, J.I.; Quer, J.; et al. Resistance of high fitness hepatitis C virus to lethal mutagenesis. Virology 2018, 523, 100–109. [Google Scholar] [CrossRef]
- Gallego, I.; Sheldon, J.; Moreno, E.; Gregori, J.; Quer, J.; Esteban, J.I.; Rice, C.M.; Domingo, E.; Perales, C. Barrier-independent, fitness-associated differences in sofosbuvir efficacy against hepatitis c virus. Antimicrob. Agents Chemother. 2016, 60, 3786–3793. [Google Scholar] [CrossRef] [Green Version]
- Marukian, S.; Jones, C.T.; Andrus, L.; Evans, M.J.; Ritola, K.D.; Charles, E.D.; Rice, C.M.; Dustin, L.B. Cell culture-produced hepatitis C virus does not infect peripheral blood mononuclear cells. Hepatology 2008, 48, 1843–1850. [Google Scholar] [CrossRef] [PubMed] [Green Version]
- Perales, C.; Beach, N.M.; Gallego, I.; Soria, M.E.; Quer, J.; Esteban, J.I.; Rice, C.; Domingo, E.; Sheldon, J. Response of hepatitis C virus to long-term passage in the presence of alpha interferon: Multiple mutations and a common phenotype. J. Virol. 2013, 87, 7593–7607. [Google Scholar] [CrossRef] [PubMed] [Green Version]
- Moreno, E.; Gallego, I.; Gregori, J.; Lucía-Sanz, A.; Soria, M.E.; Castro, V.; Beach, N.M.; Manrubia, S.; Quer, J.; Esteban, J.I.; et al. Internal Disequilibria and Phenotypic Diversification during Replication of Hepatitis C Virus in a Noncoevolving Cellular Environment. J. Virol. 2017, 91, e02505-16. [Google Scholar] [CrossRef] [PubMed] [Green Version]
- Magoc, T.; Salzberg, S.L. FLASH: Fast length adjustment of short reads to improve genome assemblies. Bioinformatics 2011, 27, 2957–2963. [Google Scholar] [CrossRef] [Green Version]
- Chao, A.; Gotelli, N.J.; Hsieh, T.C.; Sander, E.L.; Ma, K.H.; Colwell, R.K.; Ellison, A.M. Rarefaction and extrapolation with Hill numbers: A framework for sampling and estimation in species diversity studies. Ecol. Monogr. 2014, 84, 45–67. [Google Scholar] [CrossRef] [Green Version]
- Gregori, J.; Esteban, J.I.; Cubero, M.; Garcia-Cehic, D.; Perales, C.; Casillas, R.; Alvarez-Tejado, M.; Rodriguez-Frias, F.; Guardia, J.; Domingo, E.; et al. Ultra-deep pyrosequencing (UDPS) data treatment to study amplicon HCV minor variants. PLoS ONE 2013, 8, e0083361. [Google Scholar] [CrossRef] [PubMed]
- Nei, M. Molecular Evolutionary Genetics; Columbia University Press: New York, NY, USA, 1987; ISBN 9780231886710. [Google Scholar]
- Grishin, V.N.; Grishin, N. V Euclidian space and grouping of biological objects. Bioinformatics 2002, 18, 1523–1534. [Google Scholar] [CrossRef] [PubMed] [Green Version]
- Fitch, W.M. An improved method of testing for evolutionary homology. J. Mol. Biol. 1966, 16, 9–16. [Google Scholar] [CrossRef] [PubMed]
- Grantham, R. Amino acid difference formula to help explain protein evolution. Science 1974, 185, 862–864. [Google Scholar] [CrossRef]
- Yue, J.C.; Clayton, M.K. A Similarity Measure Based on Species Proportions. Commun. Stat.-Theory Methods 2005, 34, 2123–2131. [Google Scholar] [CrossRef] [Green Version]
- R Core Team. R: A Language and Environment for Statistical Computing; R Foundation for Statistical Computing: Vienna, Austria, 2019. [Google Scholar]
- Pages, H.; Aboyoun, P.; Gentleman, R.; DebRoy, S. Biostrings: String Objects Representing Biological Sequences, and Matching Algorithms, R package 2.38.4; 2012. Available online: https://bioc.ism.ac.jp/packages/3.2/bioc/html/Biostrings.html (accessed on 12 November 2022).
- Morgan, M.; Anders, S.; Lawrence, M.; Aboyoun, P.; Pages, H.; Gentleman, R. ShortRead: A bioconductor package for input, quality assessment and exploration of high-throughput sequence data. Bioinformatics 2009, 25, 2607–2608. [Google Scholar] [CrossRef] [Green Version]
- Guerrero-Murillo, M.; Gregori, J. QSutils: Quasispecies Diversity. R Package Version 1.0.0. Available online: https://bioconductor.org/packages/release/bioc/html/QSutils.html_2018 (accessed on 22 November 2022).
- Gentleman, R.C.; Carey, V.J.; Bates, D.M.; Bolstad, B.; Dettling, M.; Dudoit, S.; Ellis, B.; Gautier, L.; Ge, Y.; Gentry, J.; et al. Bioconductor: Open software development for computational biology and bioinformatics. Genome Biol. 2004, 5, R80. [Google Scholar] [CrossRef] [Green Version]
- Paradis, E.; Schliep, K. ape 5.0: An environment for modern phylogenetics and evolutionary analyses in R. Bioinformatics 2019, 35, 526–528. [Google Scholar] [CrossRef] [PubMed]
- Wickham, H. Welcome to Master the Tidyverse. J. Open Source Softw. 2019, 4. [Google Scholar] [CrossRef] [Green Version]
- Valero-Mora, P.M. ggplot2: Elegant Graphics for Data Analysis. J. Stat. Soft. Book Rev. 2010, 35, 1–3. [Google Scholar] [CrossRef]

| Master | Emerging | RHL_1_0.1 | RHL_0.1 | |
|---|---|---|---|---|
| Control | 0.436 (0.0030) | 0.283 (0.0566) | 0.085 (0.0232) | 0.197 (0.0304) |
| FPV | 0.184 (0.0541) | 0.298 (0.111) | 0.186 (0.0453) | 0.290 (0.0519) |
| RBV | 0.211 (0.0235) | 0.331 (0.0586) | 0.160 (0.0404) | 0.293 (0.0366) |
| SOF | 0.680 (0.0403) | 0.081 (0.0577) | 0.064 (0.0142) | 0.158 (0.0348) |
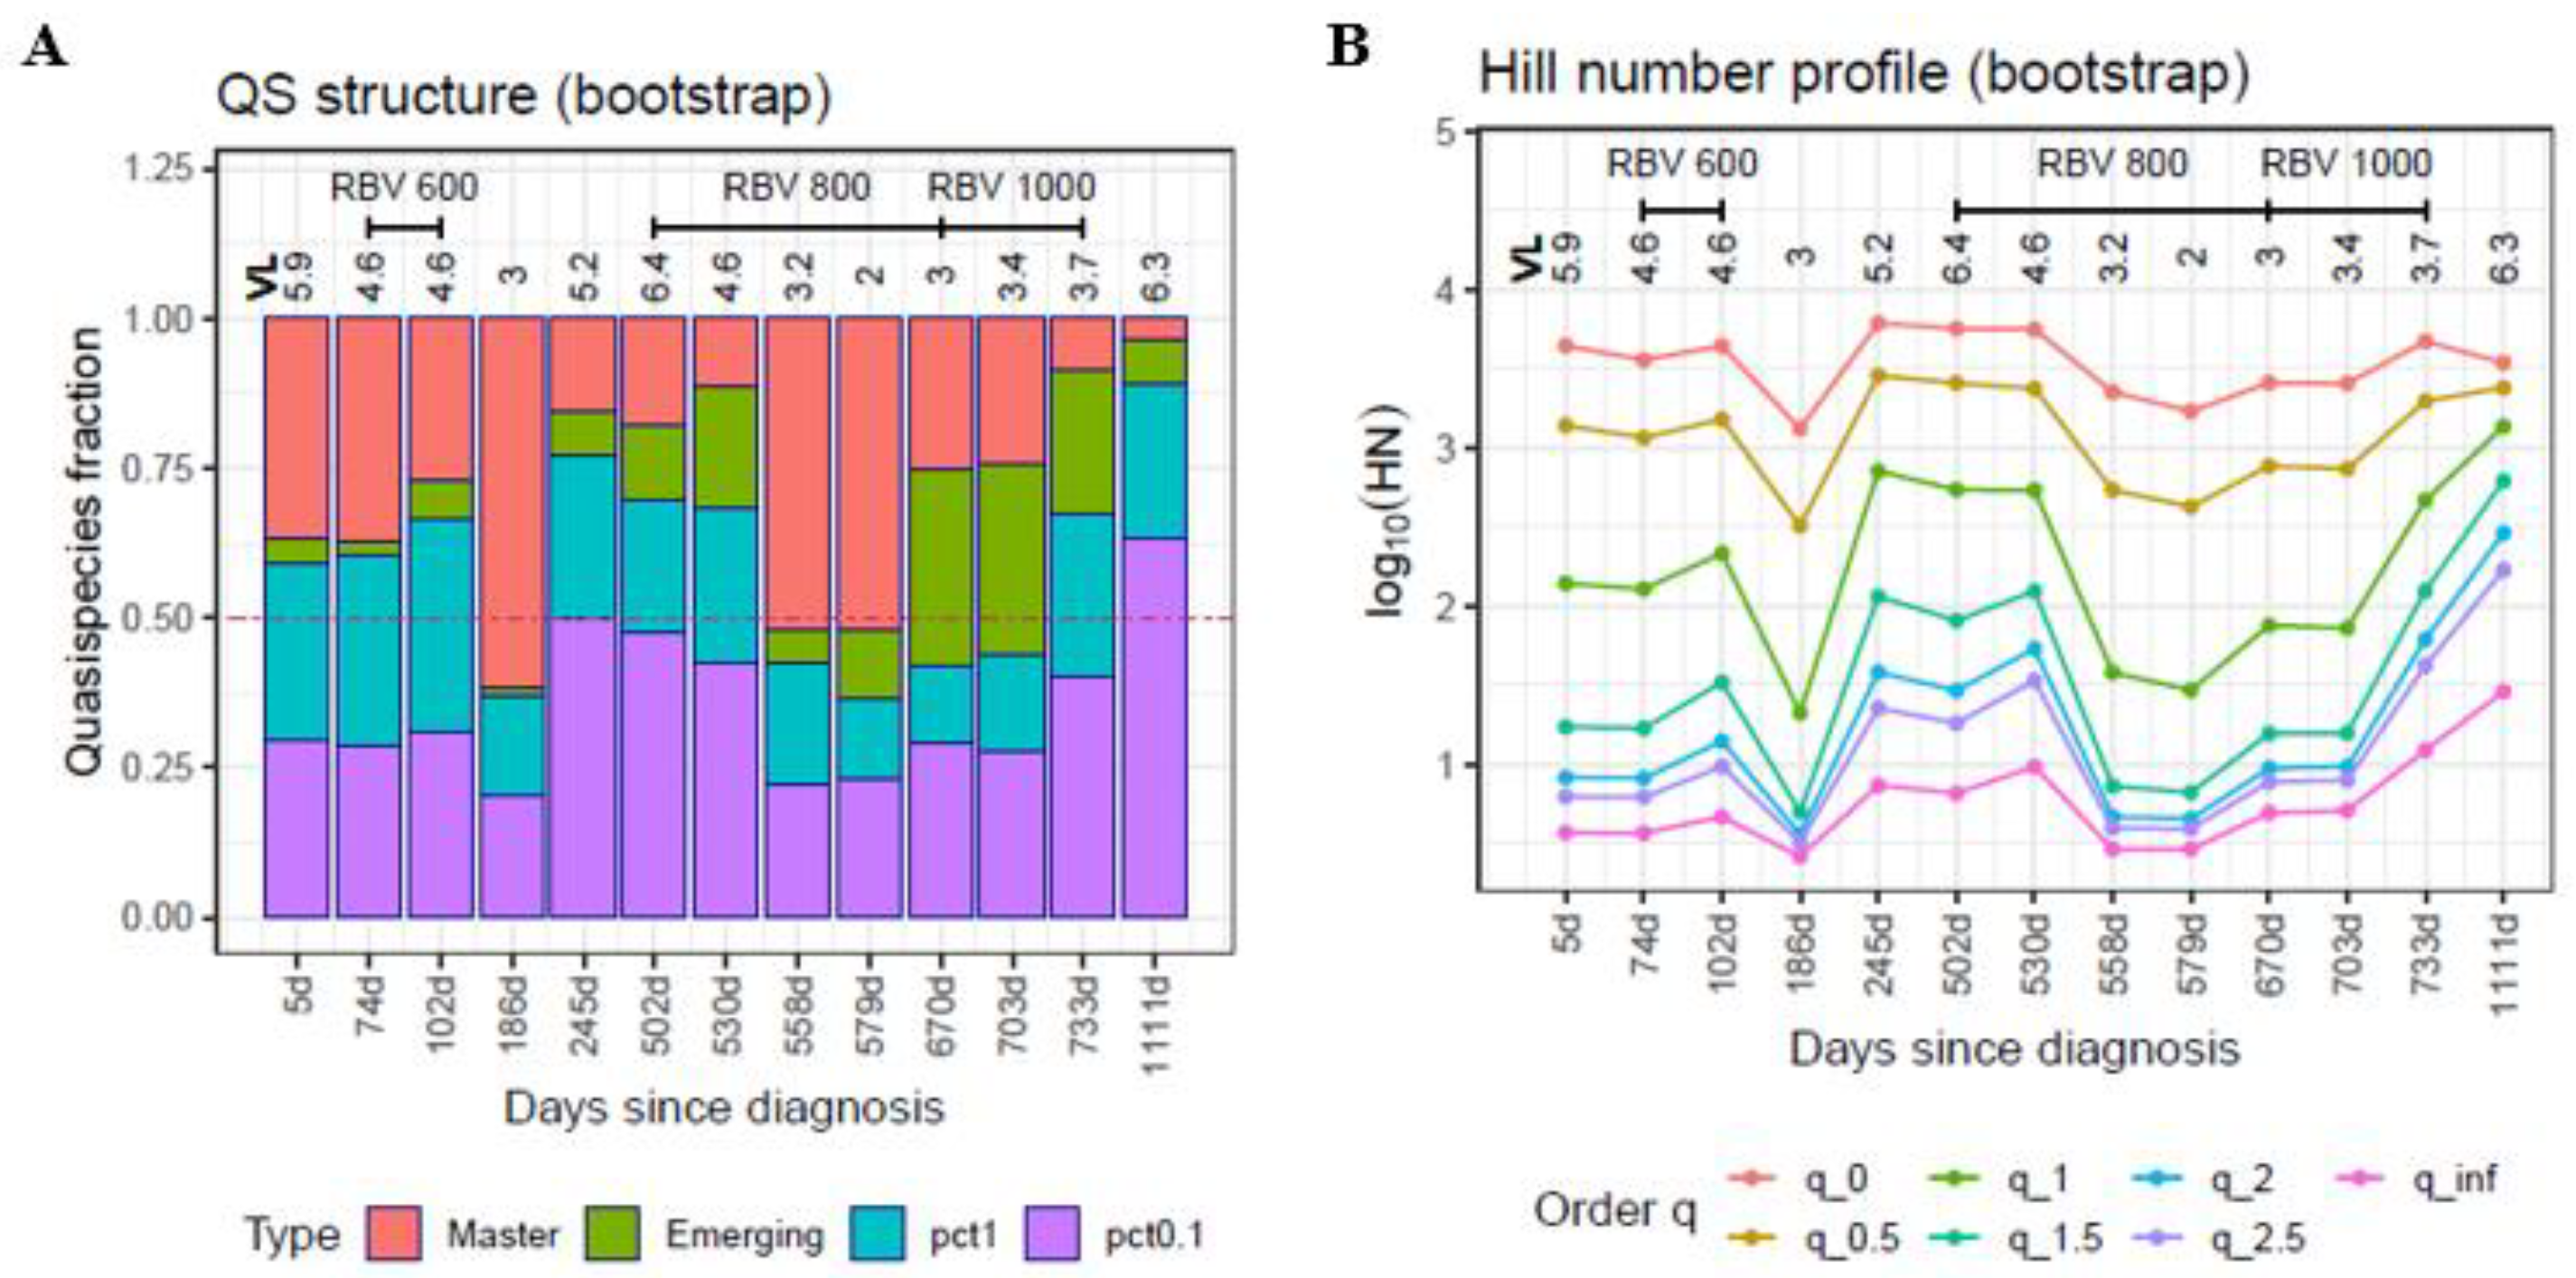
| Date (Y-M-D) | Interval (Days) | Days Since Diagnosis | Sample ID | LogVL | Observations |
|---|---|---|---|---|---|
| 2018-05-18 | 0 | 0 | 5.91 | Diagnosis | |
| 2018-05-23 | 5 | 5 | S01 | 5.87 | |
| 2018-07-31 | 69 | 74 | S03 | 4.60 | Ribavirin 600 mg |
| 2018-08-28 | 28 | 102 | S04 | 4.60 | |
| 2018-10-23 | 56 | 158 | 1.54 | EOT | |
| 2018-11-20 | 28 | 186 | S06 | 3.04 | Relapse |
| 2019-01-18 | 59 | 245 | S08 | 5.18 | |
| 2019-10-02 | 257 | 502 | S10 | 6.43 | Ribavirin 800 mg |
| 2019-10-30 | 28 | 530 | S12 | 4.62 | |
| 2019-11-27 | 28 | 558 | S14 | 3.18 | |
| 2019-12-18 | 21 | 579 | S16 | 2.04 | |
| 2020-03-18 | 91 | 670 | S17 | 3.04 | Ribavirin 1000 mg |
| 2020-04-20 | 33 | 703 | S18 | 3.40 | |
| 2020-05-20 | 30 | 733 | S20 | 3.68 | EOT |
| 2020-06-17 | 28 | 761 | 4.45 | Relapse | |
| 2021-06-02 | 350 | 1111 | S24 | 6.28 |
Publisher’s Note: MDPI stays neutral with regard to jurisdictional claims in published maps and institutional affiliations. |
© 2022 by the authors. Licensee MDPI, Basel, Switzerland. This article is an open access article distributed under the terms and conditions of the Creative Commons Attribution (CC BY) license (https://creativecommons.org/licenses/by/4.0/).
Share and Cite
Gregori, J.; Colomer-Castell, S.; Campos, C.; Ibañez-Lligoña, M.; Garcia-Cehic, D.; Rando-Segura, A.; Adombie, C.M.; Pintó, R.; Guix, S.; Bosch, A.; et al. Quasispecies Fitness Partition to Characterize the Molecular Status of a Viral Population. Negative Effect of Early Ribavirin Discontinuation in a Chronically Infected HEV Patient. Int. J. Mol. Sci. 2022, 23, 14654. https://doi.org/10.3390/ijms232314654
Gregori J, Colomer-Castell S, Campos C, Ibañez-Lligoña M, Garcia-Cehic D, Rando-Segura A, Adombie CM, Pintó R, Guix S, Bosch A, et al. Quasispecies Fitness Partition to Characterize the Molecular Status of a Viral Population. Negative Effect of Early Ribavirin Discontinuation in a Chronically Infected HEV Patient. International Journal of Molecular Sciences. 2022; 23(23):14654. https://doi.org/10.3390/ijms232314654
Chicago/Turabian StyleGregori, Josep, Sergi Colomer-Castell, Carolina Campos, Marta Ibañez-Lligoña, Damir Garcia-Cehic, Ariadna Rando-Segura, Caroline Melanie Adombie, Rosa Pintó, Susanna Guix, Albert Bosch, and et al. 2022. "Quasispecies Fitness Partition to Characterize the Molecular Status of a Viral Population. Negative Effect of Early Ribavirin Discontinuation in a Chronically Infected HEV Patient" International Journal of Molecular Sciences 23, no. 23: 14654. https://doi.org/10.3390/ijms232314654
APA StyleGregori, J., Colomer-Castell, S., Campos, C., Ibañez-Lligoña, M., Garcia-Cehic, D., Rando-Segura, A., Adombie, C. M., Pintó, R., Guix, S., Bosch, A., Domingo, E., Gallego, I., Perales, C., Cortese, M. F., Tabernero, D., Buti, M., Riveiro-Barciela, M., Esteban, J. I., Rodriguez-Frias, F., & Quer, J. (2022). Quasispecies Fitness Partition to Characterize the Molecular Status of a Viral Population. Negative Effect of Early Ribavirin Discontinuation in a Chronically Infected HEV Patient. International Journal of Molecular Sciences, 23(23), 14654. https://doi.org/10.3390/ijms232314654