
4-Hydroxynonenal Modulates Blood–Brain Barrier Permeability In Vitro through Changes in Lipid Composition and Oxidative Status of Endothelial Cells and Astrocytes


 ,
,  , ,
, ,  and
and 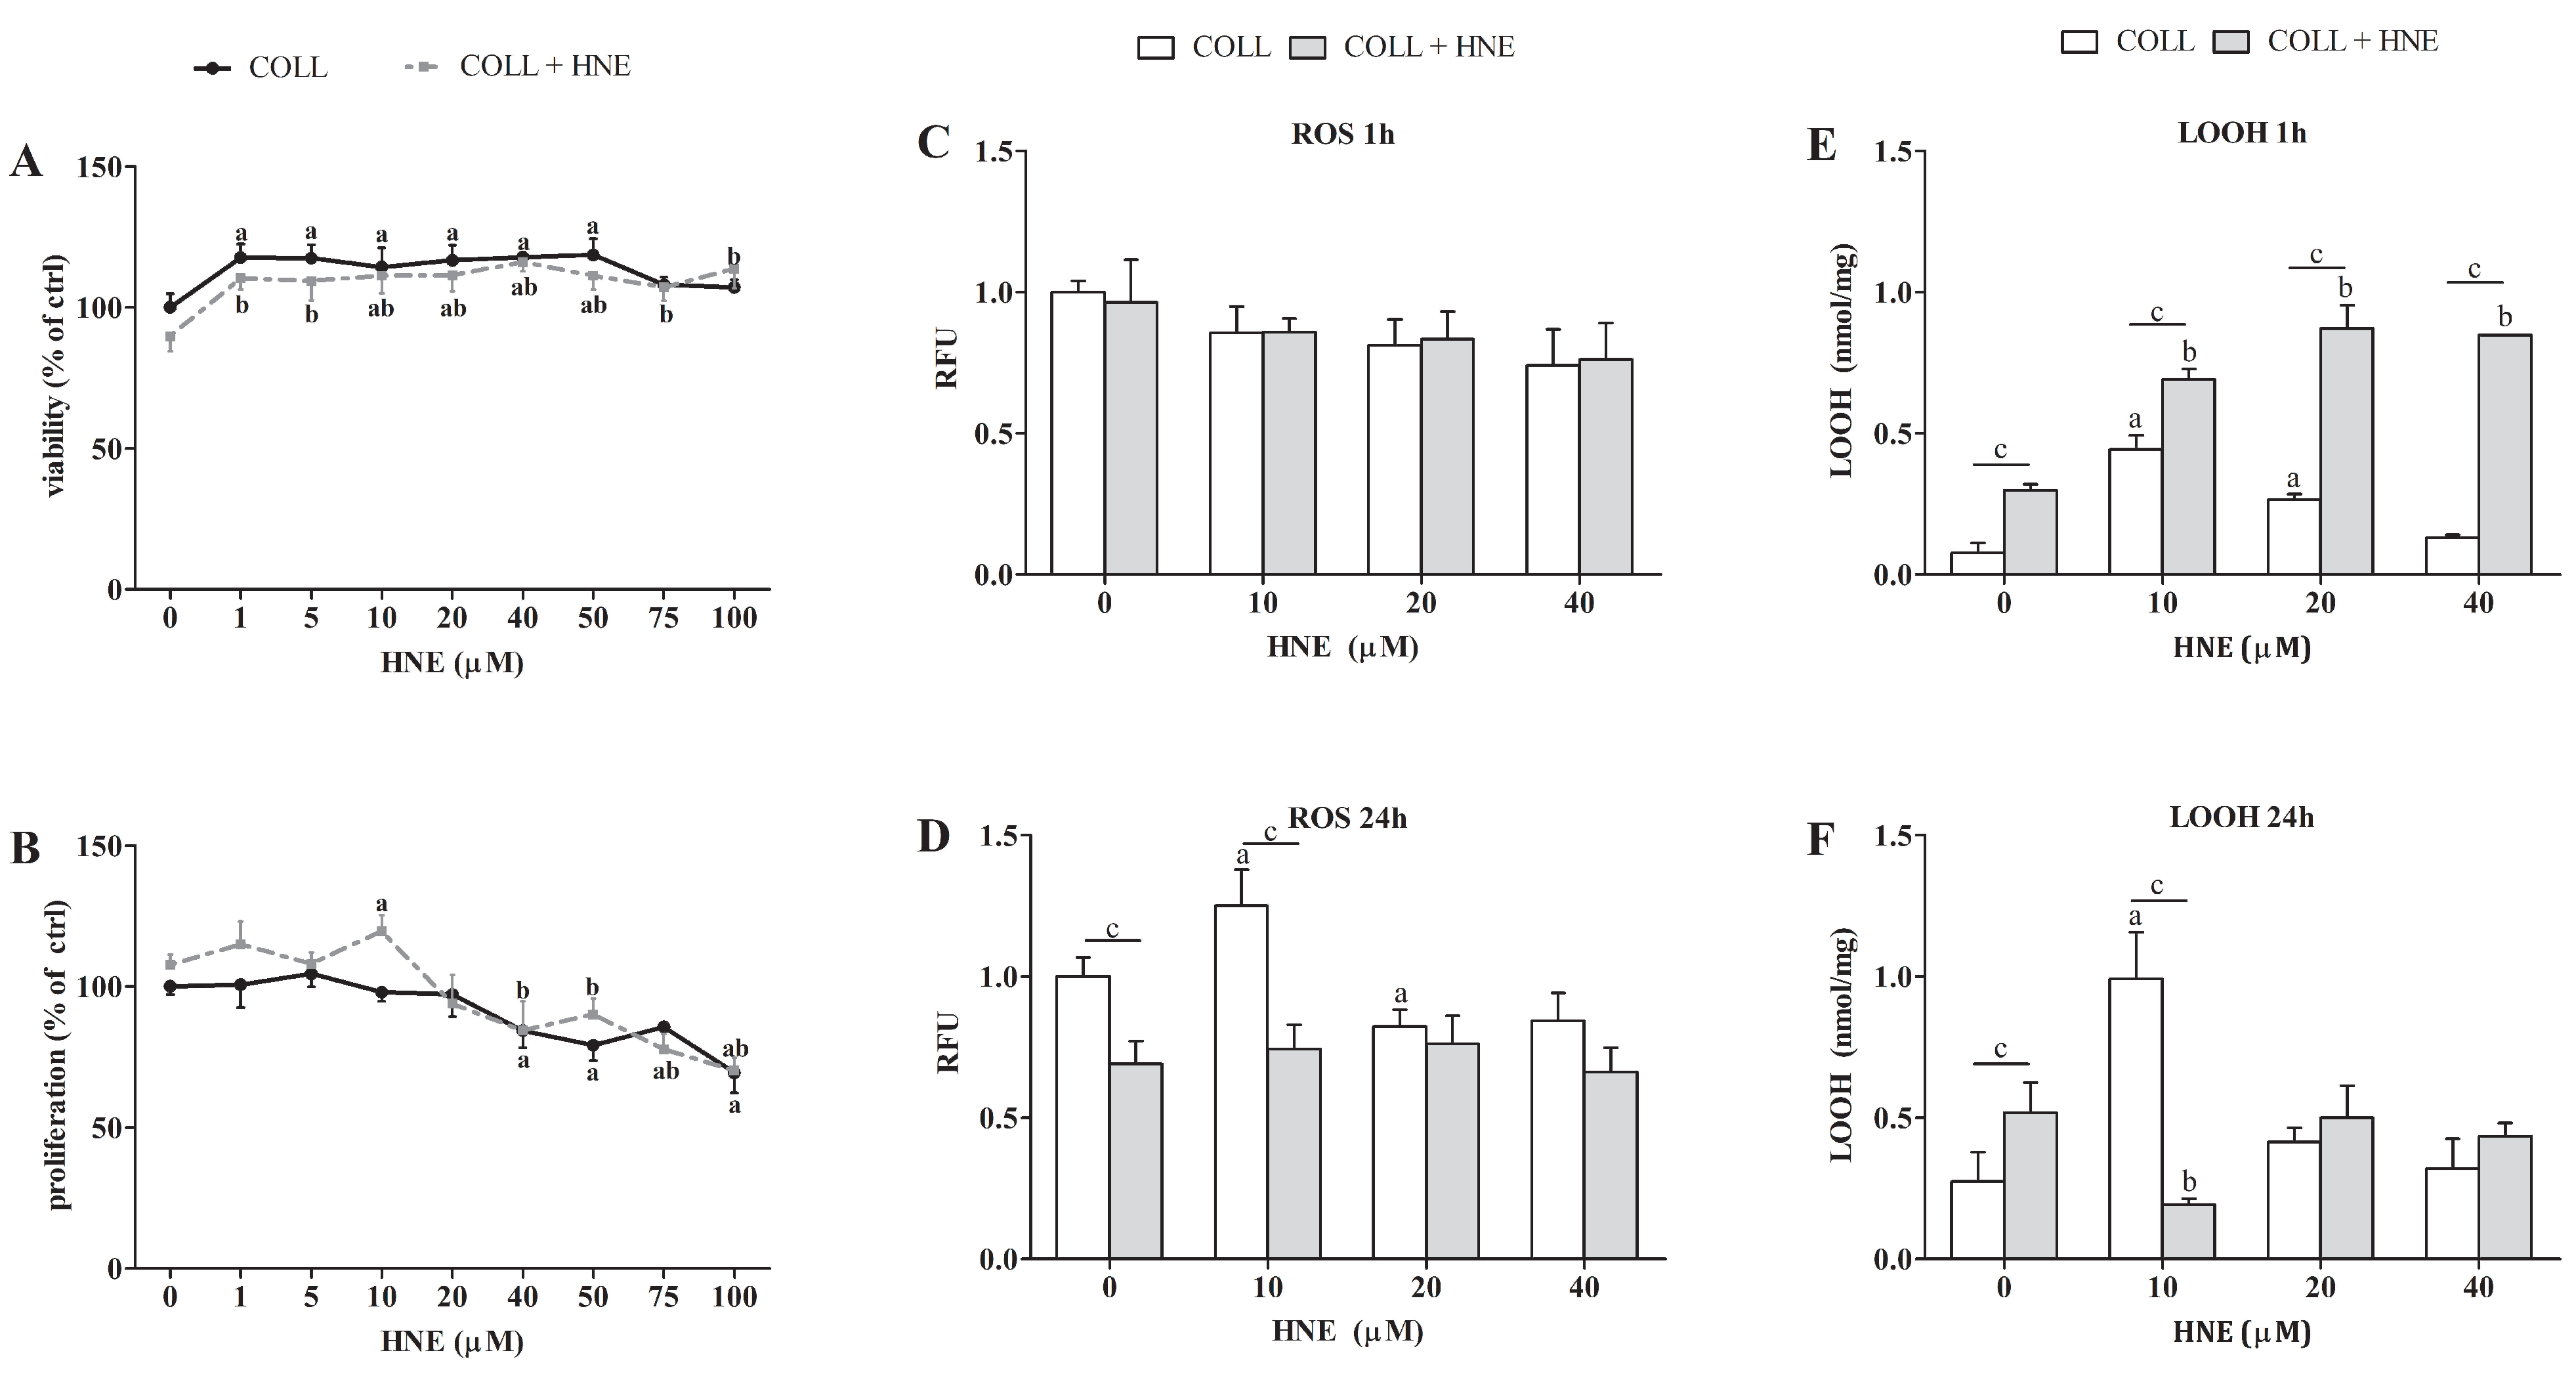
Abstract
1. Introduction
2. Results
2.1. Effects of HNE on the Viability, Proliferation and Oxidative Status of RbE4 Cells
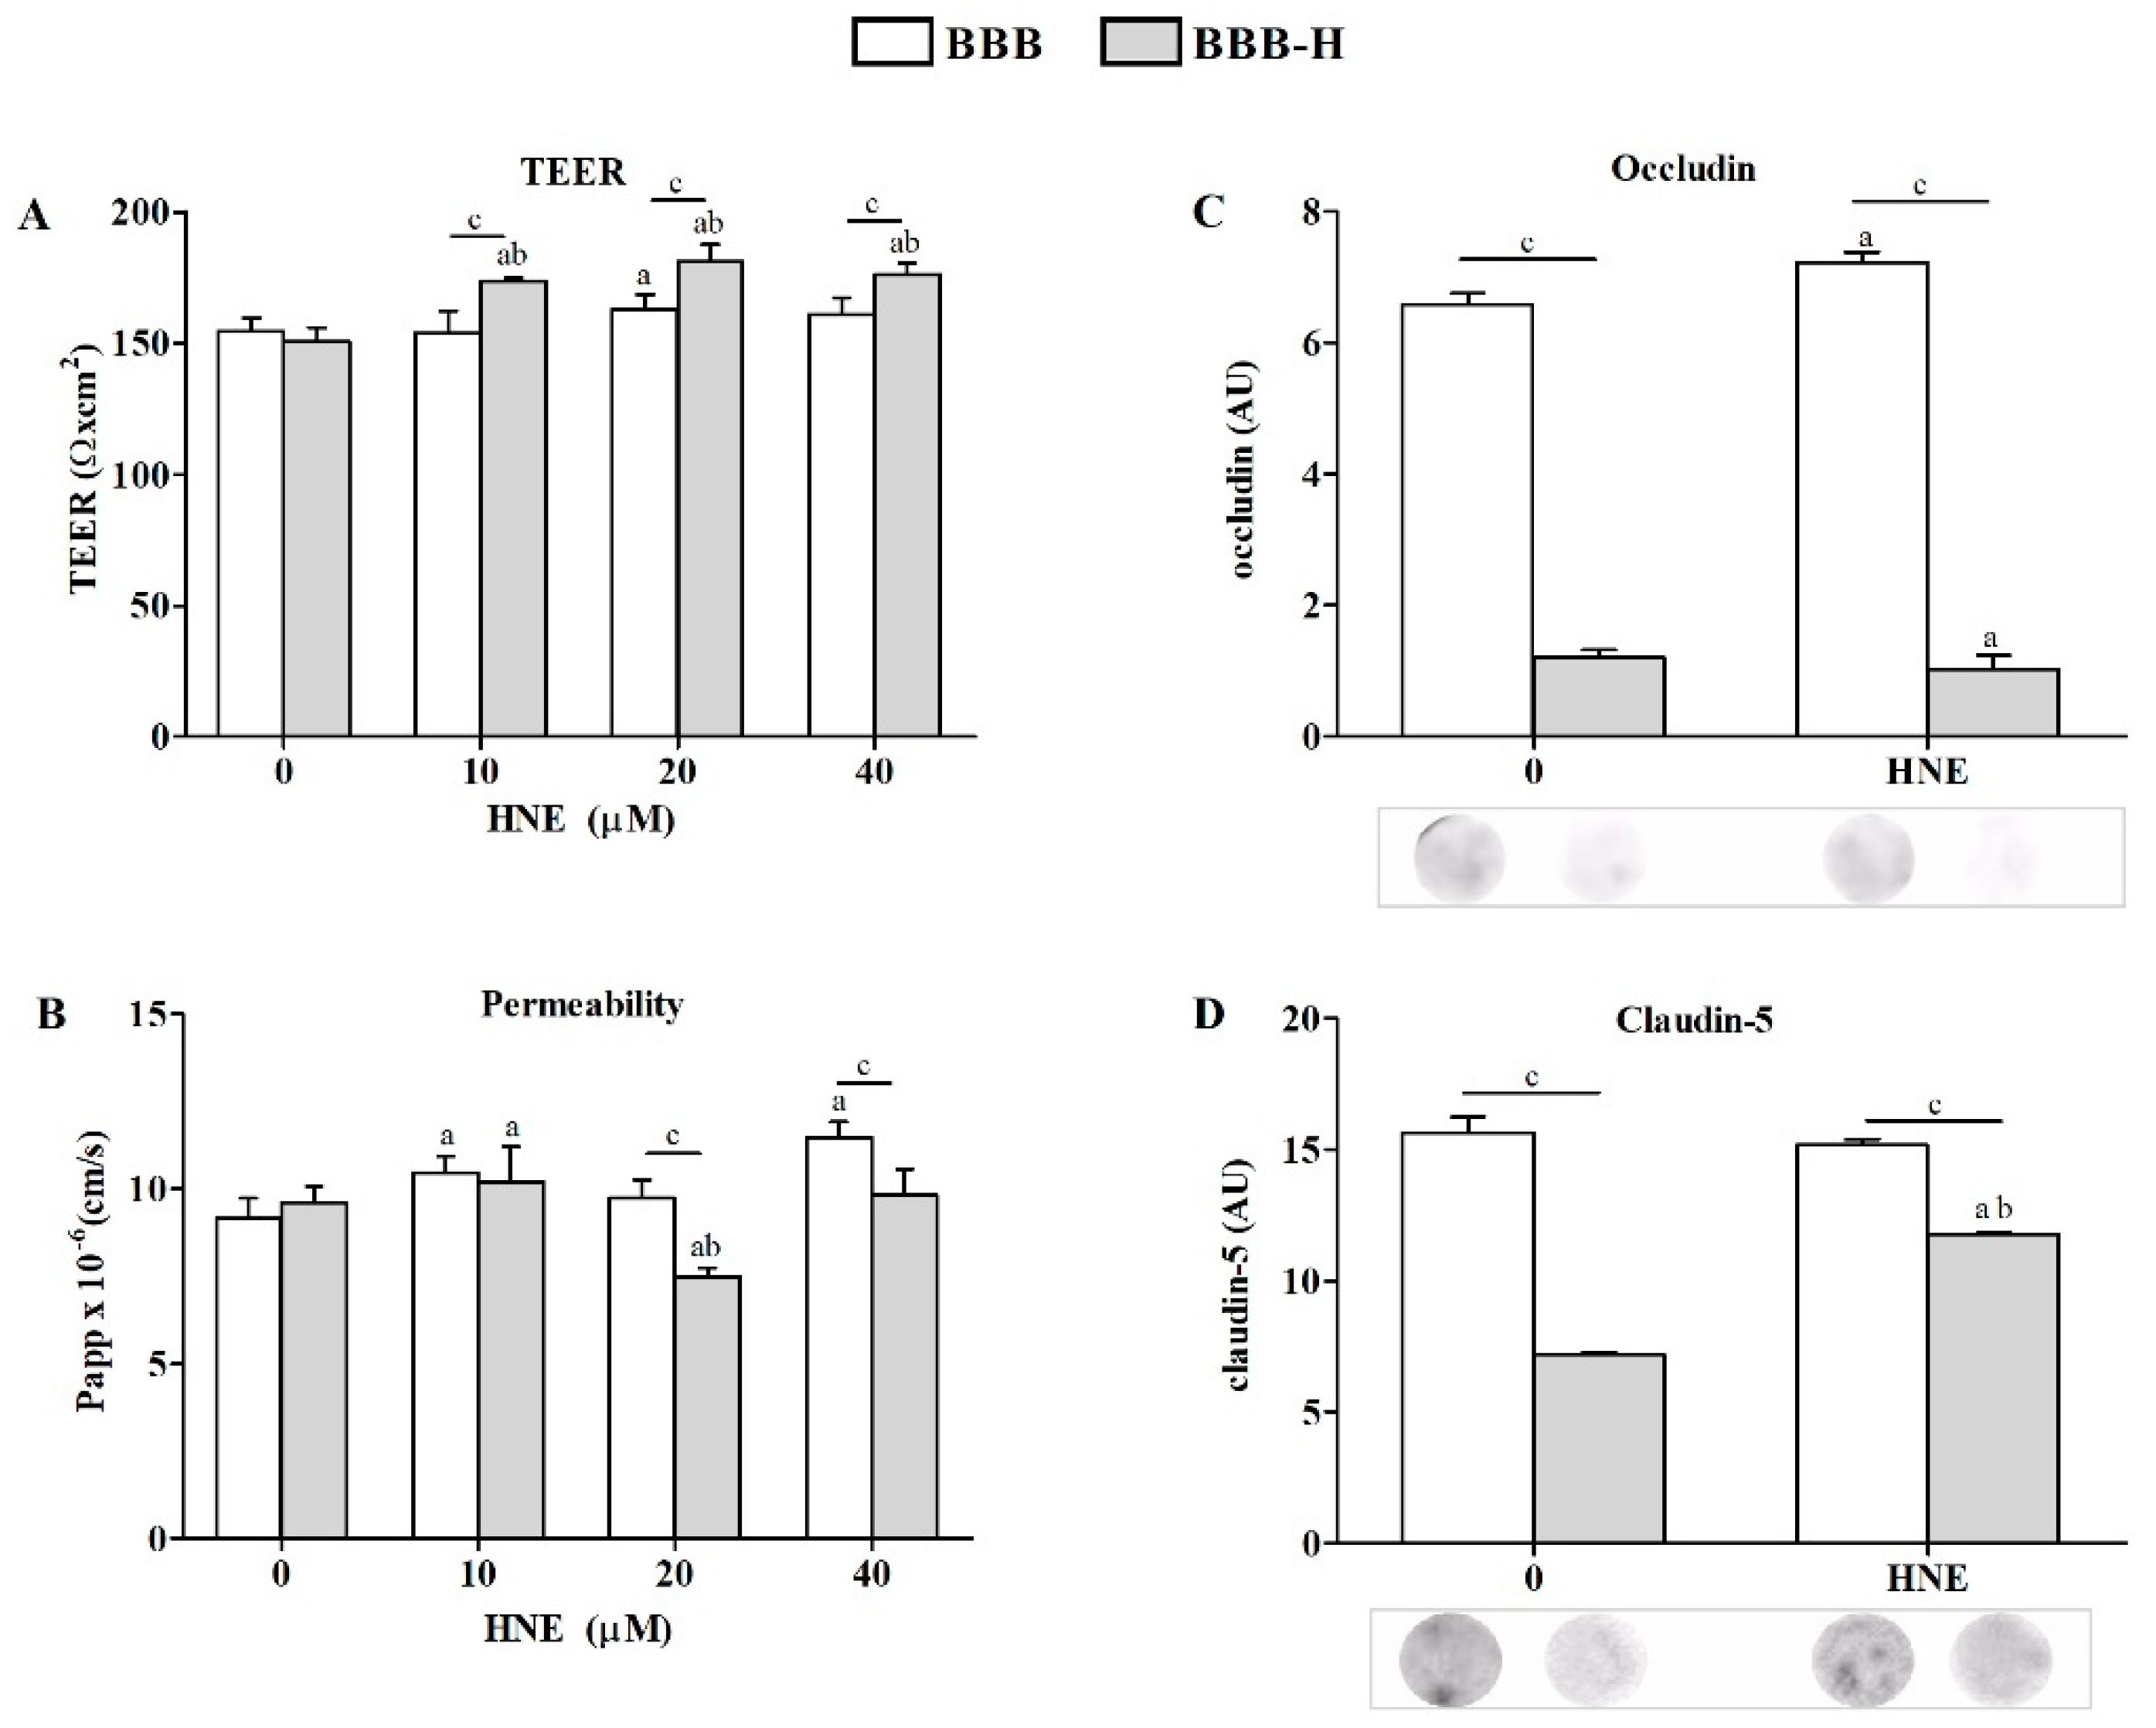
2.2. Sensitivity of RbE4 Cells and Astrocytes in Two BBB Models to Selected HNE Concentrations
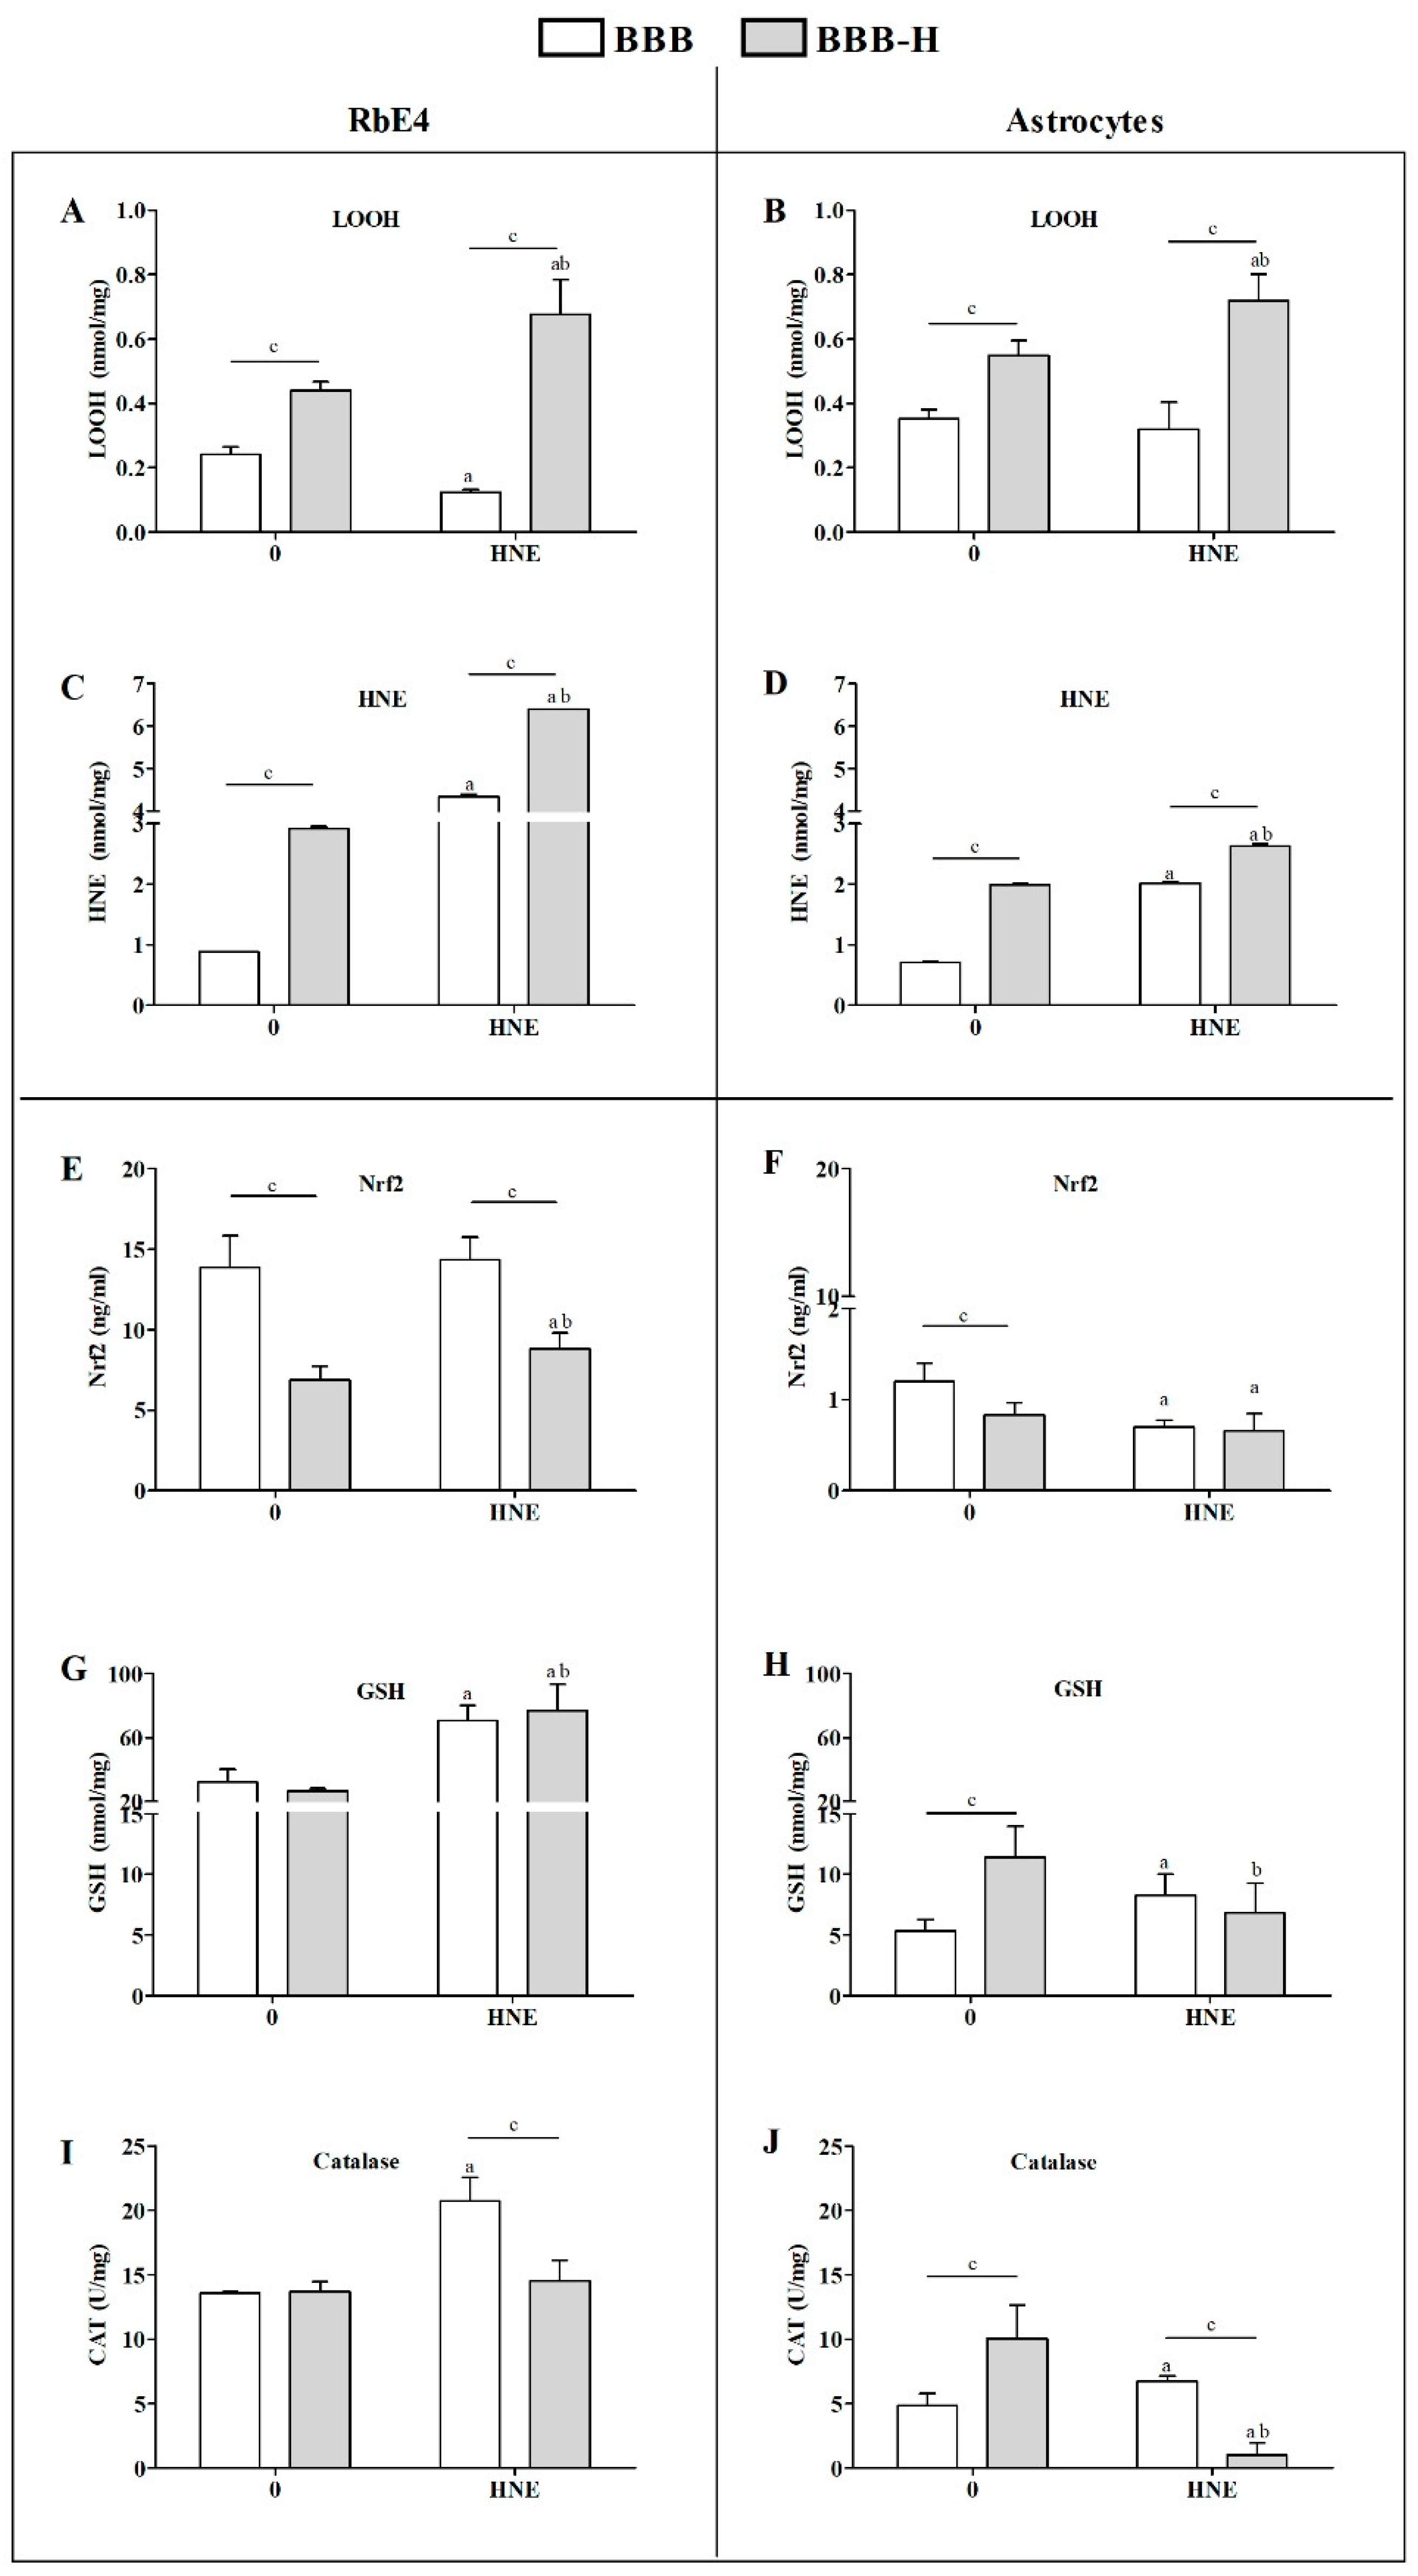
2.3. HNE Effects on Lipid Peroxidation and Antioxidant Activity of Endothelial Cells and Astrocytes of Both BBB Models
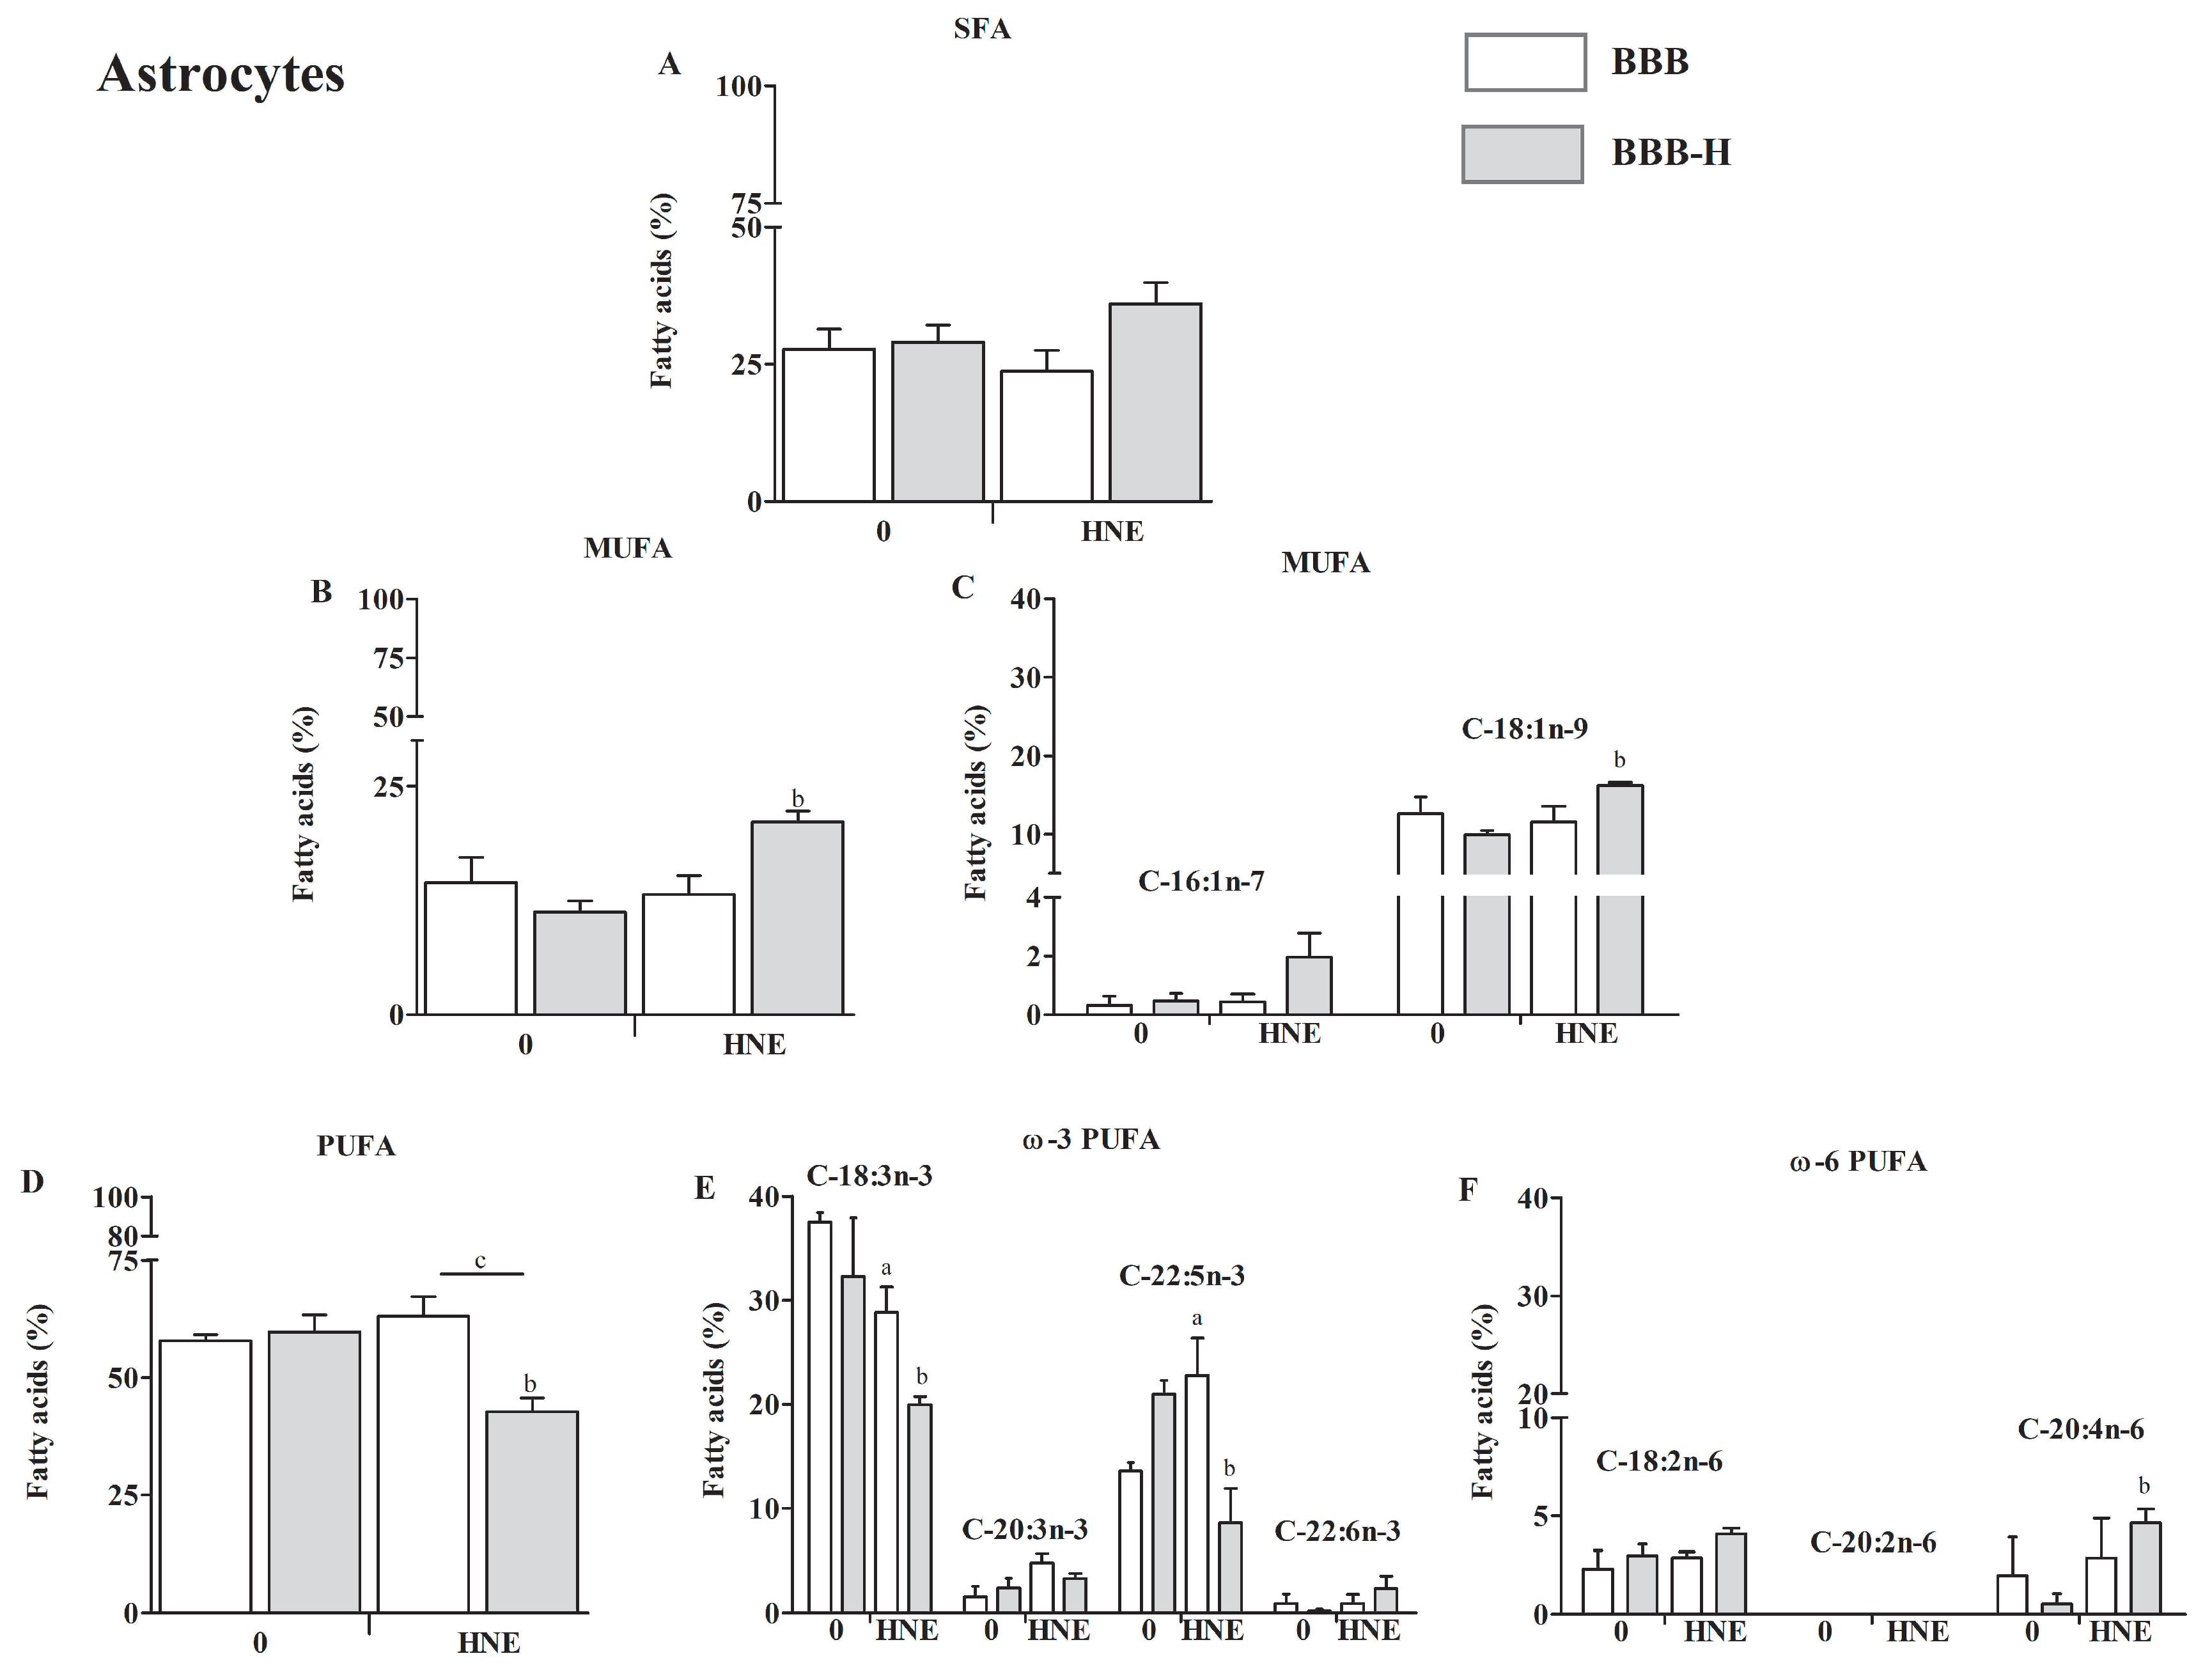
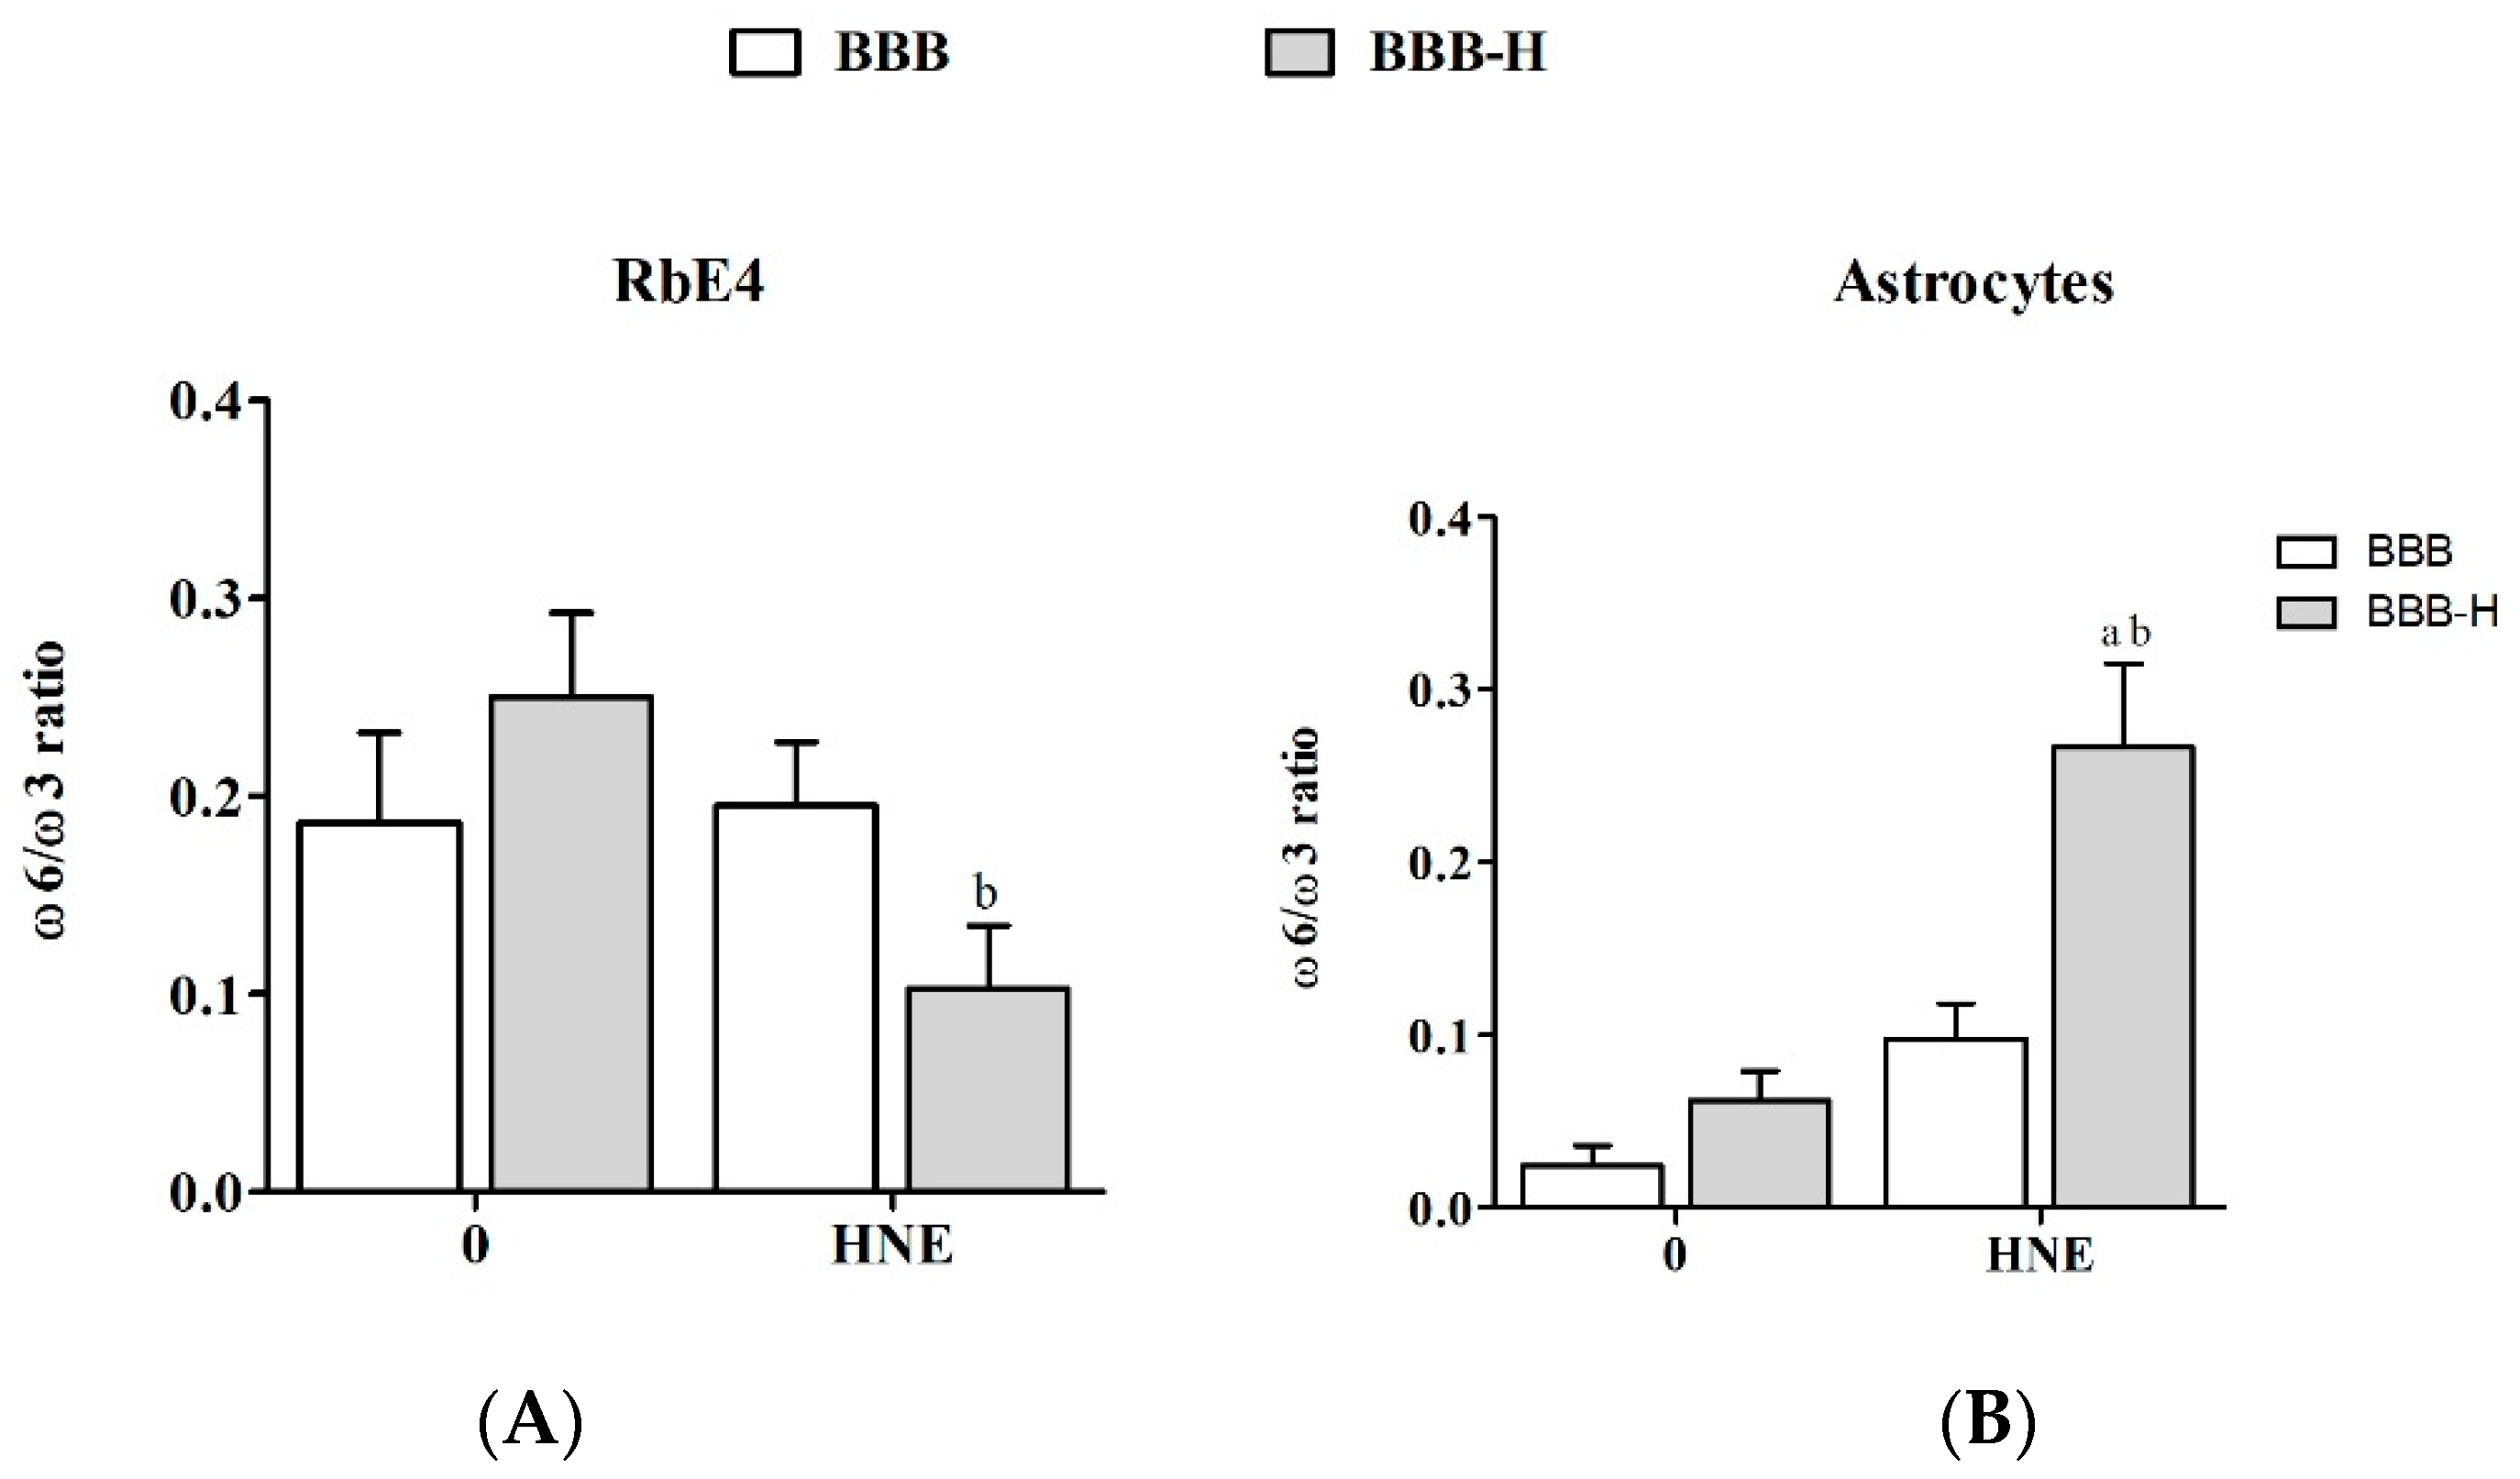
2.4. HNE Affects Lipid Profile of Endothelial Cells and Astrocytes of Both BBB Models
3. Discussion
4. Materials and Methods
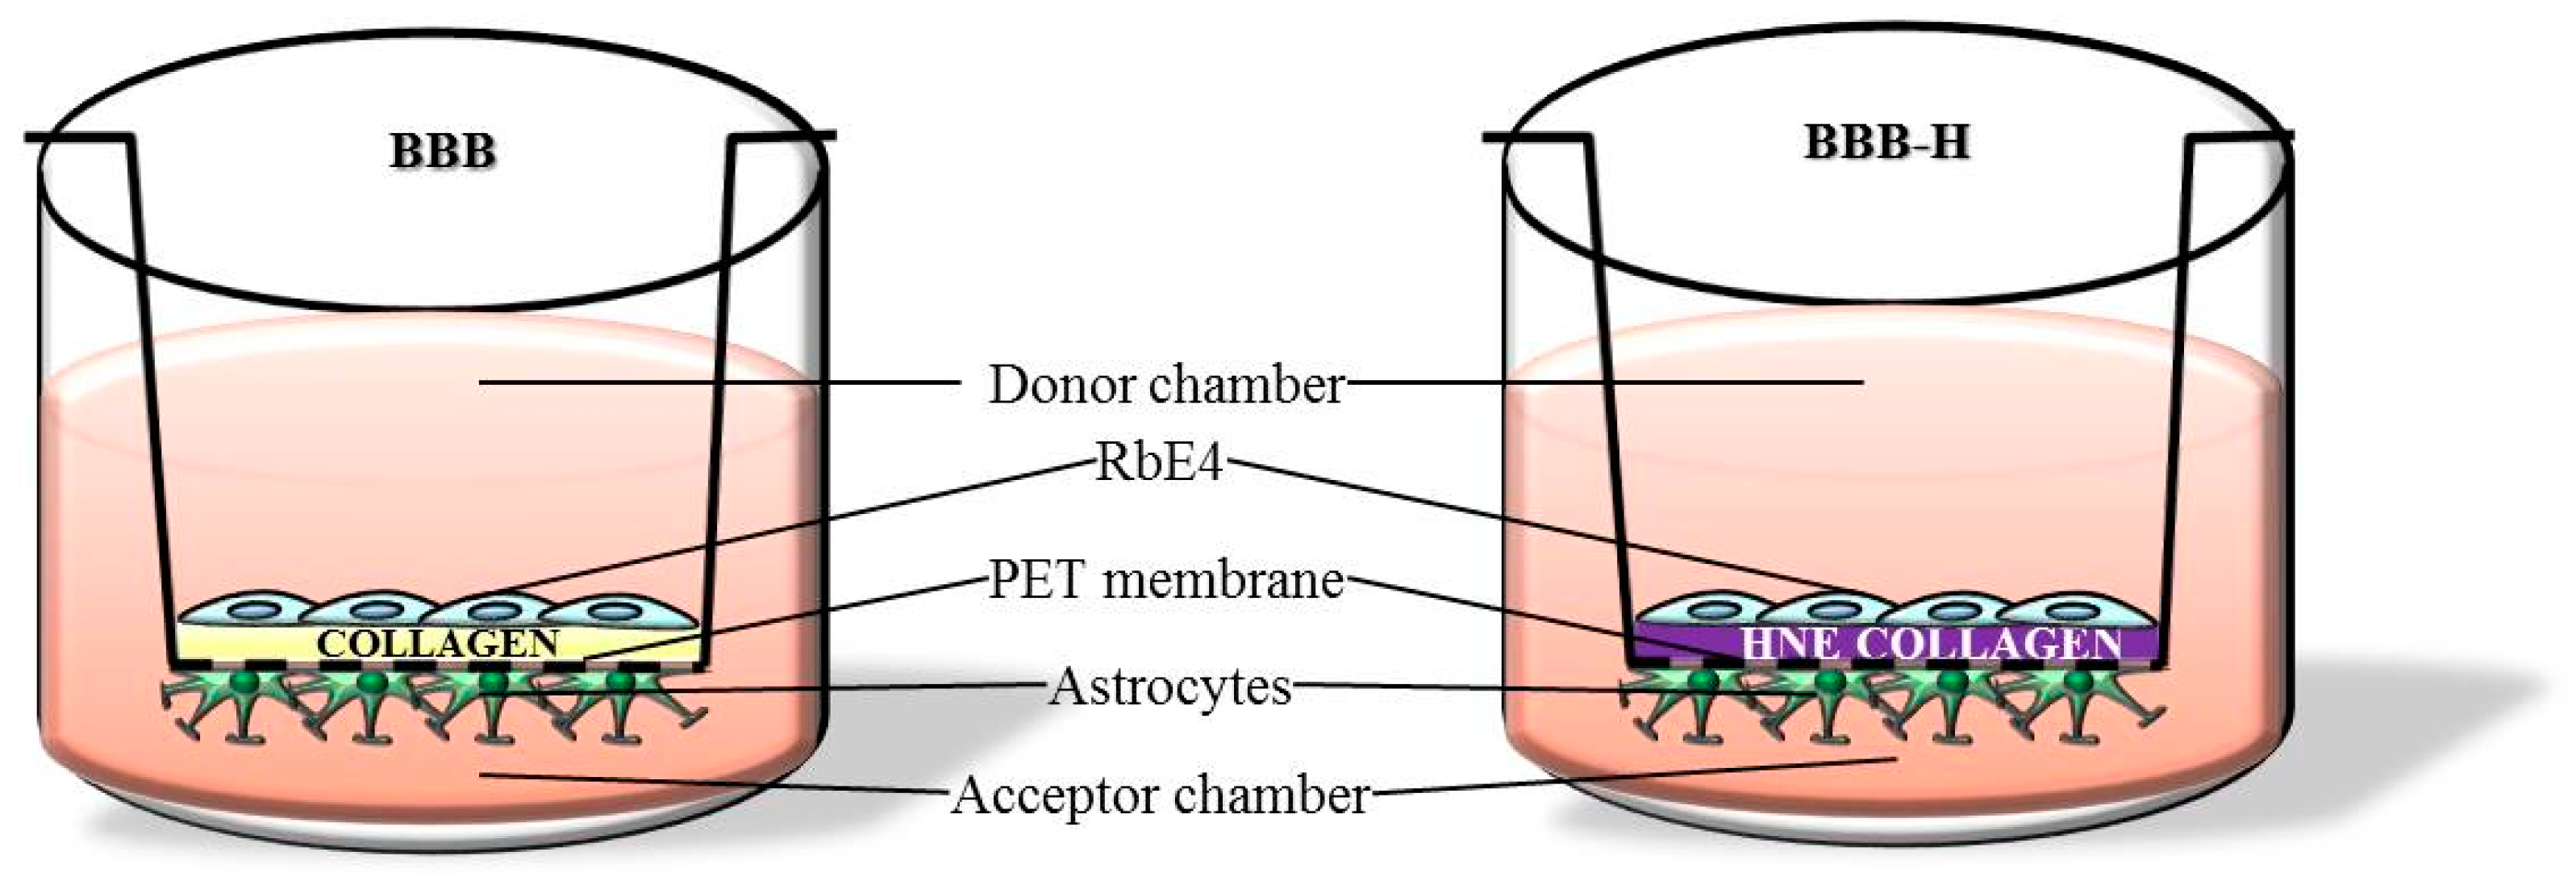
4.1. Cell Culture Conditions and Treatments
4.2. Cell Viability and Proliferation Assays
4.3. Sample Preparation for Protein and Lipid Based Assays
4.4. ROS and LOOH Measurements
4.5. BBB Integrity Evaluation
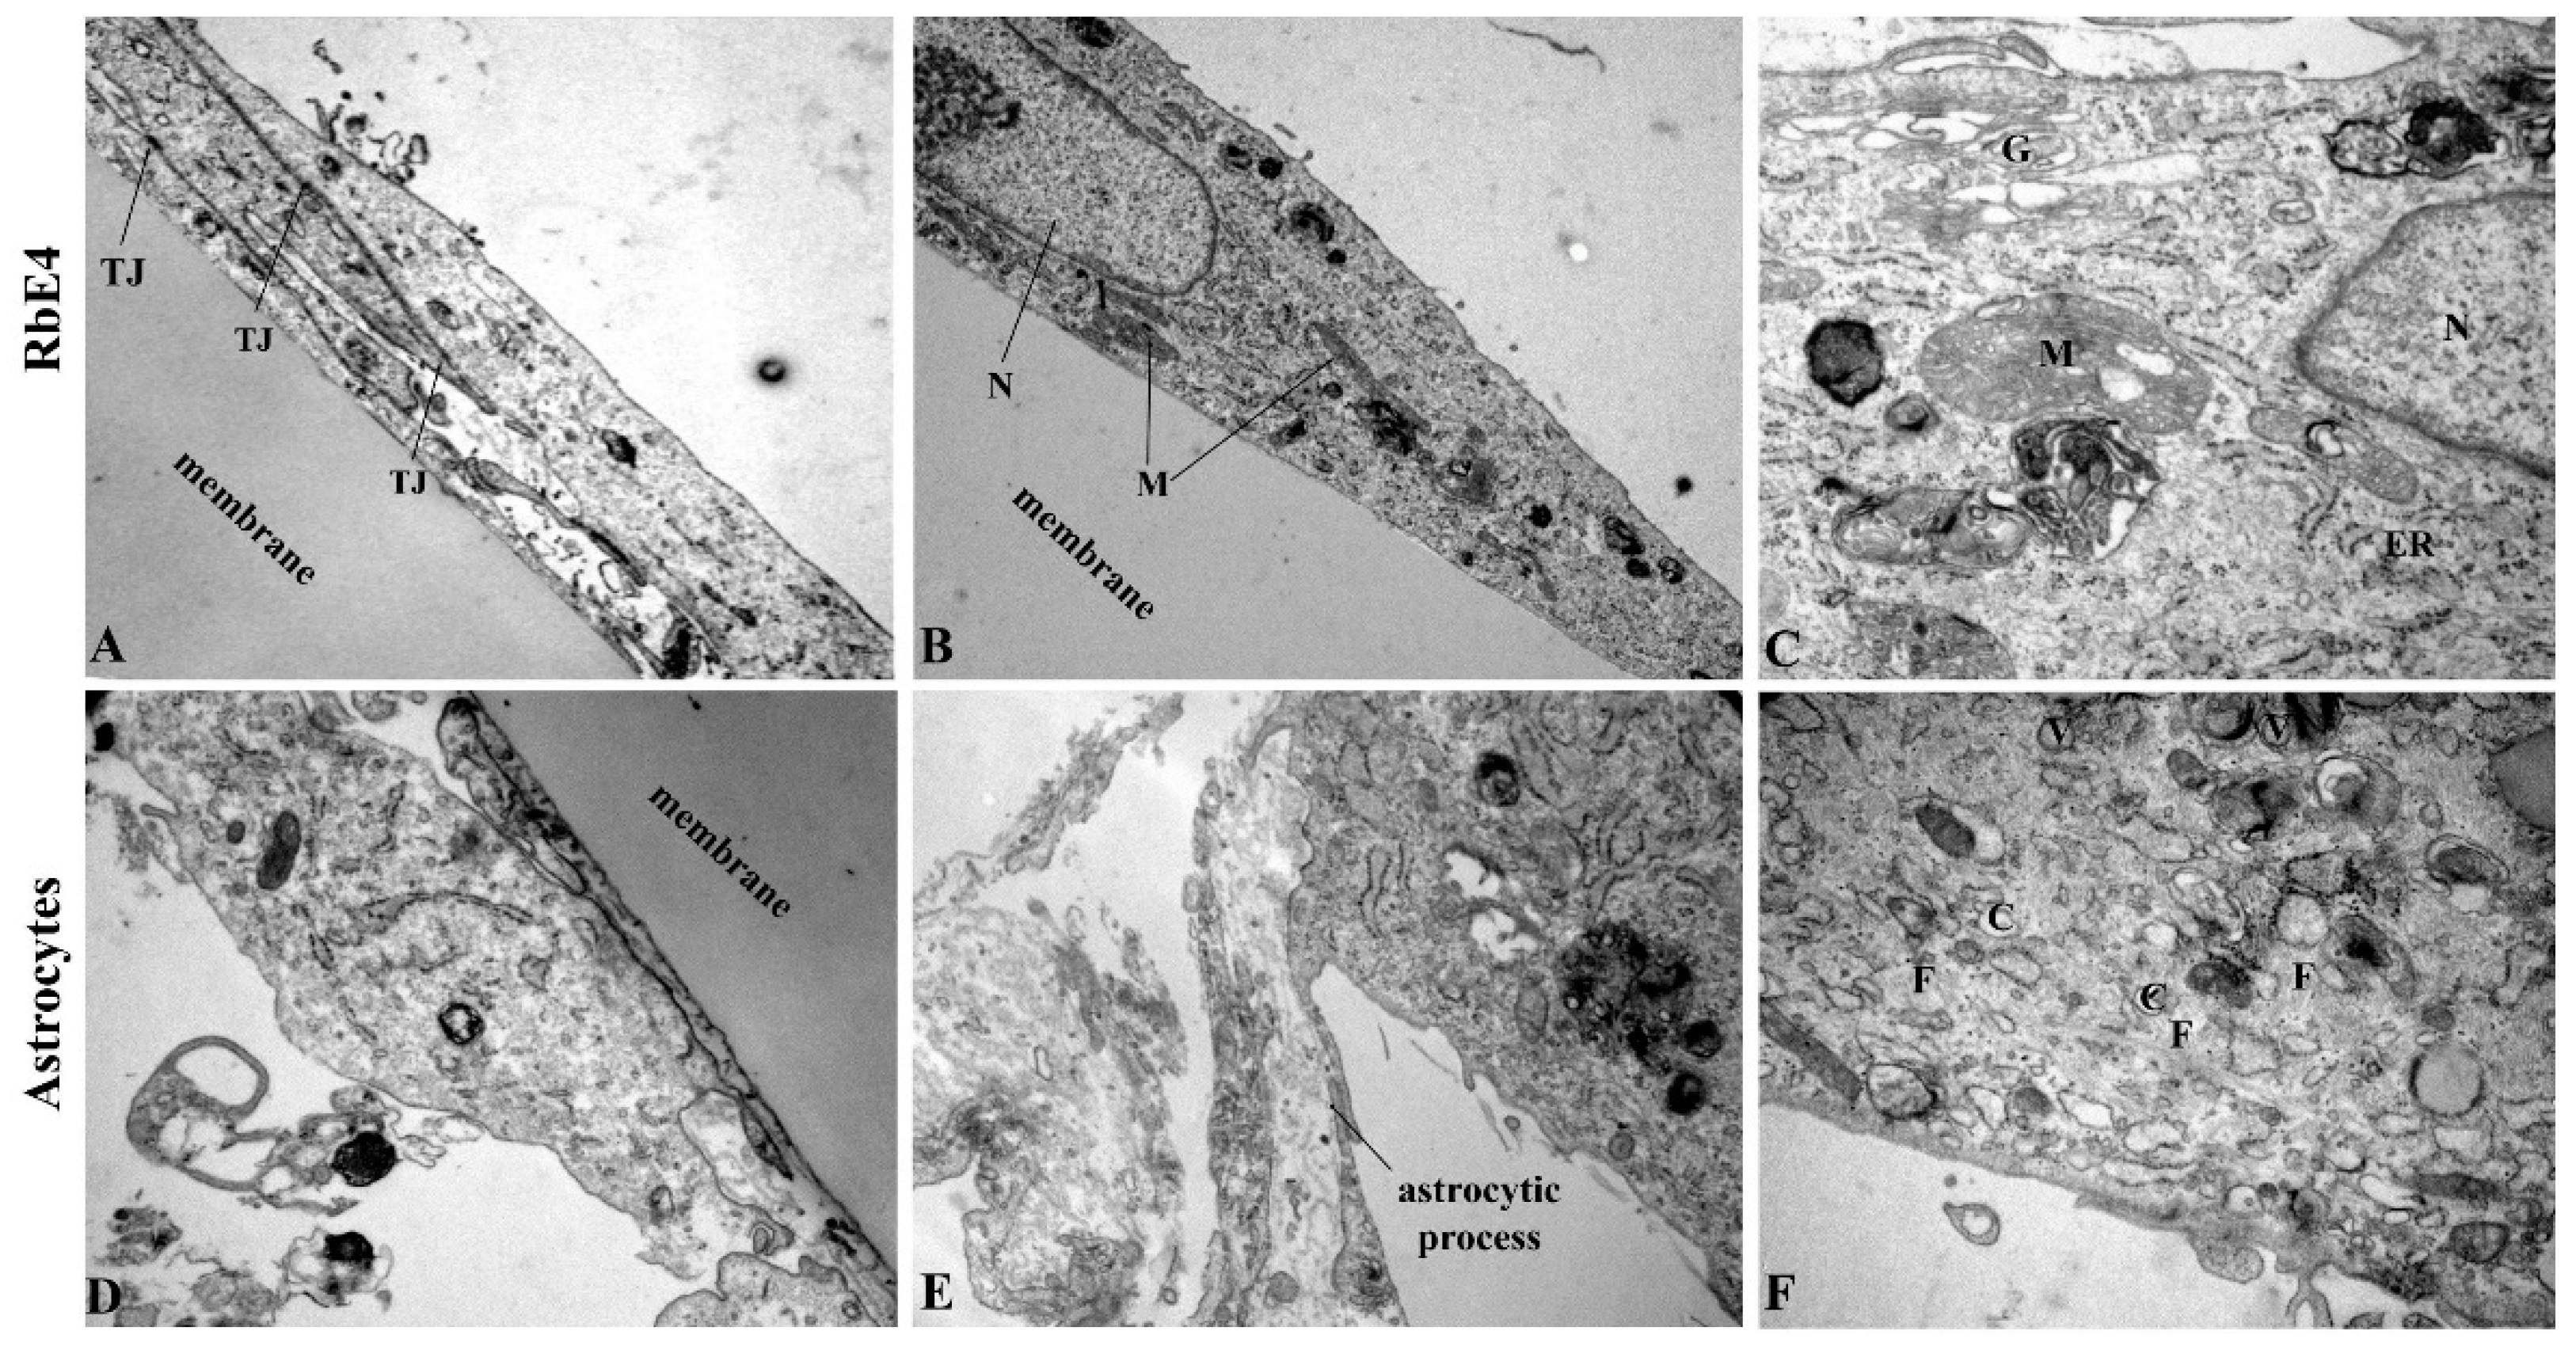
4.6. Electron Microscopy
4.7. Total Glutathione and Catalase Activity Assays
4.8. Dot Blot Analysis
4.9. Lipid Analysis
4.10. Statistical Analyses
Author Contributions
Funding
Institutional Review Board Statement
Informed Consent Statement
Data Availability Statement
Acknowledgments
Conflicts of Interest
Appendix A


References
- Abbott, N.J.; Rönnbäck, L.; Hansson, E. Astrocyte-Endothelial Interactions at the Blood-Brain Barrier. Nat. Rev. Neurosci. 2006, 7, 41–53. [Google Scholar] [CrossRef] [PubMed]
- Cardoso, F.L.; Brites, D.; Brito, M.A. Looking at the Blood-Brain Barrier: Molecular Anatomy and Possible Investigation Approaches. Brain Res. Rev. 2010, 64, 328–363. [Google Scholar] [CrossRef] [PubMed]
- Upadhyay, R.K. Drug Delivery Systems, CNS Protection, and the Blood Brain Barrier. Biomed Res. Int. 2014, 2014, 869269. [Google Scholar] [CrossRef] [PubMed]
- Carvey, P.M.; Hendey, B.; Monahan, A.J. The Blood-Brain Barrier in Neurodegenerative Disease: A Rhetorical Perspective. J. Neurochem. 2009, 111, 291–314. [Google Scholar] [CrossRef] [PubMed]
- Zlokovic, B.V. The Blood-Brain Barrier in Health and Chronic Neurodegenerative Disorders. Neuron 2008, 57, 178–201. [Google Scholar] [CrossRef]
- Larsson, H.B.; Stubgaard, M.; Frederiksen, J.L.; Jensen, M.; Henriksen, O.; Paulson, O.B. Quantitation of Blood-Brain Barrier Defect by Magnetic Resonance Imaging and Gadolinium-DTPA in Patients with Multiple Sclerosis and Brain Tumors. Magn. Reson. Med. 1990, 16, 117–131. [Google Scholar] [CrossRef]
- Yang, Y.; Rosenberg, G. A Blood-Brain Barrier Breakdown in Acute and Chronic Cerebrovascular Disease. Stroke 2011, 42, 3323–3328. [Google Scholar] [CrossRef]
- Schreibelt, G.; Kooij, G.; Reijerkerk, A.; van Doorn, R.; Gringhuis, S.I.; van der Pol, S.; Weksler, B.B.; Romero, I.A.; Couraud, P.; Piontek, J.; et al. Reactive Oxygen Species Alter Brain Endothelial Tight Junction Dynamics via RhoA, PI3 Kinase, and PKB Signaling. FASEB J. 2007, 21, 3666–3676. [Google Scholar] [CrossRef]
- Haorah, J.; Ramirez, S.H.; Schall, K.; Smith, D.; Pandya, R.; Persidsky, Y. Oxidative Stress Activates Protein Tyrosine Kinase and Matrix Metalloproteinases Leading to Blood-Brain Barrier Dysfunction. J. Neurochem. 2007, 101, 566–576. [Google Scholar] [CrossRef]
- Adibhatla, R.M.; Hatcher, J.F. Lipid Oxidation and Peroxidation in CNS Health and Disease: From Molecular Mechanisms to Therapeutic Opportunities. Antioxid. Redox Signal. 2010, 12, 125–169. [Google Scholar] [CrossRef]
- Yamagata, K.; Tagami, M.; Takenaga, F.; Yamori, Y.; Nara, Y.; Itoh, S. Polyunsaturated Fatty Acids Induce Tight Junctions to Form in Brain Capillary Endothelial Cells. Neuroscience 2003, 116, 649–656. [Google Scholar] [CrossRef]
- Deli, M. A Potential Use of Tight Junction Modulators to Reversibly Open Membranous Barriers and Improve Drug Delivery. Biochim. Biophys. Acta 2009, 1788, 892–910. [Google Scholar] [CrossRef] [PubMed]
- Enciu, A.-M.; Gherghiceanu, M.; Popescu, B.O. Triggers and Effectors of Oxidative Stress at Blood-Brain Barrier Level: Relevance for Brain Ageing and Neurodegeneration. Oxid. Med. Cell Longev. 2013, 2013, 297512. [Google Scholar] [CrossRef] [PubMed]
- Sultana, R.; Perluigi, M.; Allan Butterfield, D. Lipid Peroxidation Triggers Neurodegeneration: A Redox Proteomics View into the Alzheimer Disease Brain. Free Radic. Biol. Med. 2013, 62, 157–169. [Google Scholar] [CrossRef]
- Reed, T.T. Lipid Peroxidation and Neurodegenerative Disease. Free Radic. Biol. Med. 2011, 51, 1302–1319. [Google Scholar] [CrossRef]
- Juric-Sekhar, G.; Zarkovic, K.; Waeg, G.; Cipak, A.; Zarkovic, N. Distribution of 4-Hydroxynonenal-Protein Conjugates as a Marker of Lipid Peroxidation and Parameter of Malignancy in Astrocytic and Ependymal Tumors of the Brain. Tumori 2009, 95, 762–768. [Google Scholar] [CrossRef]
- Zarkovic, K.; Juric, G.; Waeg, G.; Kolenc, D.; Zarkovic, N. Immunohistochemical Appearance of HNE-Protein Conjugates in Human Astrocytomas. BioFactors 2005, 24, 33–40. [Google Scholar] [CrossRef]
- Butterfield, D.A.; Reed, T.; Sultana, R. Roles of 3-Nitrotyrosine- and 4-Hydroxynonenal-Modified Brain Proteins in the Progression and Pathogenesis of Alzheimer’s Disease. Free Radic. Res. 2011, 45, 59–72. [Google Scholar] [CrossRef]
- Chapple, S.J.; Cheng, X.; Mann, G.E. Effects of 4-Hydroxynonenal on Vascular Endothelial and Smooth Muscle Cell Redox Signaling and Function in Health and Disease. Redox Biol. 2013, 1, 319–331. [Google Scholar] [CrossRef]
- Mehta, D.; Malik, A.B. Signaling Mechanisms Regulating Endothelial Permeability. Physiol. Rev. 2006, 86, 279–367. [Google Scholar] [CrossRef]
- Milkovic, L.; Cipak Gasparovic, A.; Zarkovic, N. Overview on Major Lipid Peroxidation Bioactive Factor 4-Hydroxynonenal as Pluripotent Growth-Regulating Factor. Free Radic. Res. 2015, 49, 850–860. [Google Scholar] [CrossRef] [PubMed]
- Žarković, K.; Žarković, N.; Schlag, G.; Redl, H.; Waeg, G. Histological Aspects of Sepsis—Induced Brain Changes in a Baboon Model. In Shock, Sepsis and Organ Failure—Brain Damage Secondary to Hemorrhagic—Traumatic Shock, Sepsis, and Traumatic Brain Injury; Schlag, G., Redl, H., Traber, D., Eds.; Springer: Heidelberg/Berlin, Germany, 1997; pp. 146–164. ISBN 3-540-62419-8. [Google Scholar]
- Mertsch, K.; Blasig, I.; Grune, T. 4-Hydroxynonenal Impairs the Permeability of an in Vitro Rat Blood-Brain Barrier. Neurosci. Lett. 2001, 314, 135–138. [Google Scholar] [CrossRef]
- Usatyuk, P.V.; Parinandi, N.L.; Natarajan, V. Redox Regulation of 4-Hydroxy-2-Nonenal-Mediated Endothelial Barrier Dysfunction by Focal Adhesion, Adherens, and Tight Junction Proteins. J. Biol. Chem. 2006, 281, 35554–35566. [Google Scholar] [CrossRef] [PubMed]
- Reinhold, A.; Rittner, H. Barrier Function in the Peripheral and Central Nervous System—A Review. Pflügers Arch. Eur. J. Physiol. 2017, 469, 123–134. [Google Scholar] [CrossRef]
- Greene, C.; Campbell, M. Tight Junction Modulation of the Blood Brain Barrier: CNS Delivery of Small Molecules. Tissue Barriers 2016, 4, e1138017. [Google Scholar] [CrossRef] [PubMed]
- Greene, C.; Hanley, N.; Campbell, M. Claudin-5: Gatekeeper of Neurological Function. Fluids Barriers CNS 2019, 16, 3. [Google Scholar] [CrossRef] [PubMed]
- Suc, I.; Meilhac, O.; Lajoie-Mazenc, I.; Vandaele, J.; Ju, N.; Salvayre, R.; Ne, A.; Jürgens, G.; Salvayre, R.; Nègre-Salvayre, A. Activation of EGF Receptor by Oxidized LDL. FASEB J. 1998, 12, 665–671. [Google Scholar] [CrossRef]
- Liu, W.; Wang, P.; Shang, C.; Chen, L.; Cai, H.; Ma, J.; Yao, Y.; Shang, X.; Xue, Y. Endophilin-1 Regulates Blood–Brain Barrier Permeability by Controlling ZO-1 and Occludin Expression via the EGFR–ERK1/2 Pathway. Brain Res. 2014, 1573, 17–26. [Google Scholar] [CrossRef]
- Campbell, S.D.; Regina, K.J.; Kharasch, E.D. Significance of Lipid Composition in a Blood-Brain Barrier–Mimetic PAMPA Assay. J. Biomol. Screen. 2014, 19, 437–444. [Google Scholar] [CrossRef]
- Tayarani, I.; Chaudiere, J.; Lefauconnier, J.M.; Bourre, J.M. Enzymatic Protection against Peroxidative Damage in Isolated Brain Capillaries. J. Neurochem. 1987, 48, 1399–1402. [Google Scholar] [CrossRef]
- Ishikado, A.; Nishio, Y.; Morino, K.; Ugi, S.; Kondo, H.; Makino, T.; Kashiwagi, A.; Maegawa, H. Low Concentration of 4-Hydroxy Hexenal Increases Heme Oxygenase-1 Expression through Activation of Nrf2 and Antioxidative Activity in Vascular Endothelial Cells. Biochem. Biophys. Res. Commun. 2010, 402, 99–104. [Google Scholar] [CrossRef] [PubMed]
- Kim, W.D.; Kim, Y.W.; Cho, I.J.; Lee, C.H.; Kim, S.G. E-Cadherin Inhibits Nuclear Accumulation of Nrf2: Implications for Chemoresistance of Cancer Cells. J. Cell Sci. 2012, 125, 1284–1295. [Google Scholar] [CrossRef]
- Xu, H.; Liu, Q.; Du, J.; Shi, Y.; Pritchard, K.A.; Weihrauch, D. Changes in Endothelial Cell Surface Proteins in Response to Oxidatively Modified Fibronectin. FASEB J. 2011, 25, S21–S39. [Google Scholar] [CrossRef]
- Malone, P.E.; Hernandez, M.R. 4-Hydroxynonenal, a Product of Oxidative Stress, Leads to an Antioxidant Response in Optic Nerve Head Astrocytes. Exp. Eye Res. 2007, 84, 444–454. [Google Scholar] [CrossRef]
- Vargas, M.R.; Johnson, J. A The Nrf2-ARE Cytoprotective Pathway in Astrocytes. Expert Rev. Mol. Med. 2009, 11, e17. [Google Scholar] [CrossRef]
- Farina, C.; Aloisi, F.; Meinl, E. Astrocytes Are Active Players in Cerebral Innate Immunity. Trends Immunol. 2007, 28, 138–145. [Google Scholar] [CrossRef]
- Bradbury, J. Docosahexaenoic Acid (DHA): An Ancient Nutrient for the Modern Human Brain. Nutrients 2011, 3, 529–554. [Google Scholar] [CrossRef] [PubMed]
- Bernoud, N.; Fenart, L.; Bénistant, C.; Pageaux, J.F.; Dehouck, M.P.; Molière, P.; Lagarde, M.; Cecchelli, R.; Lecerf, J. Astrocytes Are Mainly Responsible for the Polyunsaturated Fatty Acid Enrichment in Blood-Brain Barrier Endothelial Cells in Vitro. J. Lipid Res. 1998, 39, 1816–1824. [Google Scholar] [CrossRef]
- Moore, S.A. Polyunsaturated Fatty Acid Synthesis and Release. J. Mol. Neurosci. 2001, 16, 195–200. [Google Scholar] [CrossRef]
- Das, U.N. Essential Fatty Acids and Their Metabolites as Modulators of Stem Cell Biology with Reference to Inflammation, Cancer, and Metastasis. Cancer Metastasis Rev. 2011, 30, 311–324. [Google Scholar] [CrossRef]
- Martin, D.D.; Robbins, M.E.C.; Spector, A.A.; Wen, B.-C.; Hussey, D.H. The Fatty Acid Composition of Human Gliomas Differs from That Found in Nonmalignant Brain Tissue. Lipids 1996, 31, 1283–1288. [Google Scholar] [CrossRef]
- Elsherbiny, M.E.; Emara, M.; Godbout, R. Interaction of Brain Fatty Acid-Binding Protein with the Polyunsaturated Fatty Acid Environment as a Potential Determinant of Poor Prognosis in Malignant Glioma. Prog. Lipid Res. 2013, 52, 562–570. [Google Scholar] [CrossRef]
- Cazacu, M.; Oniu, T.; Lungoci, C.; Mihailov, A.; Cipak, A.; Klinger, R.; Weiss, T.; Zarkovic, N. The Influence of Isorel on the Advanced Colorectal Cancer. Cancer Biother. Radiopharm. 2003, 18, 27–34. [Google Scholar] [CrossRef] [PubMed]
- Rudić, M.; Milković, L.; Žarković, K.; Borović-Šunjić, S.; Sterkers, O.; Waeg, G.; Ferrary, E.; Bozorg Grayeli, A.; Žarković, N. The Effects of Angiotensin II and the Oxidative Stress Mediator 4-Hydroxynonenal on Human Osteoblast-like Cell Growth: Possible Relevance to Otosclerosis. Free Radic. Biol. Med. 2013, 57, 22–28. [Google Scholar] [CrossRef] [PubMed]
- Bradford, M.M. A Rapid and Sensitive Method for the Quantitation of Microgram Quantities of Protein Utilizing the Principle of Protein-Dye Binding. Anal. Biochem. 1976, 72, 248–254. [Google Scholar] [CrossRef]
- Folch, J.; Lees, M.; Sloane Stanley, G.H. A Simple Method for the Isolation and Purification of Total Lipides from Animal Tissues. J. Biol. Chem. 1957, 226, 497–509. [Google Scholar] [CrossRef]
- Mihaljević, B.; Katusin-Razem, B.; Razem, D. The Reevaluation of the Ferric Thiocyanate Assay for Lipid Hydroperoxides with Special Considerations of the Mechanistic Aspects of the Response. Free Radic. Biol. Med. 1996, 21, 53–63. [Google Scholar] [CrossRef]
- Toropainen, E.; Ranta, V.-P.; Vellonen, K.-S.; Palmgrén, J.; Talvitie, A.; Laavola, M.; Suhonen, P.; Hämäläinen, K.M.; Auriola, S.; Urtti, A. Paracellular and Passive Transcellular Permeability in Immortalized Human Corneal Epithelial Cell Culture Model. Eur. J. Pharm. Sci. 2003, 20, 99–106. [Google Scholar] [CrossRef]
- Tietze, F. Enzymic Method for Quantitative Determination of Nanogram Amounts of Total and Oxidized Glutathione: Applications to Mammalian Blood and Other Tissues. Anal. Biochem. 1969, 27, 502–522. [Google Scholar] [CrossRef]
- Góth, L. A Simple Method for Determination of Serum Catalase Activity and Revision of Reference Range. Clin. Chim. Acta. 1991, 196, 143–151. [Google Scholar] [CrossRef]
- Waeg, G.; Dimsity, G.; Esterbauer, H. Monoclonal Antibodies for Detection of 4-Hydroxynonenal Modified Proteins. Free Radic. Res. 1996, 25, 149–159. [Google Scholar] [CrossRef] [PubMed]
- Zambonin, L.; Ferreri, C.; Cabrini, L.; Prata, C.; Chatgilialoglu, C.; Landi, L. Occurrence of Trans Fatty Acids in Rats Fed a Trans-Free Diet: A Free Radical-Mediated Formation? Free Radic. Biol. Med. 2006, 40, 1549–1556. [Google Scholar] [CrossRef] [PubMed]


Publisher’s Note: MDPI stays neutral with regard to jurisdictional claims in published maps and institutional affiliations. |
© 2022 by the authors. Licensee MDPI, Basel, Switzerland. This article is an open access article distributed under the terms and conditions of the Creative Commons Attribution (CC BY) license (https://creativecommons.org/licenses/by/4.0/).
Share and Cite
Cindrić, M.; Čipak Gašparović, A.; Milković, L.; Bujak, I.T.; Mihaljević, B.; Žarković, N.; Žarković, K. 4-Hydroxynonenal Modulates Blood–Brain Barrier Permeability In Vitro through Changes in Lipid Composition and Oxidative Status of Endothelial Cells and Astrocytes. Int. J. Mol. Sci. 2022, 23, 14373. https://doi.org/10.3390/ijms232214373
Cindrić M, Čipak Gašparović A, Milković L, Bujak IT, Mihaljević B, Žarković N, Žarković K. 4-Hydroxynonenal Modulates Blood–Brain Barrier Permeability In Vitro through Changes in Lipid Composition and Oxidative Status of Endothelial Cells and Astrocytes. International Journal of Molecular Sciences. 2022; 23(22):14373. https://doi.org/10.3390/ijms232214373
Chicago/Turabian StyleCindrić, Marina, Ana Čipak Gašparović, Lidija Milković, Ivana Tartaro Bujak, Branka Mihaljević, Neven Žarković, and Kamelija Žarković. 2022. "4-Hydroxynonenal Modulates Blood–Brain Barrier Permeability In Vitro through Changes in Lipid Composition and Oxidative Status of Endothelial Cells and Astrocytes" International Journal of Molecular Sciences 23, no. 22: 14373. https://doi.org/10.3390/ijms232214373
APA StyleCindrić, M., Čipak Gašparović, A., Milković, L., Bujak, I. T., Mihaljević, B., Žarković, N., & Žarković, K. (2022). 4-Hydroxynonenal Modulates Blood–Brain Barrier Permeability In Vitro through Changes in Lipid Composition and Oxidative Status of Endothelial Cells and Astrocytes. International Journal of Molecular Sciences, 23(22), 14373. https://doi.org/10.3390/ijms232214373