

Obtaining Highly Active Catalytic Antibodies Capable of Enzymatically Cleaving Antigens

Abstract
1. Introduction
2. Results
2.1. #7TR Light Chain
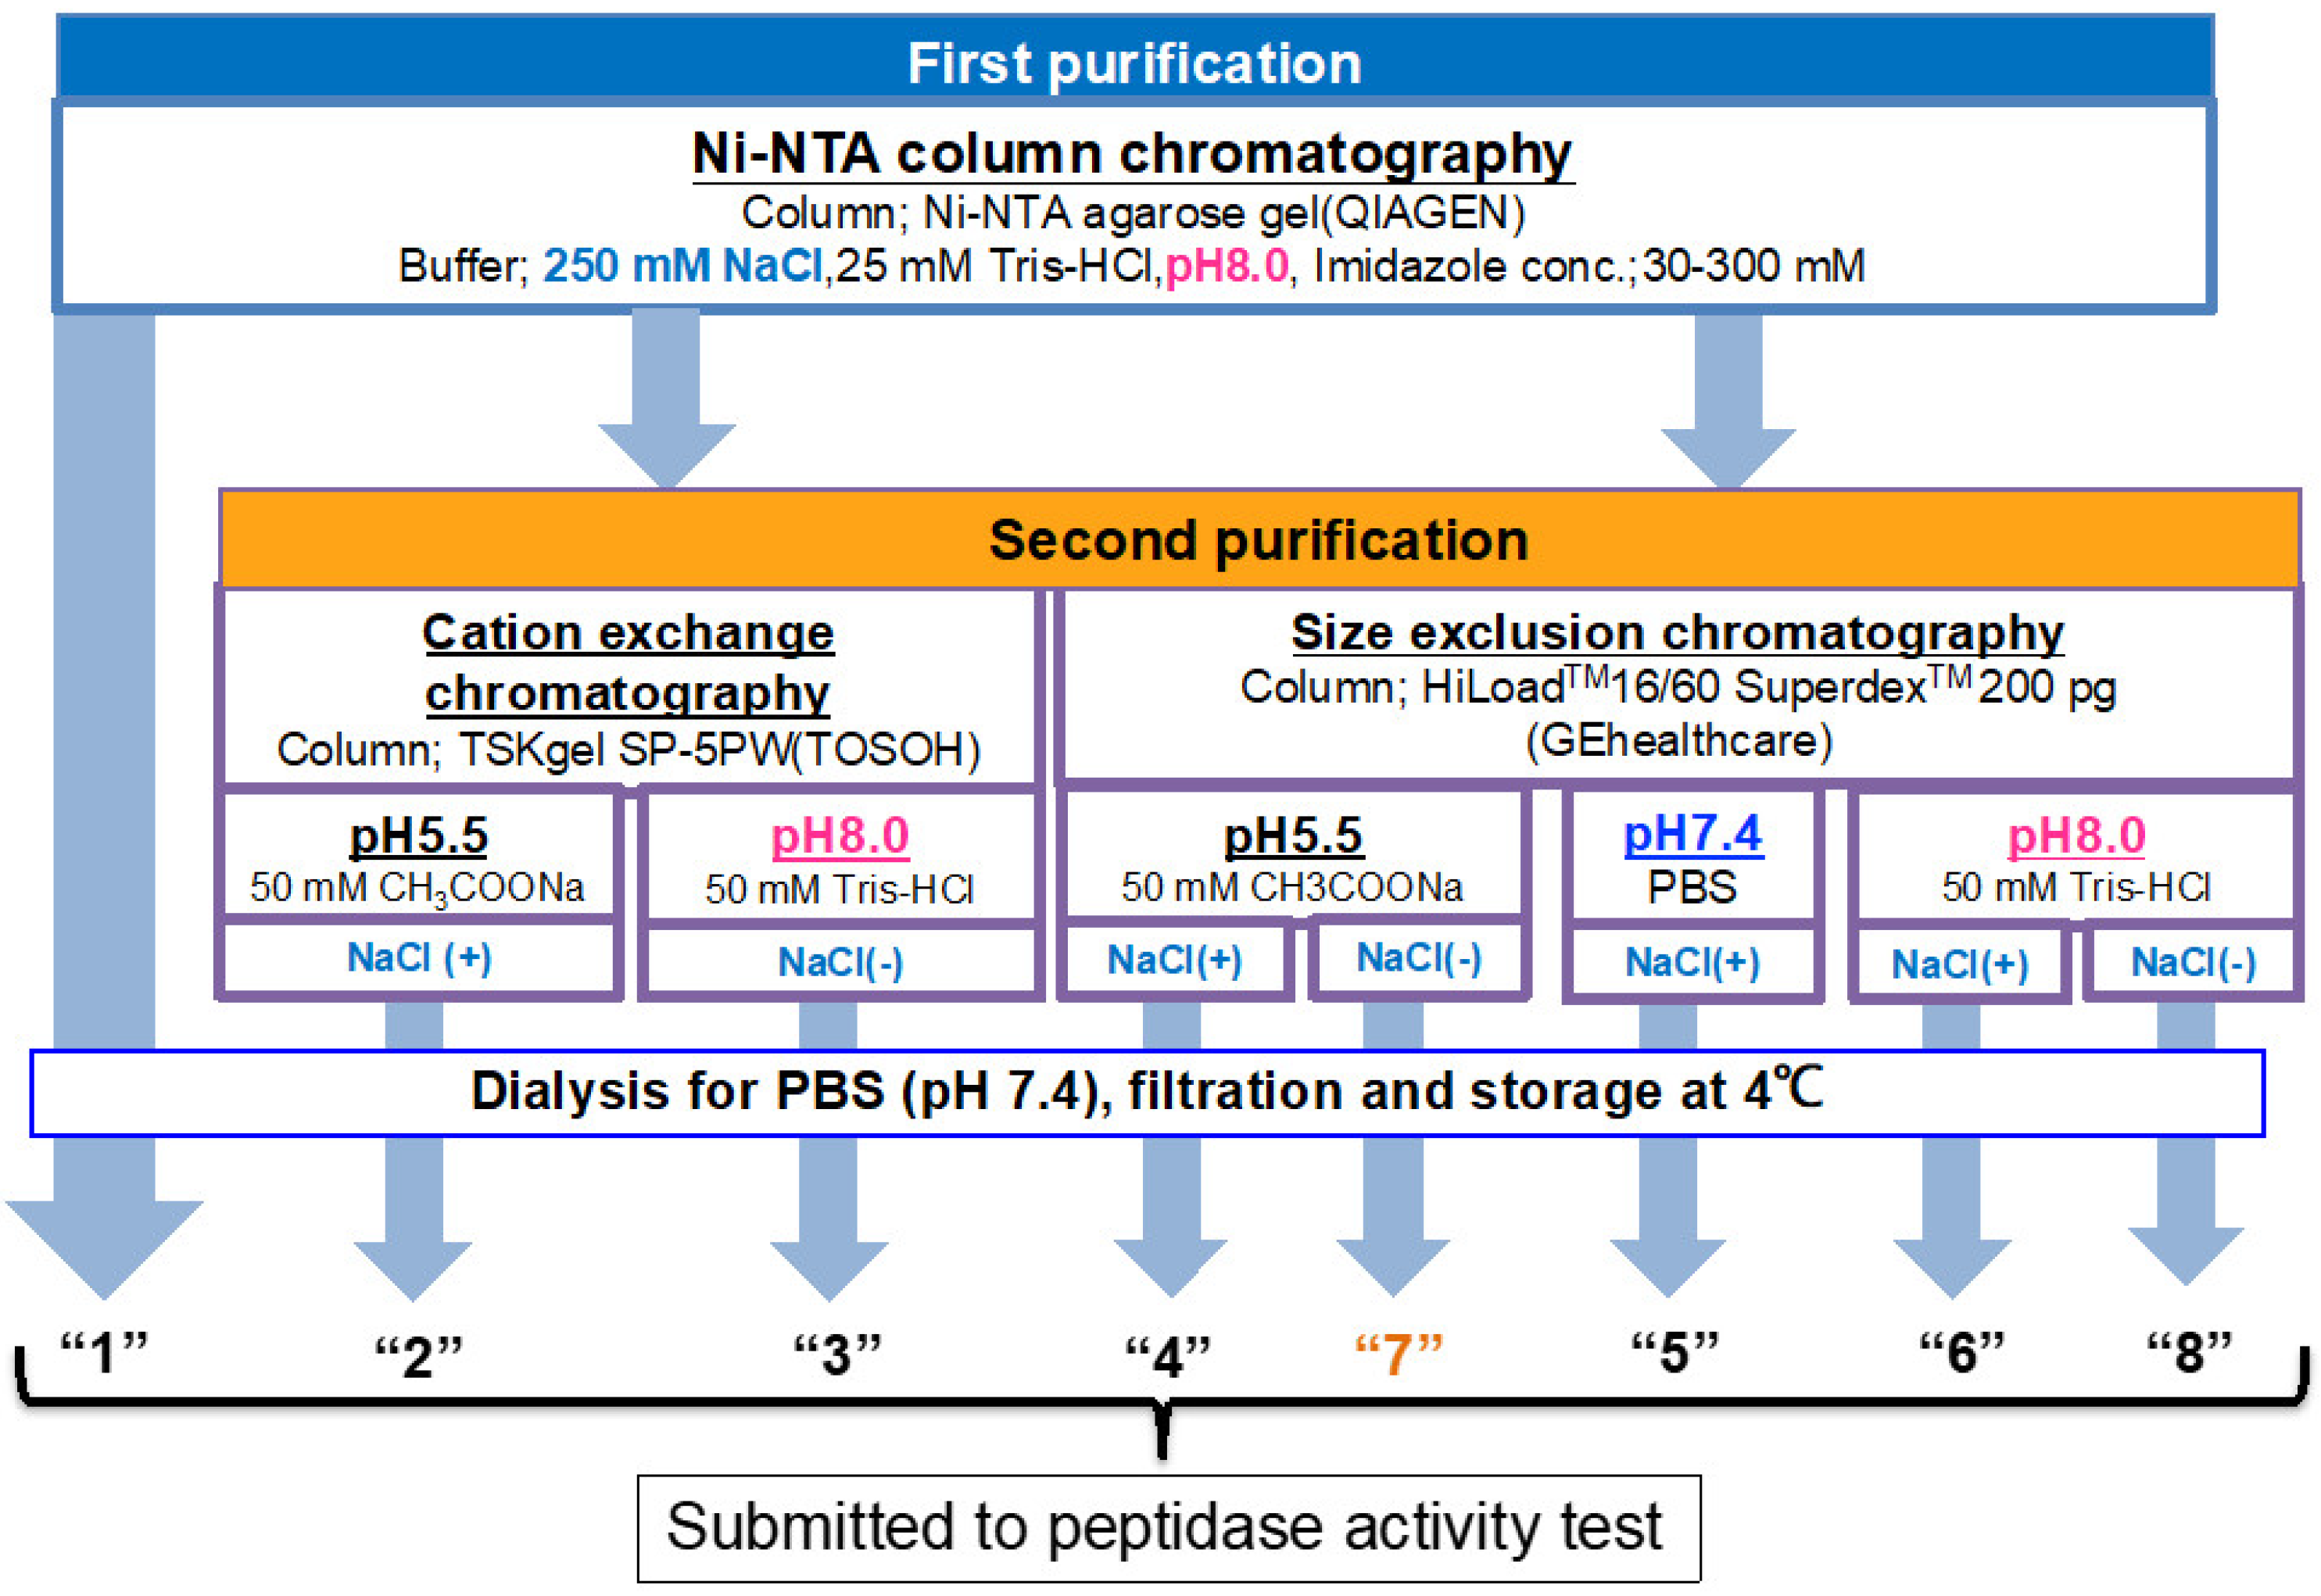
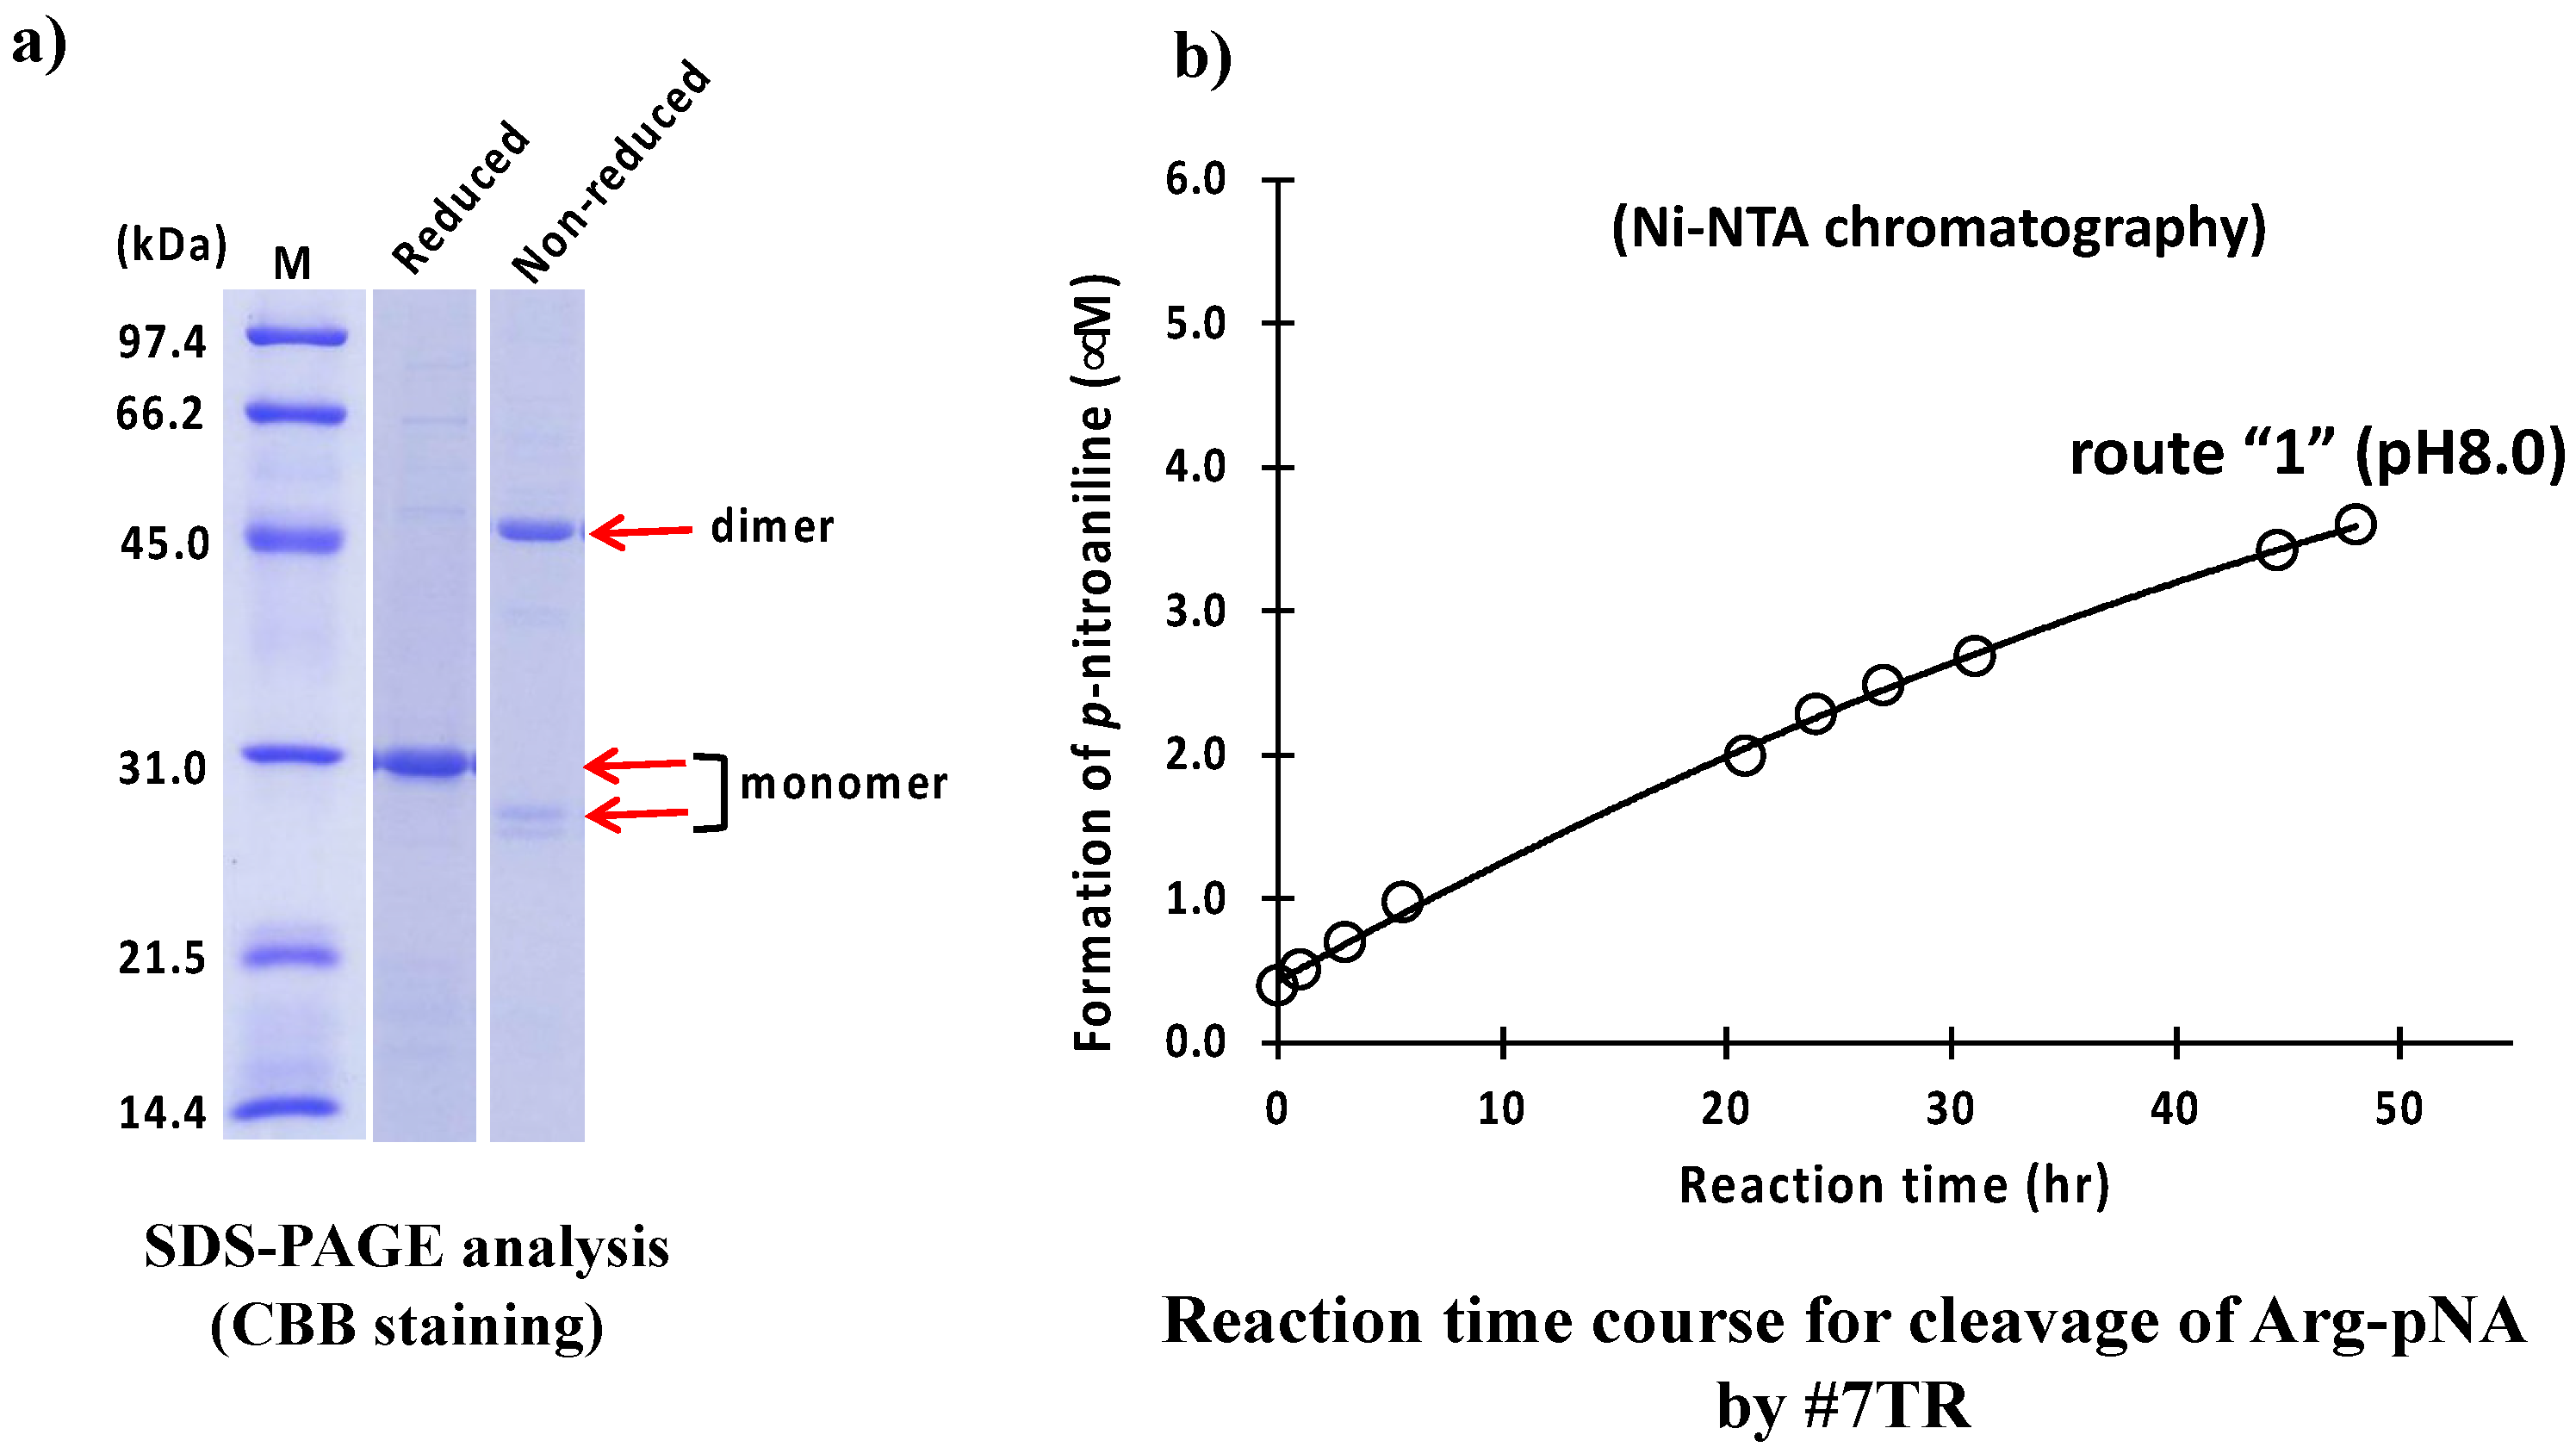
2.1.1. Ni-NTA Column Chromatography (Route “1”)
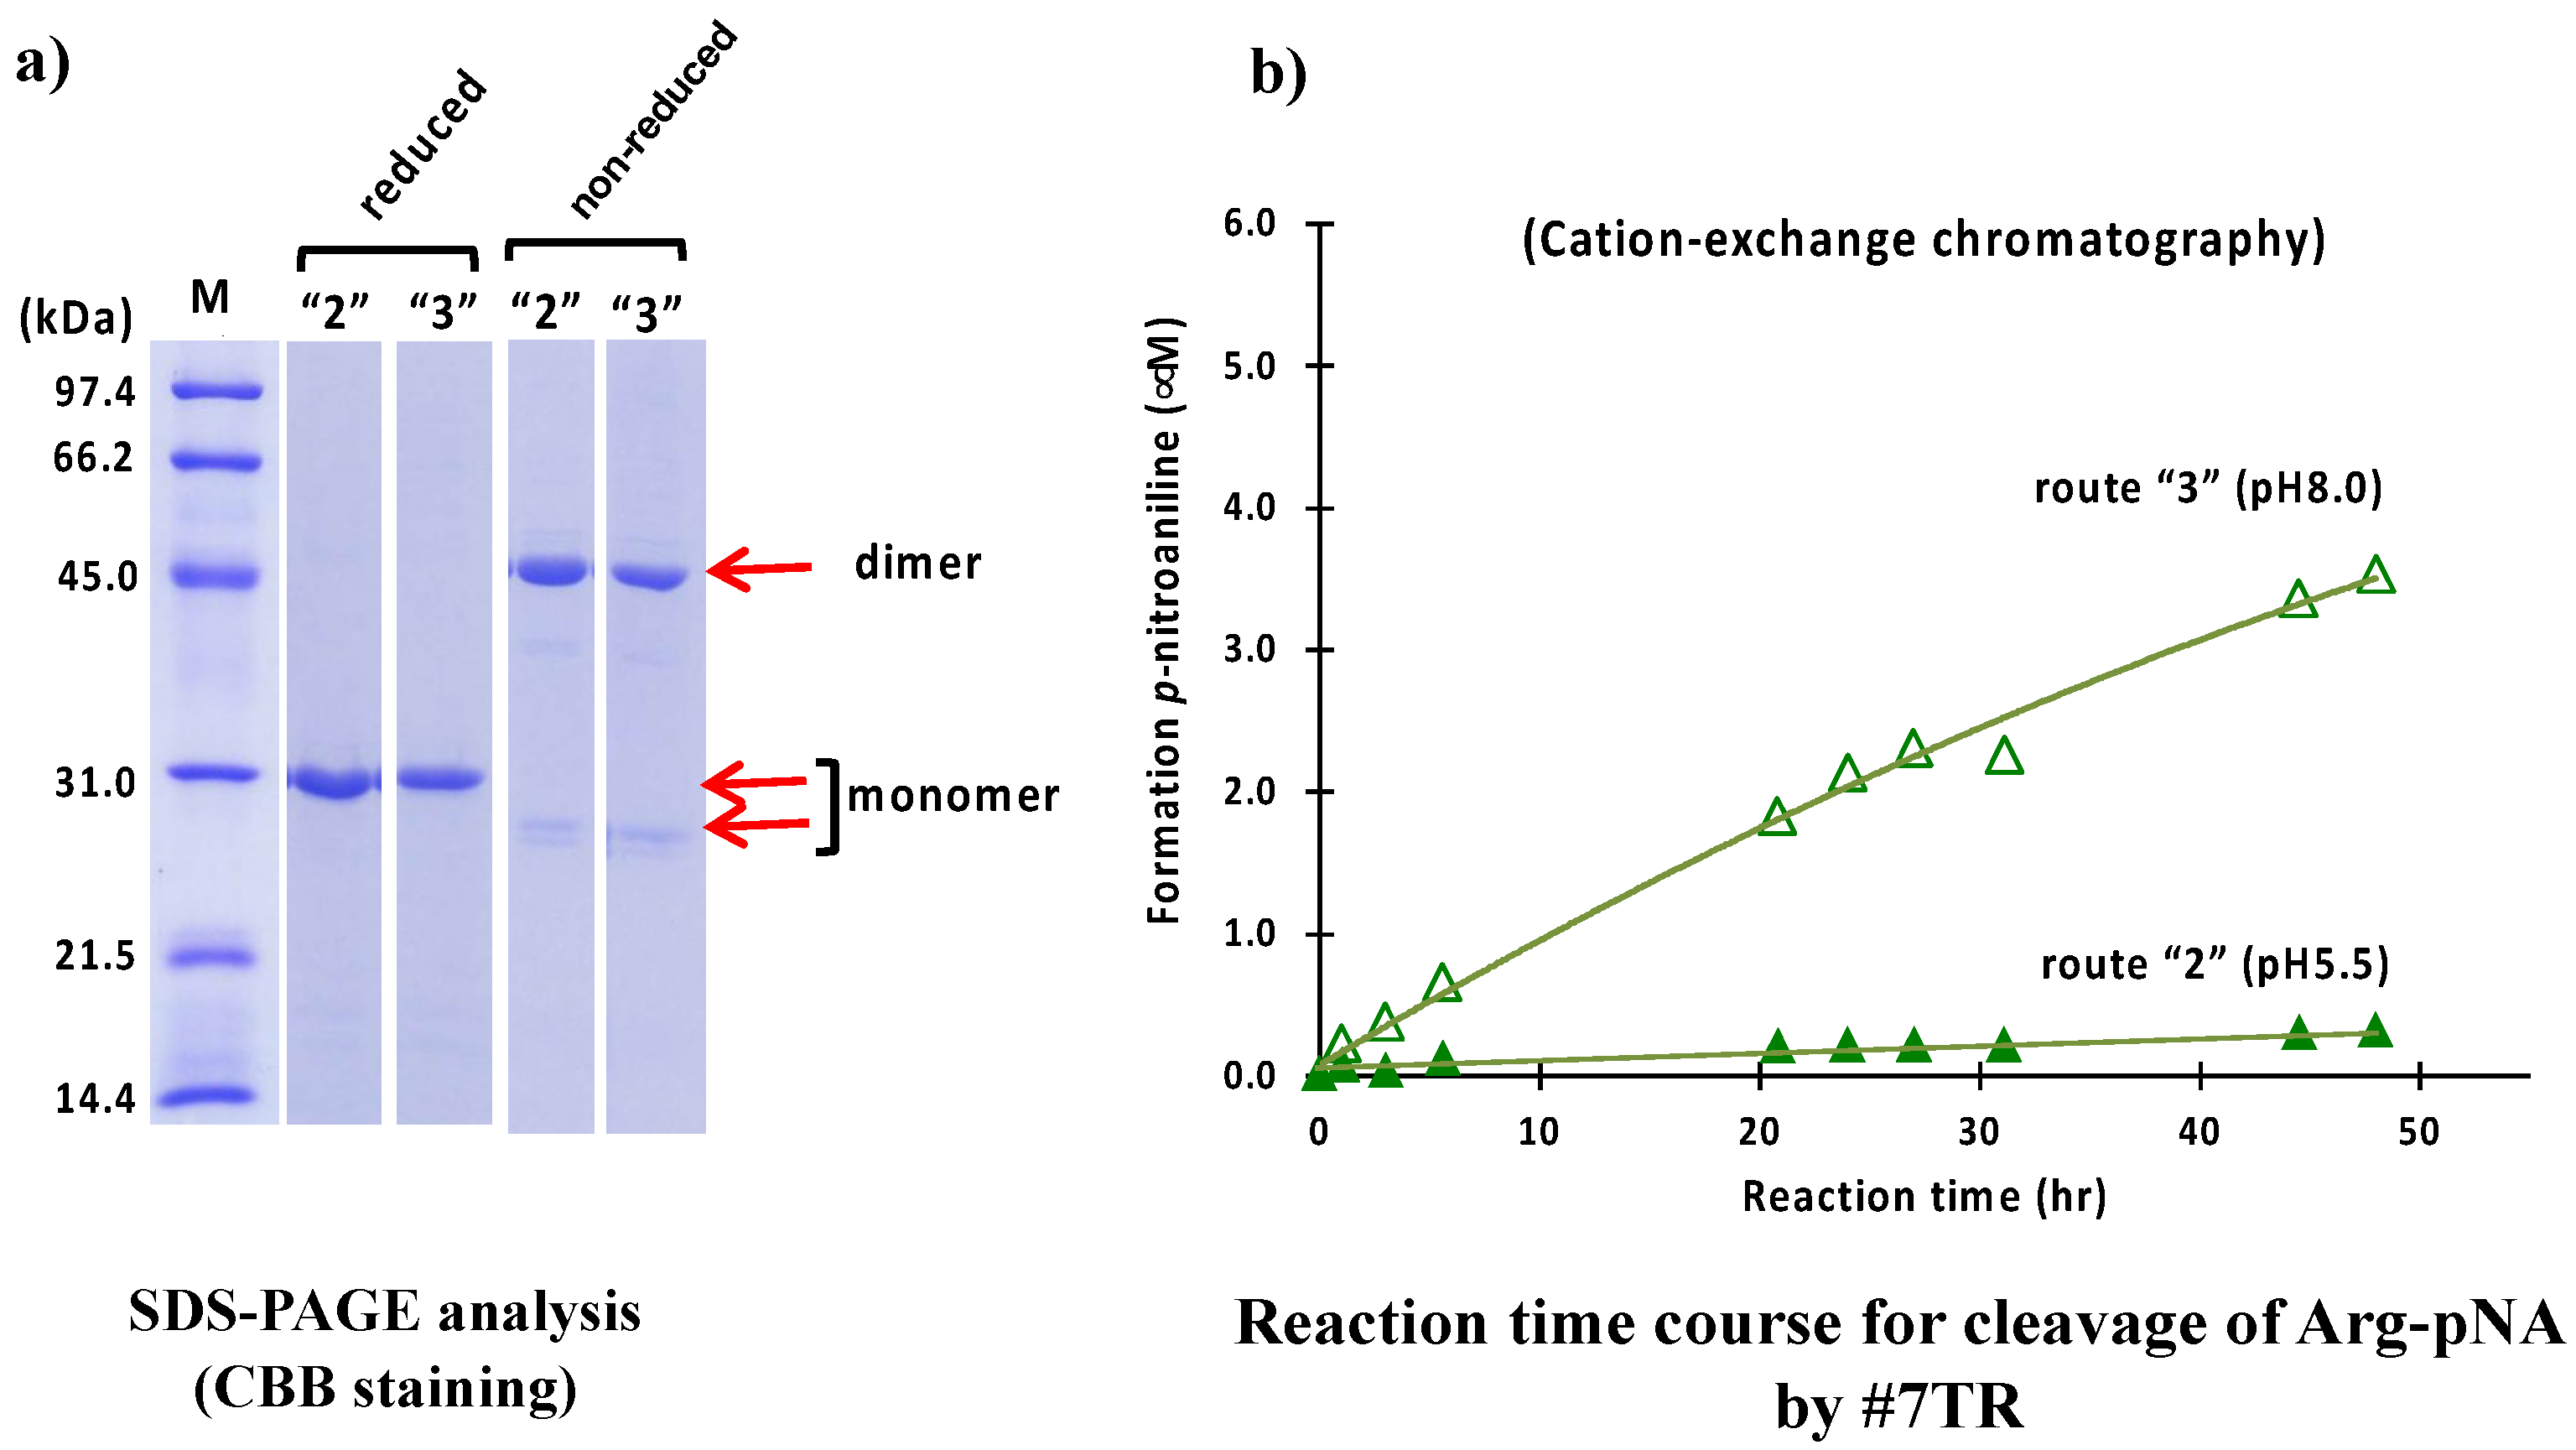
2.1.2. Cation Exchange Chromatography (as a Second Step Purification)
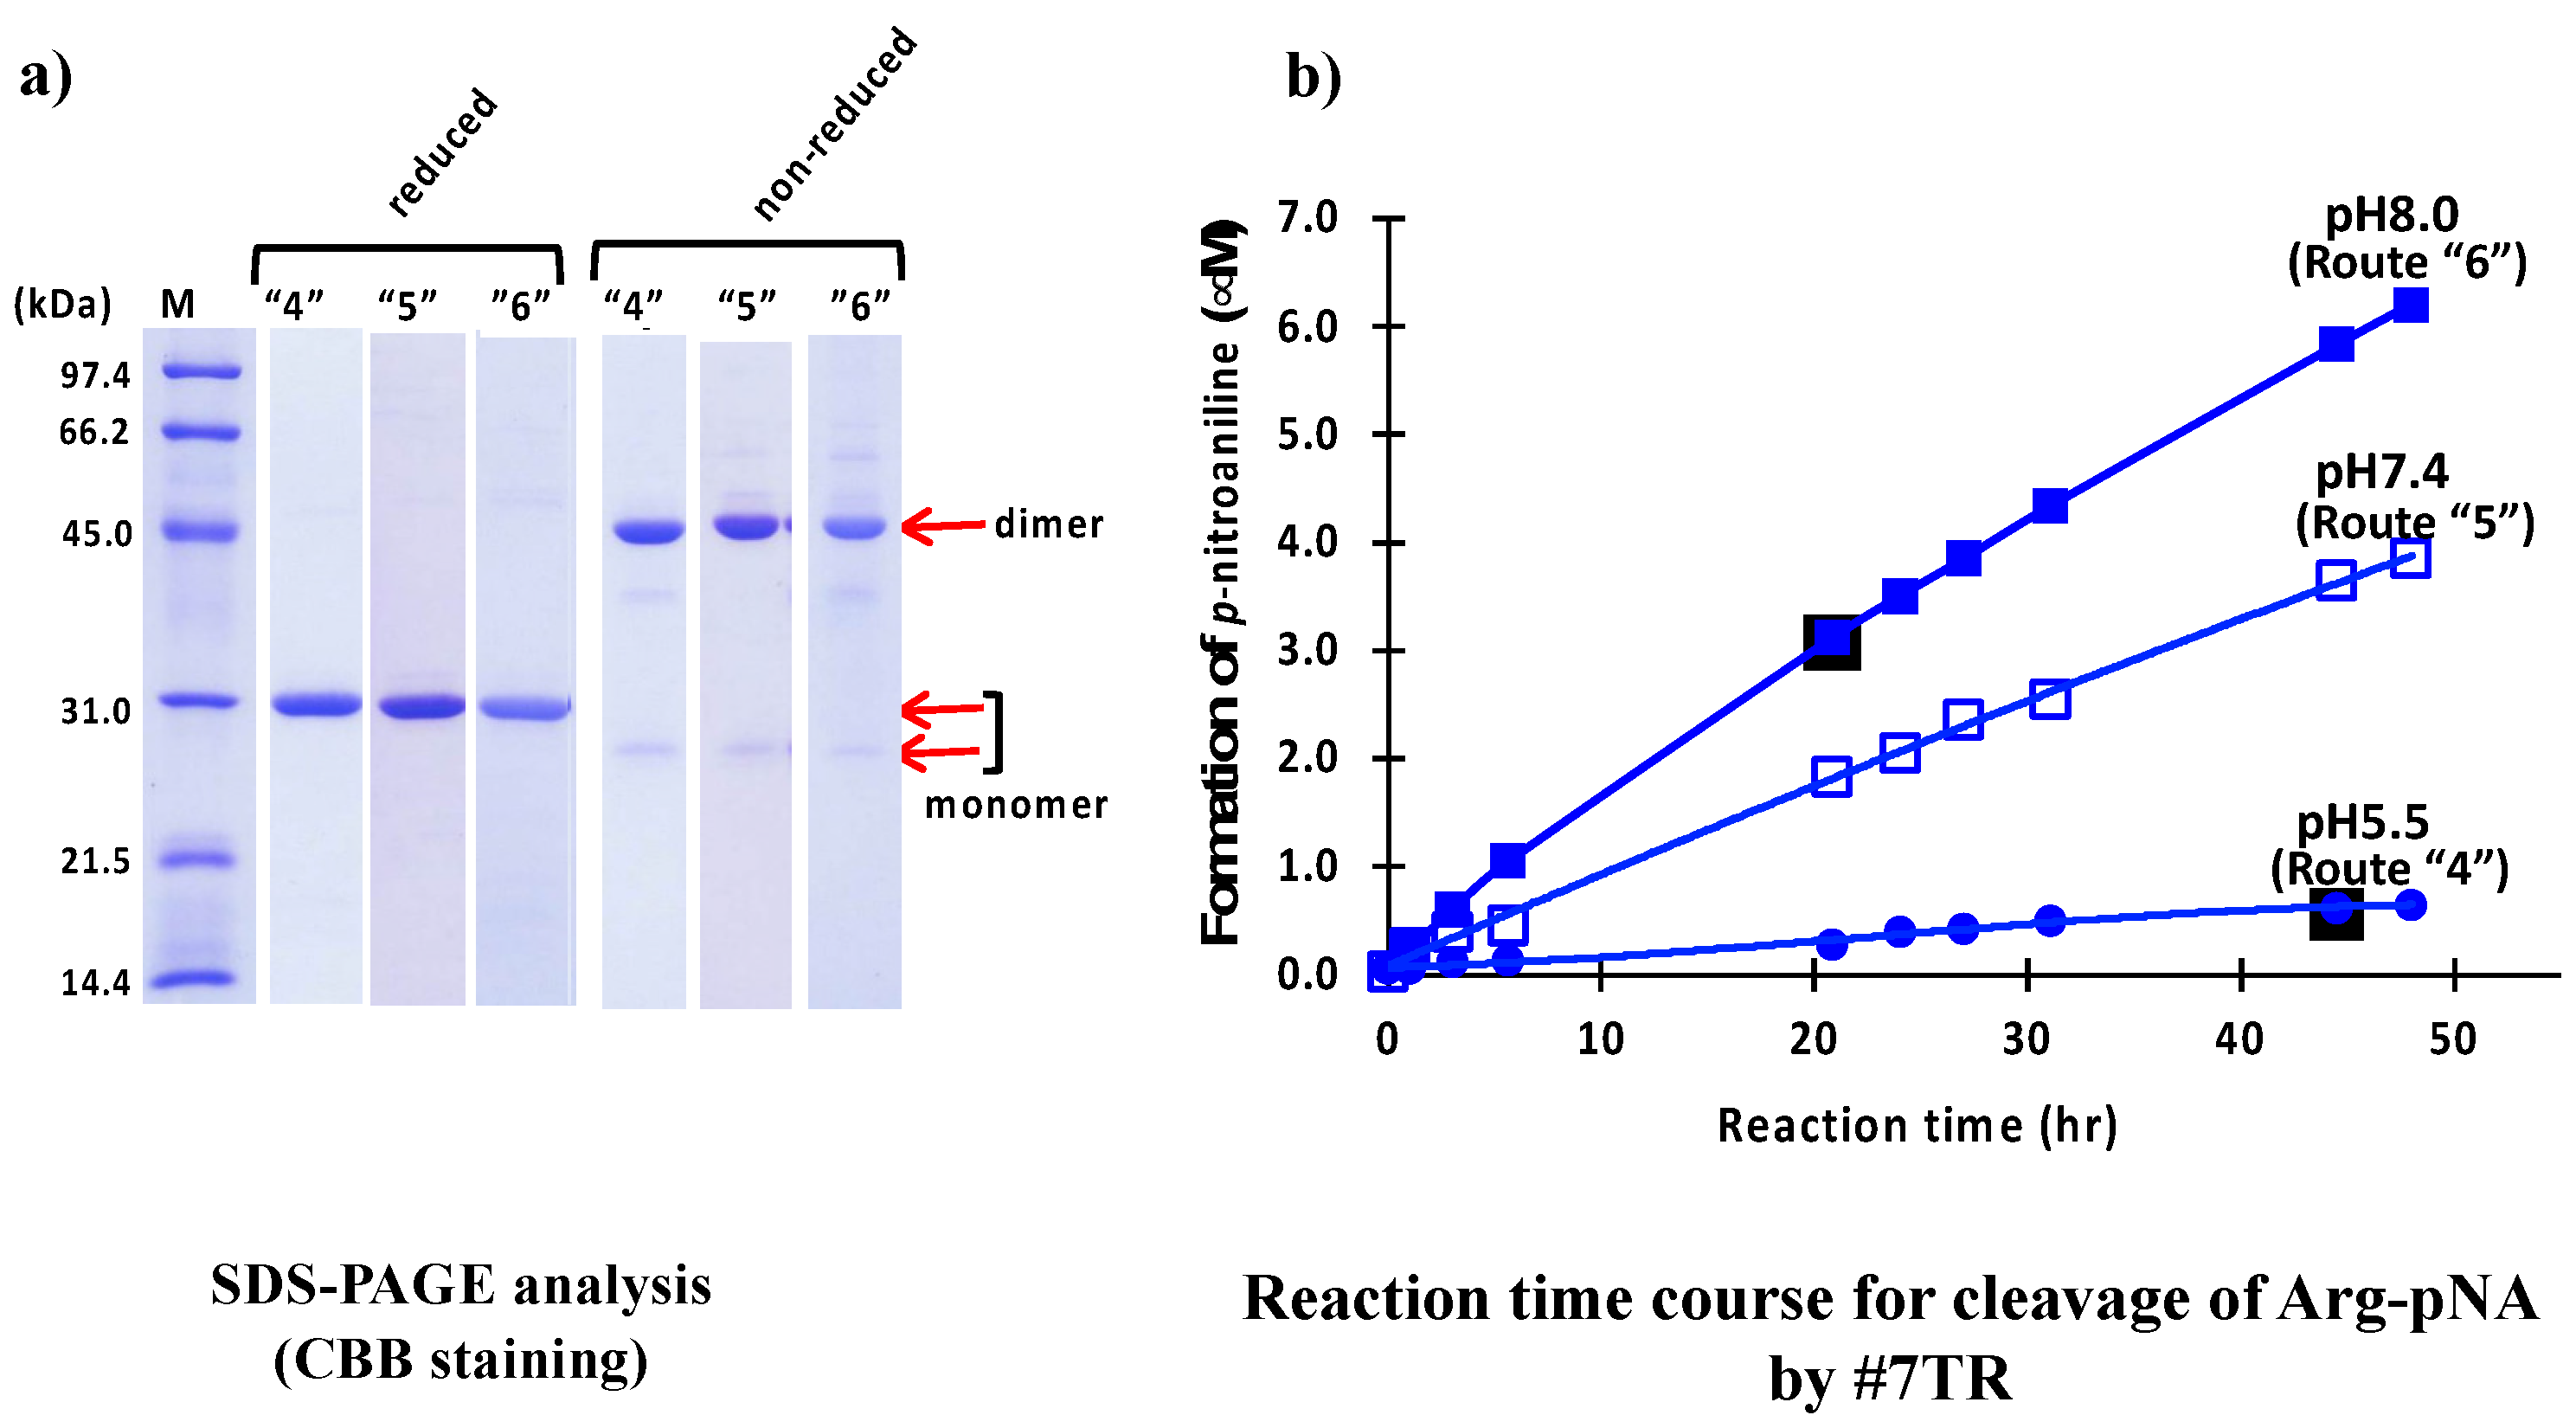
2.1.3. Size-Exclusion Chromatography (as the Second Step Purification)
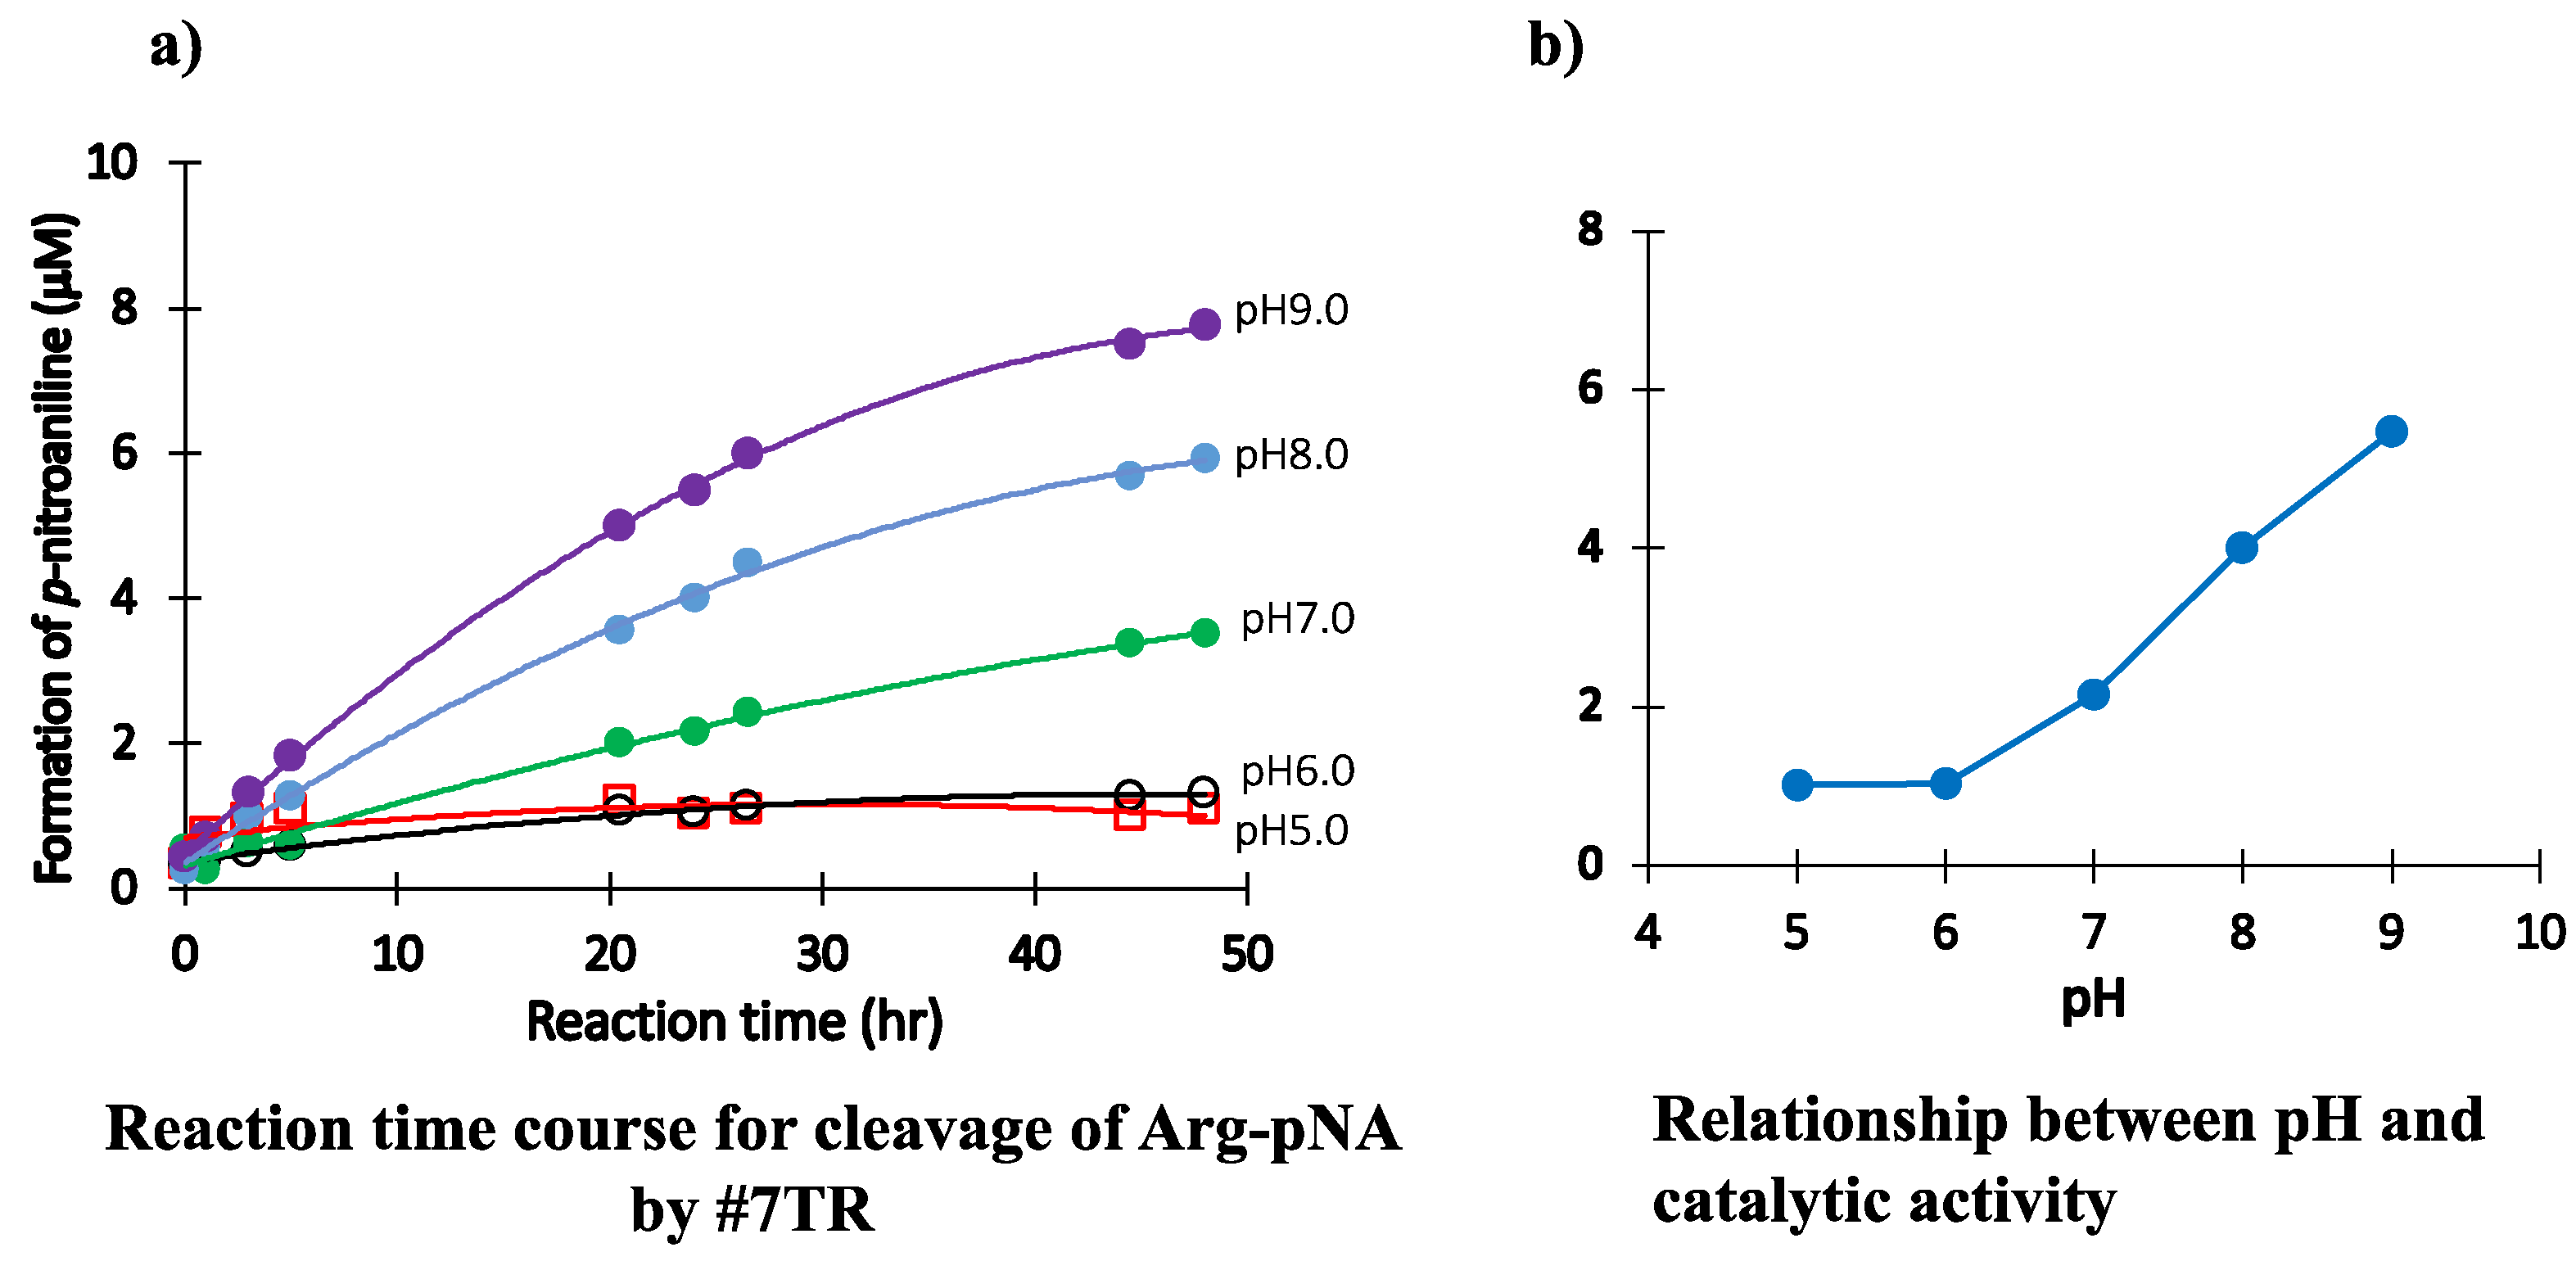
2.1.4. pH Dependency
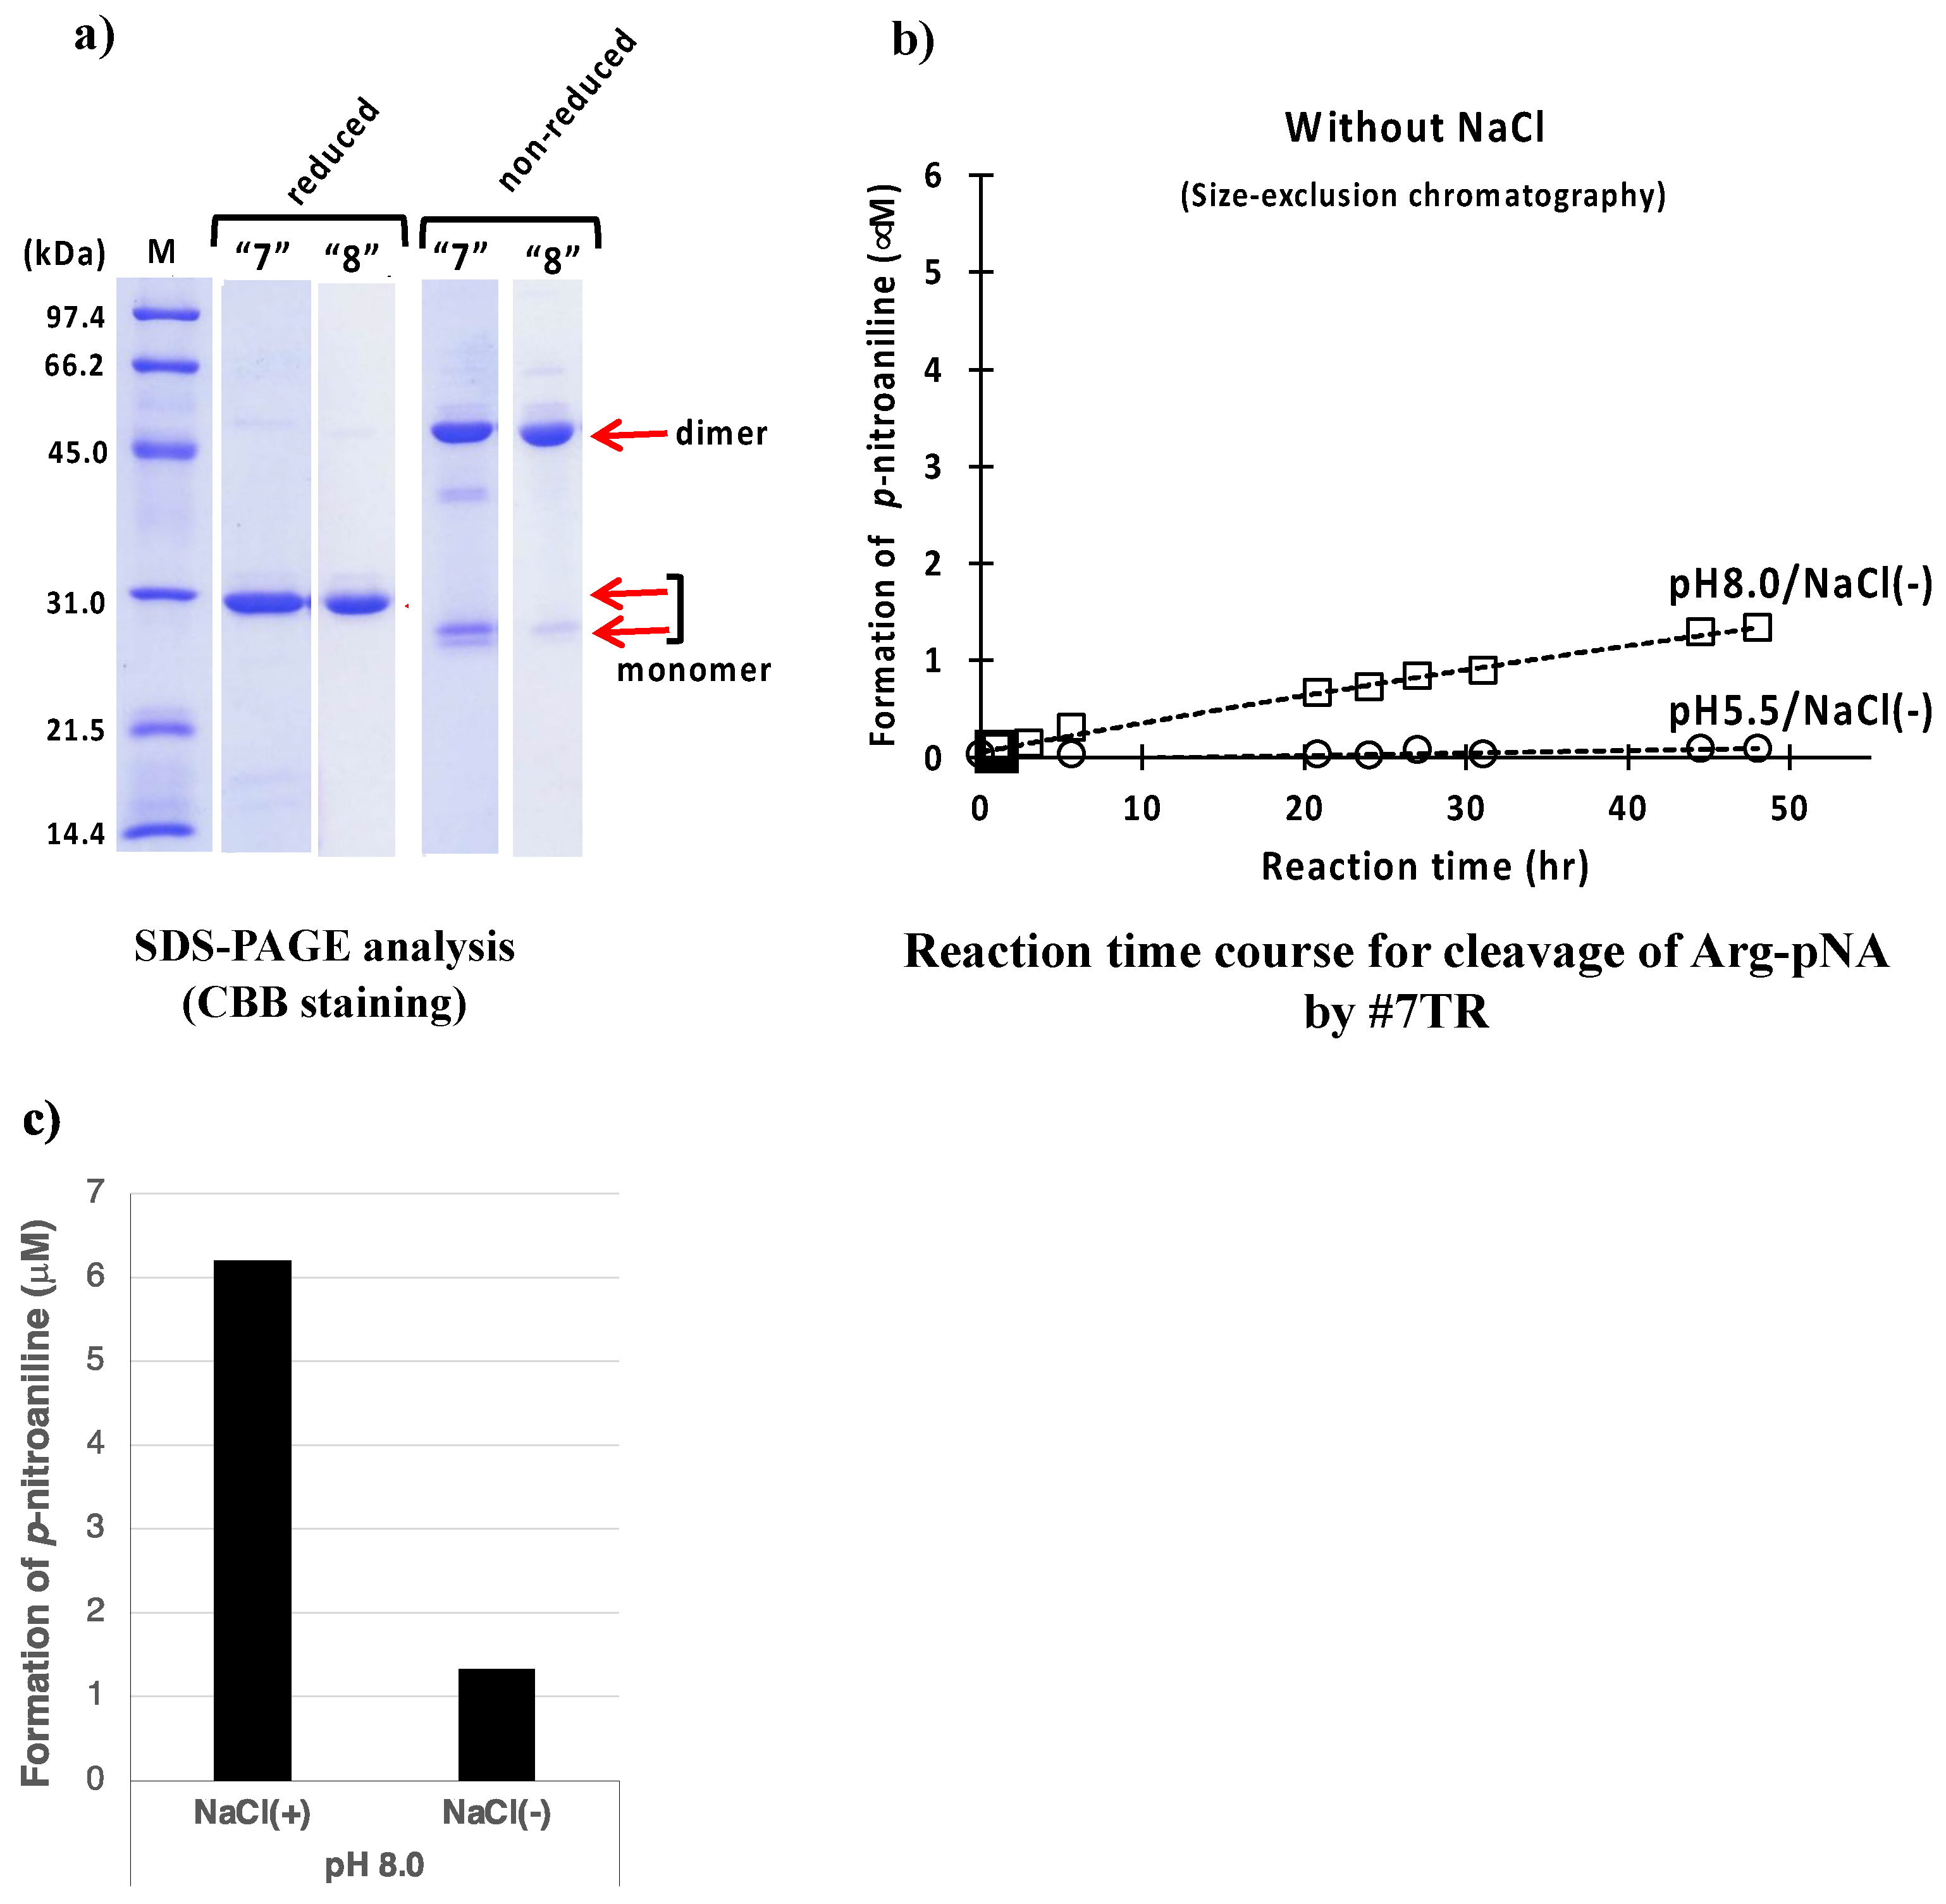
2.1.5. Effect of Other Components (Reagents)
NaCl
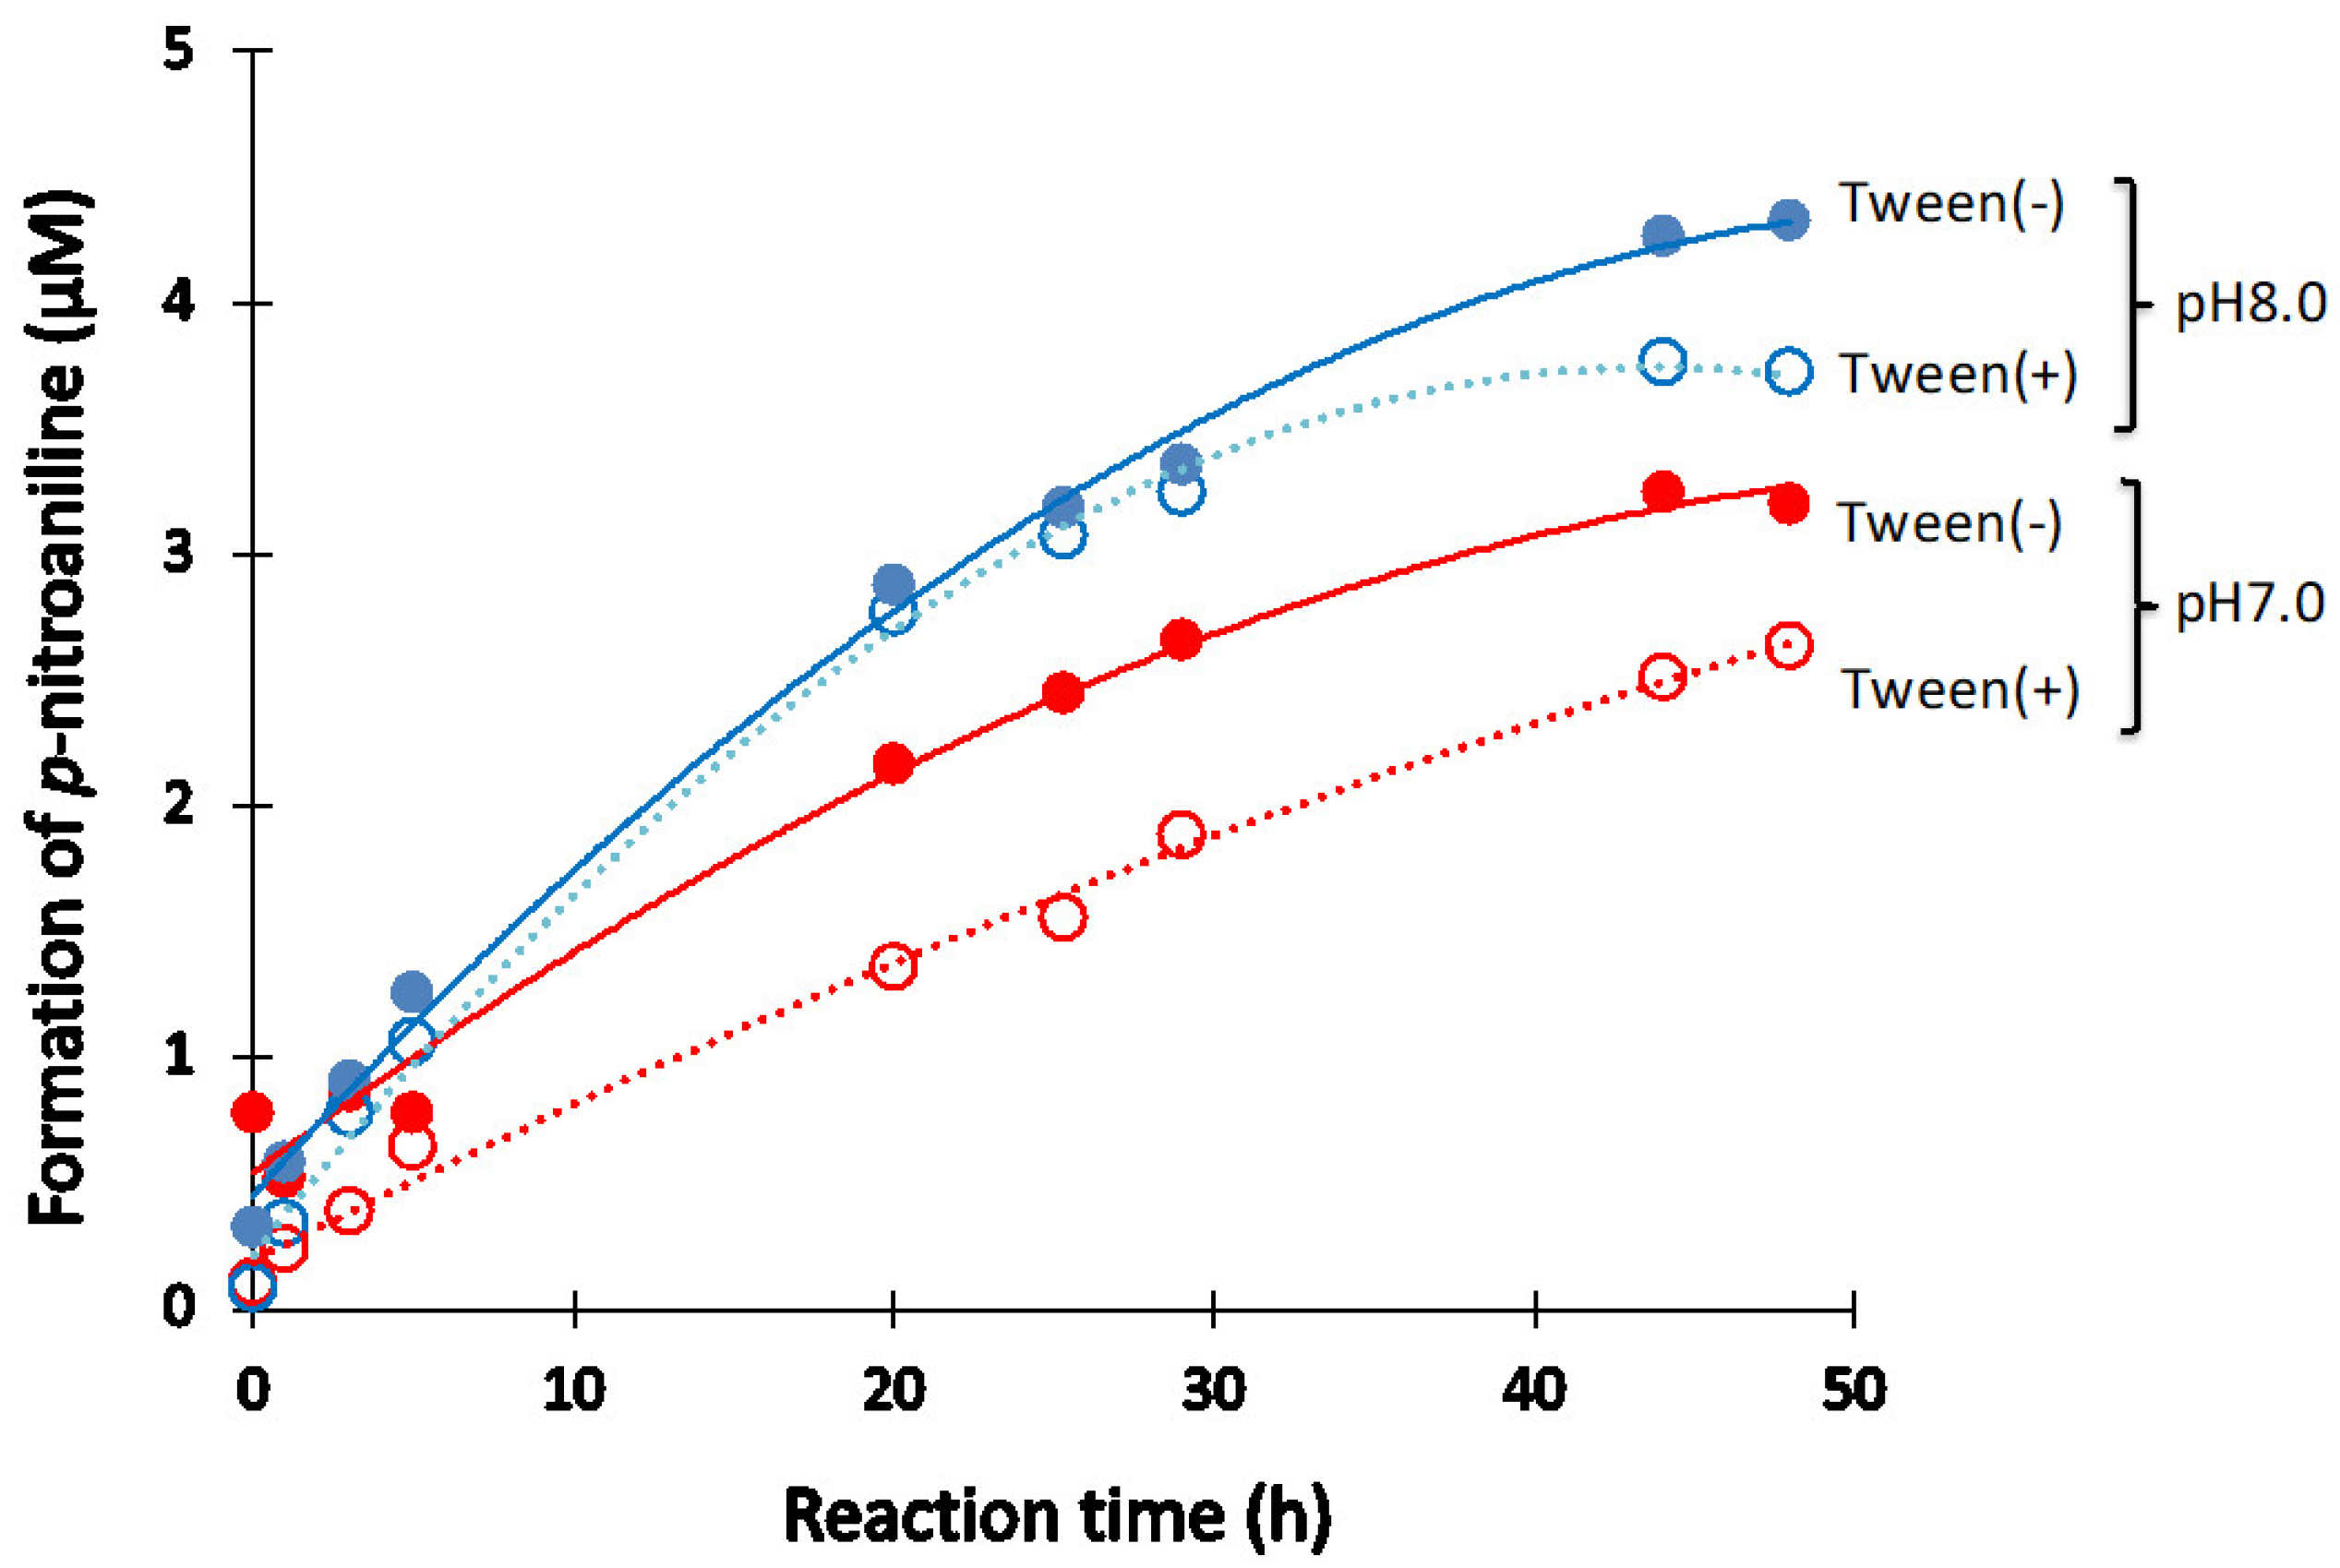
Tween-20
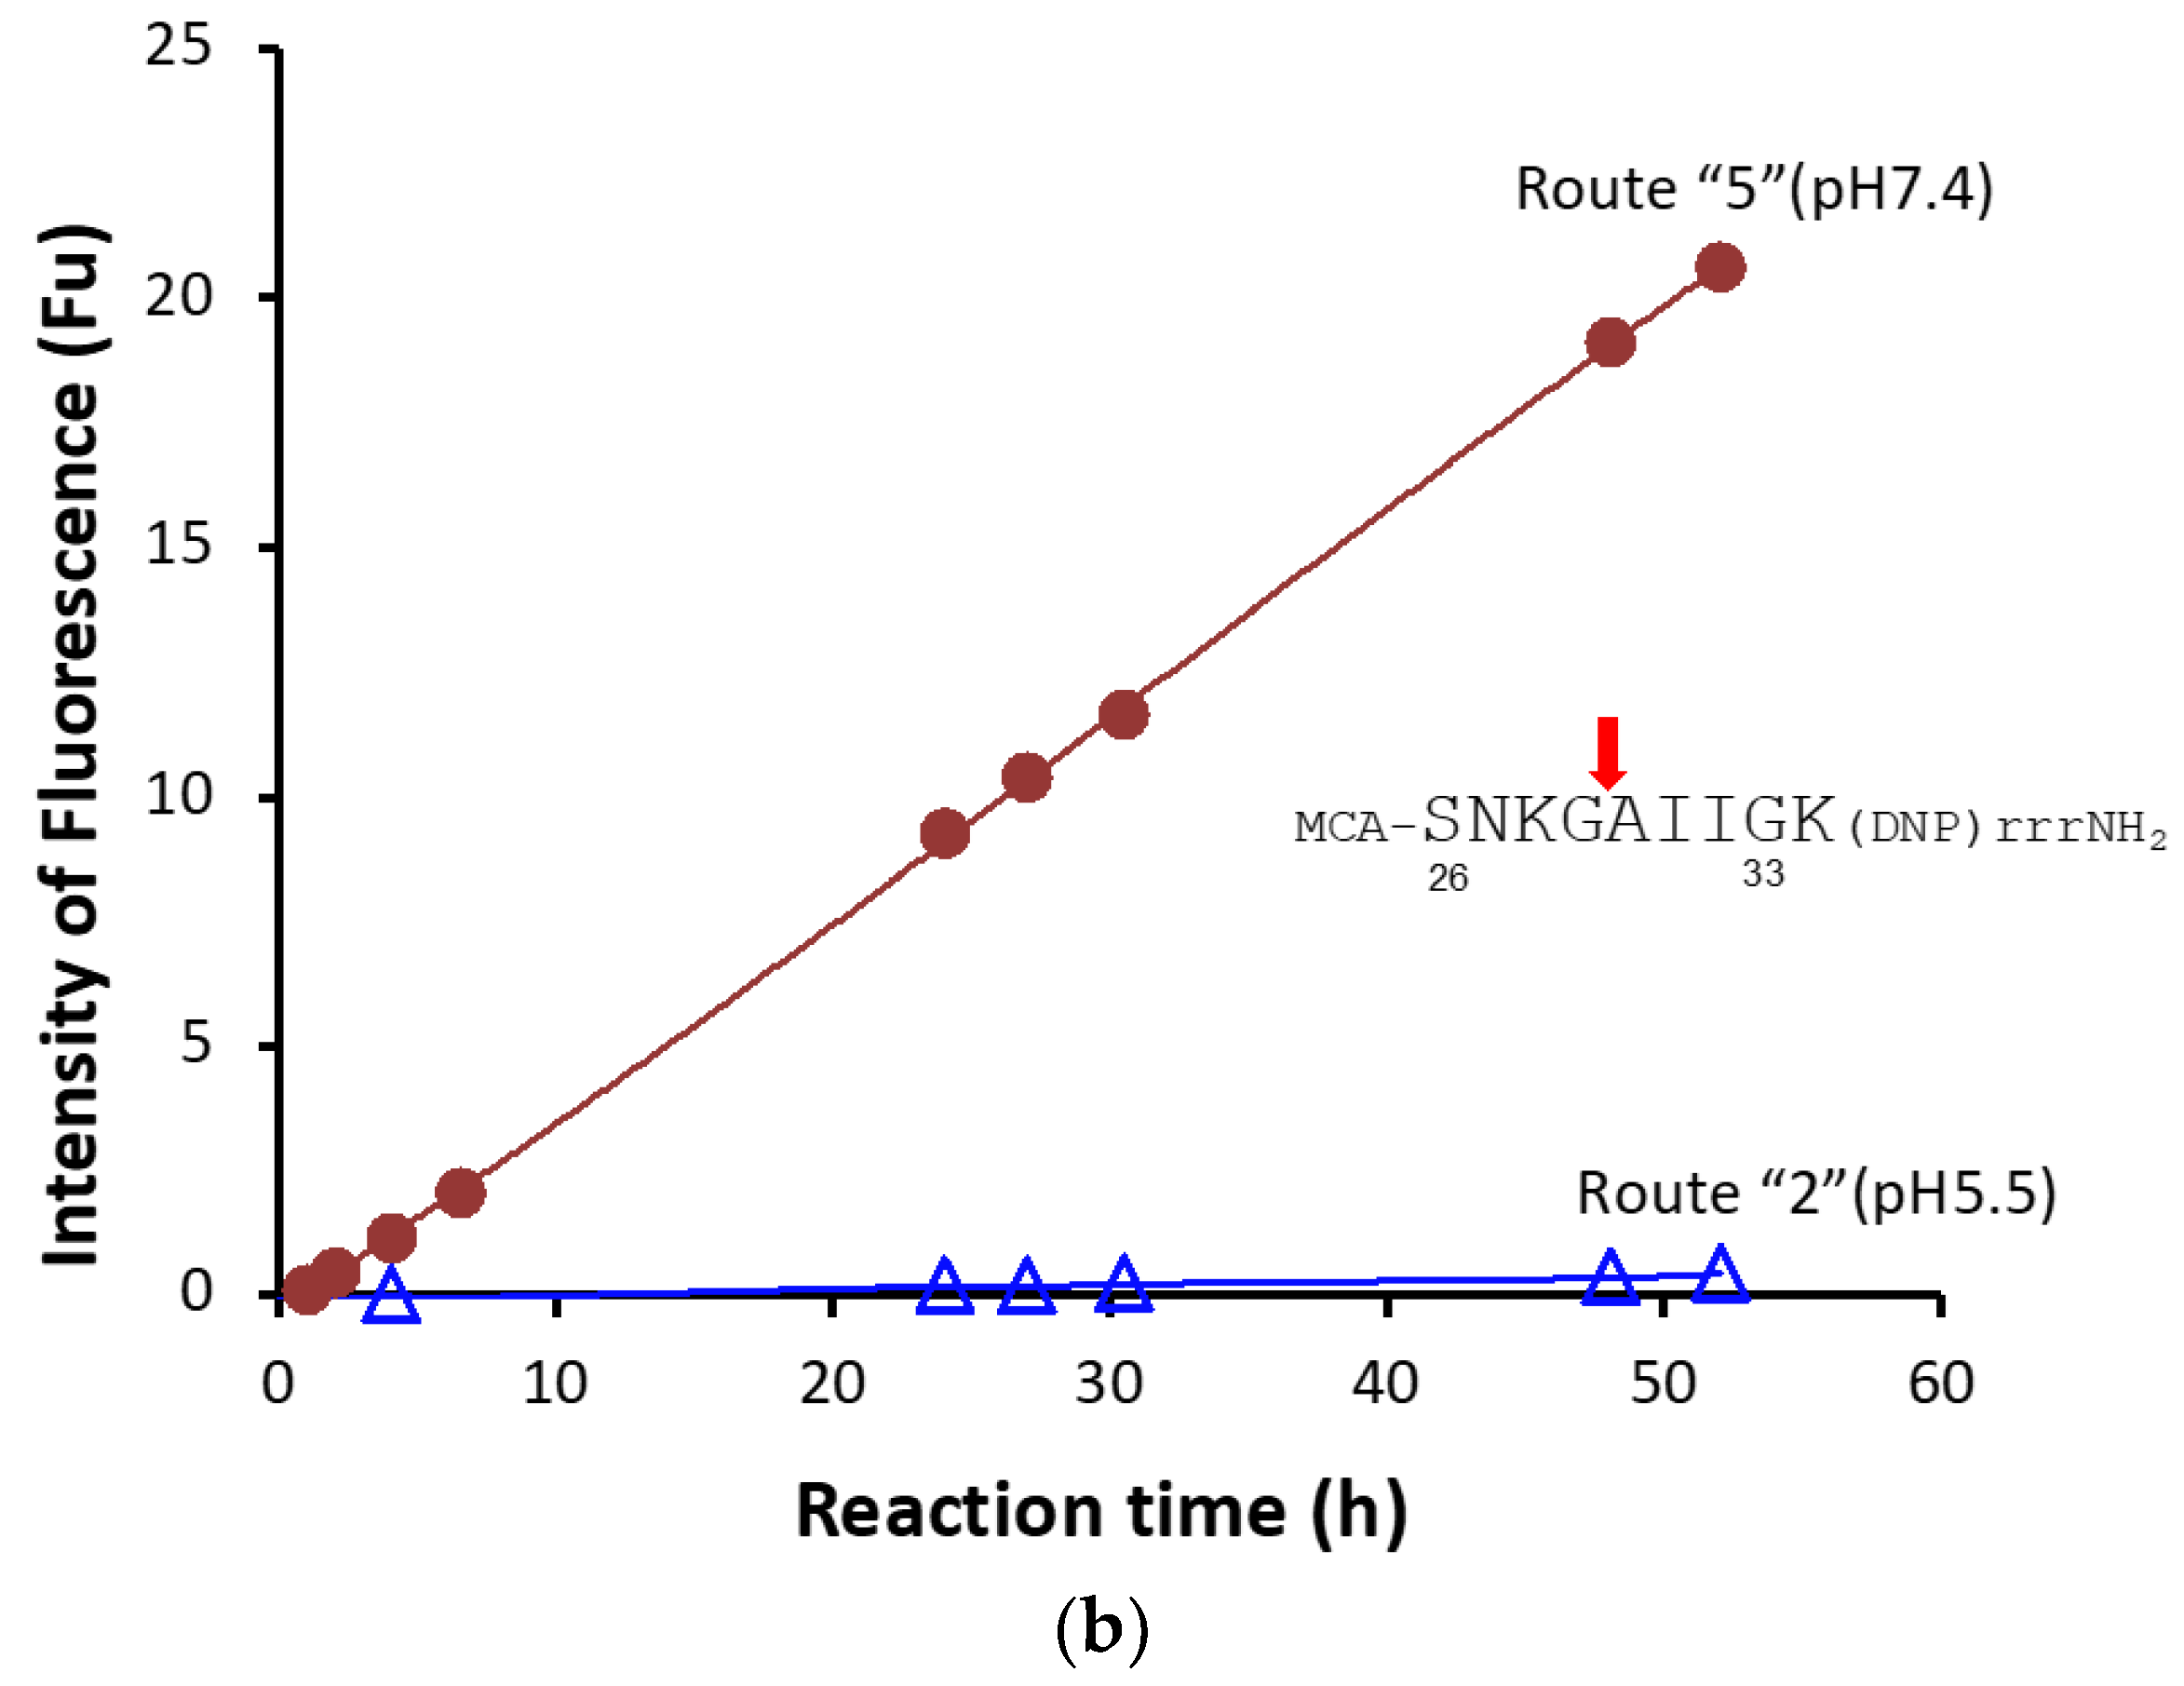
2.1.6. Kinetics Using #7TR Purified by Route ”5” (pH 7.4)
2.2. H34 Light Chain
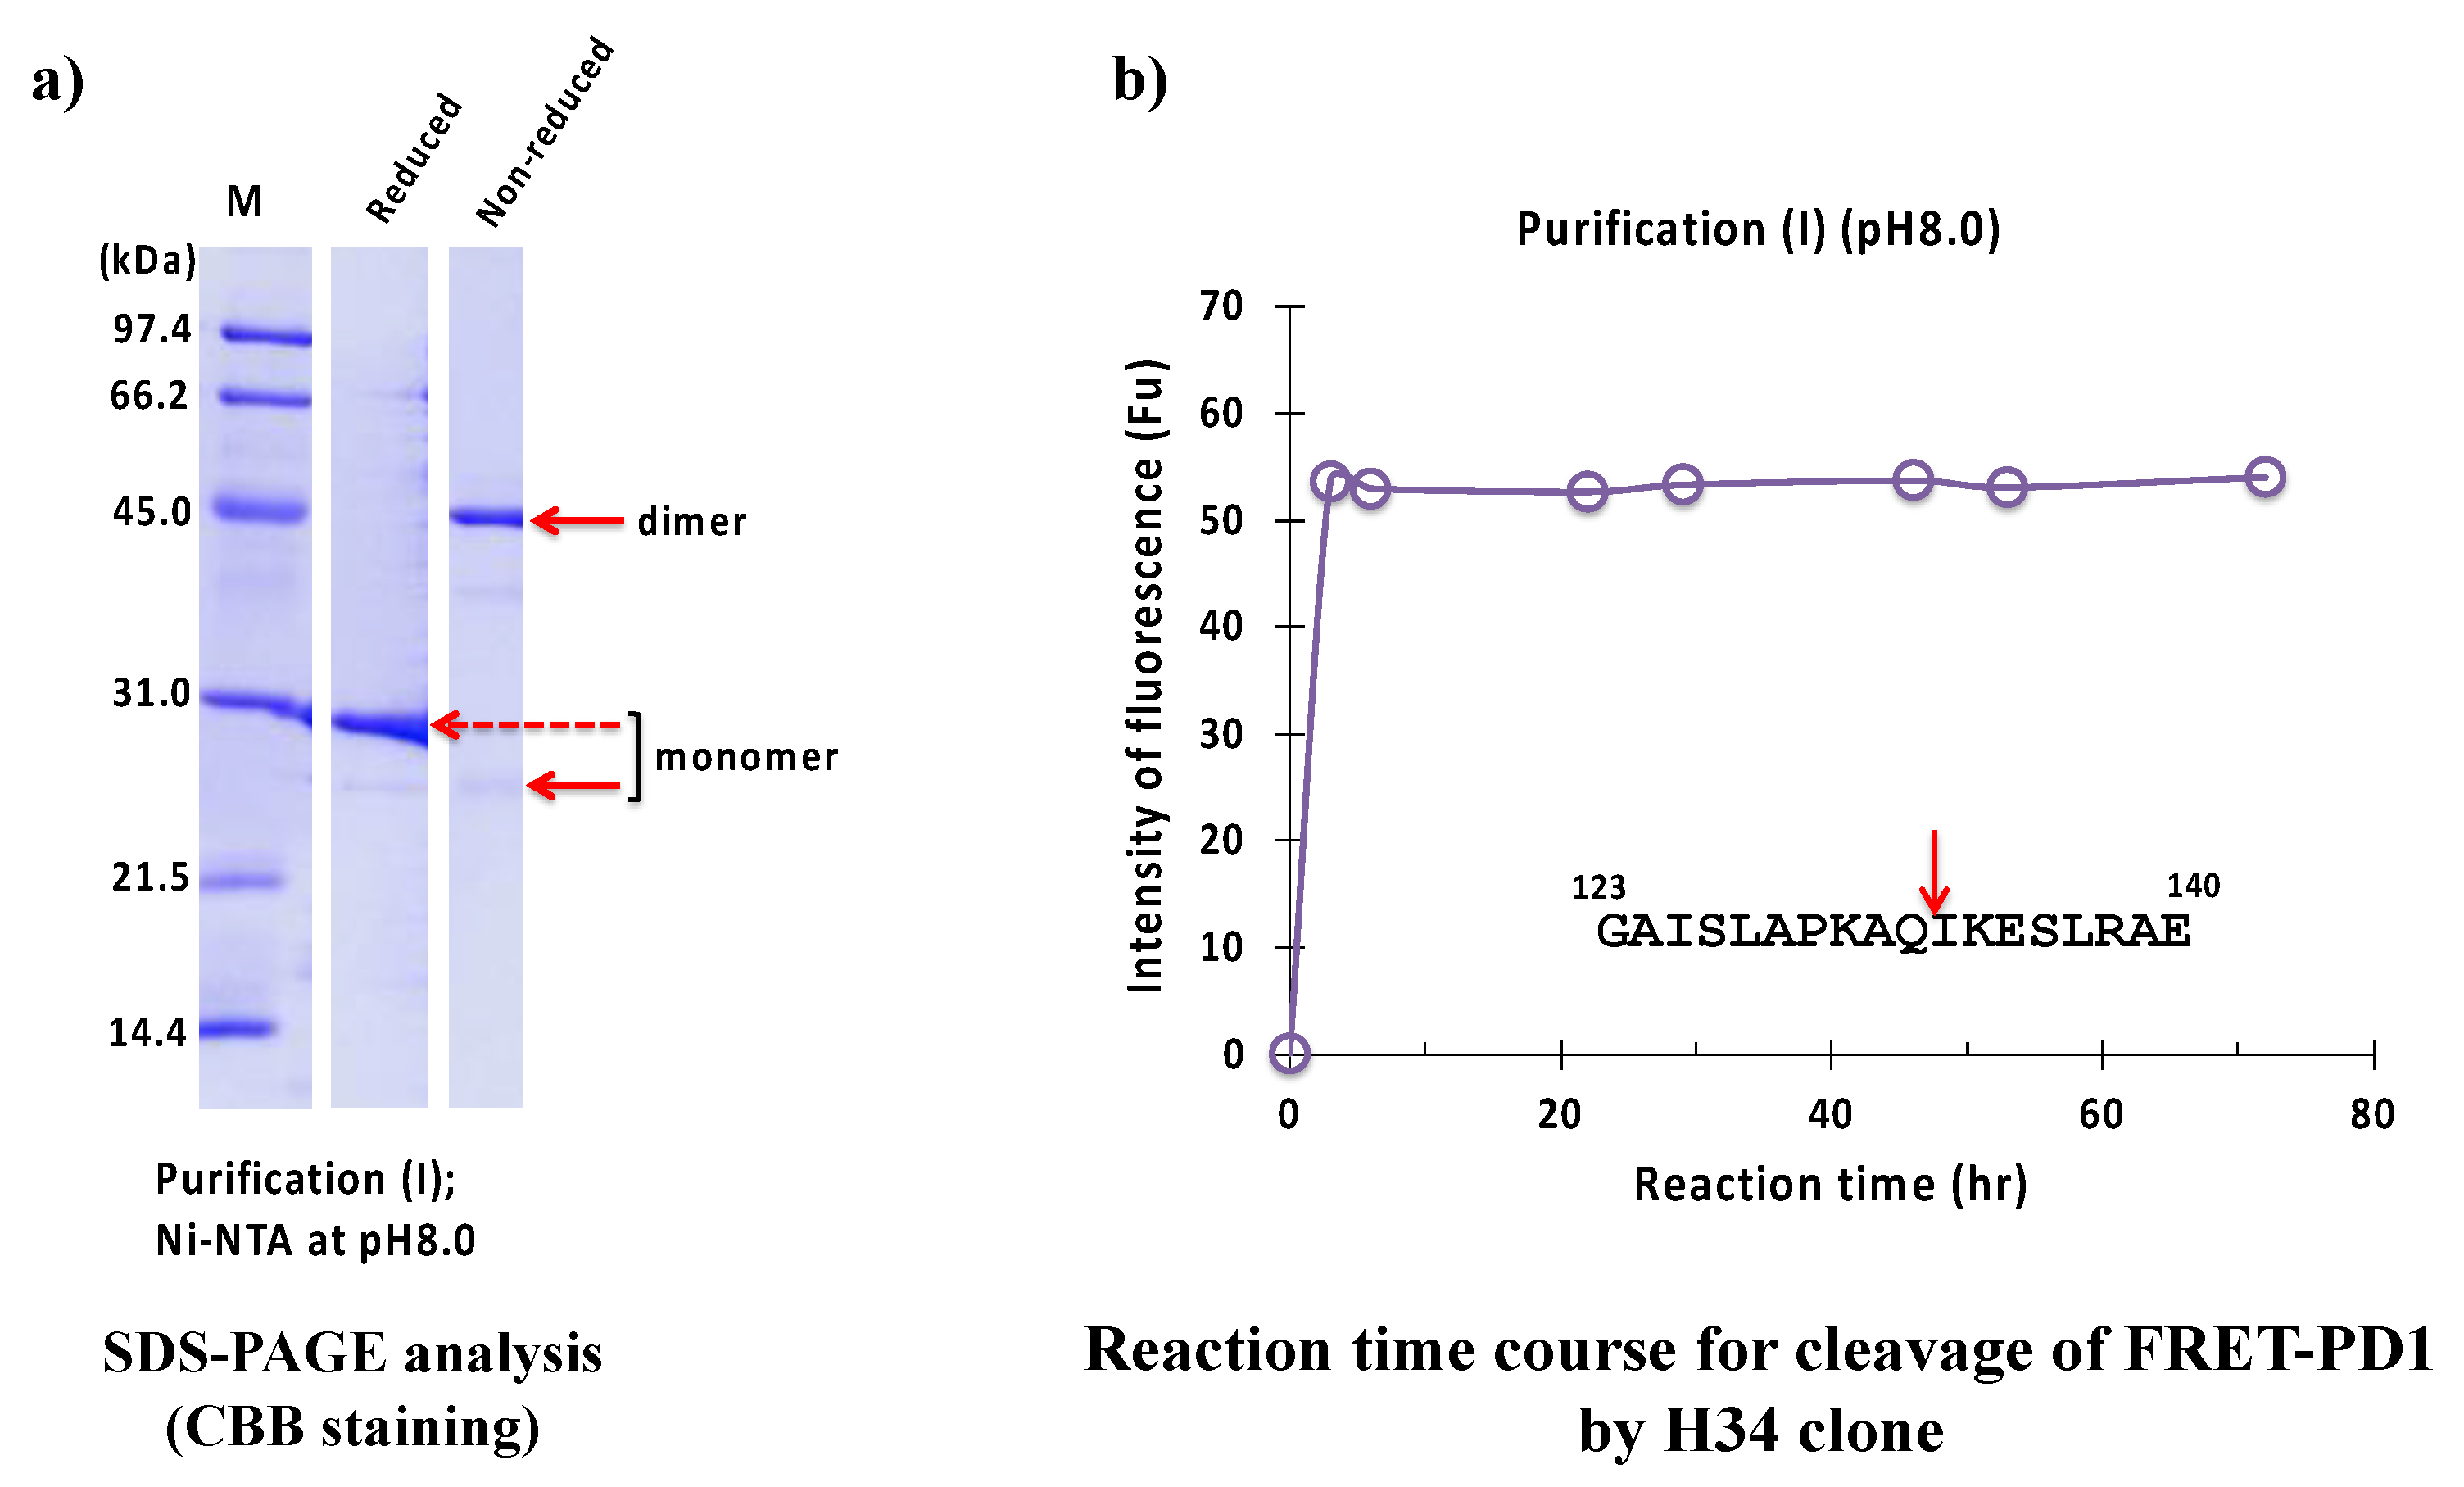
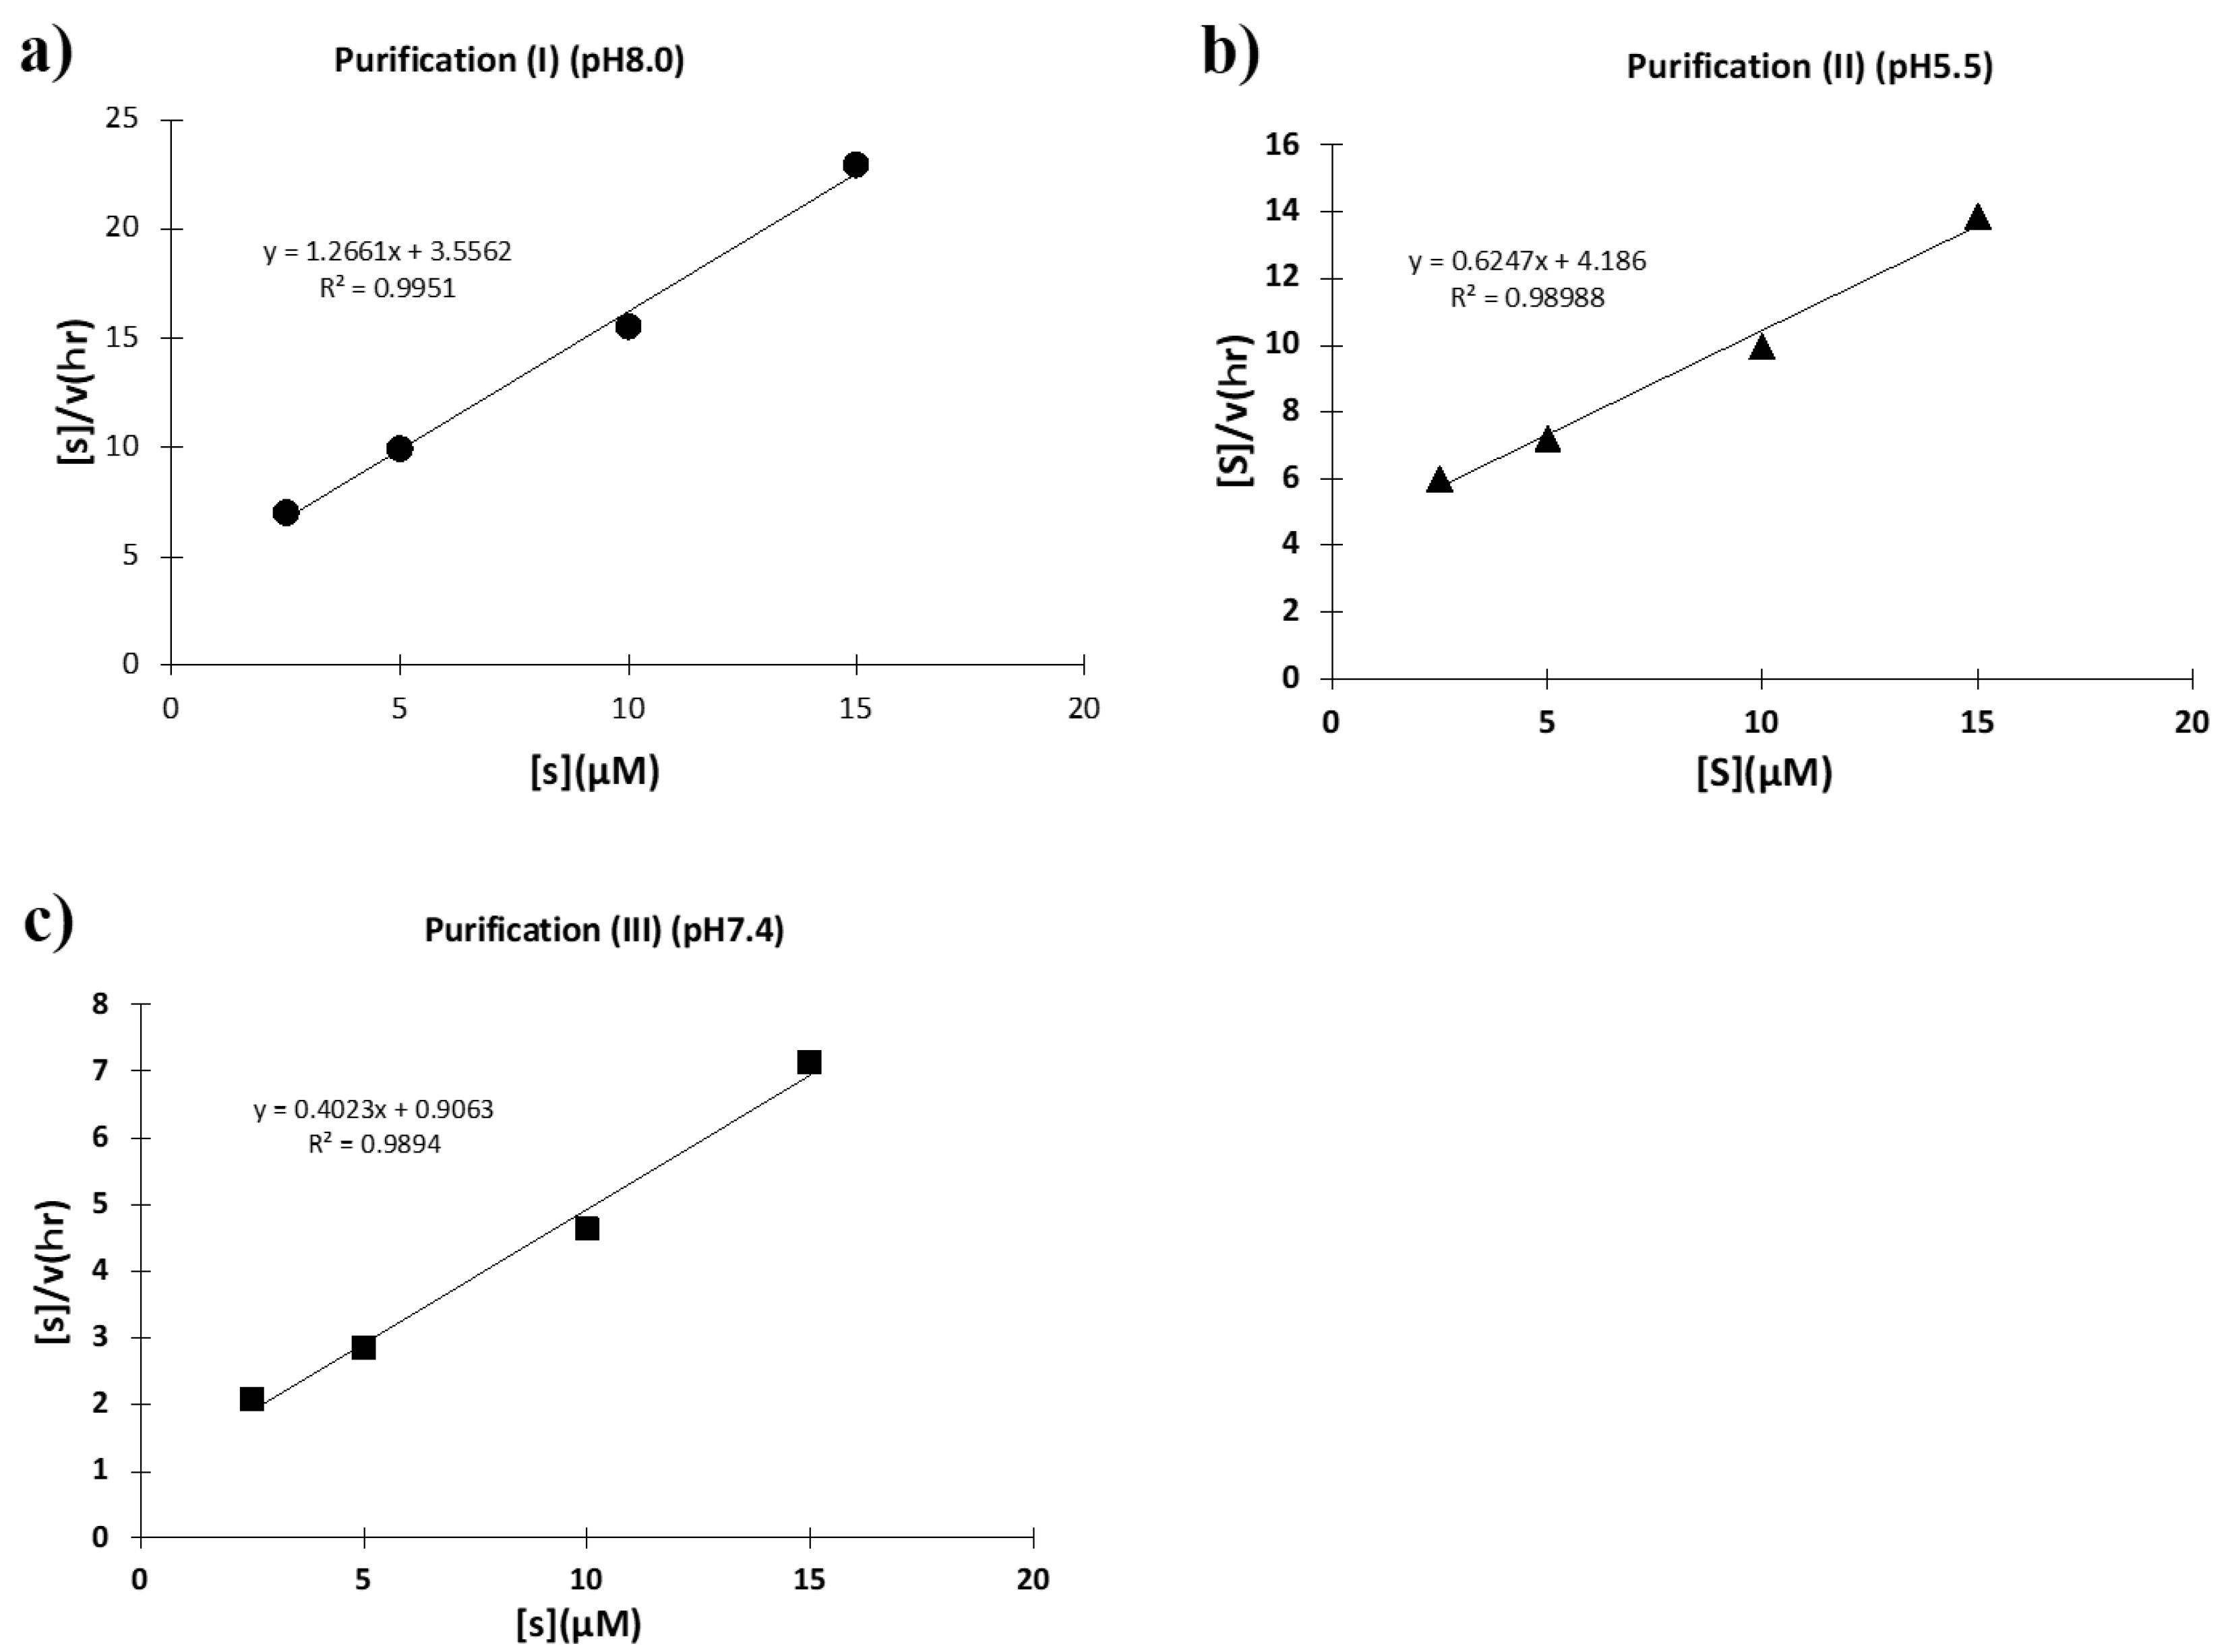
2.2.1. Purification (I) at pH 8.0 (Ni-NTA Chromatography)
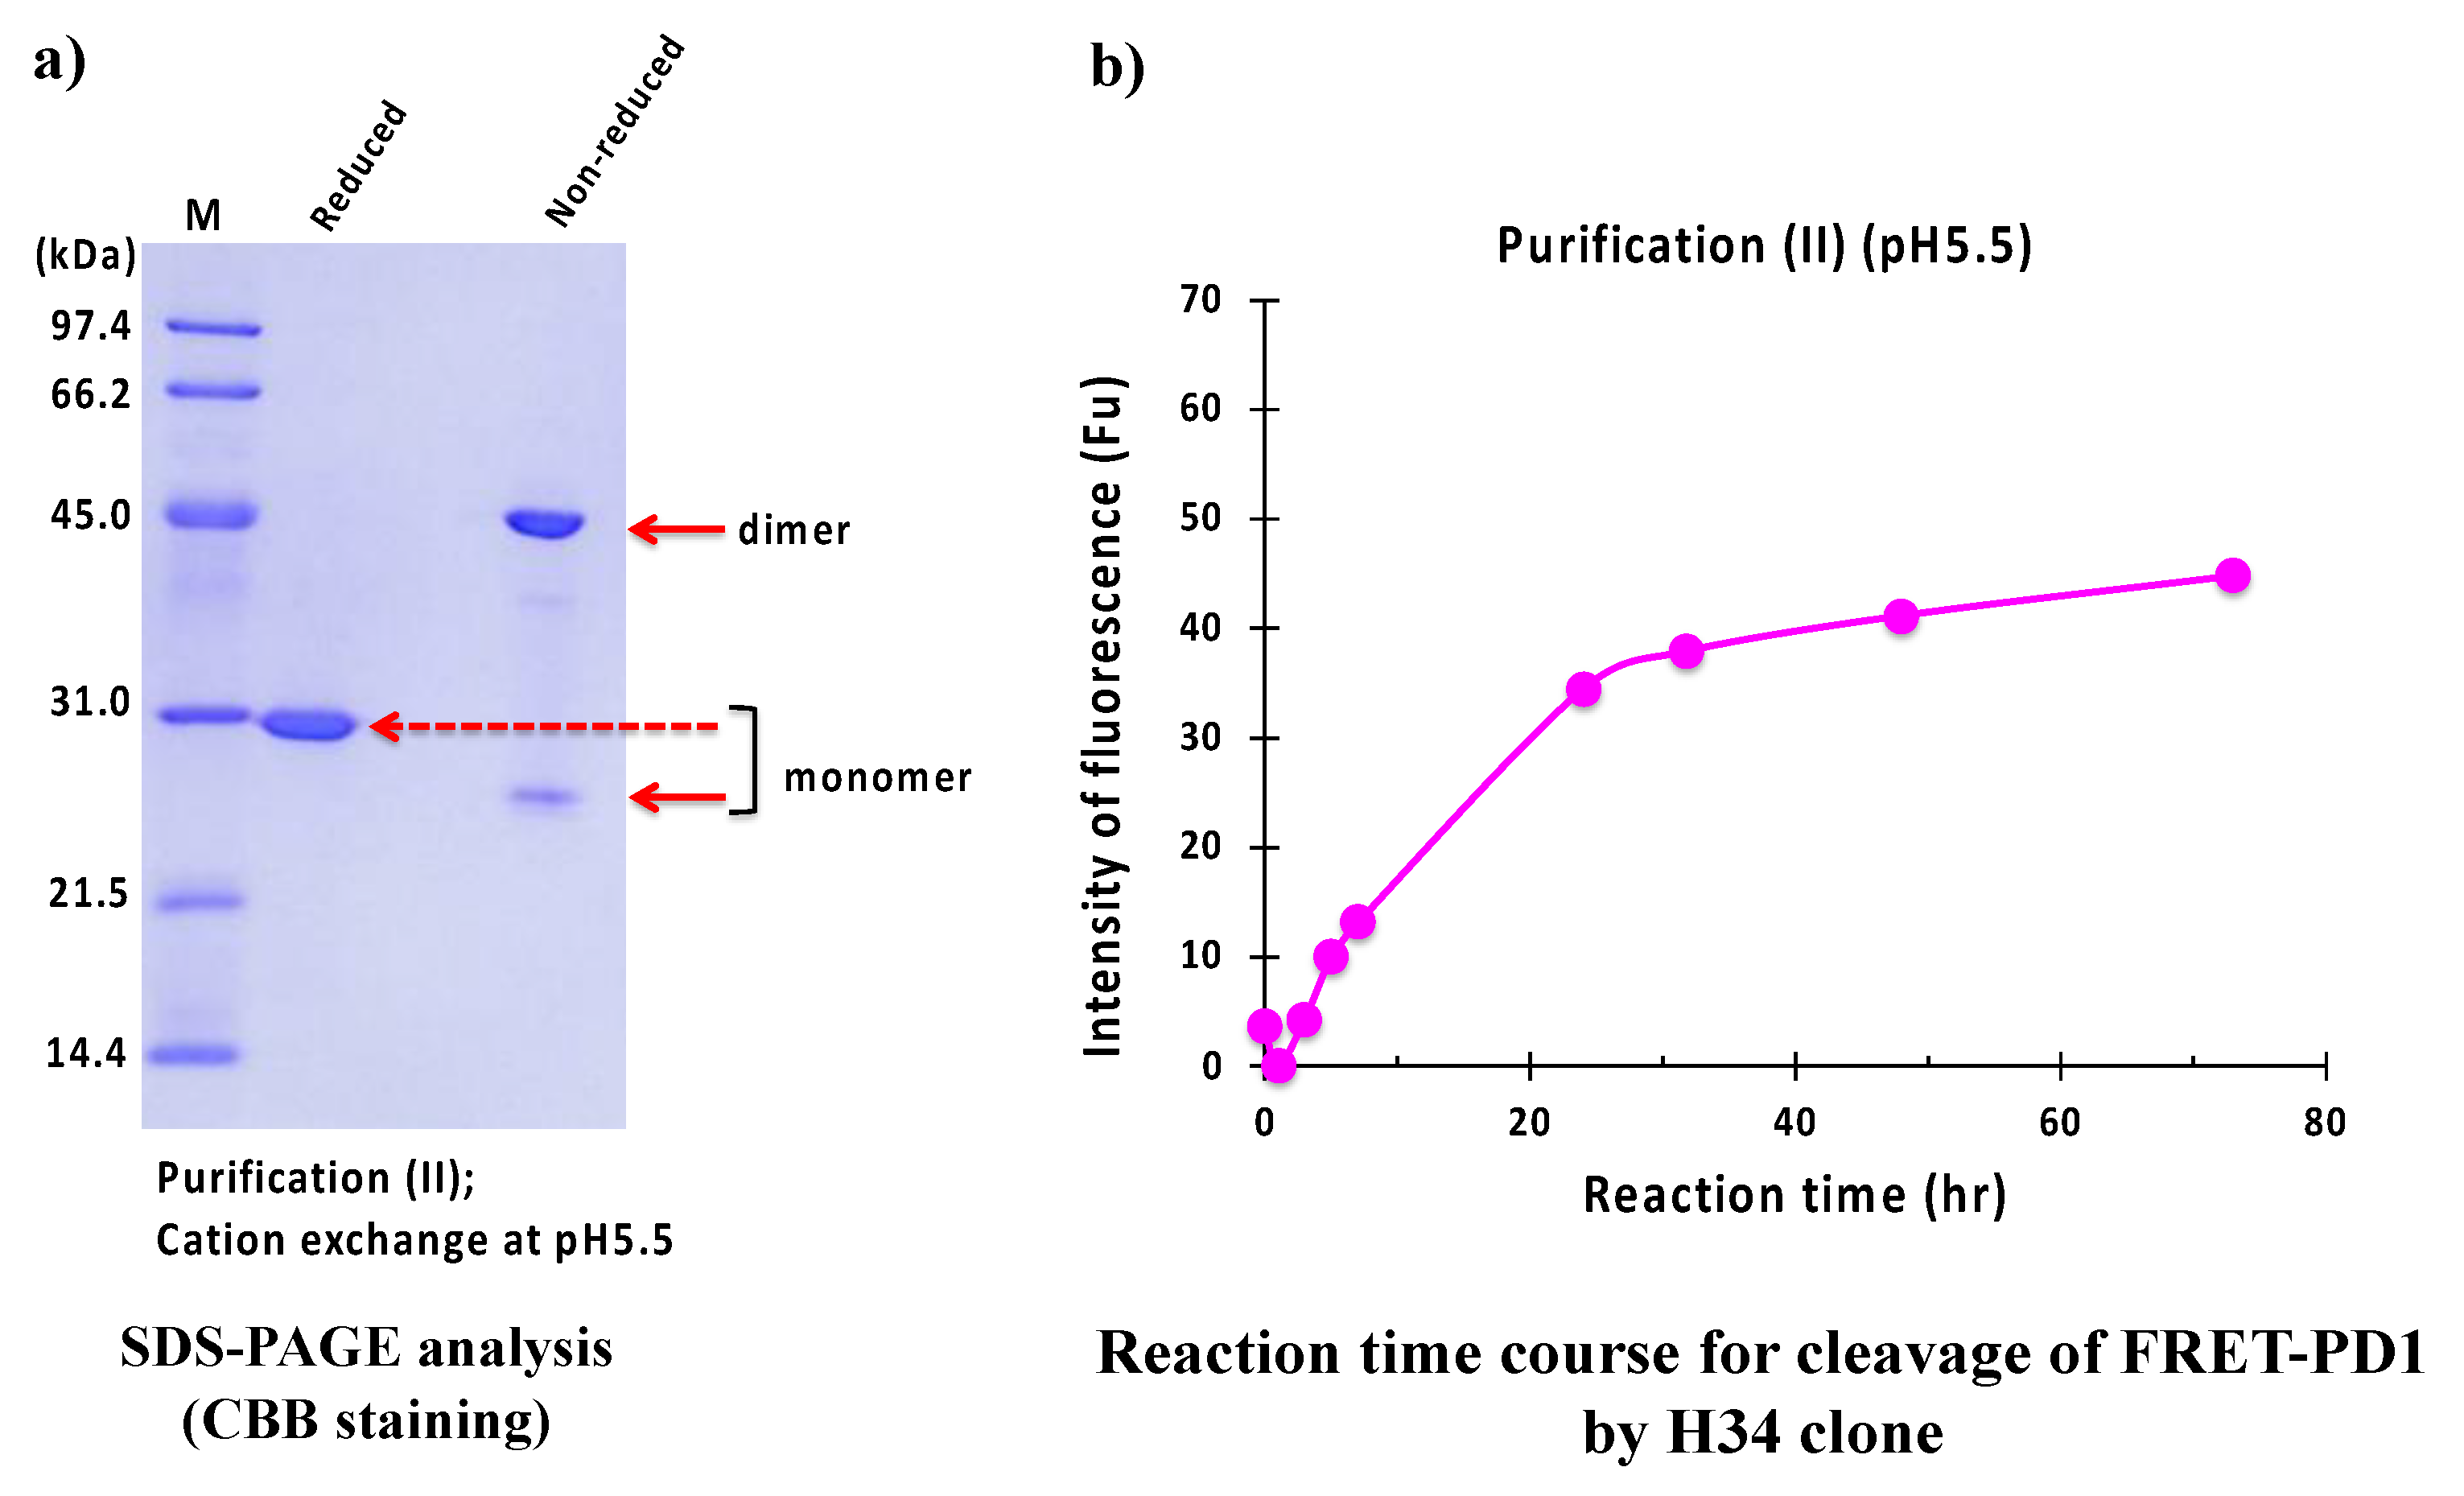
2.2.2. Purification (II) at pH 5.5 (Cation-Exchange Chromatography)
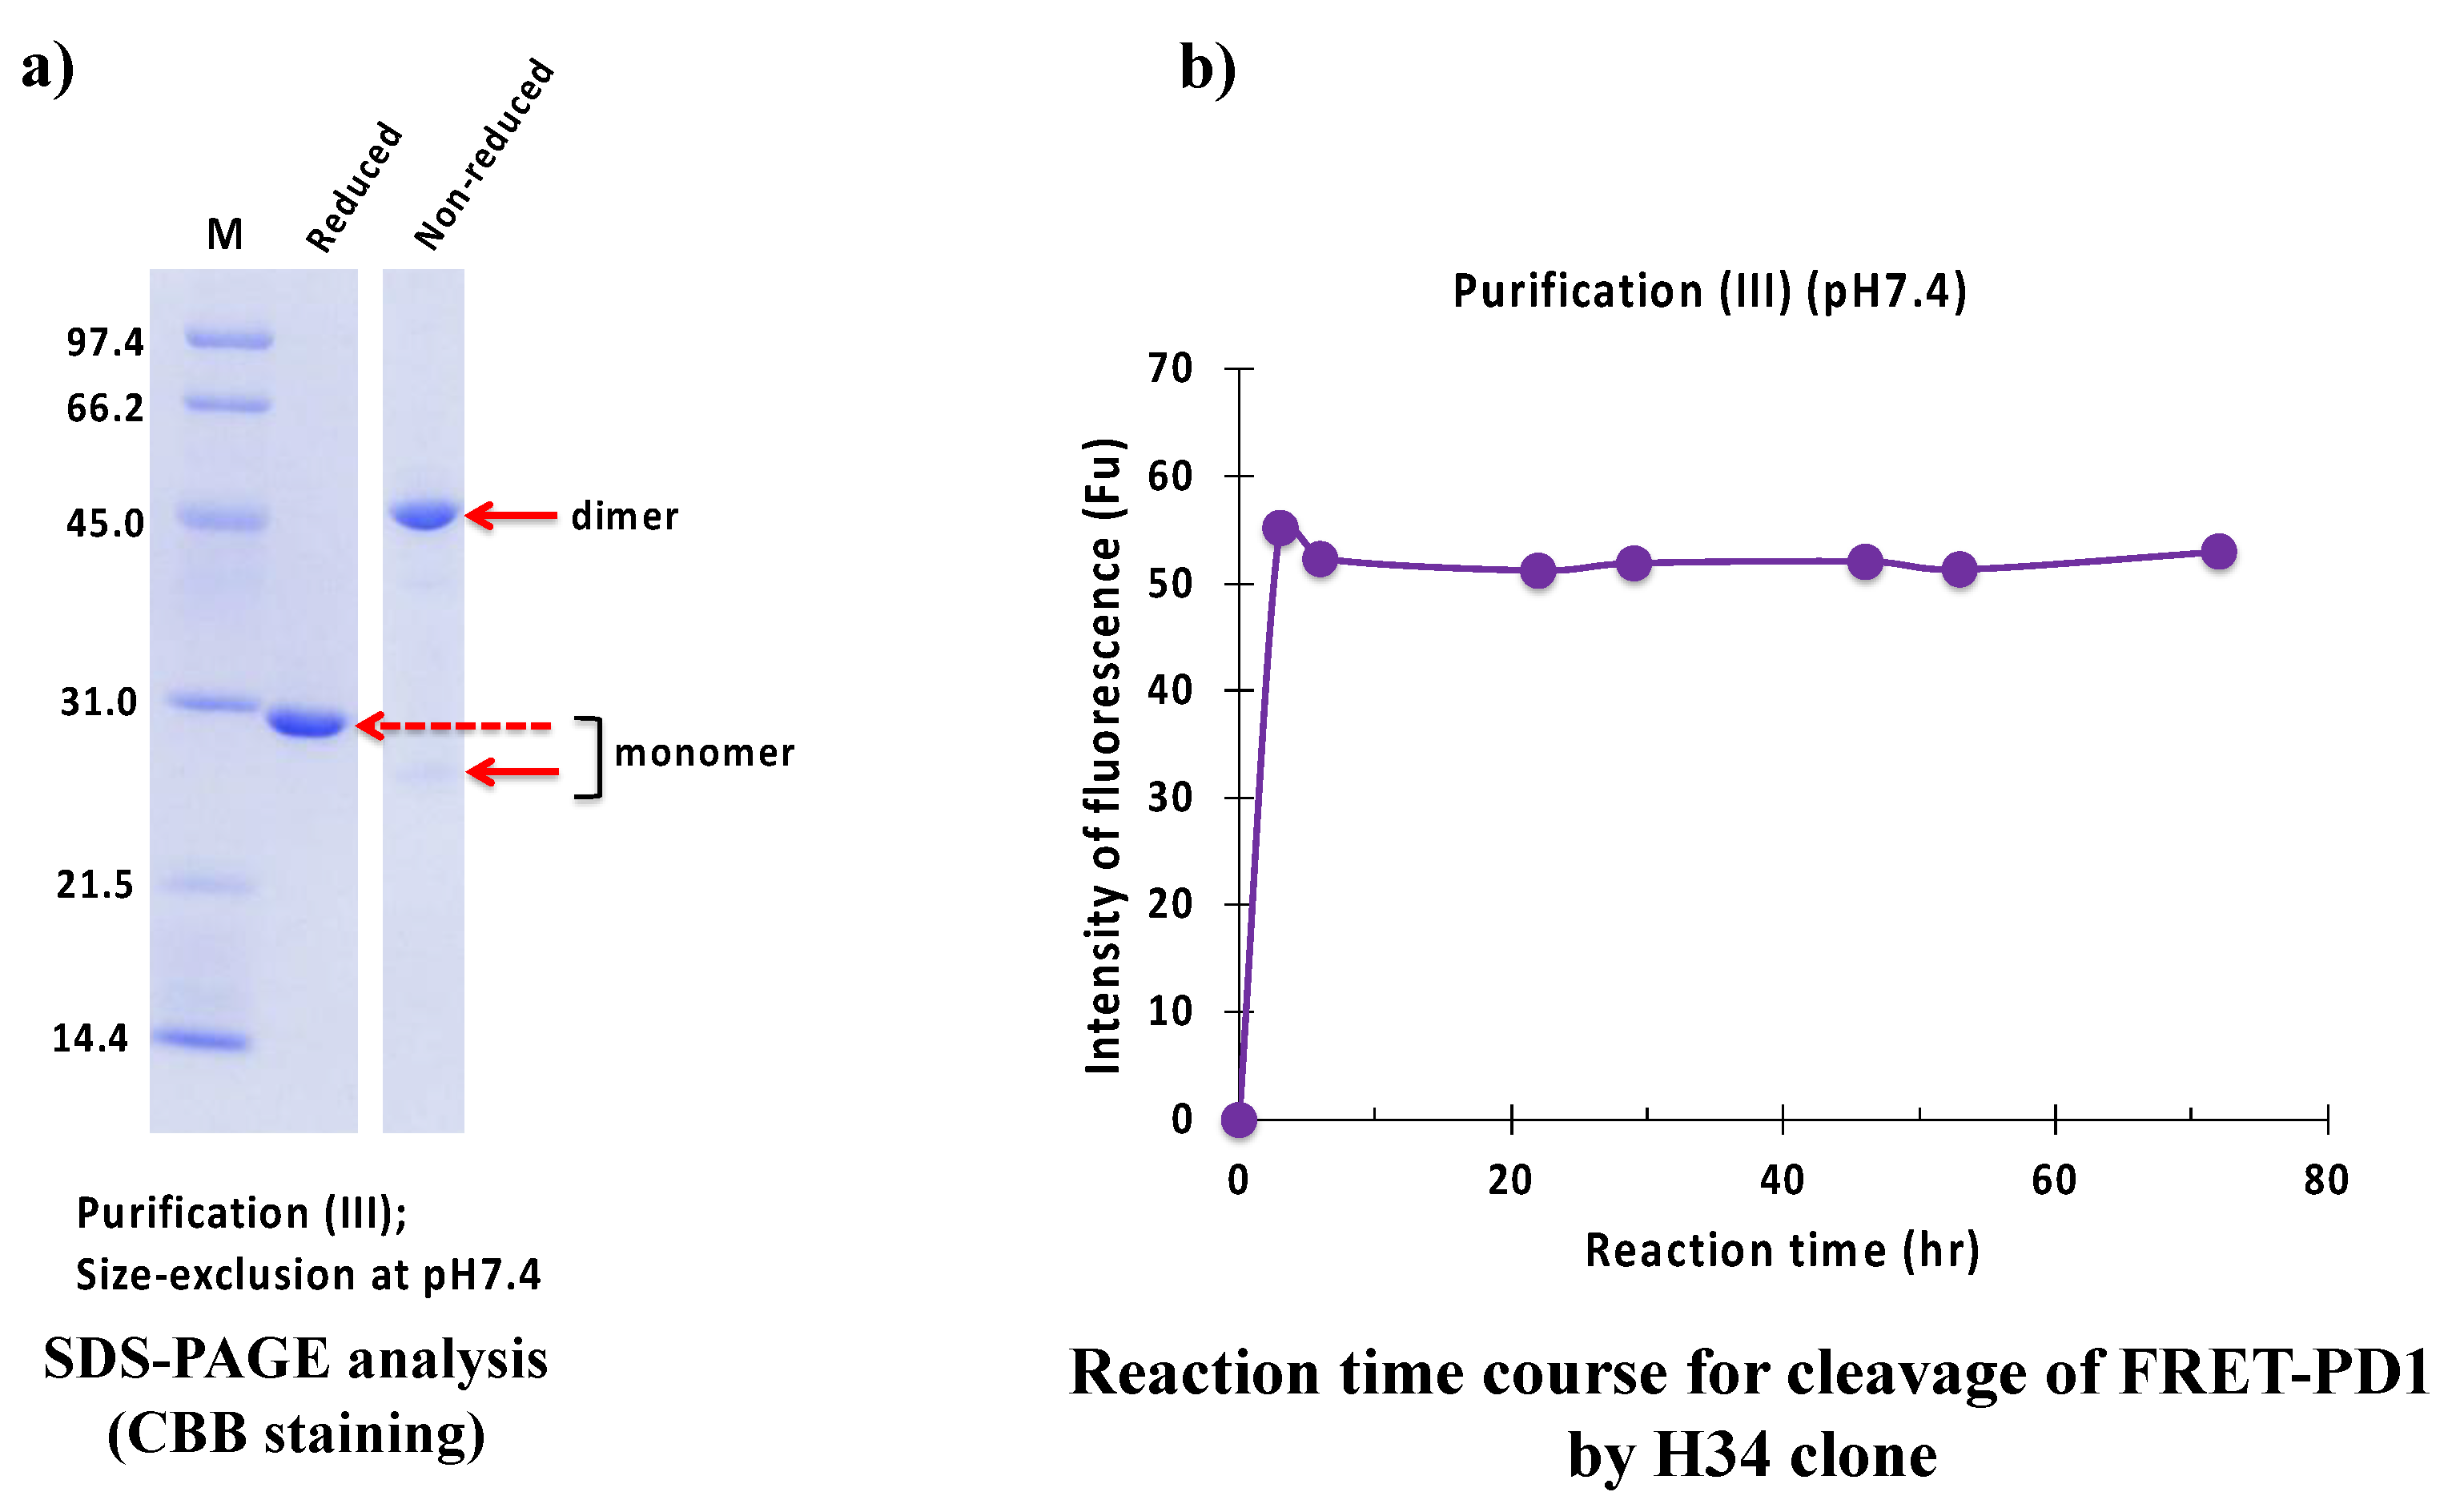
2.2.3. Purification (III) at pH 7.4 (Size-Exclusion Chromatography)
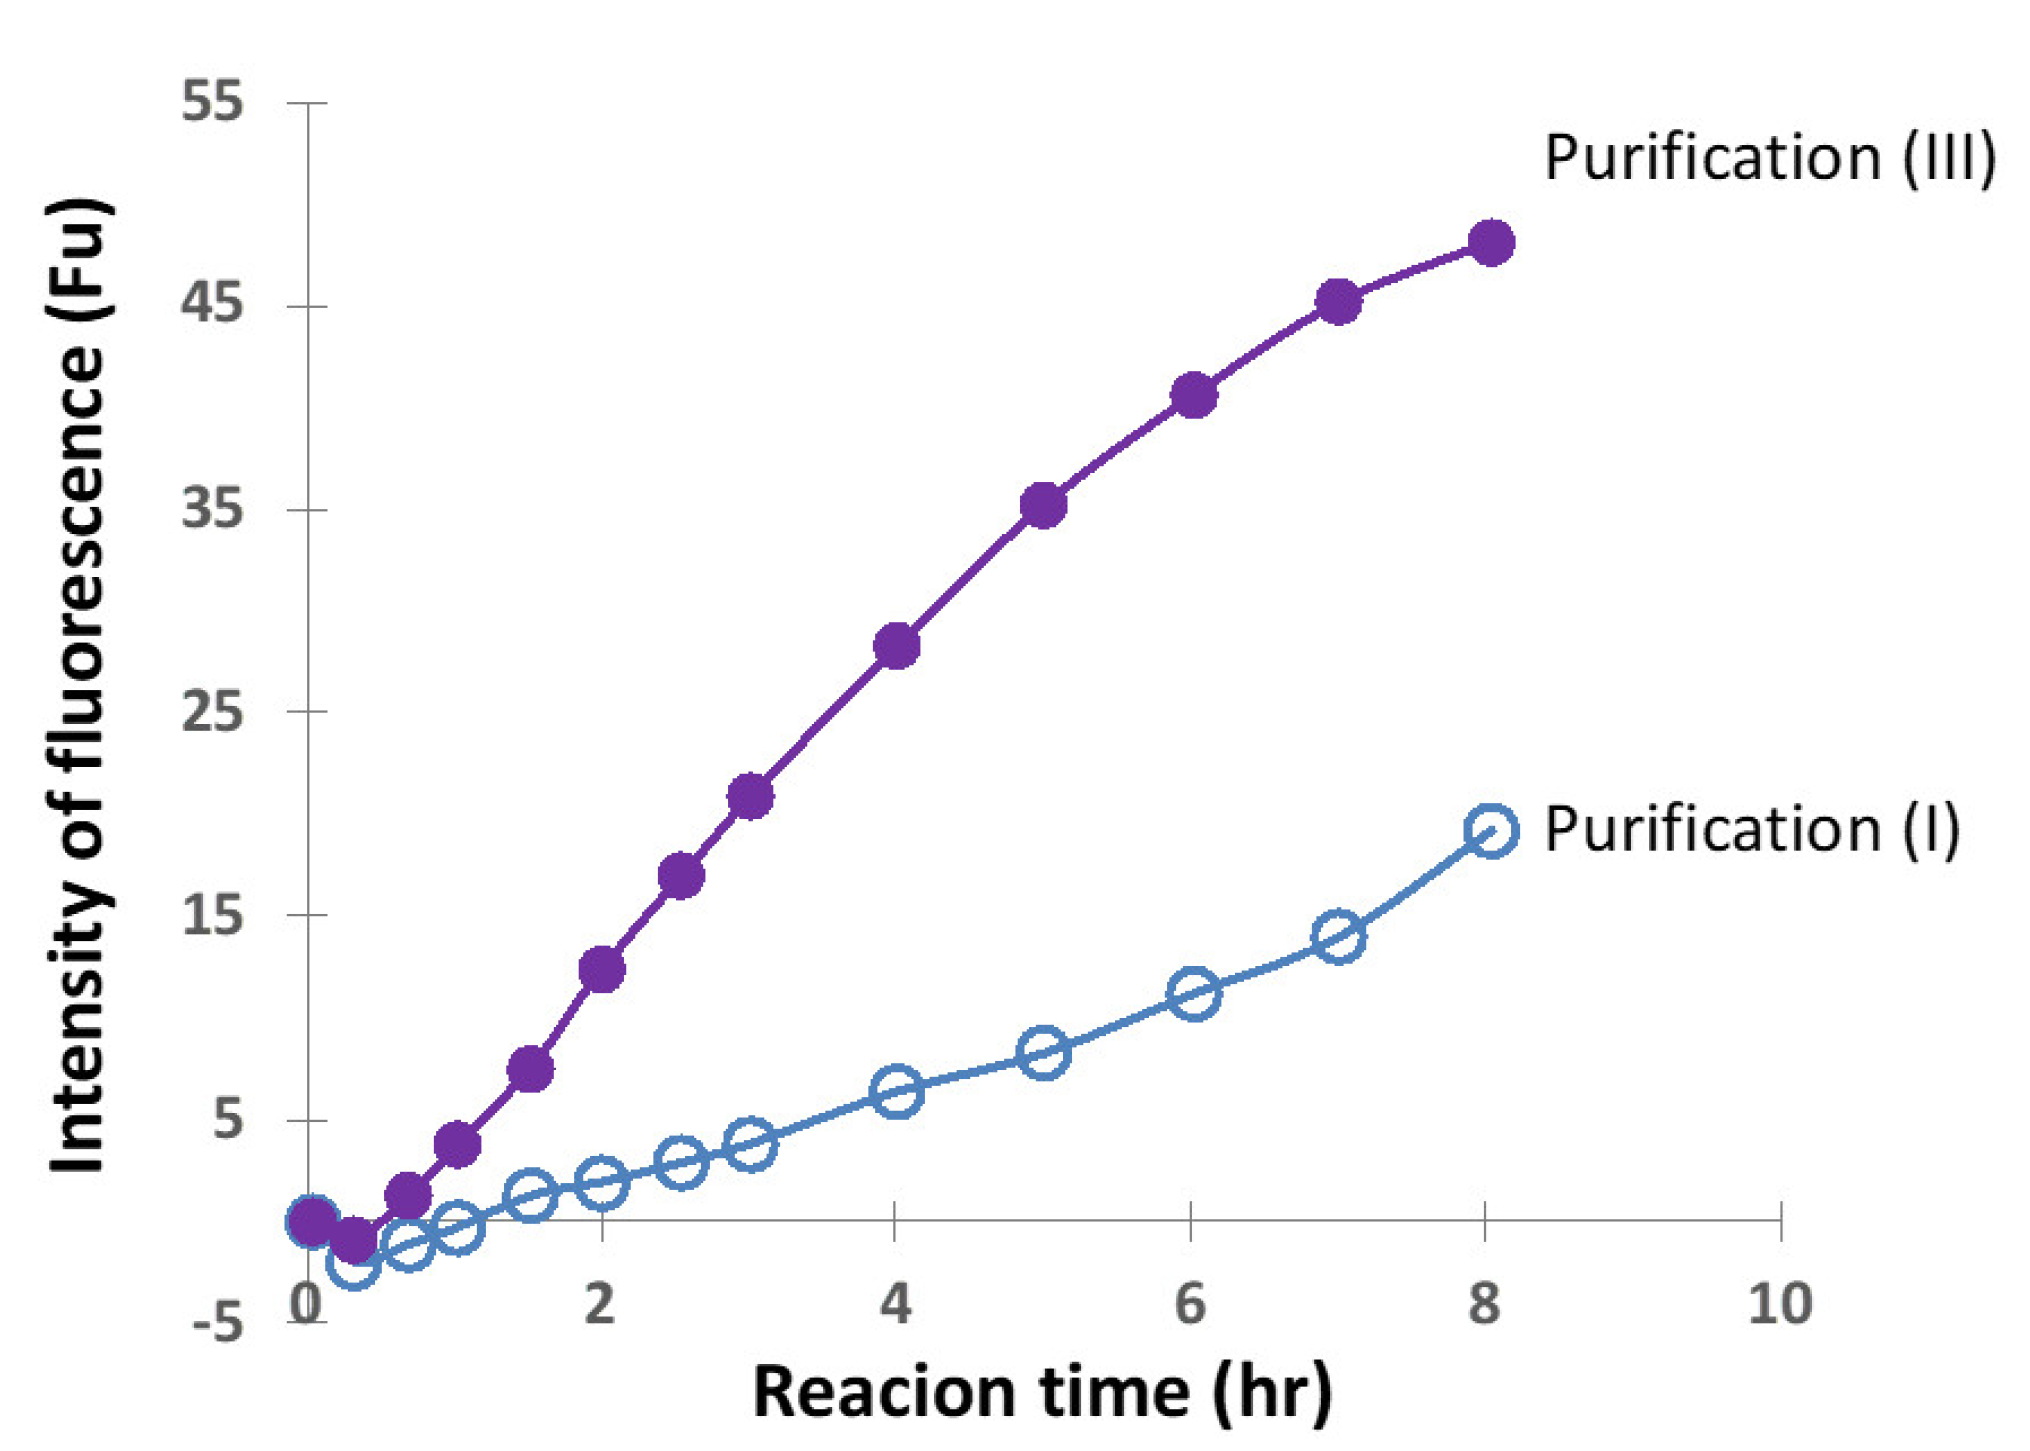
2.2.4. Comparison of Ni-NTA (I) and Size-Exclusion (III) Chromatography
2.2.5. Kinetics
3. Discussion
4. Materials and Methods
4.1. Reagents
4.2. Synthesis of FRET Substrates
4.3. Amplification of DNA Fragments Encoding Light Chains
4.4. Sequencing
4.5. Culture, Recovery, and Purification
4.6. Ni-NTA Column Chromatography (Route “1”)
4.7. Cation Exchange Chromatography (Route “2 & 3”)
4.7.1. Purification at pH 5.5 (Route “2”)
4.7.2. Purification at pH 8.0 (Route “3”)
4.8. Size-Exclusion Chromatography (Route “4–8”)
4.8.1. Purification at pH 5.5 (Route “4”)
4.8.2. Purification at pH 7.4 (Route “5”)
4.8.3. Purification at pH 8.0 (Route “6”)
4.8.4. Purification at pH 5.5 (Route “7”)
4.8.5. Purification at pH 8.0 (Route “8”)
4.9. Cleavage Assays
4.9.1. Arg(R)-pNA Substrate
4.9.2. FRET-Aβ and FRET-PD1 Substrates
4.10. Kinetics
4.10.1. Arg(R)-pNA
4.10.2. FRET-PD-1
5. Conclusions
- (1)
- The catalytic antibody should be prepared under a basic condition. In contrast, the catalytic activity is hindered or lost when prepared under an acidic condition. The appropriate pH range for the preparation was from 7.0 to 9.0. The low catalytic activity under the acidic pH is caused by the protonation of the aspartate participating in the catalytic site. Another possibility is not excluded, where the conformational structure of the catalytic site may be modulated during the progress of chromatography.
- (2)
- The presence of NaCl works to enhance or keep the high catalytic activity.
- (3)
- Surfactant of Tween-20 works to decrease the catalytic activity a little.
- (4)
- Size-exclusion chromatography is better than cation exchange chromatography.
Supplementary Materials
Author Contributions
Funding
Data Availability Statement
Acknowledgments
Conflicts of Interest
Abbreviations
References
- Paul, S.; Volle, D.J.; Beach, C.M.; Johnson, D.R.; Powell, M.J.; Massey, R.J. Catalytic Hydrolysis of vasoactive intestinal peptide by human antoantibody. Science 1989, 244, 1158–1162. [Google Scholar] [CrossRef] [PubMed]
- Shuster, A.M.; Gololobov, G.V.; Kvashuk, O.A.; Bogomolova, A.E.; Smirnov, I.V.; Gabibov, A.G. DNA hydrolyzing autoantibodies. Science 1992, 256, 665–667. [Google Scholar] [CrossRef] [PubMed]
- Lacroix-Desmazes, S.; Sooryanarayana, M.A.; Bonnemain, C.; Stieltjes, N.; Pashov, A.; Sultan, Y.; Hoebeke, J.; Kazatchkine, M.D.; Kaveri, S.V. Catalytic activity of antibodies against factor VIII in patients with hemophilia A. Nat. Med. 1999, 5, 1044–1047. [Google Scholar] [CrossRef] [PubMed]
- Parkhomenko, T.A.; Buneva, V.N.; Tyshkevich, O.B.; Generalov, I.I.; Doronin, B.M.; Nevinsky, G. DNA-hydrolyzing activity of IgG antibodies from the sera of patients with tick-borne encephalitis. Biochimie 2010, 92, 545–554. [Google Scholar] [CrossRef] [PubMed]
- Hifumi, E.; Kondo, H.; Mitsuda, Y.; Uda, T. Catalytic features of monoclonal antibody i41SL1-2 subunits. Biotechnol. Bioeng. 2003, 84, 485–493. [Google Scholar] [CrossRef] [PubMed]
- Mei, S.; Mody, B.; Eklund, S.H.; Paul, S. Vasoactive intestinal peptide hydrolysis by antibody light chains (Communication). J. Biol. Chem. 1991, 266, 15571–15574. [Google Scholar] [CrossRef]
- Gao, Q.S.; Sun, M.; Tyutyukova, S.; Webster, D.; Rees, A.; Tramontano, A.; Massey, R.J.; Paul, S. Molecular cloning of a proteolytic antibody light chain. J. Biol. Chem. 1994, 269, 32389–32393. [Google Scholar] [CrossRef]
- Taguchi, H.; Planque, S.; Nishiyama, Y.; Symersky, J.; Boivin, S.; Paul Szabo, P.; Friedland, R.P.; Ramsland, P.A.; Edmundson, A.B.; Marc, E.; et al. Autoantibody-catalyzed Hydrolysis of Amyloid β Peptide. J. Biol. Chem. 2008, 283, 4714–4722. [Google Scholar] [CrossRef]
- Krasnorutskii, M.A.; Buneva, V.N.; Nevinsky, G.A. DNase, RNase, and phosphatase activities of antibodies formed upon immunization by DNA, DNase I, and DNase II. Biochemistry 2011, 76, 1065–1072. [Google Scholar] [CrossRef]
- Mitsuda, Y.; Hifumi, E.; Tsuruhata, K.; Fujinami, H.; Yamamoto, N.; Uda, T. Catalytic antibody light chain capable of cleaving a chemokine receptor CCR-5 peptide with a high reaction rate constant. Biotechnol. Bioeng. 2004, 86, 217–225. [Google Scholar] [CrossRef]
- Hifumi, E.; Higashi, K.; Uda, T. Catalytic digestion of human tumor necrosis factor-α by antibody heavy chain. FEBS J. 2010, 277, 3823–3832. [Google Scholar] [CrossRef]
- Hifumi, E.; Mitsuda, Y.; Ohara, K.; Uda, T. Targeted destruction of the HIV-1 coat protein gp41 by a catalytic antibody light chain. J. Immunol. Methods 2002, 269, 283–298. [Google Scholar] [CrossRef]
- Paul, S.; Karle, S.; Planque, S.; Taguchi, H.; Nishiyama, Y.; Handy, B.; Salas, M.; Edmundson, A.; Hanson, A. Naturally occurring proteolytic antibodies Selective Immunoglobulin M-Catalyzed Hydrolysis of HIV gp120. J. Biol. Chem. 2004, 279, 39611–39619. [Google Scholar] [CrossRef]
- Hifumi, E.; Hatiuchi, K.; Okuda, T.; Nishizono, A.; Okamura, Y.; Uda, T. Specific degradation of H. pylori urease by a catalytic antibody light chain. FEBS J. 2005, 272, 4497–4505. [Google Scholar] [CrossRef]
- Hifumi, E.; Morihara, F.; Hatiuchi, K.; Okuda, T.; Nishizono, A.; Uda, T. Catalytic features and eradication ability of antibody light-chain UA15-L against Helicobacter pylori. J. Biol. Chem. 2008, 283, 899–907. [Google Scholar] [CrossRef]
- Durova, O.M.; Vorobiev, I.I.; Smirnov, I.V.; Reshetnyak, A.V.; Telegin, G.B.; Shamborant, O.G.; Orlova, N.A.; Genkin, D.D.; Bacon, A.; Ponomarenko, N.A.; et al. Strategies for induction of catalytic antibodies toward HIV-1 glycoprotein gp120 in autoimmune prone mice. Mol. Immunol. 2009, 47, 87–95. [Google Scholar] [CrossRef]
- Hifumi, E.; Honjo, E.; Fujimoto, N.; Arakawa, M.; Nishizono, A.; Uda, T. Highly efficient method of preparing human catalytic antibody light chains and their biological characteristics. FASEB J. 2012, 26, 1607–1615. [Google Scholar] [CrossRef]
- Hifumi, E.; Takao, S.; Fujimoto, N.; Uda, T. Catalytic and biochemical features of a monoclonal antibody heavy chain, JN1-2, raised against a synthetic peptide with hemagglutinin molecule of influenza virus. J. Am. Chem. Soc. 2011, 133, 15015–15024. [Google Scholar] [CrossRef]
- Brown, E.L.; Nishiyama, Y.; Dunkle, J.W.; Aggarwal, S.; Planque, S.; Watanabe, K.; Csencsits-Smith, K.; Bowden, M.G.; Kaplan, S.L.; Paul, S. Constitutive production of catalytic antibodies to a Staphylococcus aureus virulence factor and effect of infection. J. Biol. Chem. 2012, 287, 9940–9951. [Google Scholar] [CrossRef]
- Hifumi, E.; Fujimoto, N.; Arakawa, M.; Saito, E.; Matsumoto, S.; Kobayashi, N.; Uda, T. Biochemical features of a catalytic antibody light chain, 22F6, prepared from human lymphocytes. J. Biol. Chem. 2013, 288, 19558–19568. [Google Scholar] [CrossRef]
- Hifumi, E.; Arakawa, M.; Matsumoto, S.; Yamamoto, T.; Katayama, Y.; Uda, T. Biochemical features and anti-viral activity of a monomeric catalytic antibody light chain 23D4 against influenza A virus. FASEB J. 2015, 29, 2347–2358. [Google Scholar] [CrossRef] [PubMed]
- Bowen, A.; Wear, M.P.; Cordero, R.; Oscarson, S.; Casadevall, A. A monoclonal antibody to Cryptococcus neoformans glucuronoxylomannan manifests hydrolytic activity for both peptides and polysaccharides. J. Biol. Chem. 2017, 292, 417–434. [Google Scholar] [CrossRef] [PubMed]
- Gololobov, G.; Sun, M.; Paul, S. Innate antibody catalysis. Mol. Immunol. 1999, 36, 1215–1222. [Google Scholar] [CrossRef]
- Okochi, N.; Kato-Murai, M.; Kadonosono, T.; Ueda, M. Design of a serine protease-like catalytic triad on an antibody light chain displayed on the yeast cell surface. Appl. Microbiol. Biotech. 2007, 77, 597–603. [Google Scholar] [CrossRef] [PubMed]
- Ramsland, R.A.; Terzyan, S.S.; Cloud, G.; Bourne, C.R.; Farrugia, W.; Tribbick, G.; Geysen, H.M.; Moomaw, C.R.; Slaughter, C.A.; Edundson, A.B. Crystal structure of a clycosylated Fab from an IgM cryoglobulin with properties of a natural proteolytic antibody. Biochem. J. 2006, 396, 473–481. [Google Scholar] [CrossRef]
- Smirnov, I.; Carletti, E.; Kurkova, I.; Nachon, F.; Nicolet, Y.; Mitkevich, V.A.; Débat, H.; Avalle, B.; Belogurov, A.A., Jr.; Kuznetsov, N.; et al. Reactibodies generated by kinetic selection couple chemical reactivity with favorable protein dynamics. Proc. Natl. Acad. Sci. USA 2011, 108, 15954–15959. [Google Scholar] [CrossRef]
- Ponomarenko, N.; Chatziefthimiou, S.D.; Kurkova, I.; Mokrushina, Y.; Mokrushina, Y.; Stepanova, A.; Smirnov, I.; Avakyan, M.; Bobik, T.; Mamedov, A.; et al. Role of kappa-lambda light-chain constant-domain switch in the structure and functionality of A17 reactibody. Acta Cryst. 2014, D70, 708–719. [Google Scholar]
- Nebija, D.; Noe, C.R.; Urban, E.; Lachmann, B. Quality control and stability studies with the monoclonal antibody, trastuzumab: Application of 1D- vs. 2D-Gel electrophoresis. Int. J. Mol. Sci. 2014, 15, 6399–6411. [Google Scholar] [CrossRef]
- Harris, R.J.; Kabakoff, B.; Macchi, F.D.; Shen, F.J.; Kwong, M.; Andya, J.; Shire, D.M.; Shire, S.J.; Bjork, N. Identification of multiple sources of charge heterogeneity in a recombinant antibody. J. Chromatogr. 2001, 752, 233–245. [Google Scholar] [CrossRef]
- Hifumi, E.; Matsumoto, S.; Nakashima, H.; Itonaga, S.; Arakawa, M.; Katayama, Y.; Kato, R.; Uda, T. A novel method of preparing the mono-form structure of catalytic antibody light chain. FASEB J. 2016, 30, 895–908. [Google Scholar] [CrossRef]
- Hifumi, E.; Taguchi, H.; Kato, R.; Uda, T. Role of the constant region domain in the structural diversity of human antibody light chain. FASEB J. 2017, 31, 1668–1677. [Google Scholar] [CrossRef]
- Hifumi, E.; Taguchi, H.; Kato, R.; Arakawa, M.; Katayama, Y.; Uda, T. Structural Diversity Problems and the Solving Method for Antibody Light Chains, Antibody Engineering; Boldicke, T., Ed.; InTech: Nappanee, IN, USA, 2018; Chapter 10; pp. 231–257. [Google Scholar]
- Hifumi, E.; Taguchi, H.; Tsuda, H.; Minagawa, T.; Nonaka, T.; Uda, T. A new algorithm to convert a normal antibody into the corresponding catalytic antibody. Sci. Adv. 2020, 6, eaay6441. [Google Scholar] [CrossRef]
- Planque, S.A.; Nishiyama, Y.; Sonoda, S.; Lin, Y.; Taguchi, H.; Hara, M.; Kolodziej, S.; Mitsuda, Y.; Gonzalez, V.; Sait, H.B.; et al. Specific amyloid β clearance by a catalytic antibody construct. J. Biol. Chem. 2015, 290, 10229–10241. [Google Scholar] [CrossRef]
- Hifumi, E.; Taguchi, H.; Toorisaka, E.; Uda, T. New technologies to introduce a catalytic function into antibodies ~A unique human catalytic antibody light chain showing degradation of β-amyloid molecule along with the peptidase activity~. FASEB Bioadv. 2018, 1, 93–104. [Google Scholar] [CrossRef]
- Sharma, V.; Heriot, W.; Trisler, K.; Smider, V. A human germ line antibody light chain with hydrolytic properties associated its multimerization status. J. Biol. Chem. 2009, 284, 33079–33087. [Google Scholar] [CrossRef]
- Hifumi, E.; Taguchi, H.; Nonaka, T.; Harada, T.; Uda, T. Finding and characterizing a catalytic antibody light chain, H34, capable of degrading the PD-1 molecule. RSC Chem. Biol. 2020, 2, 220–229. [Google Scholar] [CrossRef]
- Matsuura, K.; Yamamoto, K.; Shinohara, H. Amidase activity of human Bence Jones proteins. Biochem. Biophys. Res. Commun. 1994, 204, 57–62. [Google Scholar] [CrossRef]
- Odintsova, E.S.; Kharitonova, M.A.; Baranovskii, A.G.; Sizyakina, L.P.; Buneva, V.N.; Nevinsky, G.A. DNA-Hydrolyzing IgG Antibodies from the Blood of Patients with Acquired Immune Deficiency Syndrome. Mol. Biol. 2006, 40, 770–777. [Google Scholar] [CrossRef]
- Taguchi, H.; Planque, S.; Shapparapu, G.; Boivin, S.; Hara, M.; Nishiyama, Y.; Paul, S. Exceptional amyloid β peptide hydrolyzing activity of nonphysiological immunoglobulin variable domain scaffolds. J. Biol. Chem. 2008, 26, 36724–36733. [Google Scholar] [CrossRef]
- Odintsova, E.S.; Zaksas, N.P.; Buneva, V.N.; Nevinsky, G.A. Metal dependent hydrolysis of β-casein by sIgA antibodies from human milk. J. Mol. Recognit. 2010, 24, 45–59. [Google Scholar] [CrossRef]
- Bezuglova, A.M.; Konenkova, L.P.; Doronin, B.M.; Buneva, V.N.; Nevinsky, G.A. Affinity and catalytic heterogeneity and metal-dependence of polyclonal myelin basic protein-hydrolyzing IgGs from sera of patients with systemic lupus erythematosus. J. Mol. Recognit. 2011, 24, 960–974. [Google Scholar] [CrossRef] [PubMed]
- Wellings, D.A.; Atherton, E. Standard Fmoc protocols. Methods Enzymol. 1997, 289, 44–67. [Google Scholar] [PubMed]


Publisher’s Note: MDPI stays neutral with regard to jurisdictional claims in published maps and institutional affiliations. |
© 2022 by the authors. Licensee MDPI, Basel, Switzerland. This article is an open access article distributed under the terms and conditions of the Creative Commons Attribution (CC BY) license (https://creativecommons.org/licenses/by/4.0/).
Share and Cite
Nonaka, T.; Taguchi, H.; Uda, T.; Hifumi, E. Obtaining Highly Active Catalytic Antibodies Capable of Enzymatically Cleaving Antigens. Int. J. Mol. Sci. 2022, 23, 14351. https://doi.org/10.3390/ijms232214351
Nonaka T, Taguchi H, Uda T, Hifumi E. Obtaining Highly Active Catalytic Antibodies Capable of Enzymatically Cleaving Antigens. International Journal of Molecular Sciences. 2022; 23(22):14351. https://doi.org/10.3390/ijms232214351
Chicago/Turabian StyleNonaka, Tamami, Hiroaki Taguchi, Taizo Uda, and Emi Hifumi. 2022. "Obtaining Highly Active Catalytic Antibodies Capable of Enzymatically Cleaving Antigens" International Journal of Molecular Sciences 23, no. 22: 14351. https://doi.org/10.3390/ijms232214351
APA StyleNonaka, T., Taguchi, H., Uda, T., & Hifumi, E. (2022). Obtaining Highly Active Catalytic Antibodies Capable of Enzymatically Cleaving Antigens. International Journal of Molecular Sciences, 23(22), 14351. https://doi.org/10.3390/ijms232214351