
Space Microgravity Alters Neural Stem Cell Division: Implications for Brain Cancer Research on Earth and in Space

Abstract
1. Introduction
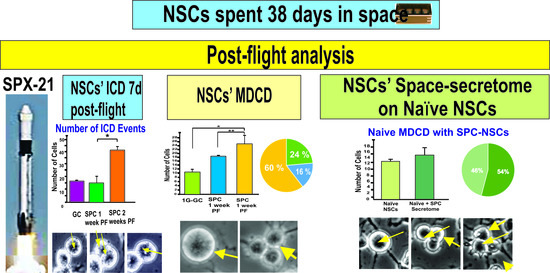
2. Results
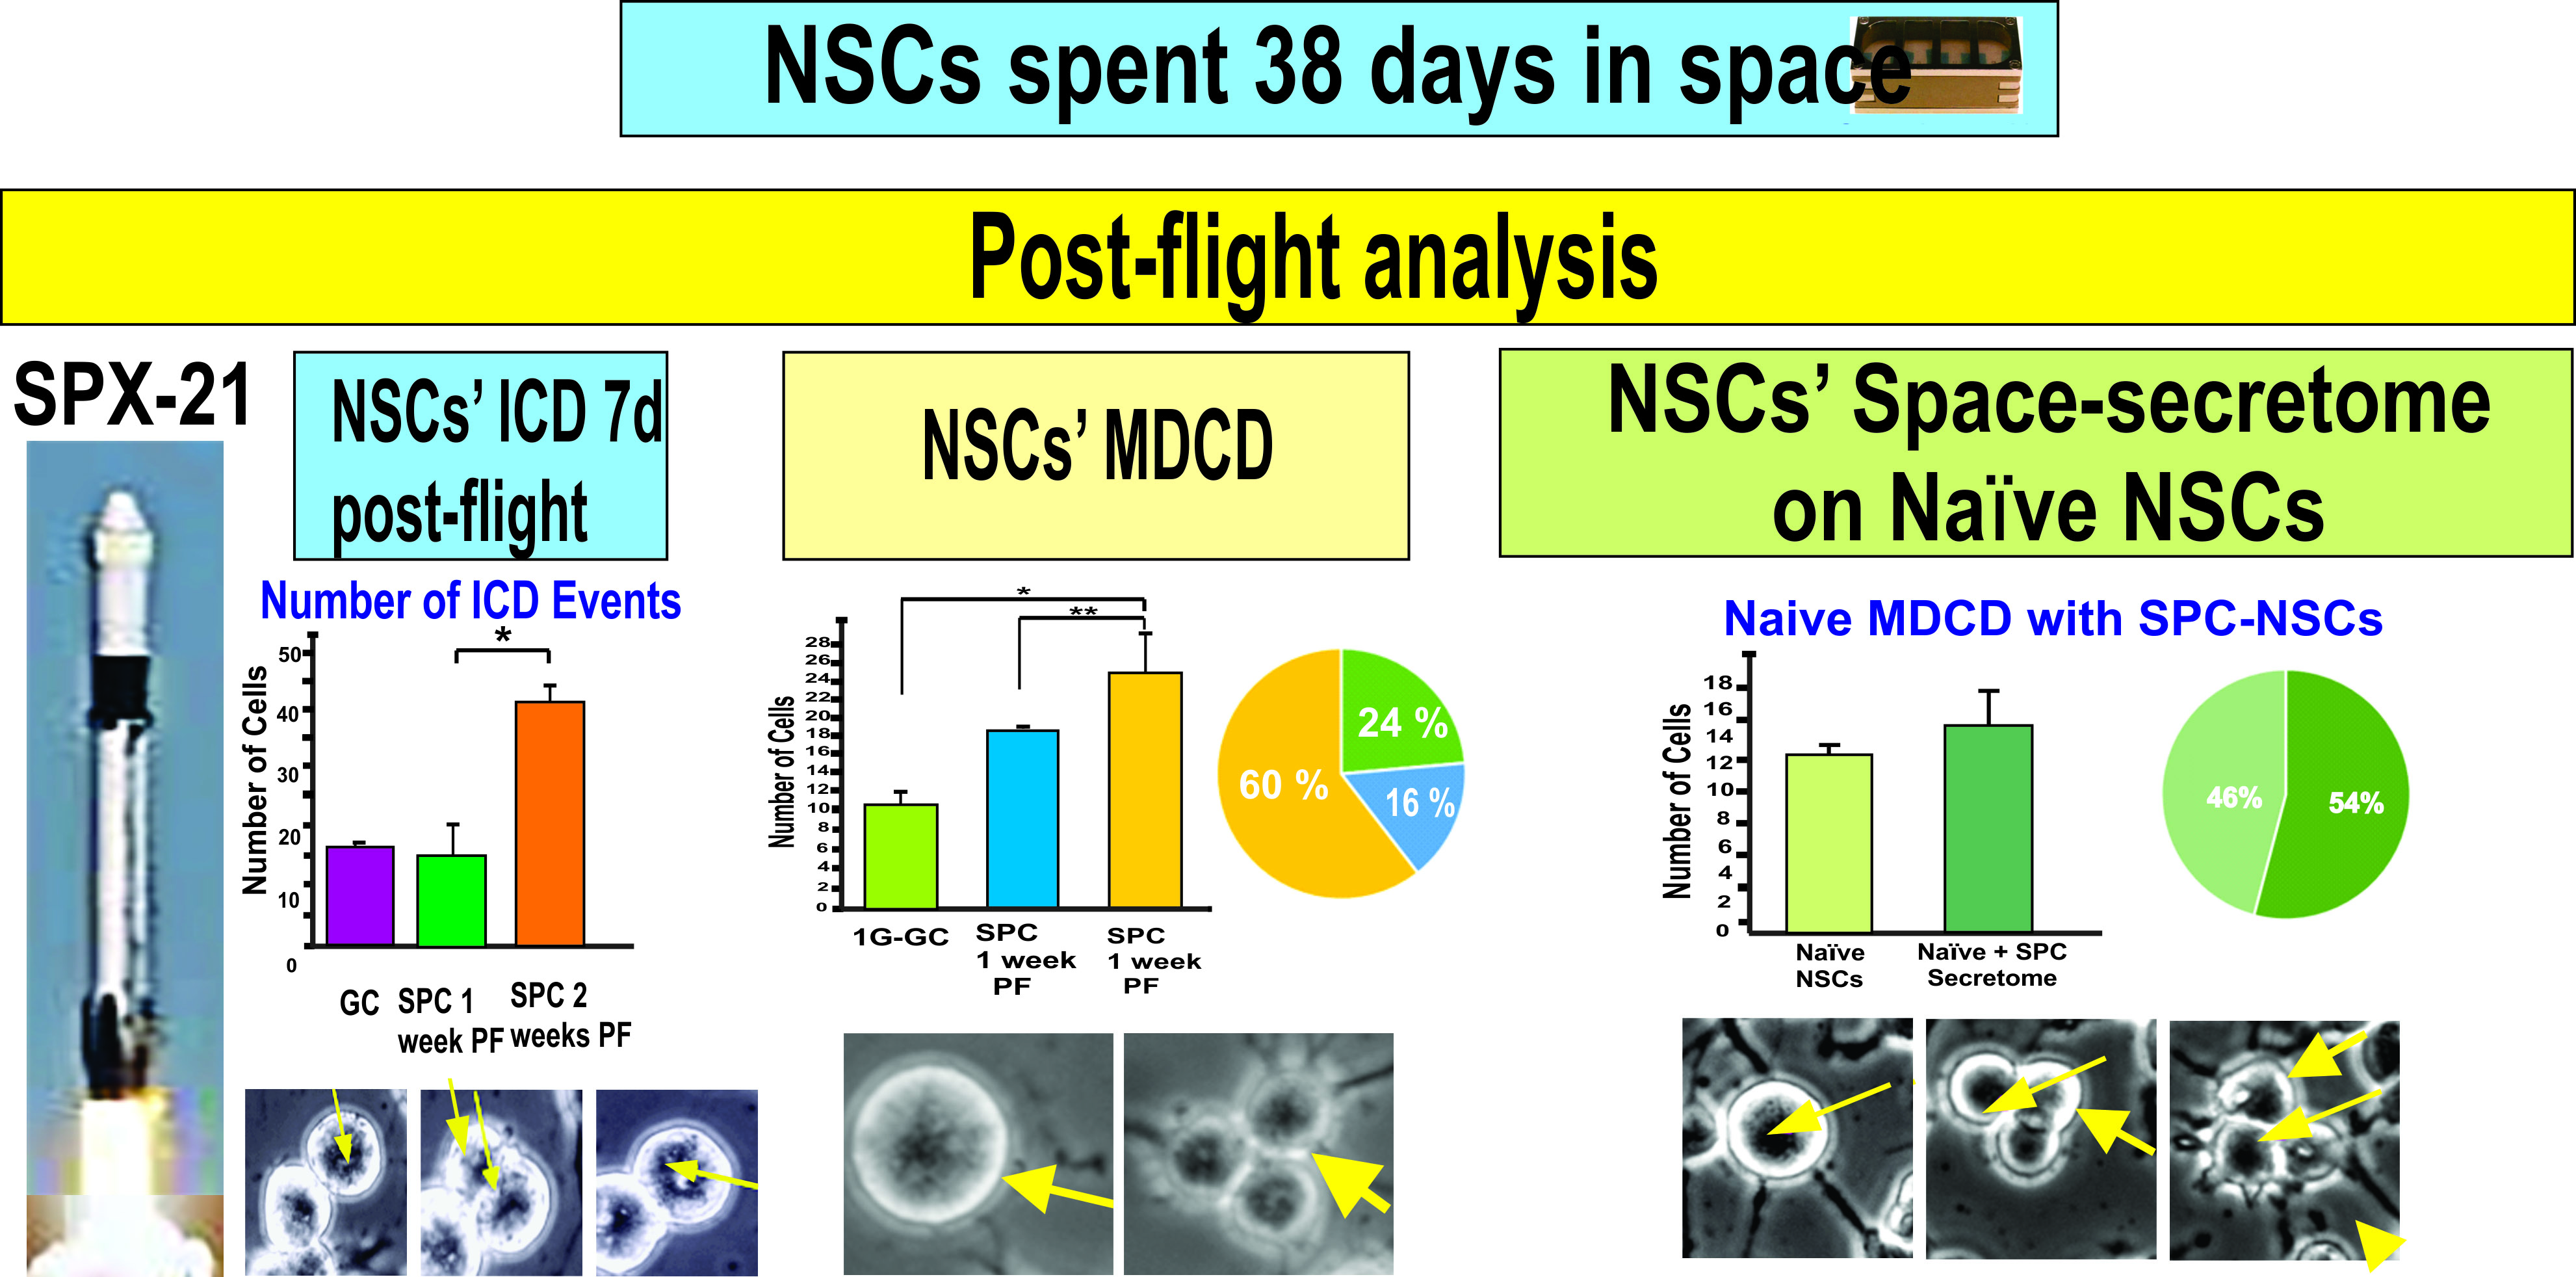
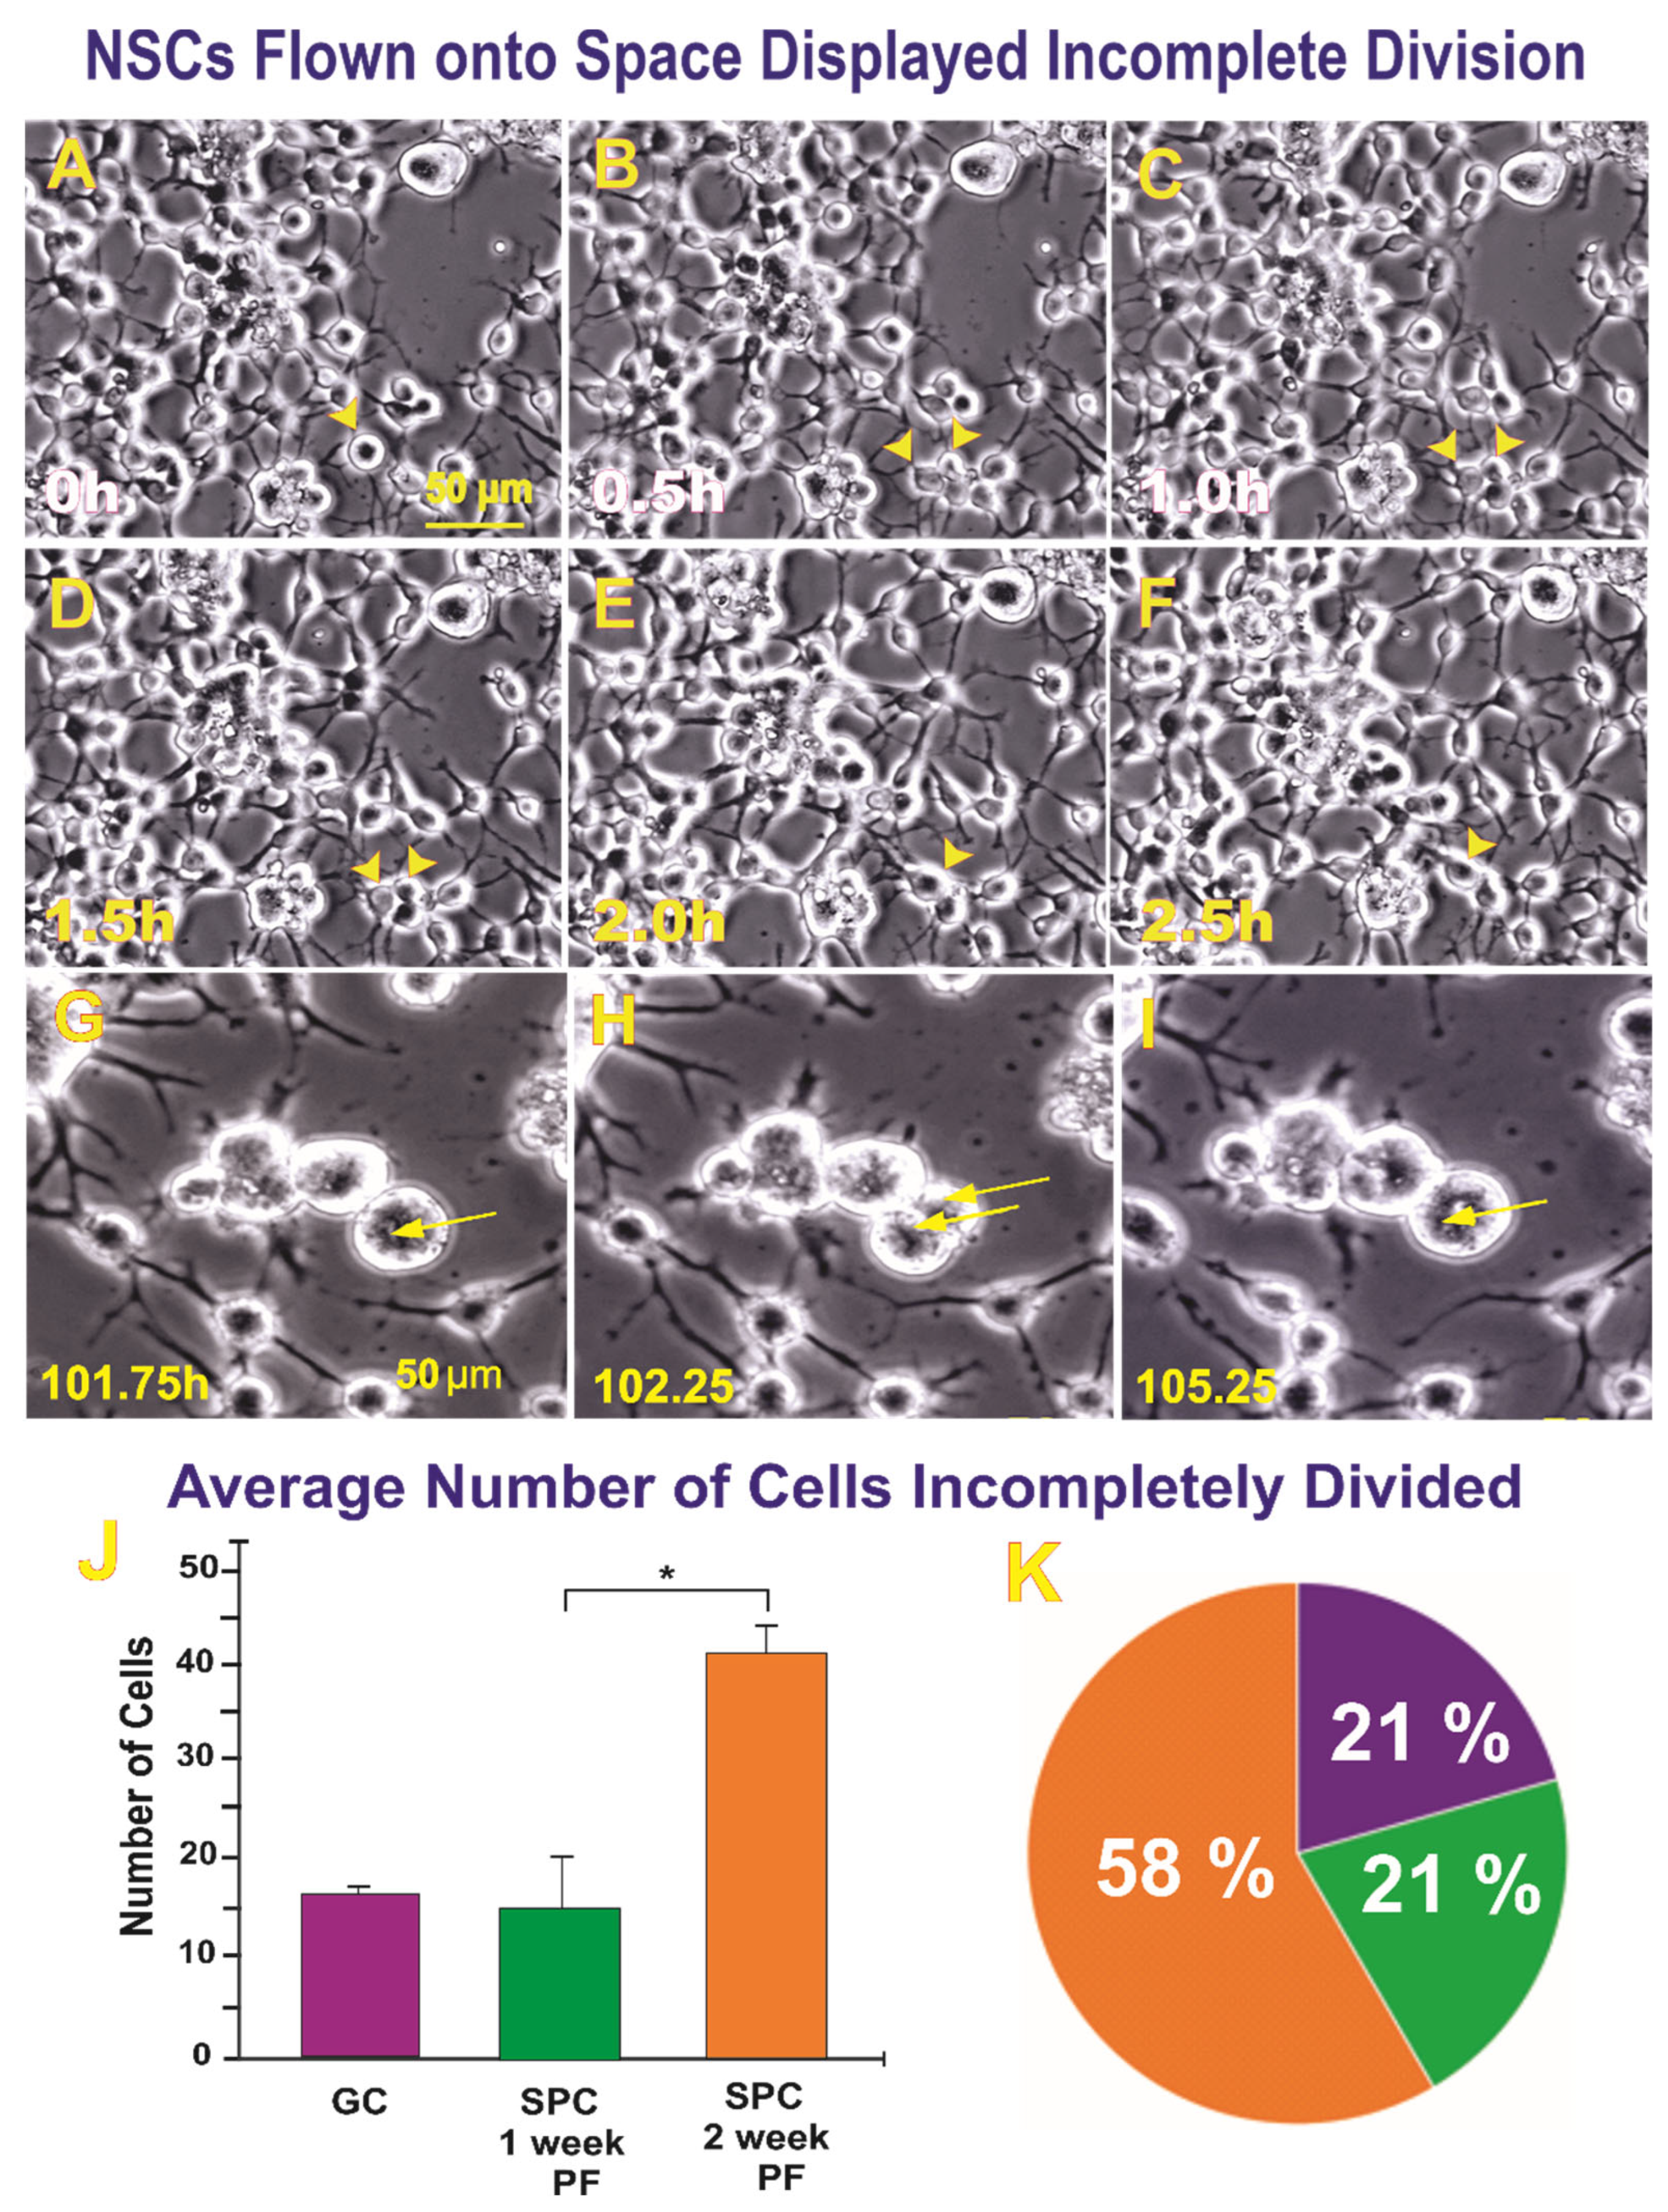
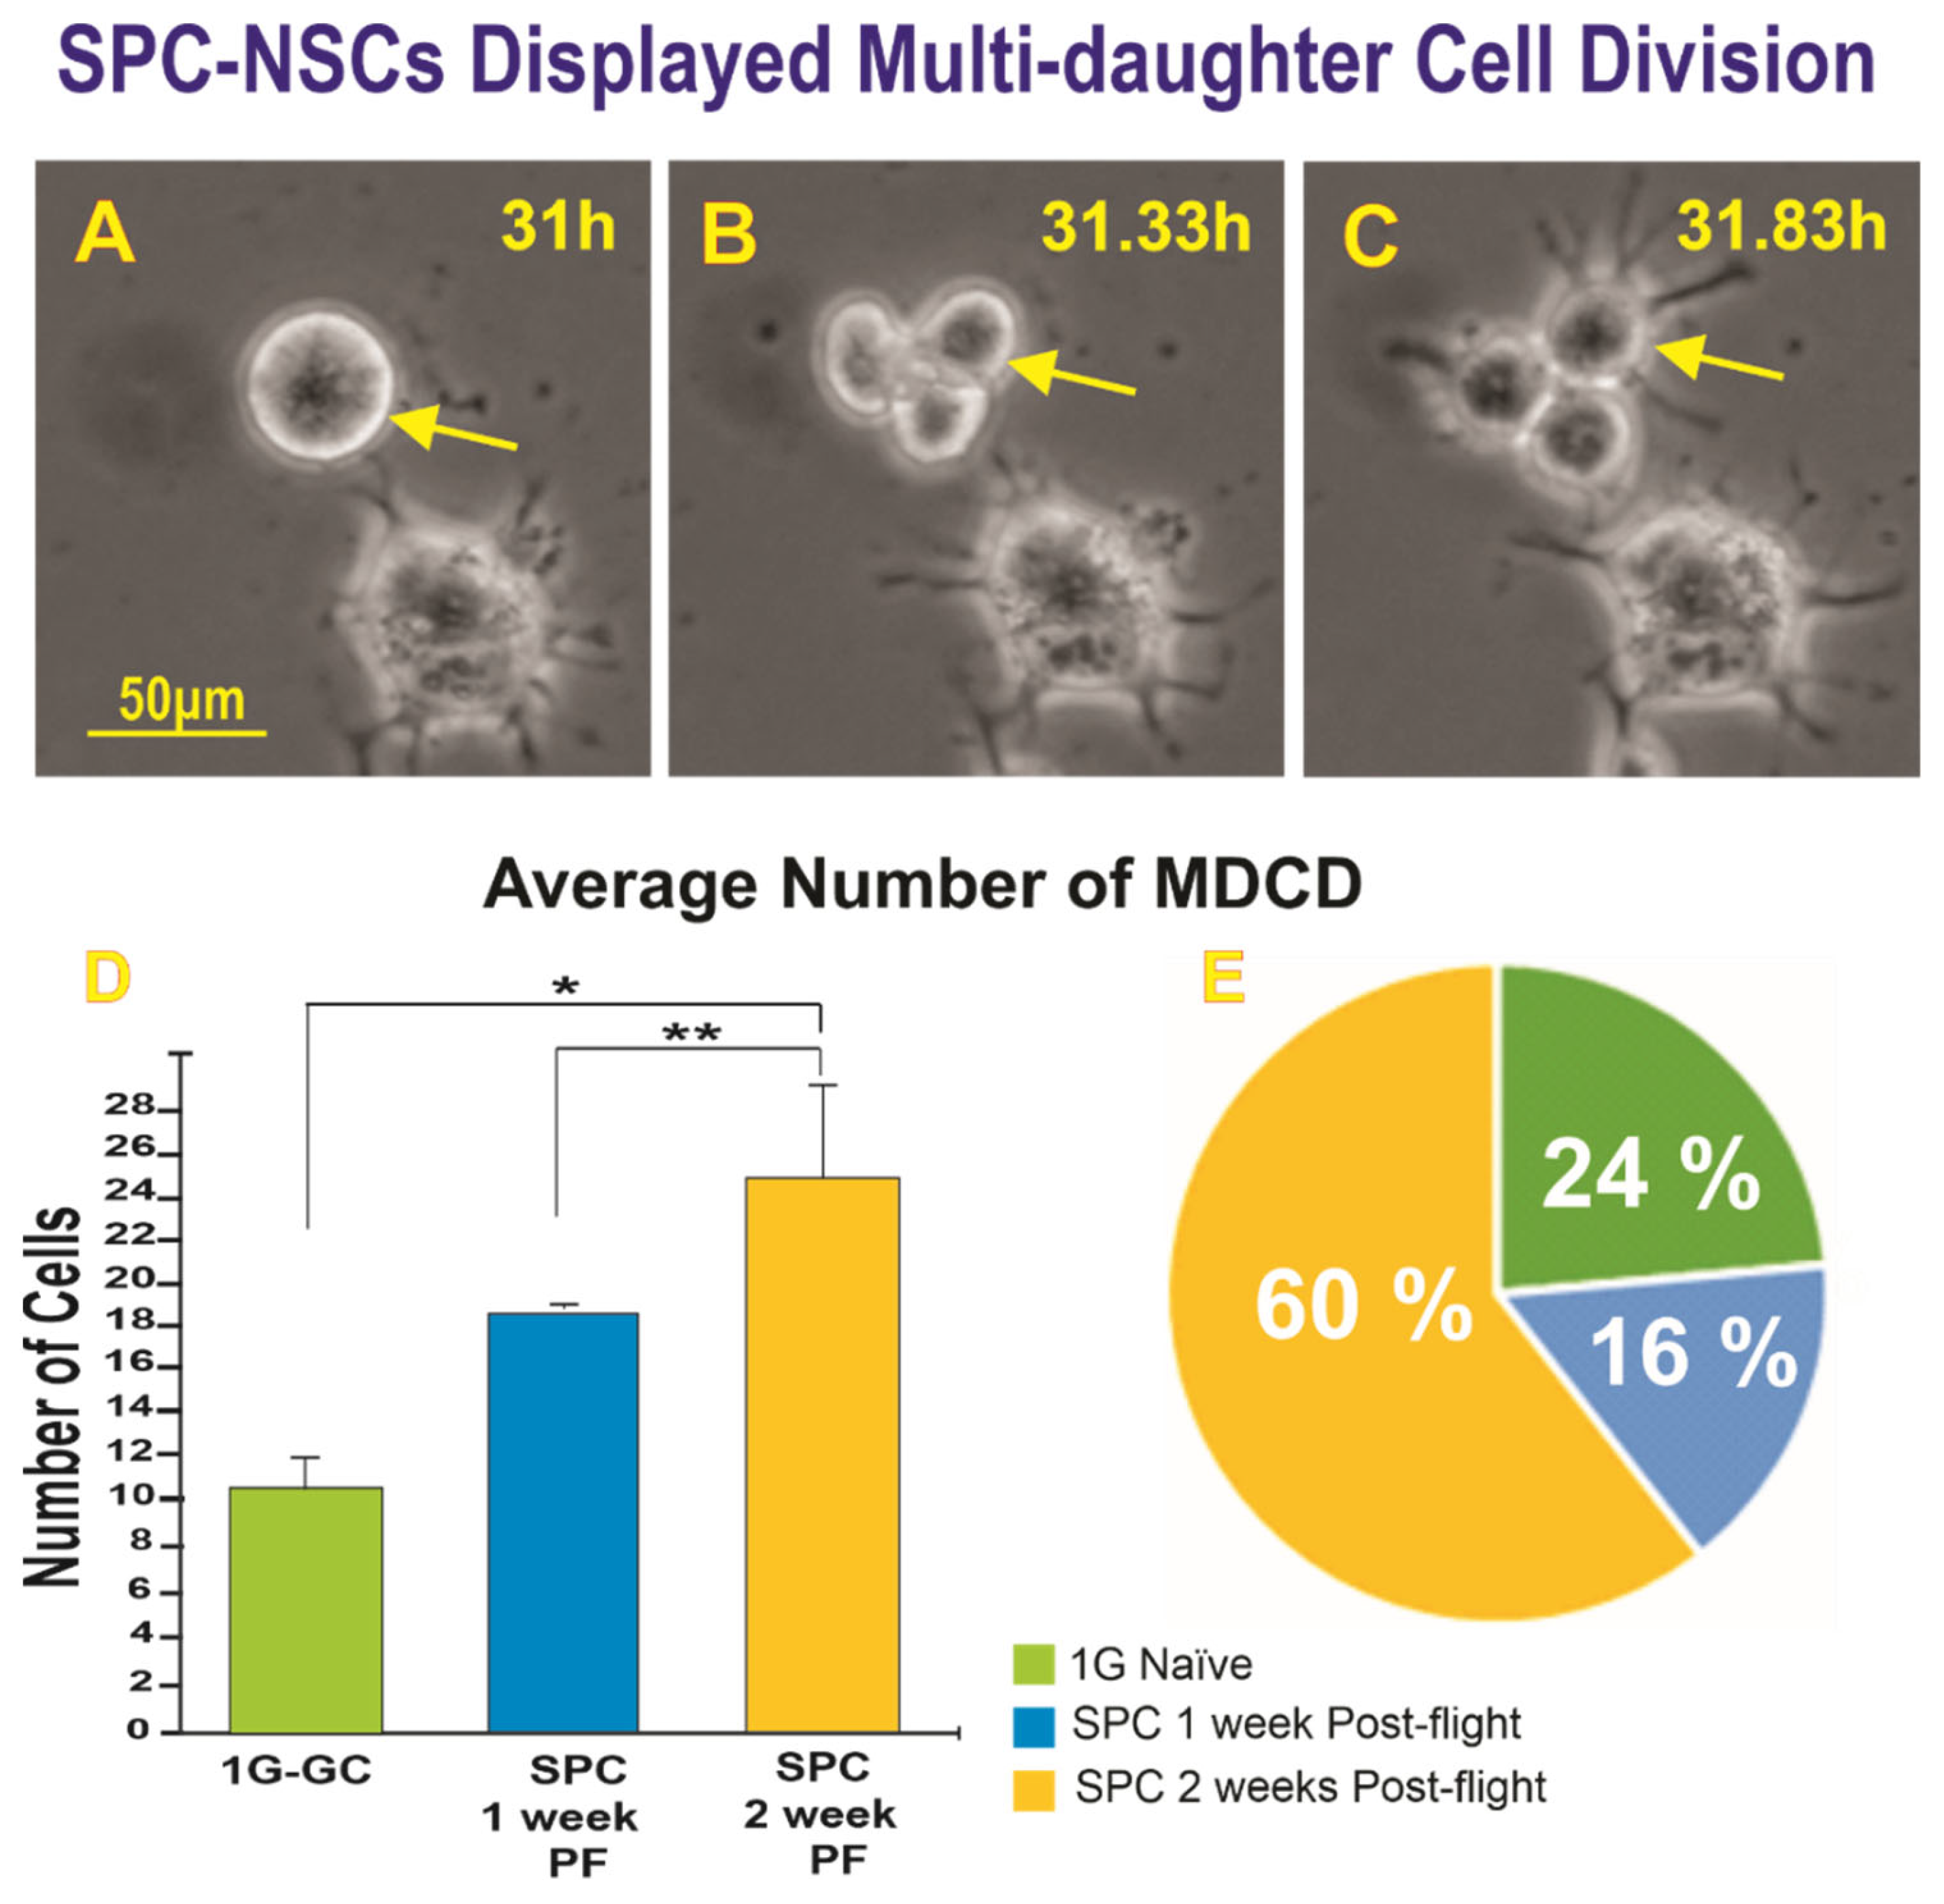
2.1. Time-Lapse Microscopy Analysis
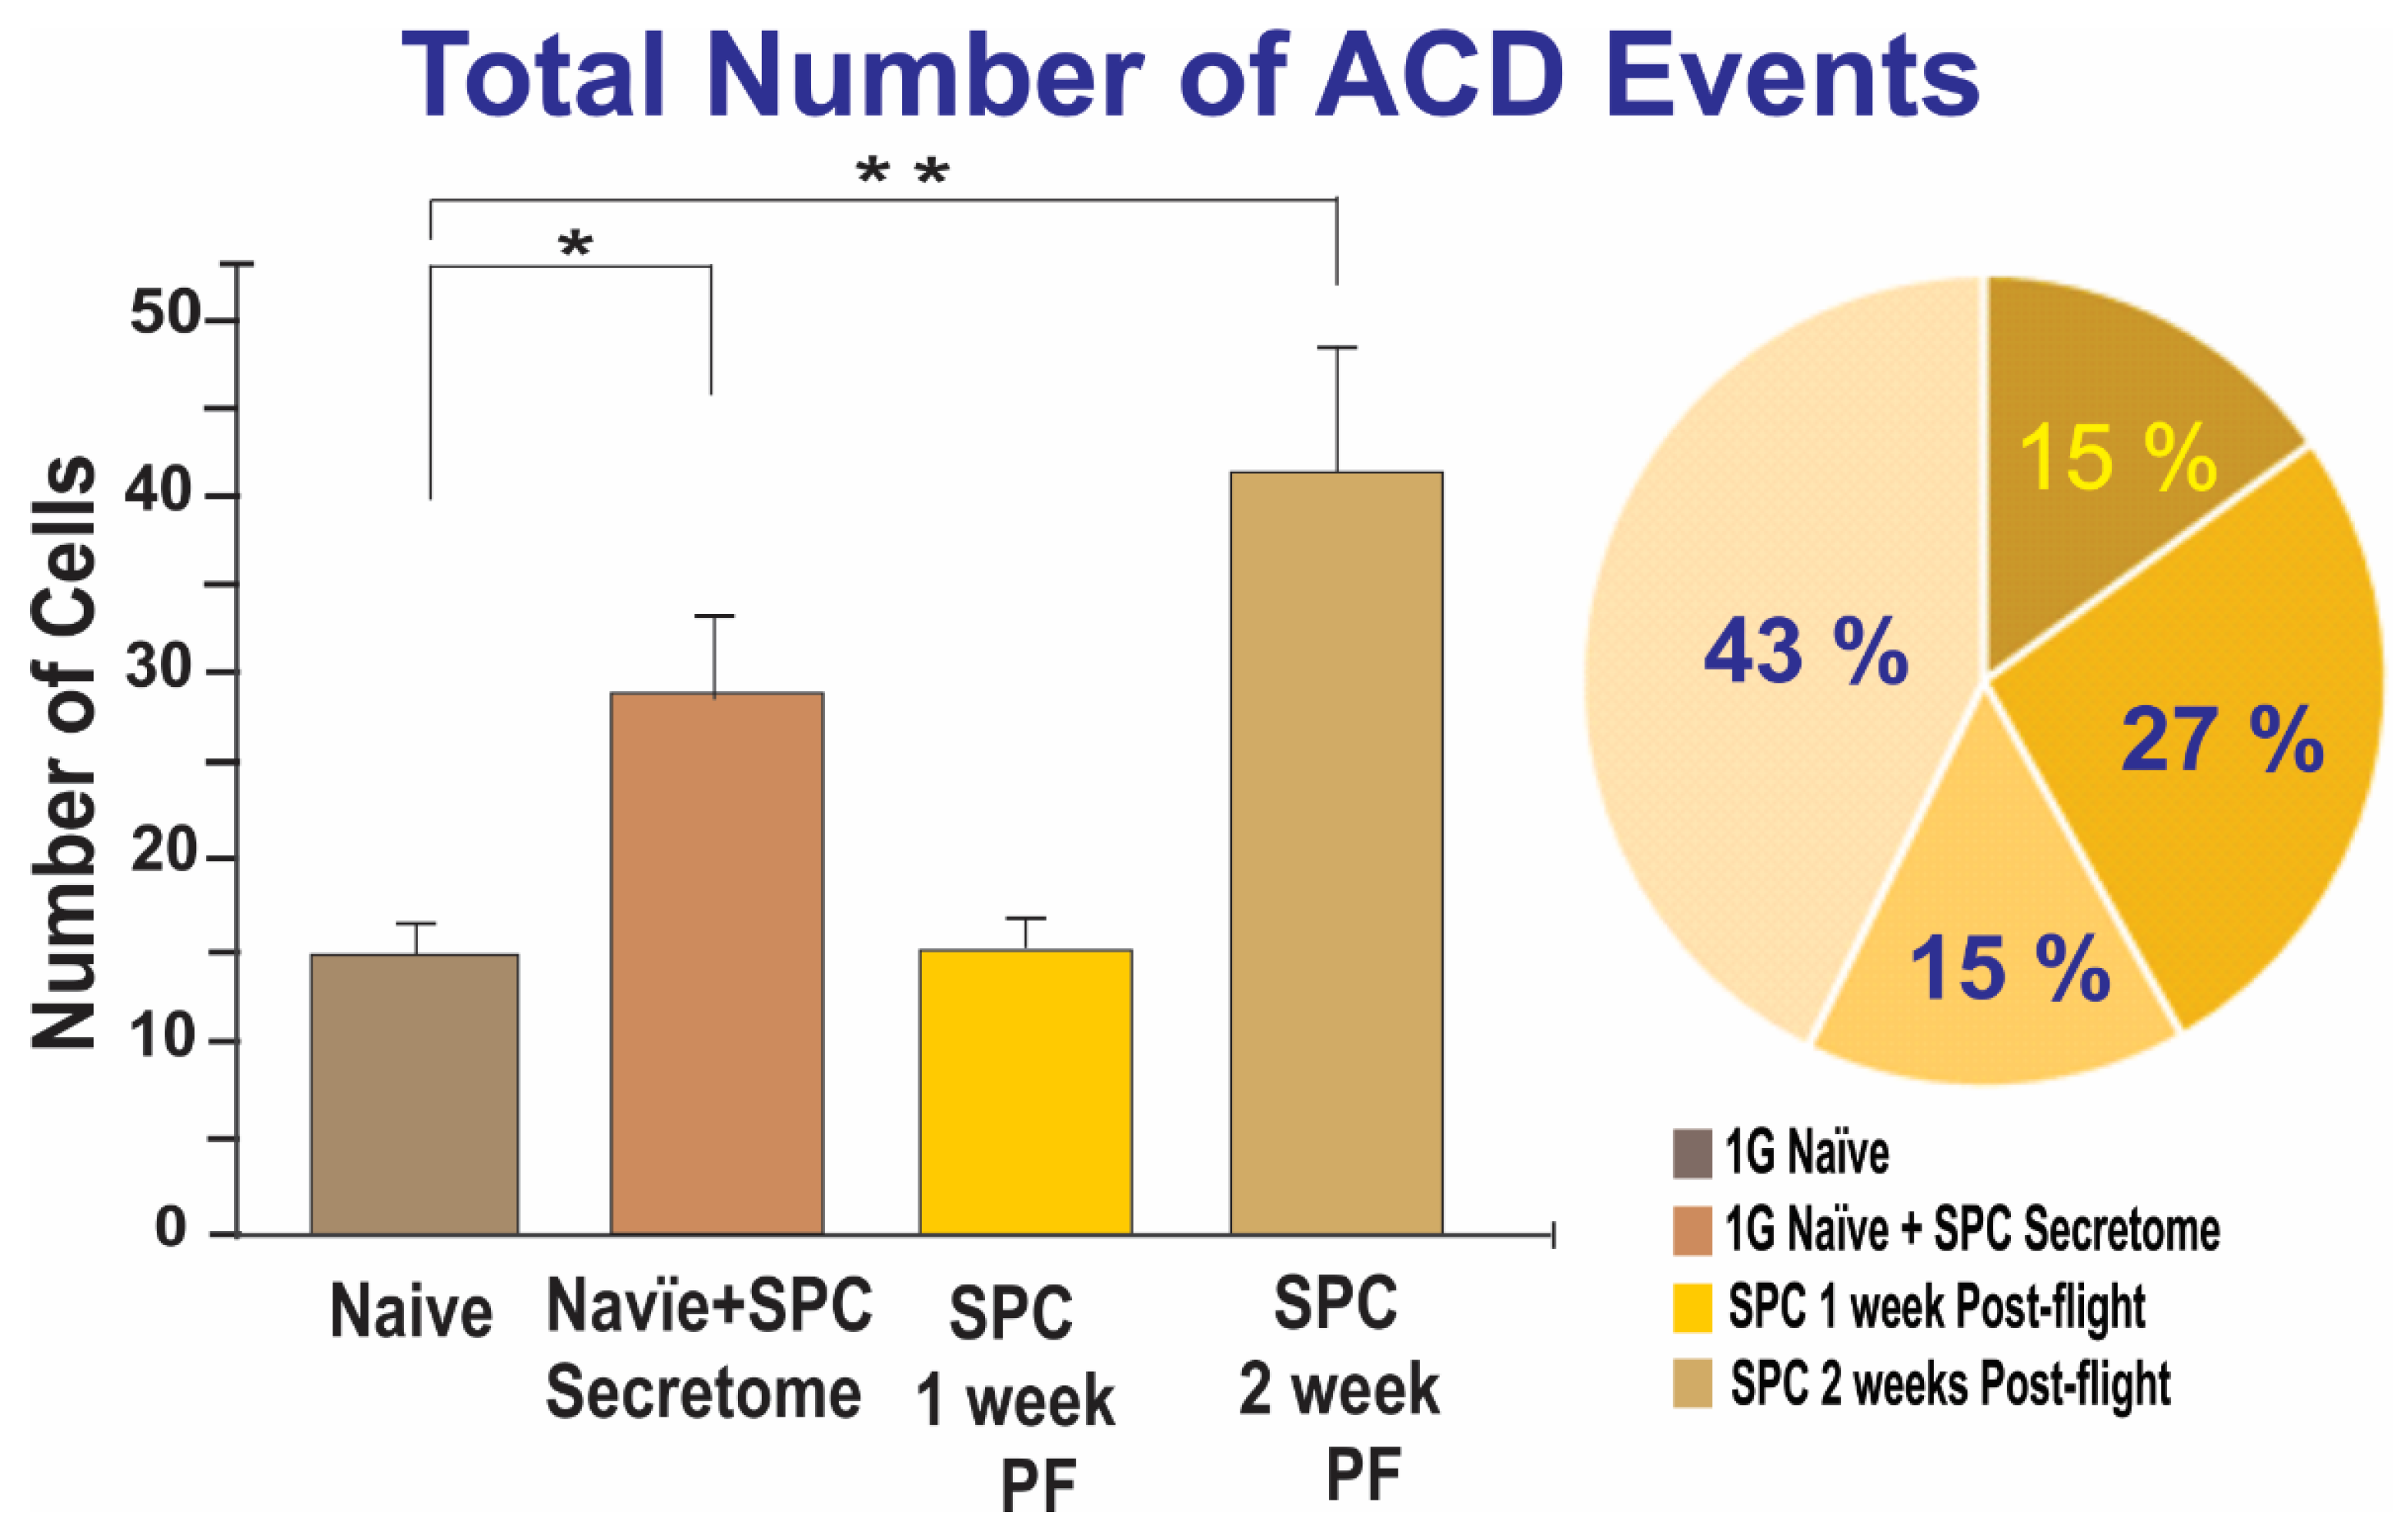
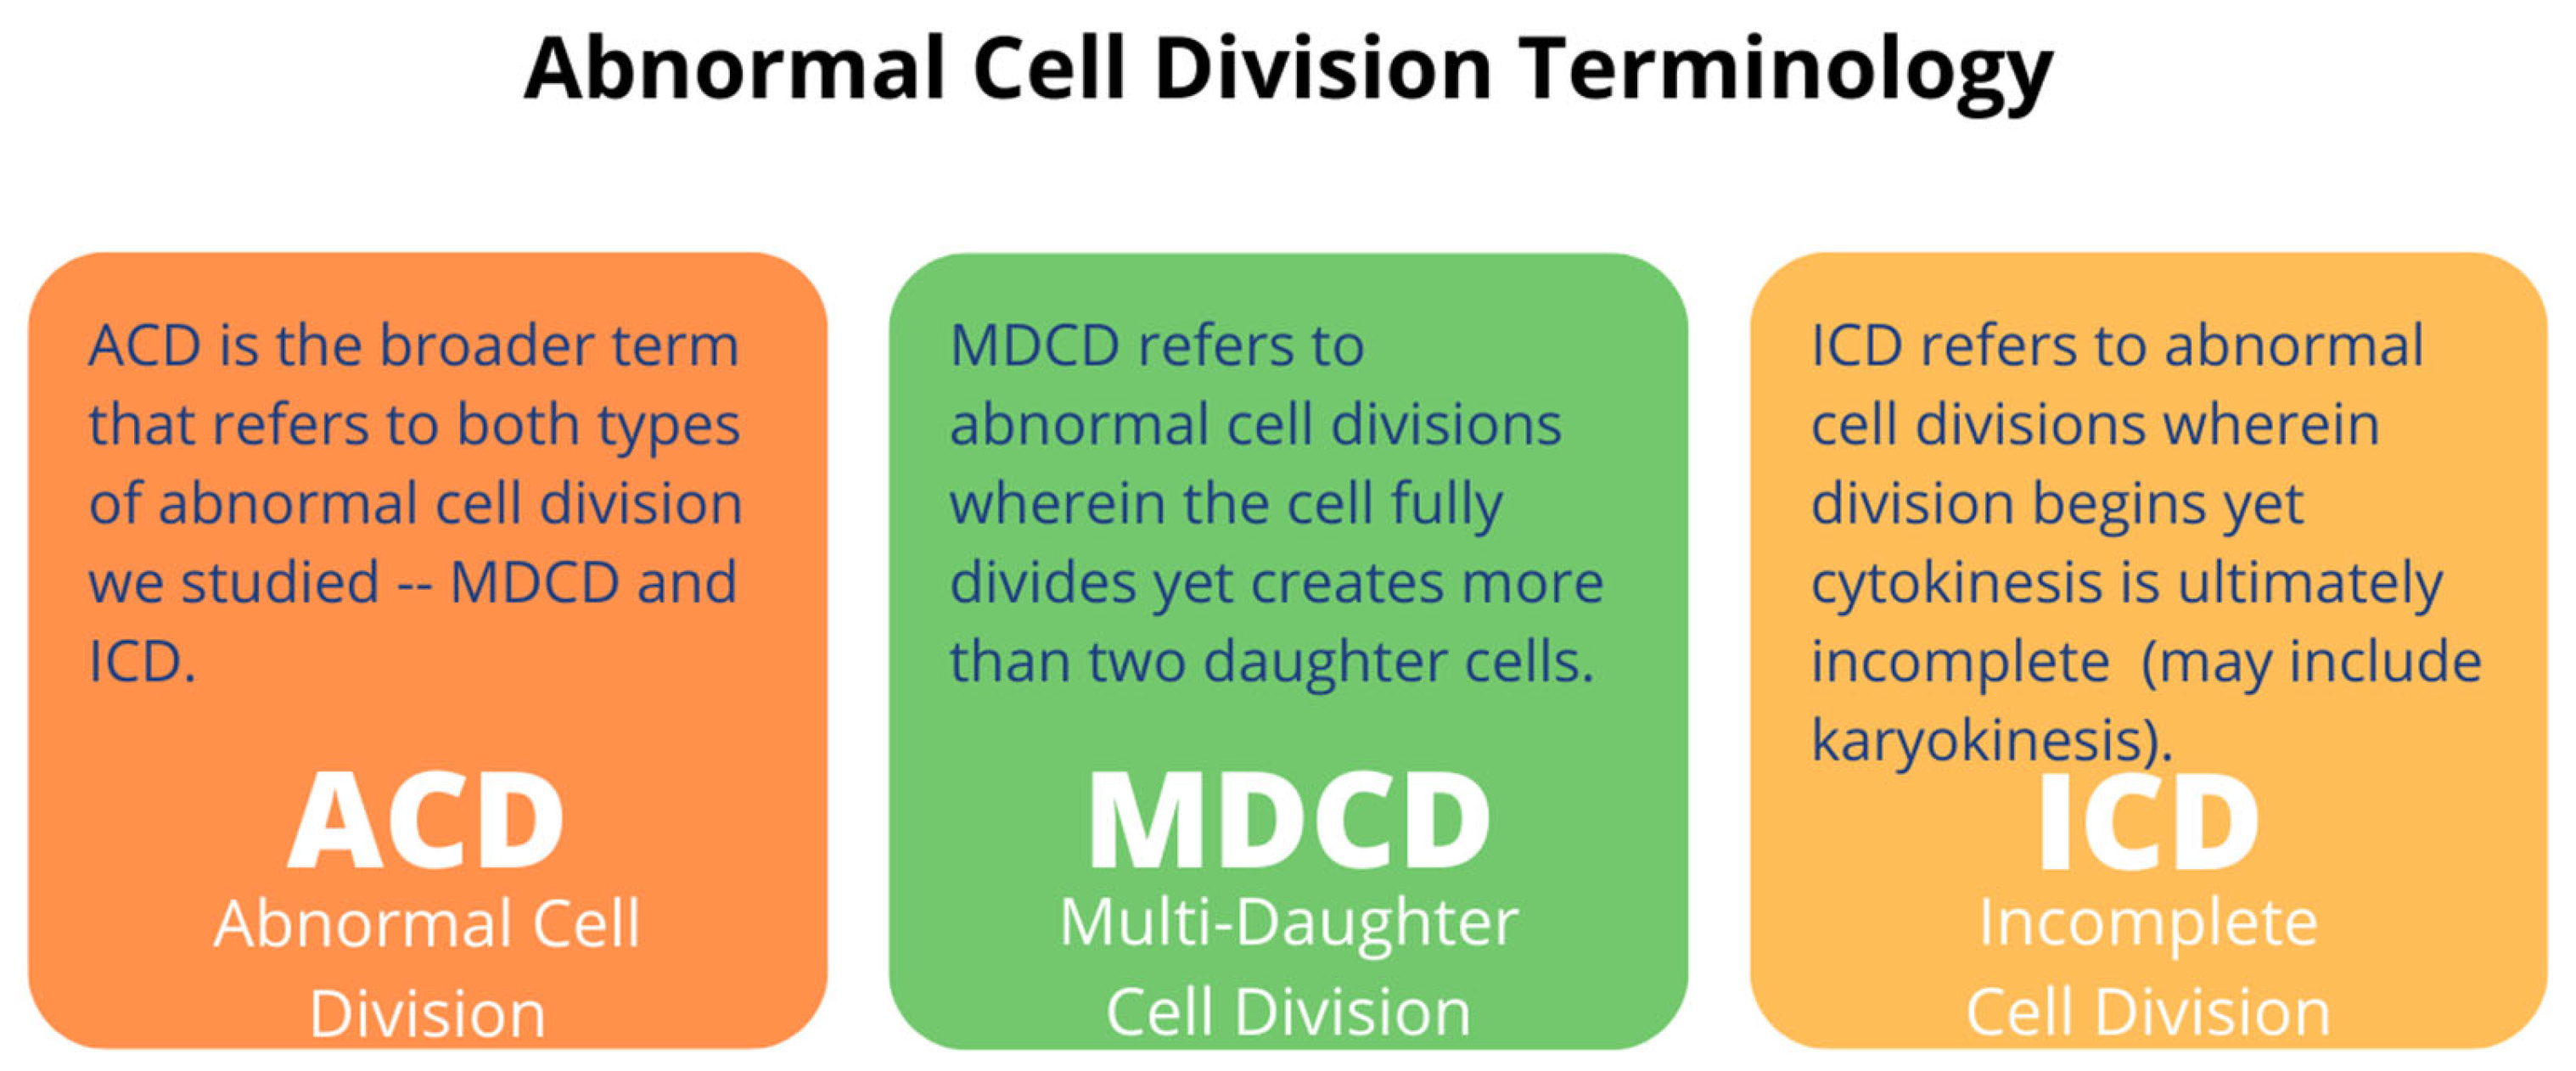
2.1.1. A Subpopulation of NSCs Back from Space Displayed Incomplete Divisions
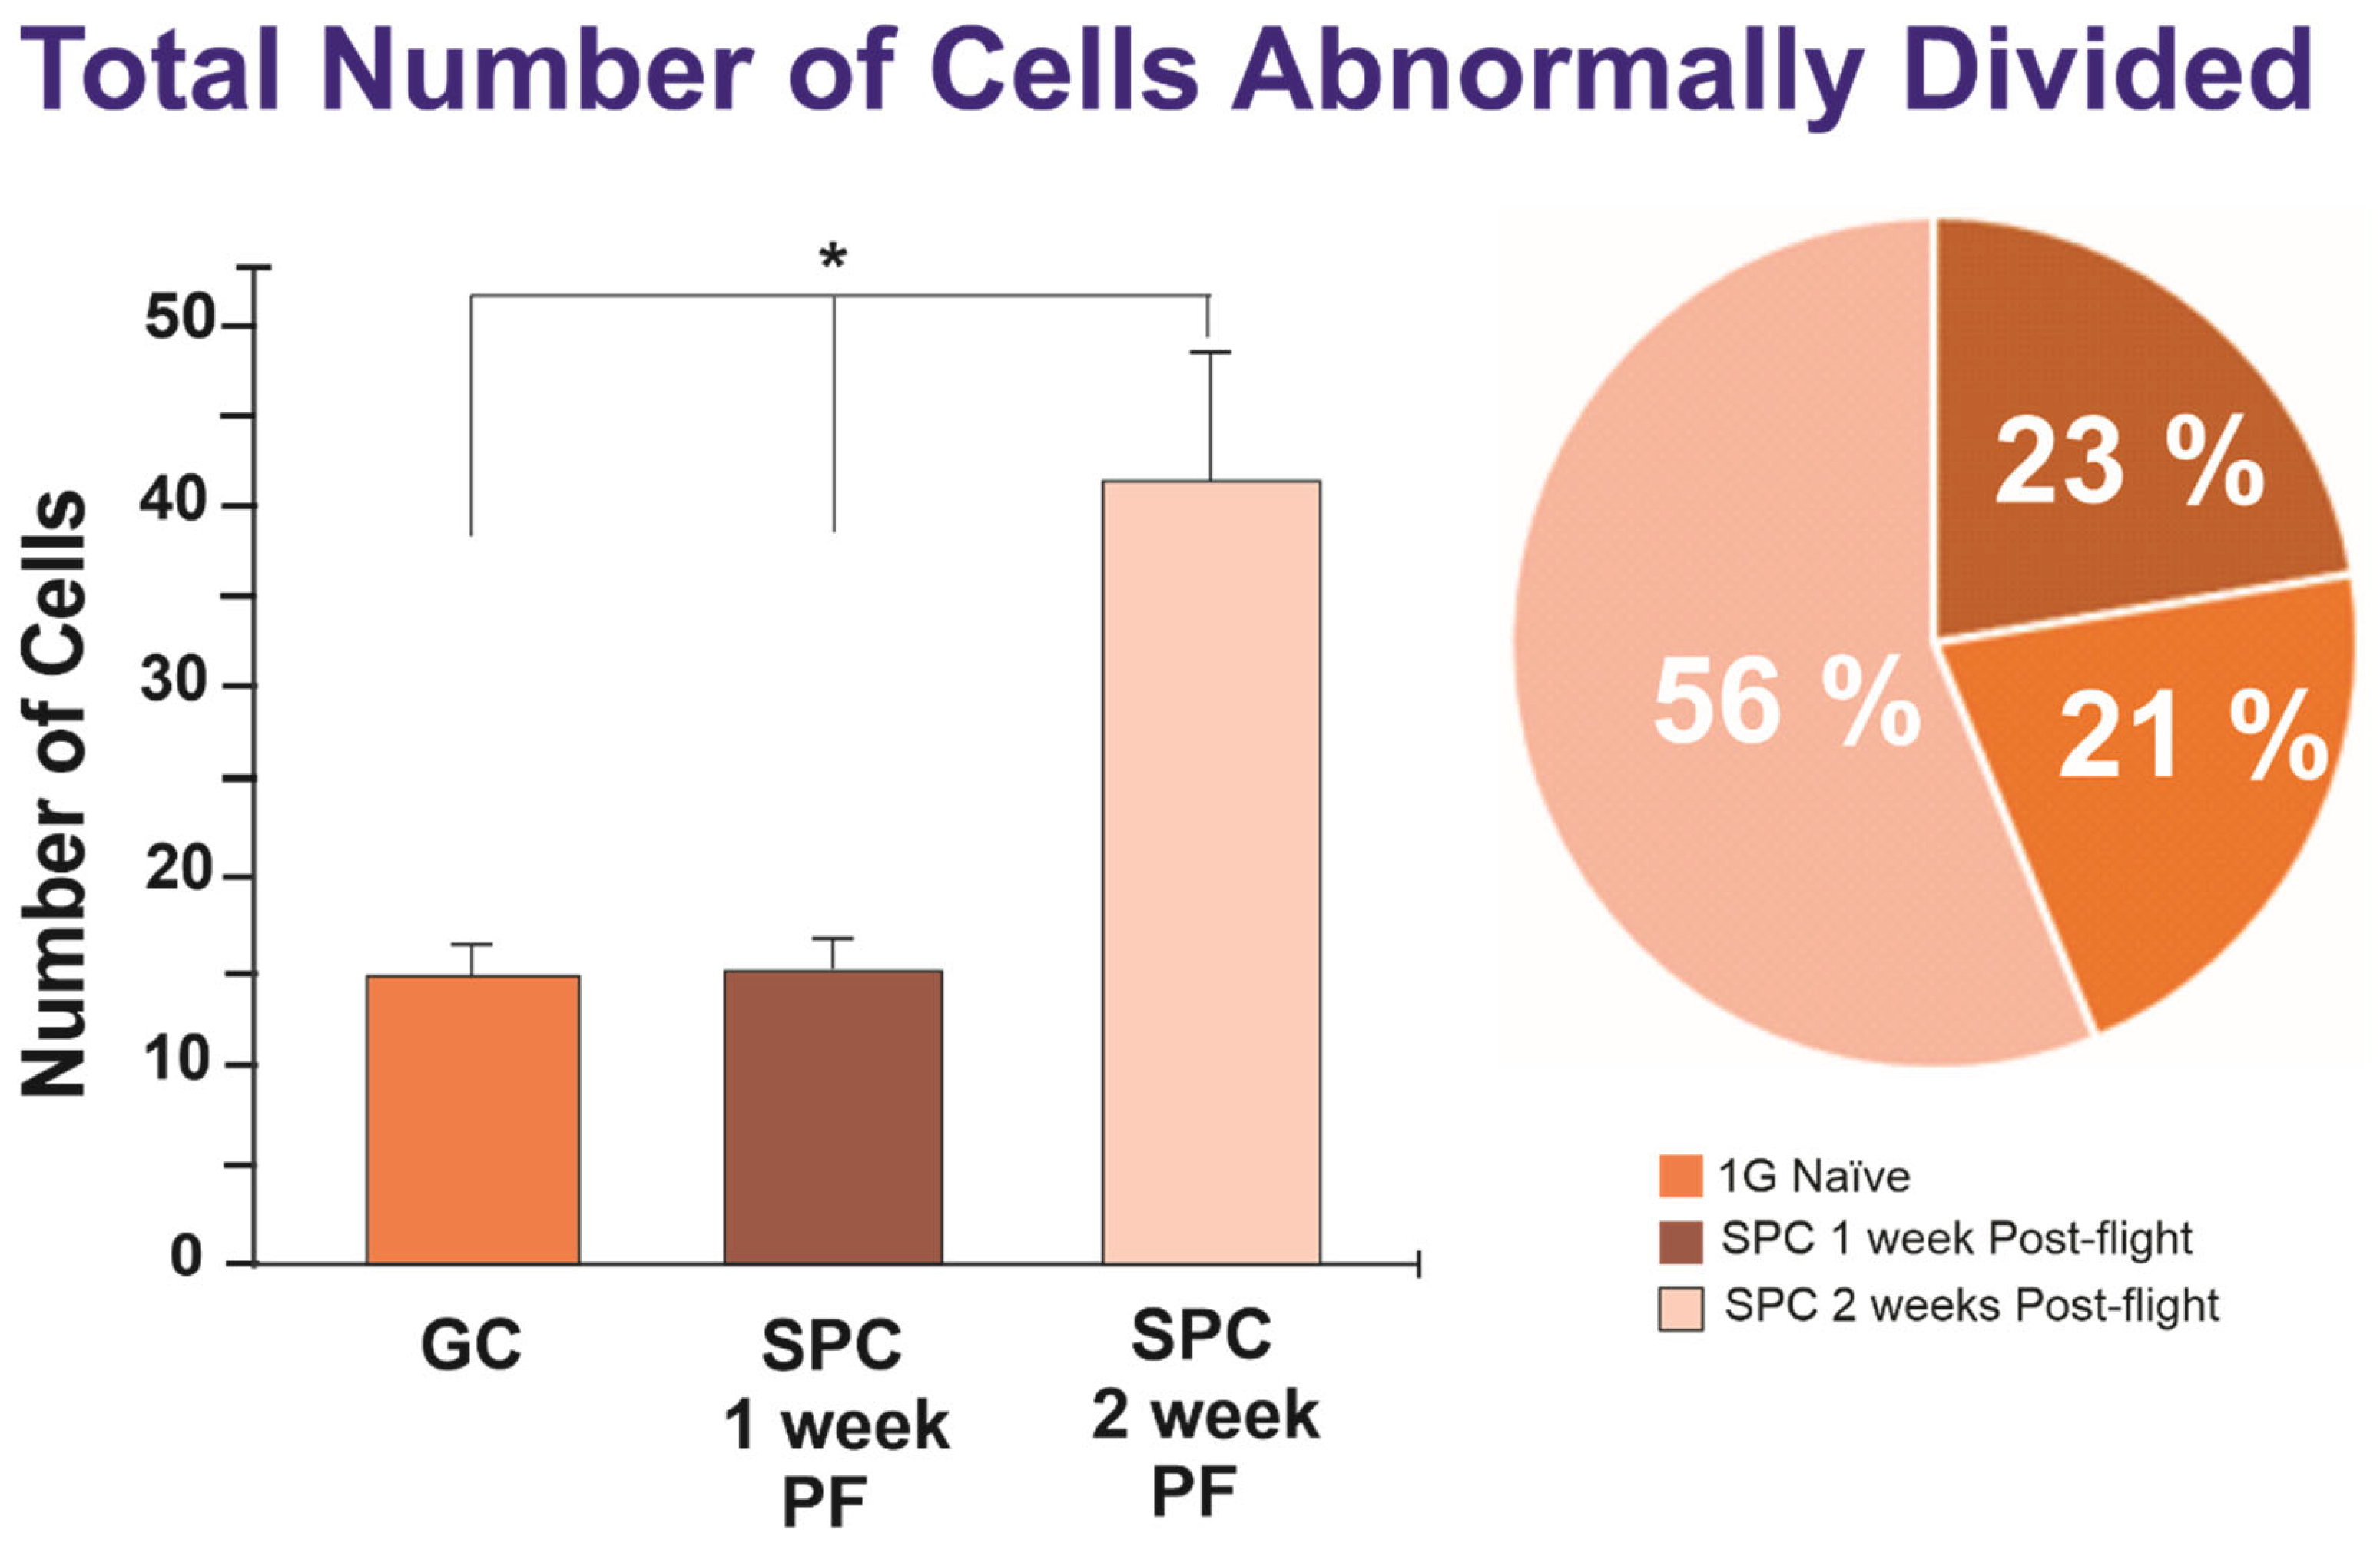
2.1.2. A Subpopulation of SPC-NSCs Displayed Multi-Daughter Cell Divisions
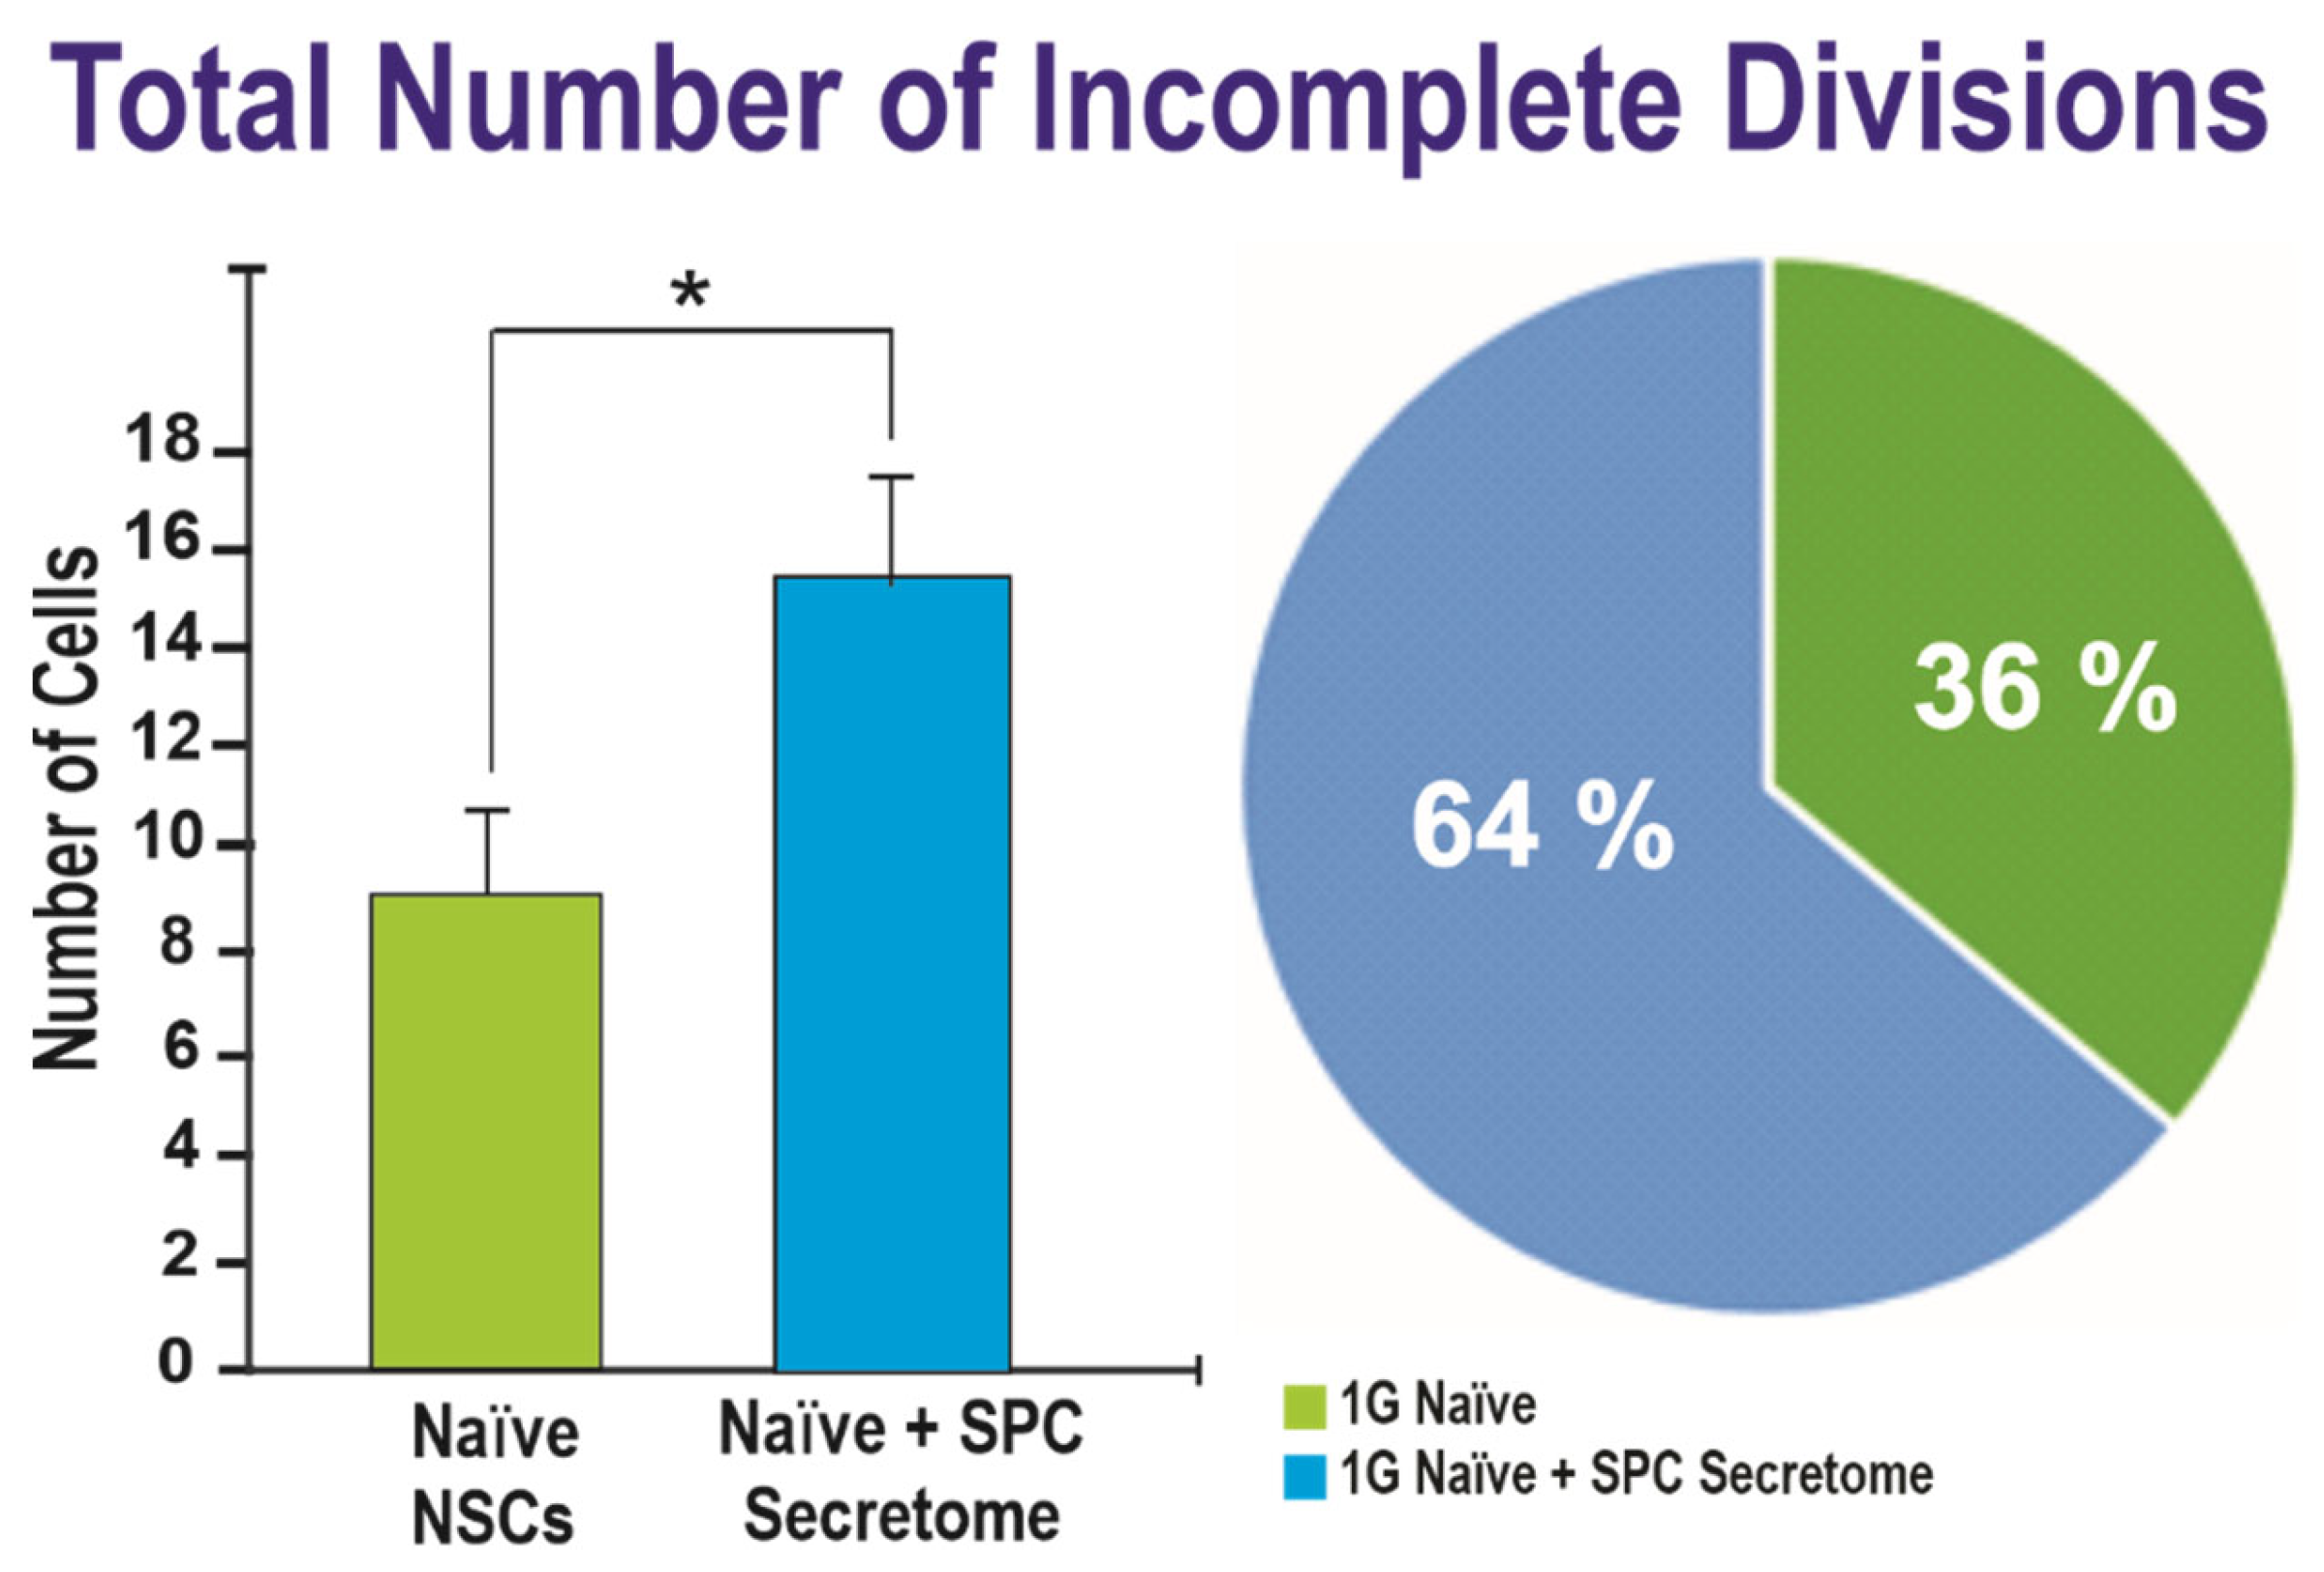
2.2. Effects of the Secretome on Naïve NSCs Cell Divisions
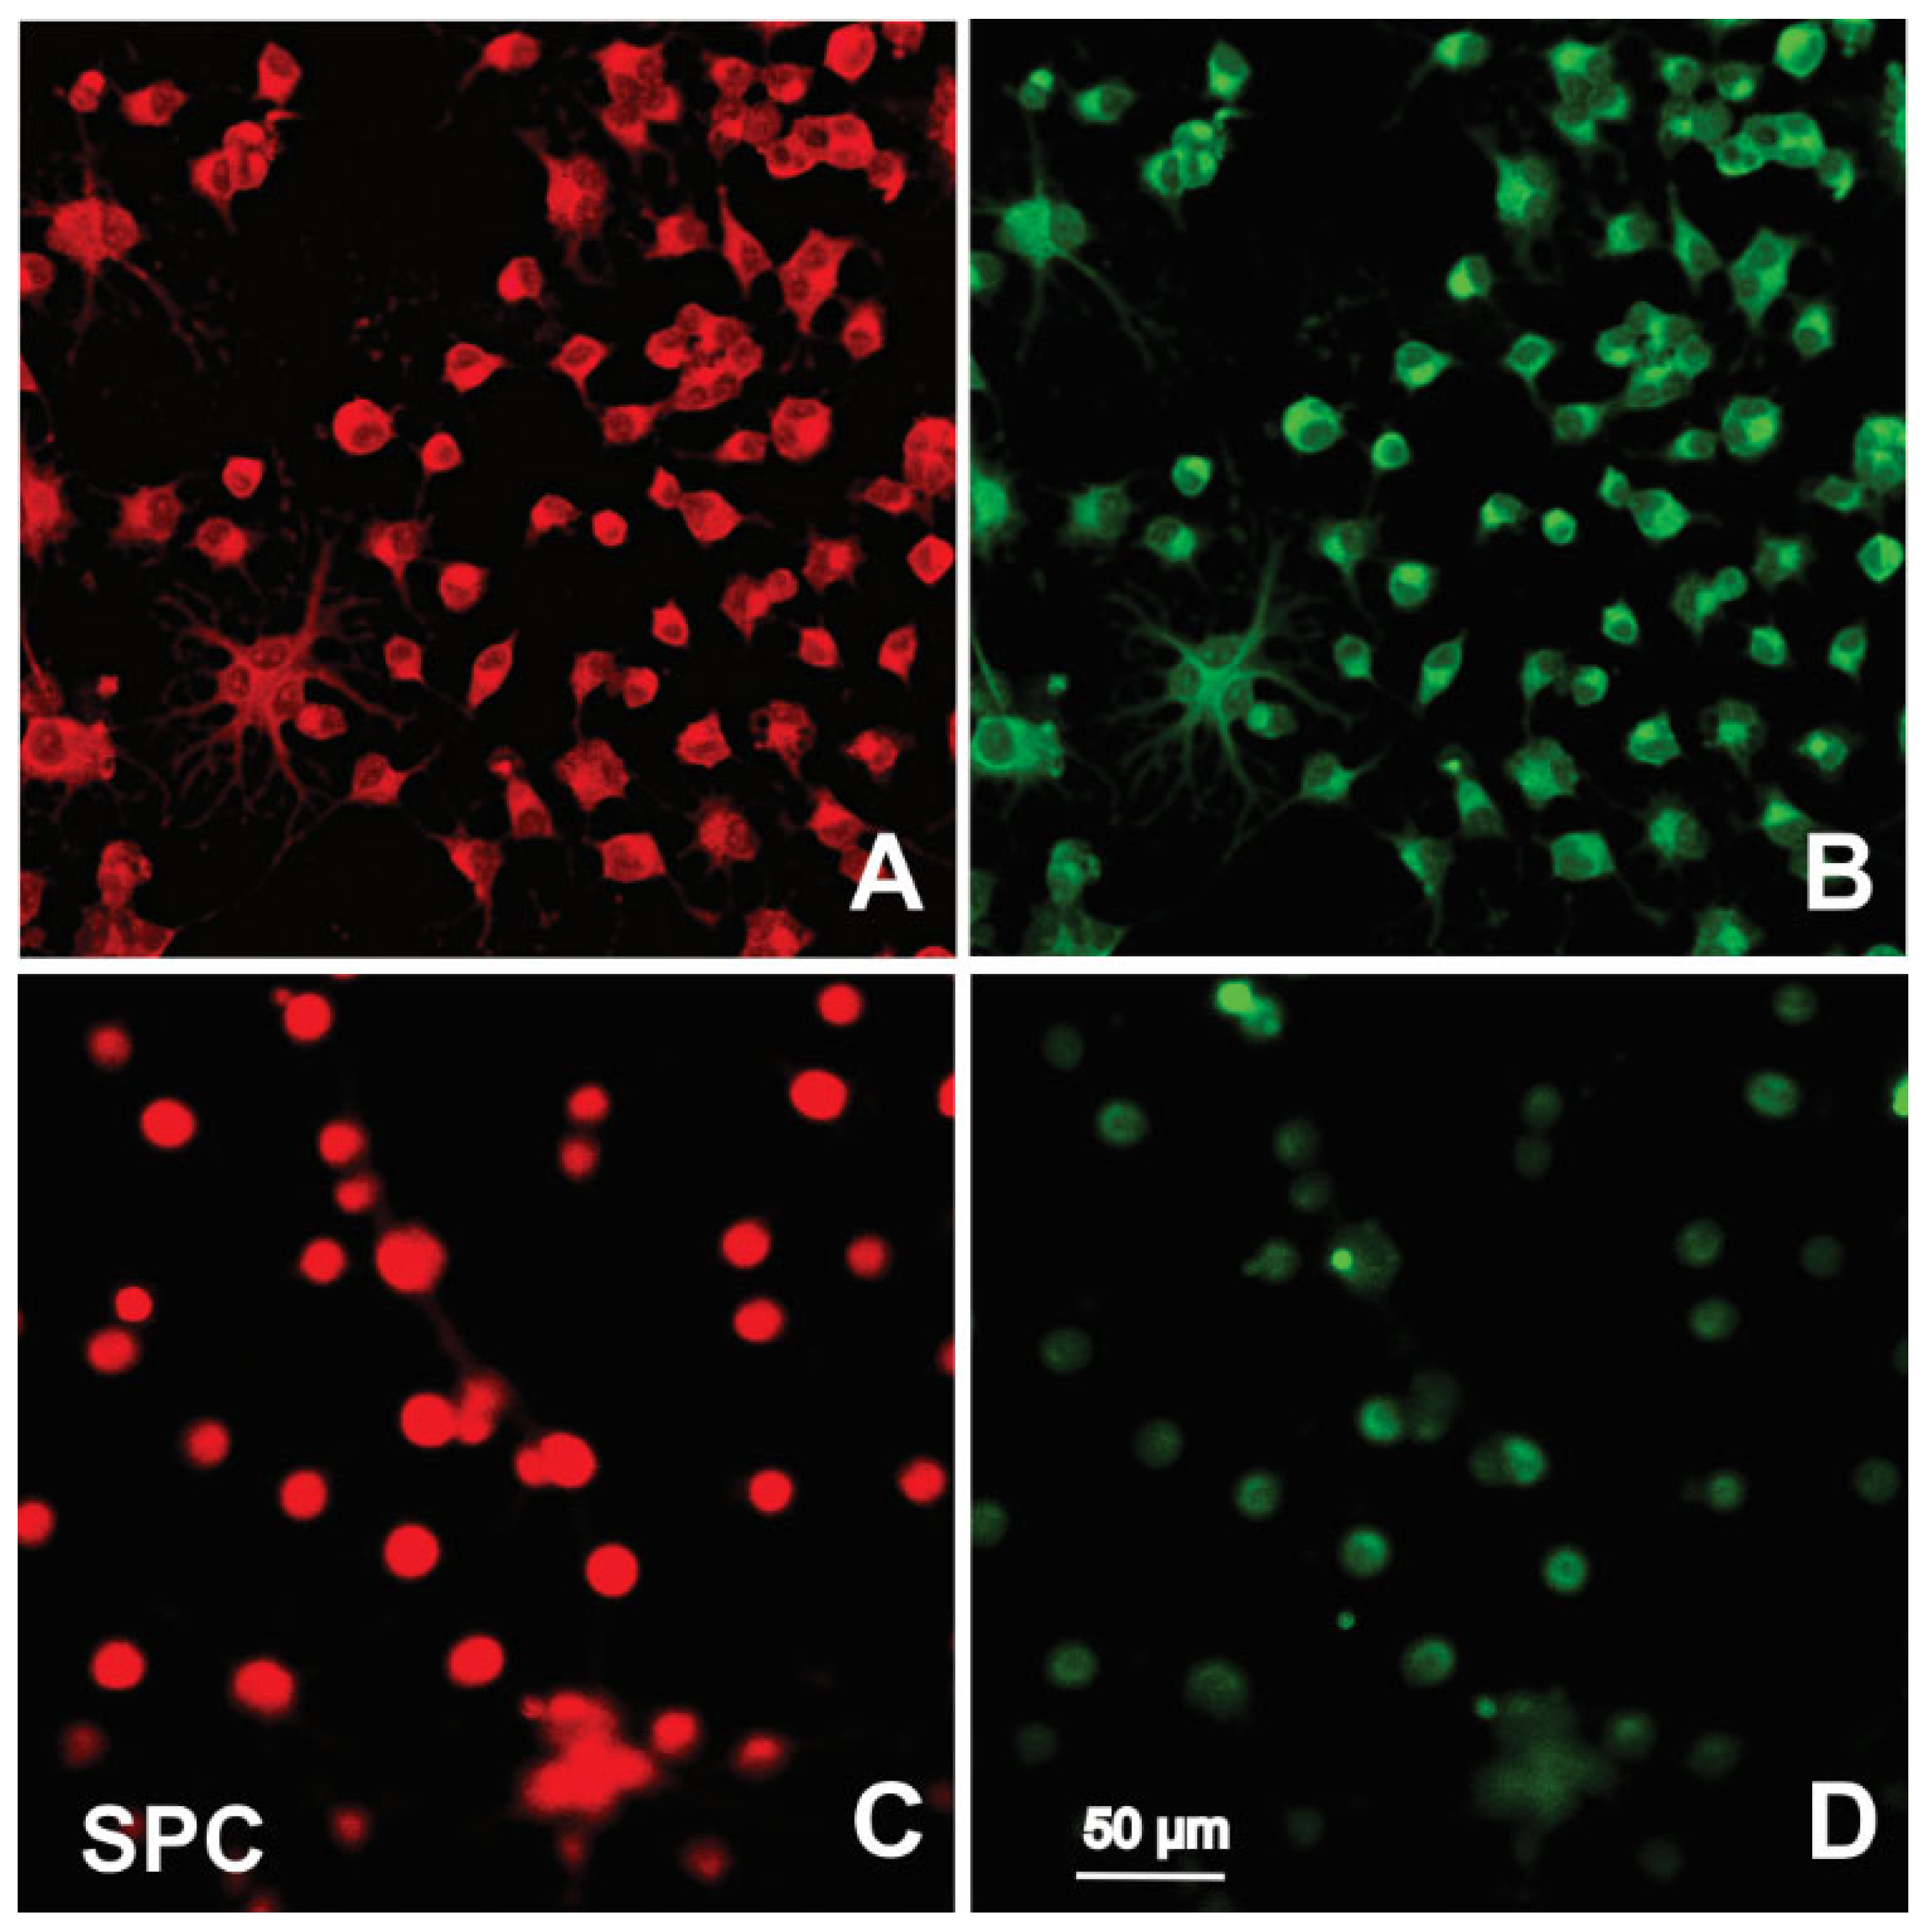
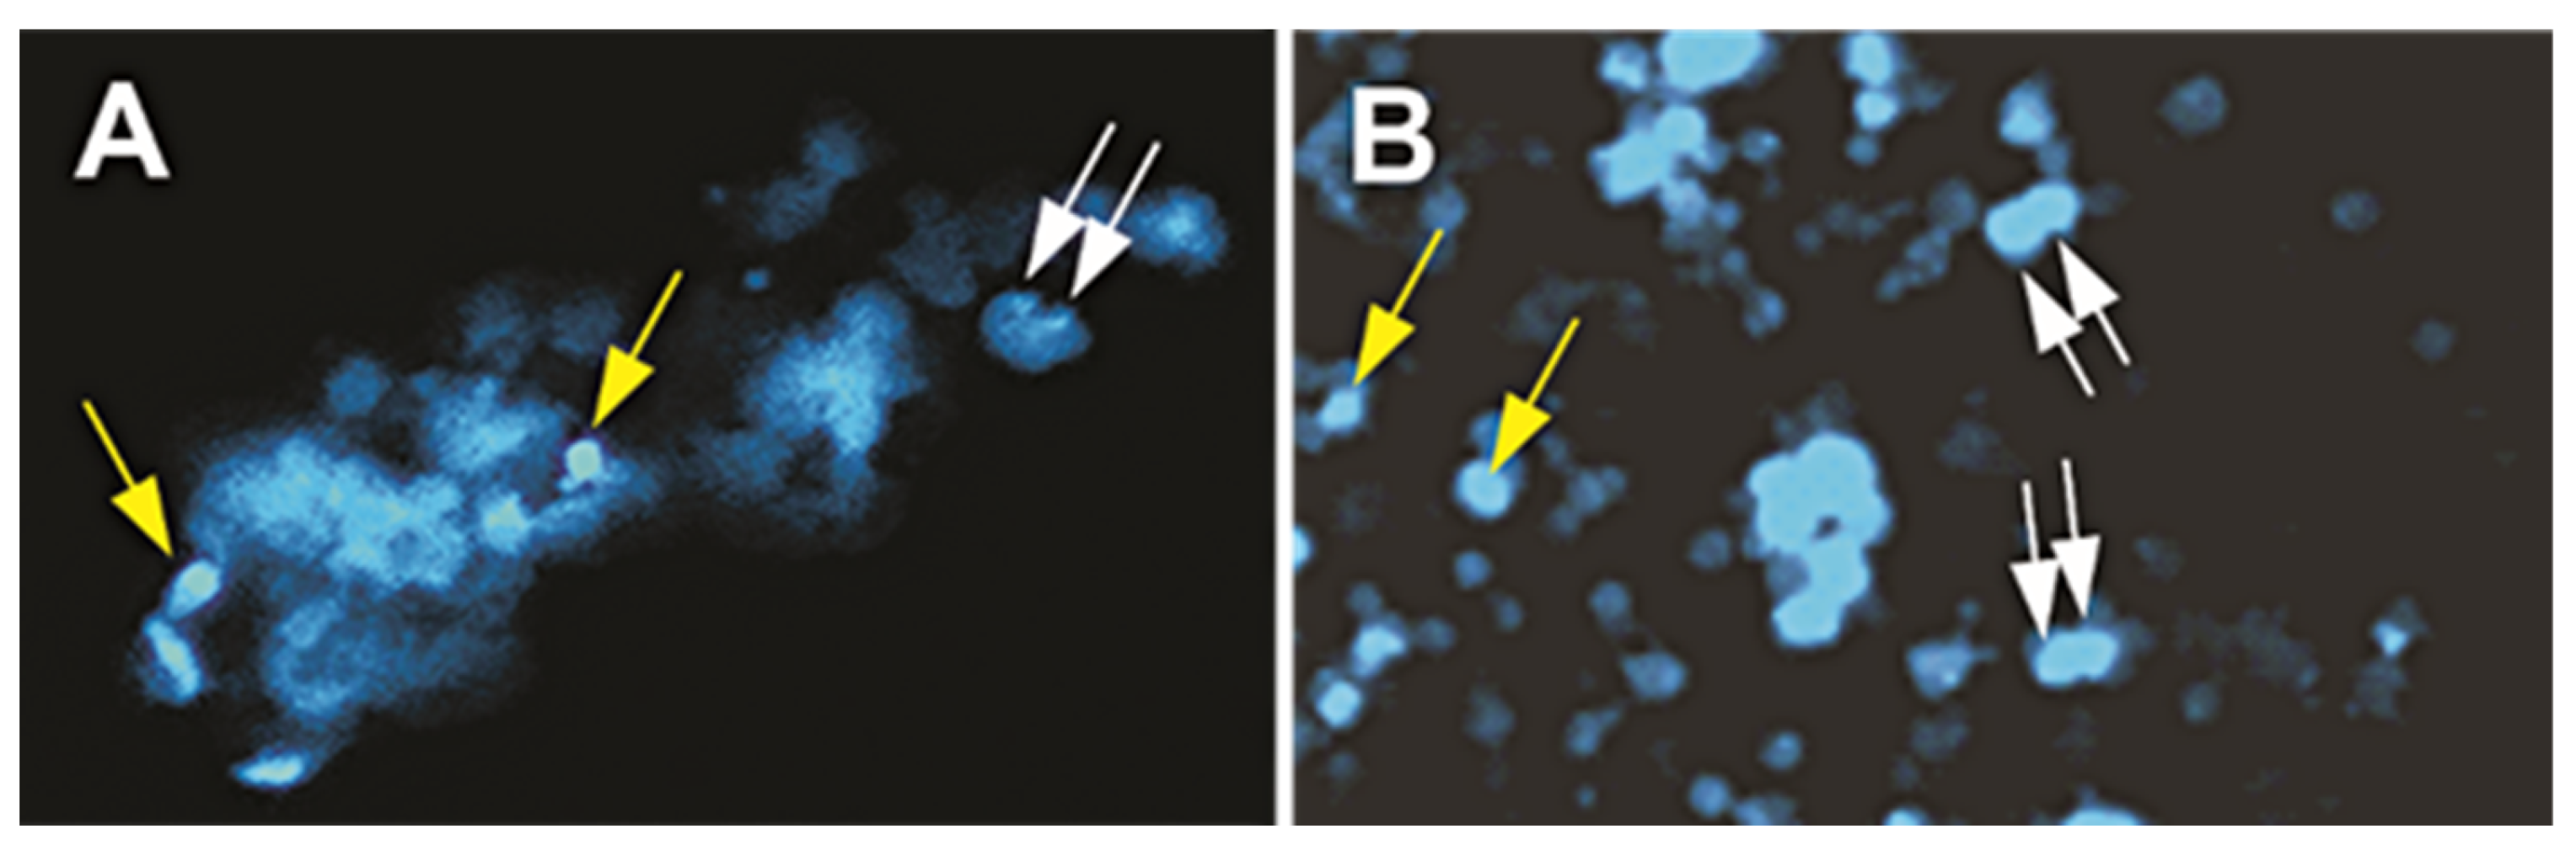
2.3. Immunofluorescence
3. Discussion
4. Materials and Methods
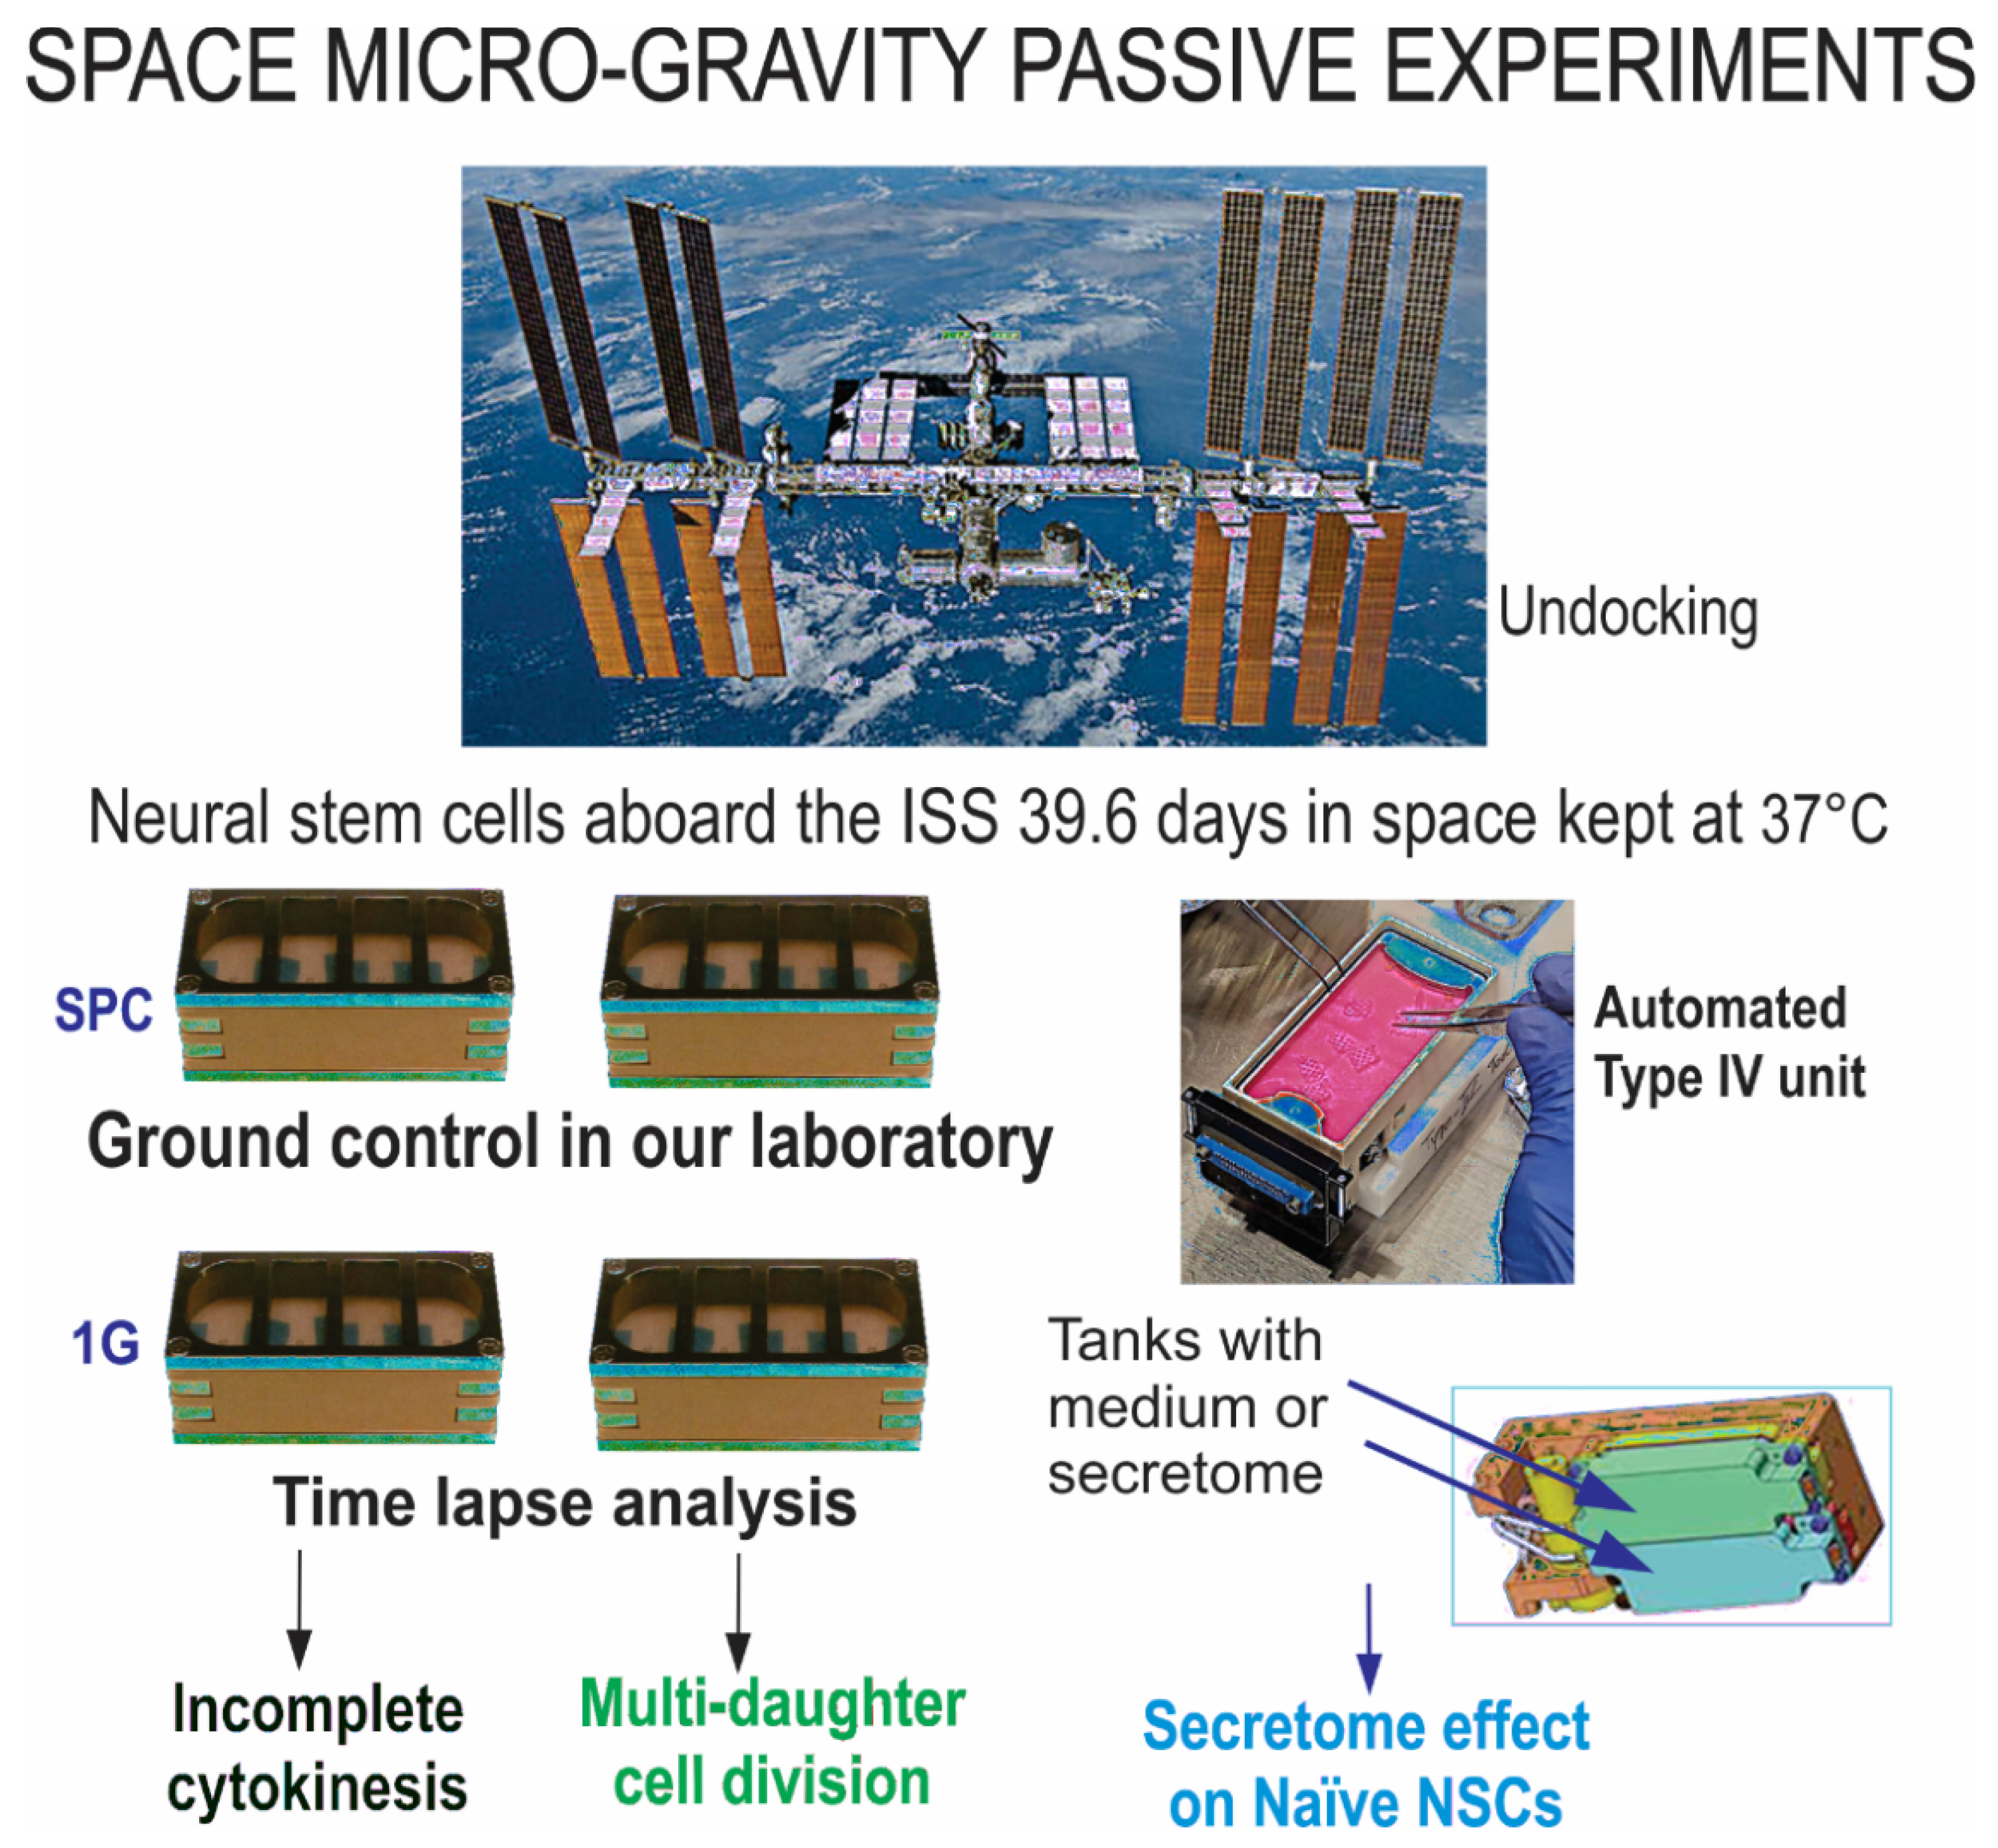
4.1. Space Flight
4.2. Secretome Collection and Naïve NSC Cell Treatment
4.3. Time-Lapse Microscopy Analysis
4.4. Immunofluorescence and Nuclear Staining
Supplementary Materials
Author Contributions
Funding
Data Availability Statement
Acknowledgments
Conflicts of Interest
References
- Zhang, L.-F.; Hargens, A.R. Spaceflight-Induced Intracranial Hypertension and Visual Impairment: Pathophysiology and Countermeasures. Physiol. Rev. 2018, 98, 59–87. [Google Scholar] [CrossRef] [PubMed]
- Lee, A.G.; Mader, T.H.; Gibson, C.R.; Tarver, W.; Rabiei, P.; Riascos, R.F.; Galdamez, L.A.; Brunstetter, T. Spaceflight associated neuro-ocular syndrome (SANS) and the neuro-ophthalmologic effects of microgravity: A review and an update. NPJ Microgravity 2020, 6, 7. [Google Scholar] [CrossRef]
- Grimm, D.; Egli, M.; Krüger, M.; Riwaldt, S.; Corydon, T.J.; Kopp, S.; Wehland, M.; Wise, P.; Infanger, M.; Mann, V.; et al. Tissue Engineering Under Microgravity Conditions–Use of Stem Cells and Specialized Cells. Stem Cells Dev. 2018, 27, 787–804. [Google Scholar] [CrossRef]
- Espinosa-Jeffrey, A.; Paez, P.; Cheli, V.; Spreuer, V.; Wanner, I.; De Vellis, J. Impact of Simulated Microgravity on Oligodendrocyte Development: Implications for Central Nervous System Repair. PLoS ONE 2013, 8, e76963. [Google Scholar] [CrossRef]
- Silvano, M.; Miele, E.; Valerio, M.; Casadei, L.; Begalli, F.; Campese, A.; Besharat, Z.M.; Alfano, V.; Abballe, L.; Catanzaro, G. Consequences of Simulated Microgravity in Neural Stem Cells: Biological Effects and Metabolic Response. J. Stem Cells Res. Dev. Ther. 2015, 5, 289. [Google Scholar]
- Green, J.; Taniguchi, A.; Oregel, K.; Espinosa-Jeffrey, A.; UCLA. The Implications of Microgravity on Cell Morphology and Proliferation of Stem Cell Progenies towards Astronaut Health. IAC-16,A1,7,9,x35726. 2016. Available online: https://iafastro.directory/iac/paper/id/35726/summary/ (accessed on 9 November 2022).
- Han, Y.; Zeger, L.; Tripathi, R.; Egli, M.; Ille, F.; Lockowandt, C.; Florin, G.; Atic, E.; Redwan, I.N.; Fredriksson, R.; et al. Molecular genetic analysis of neural stem cells after space flight and simulated microgravity on earth. Biotechnol. Bioeng. 2021, 118, 3832–3846. [Google Scholar] [CrossRef] [PubMed]
- Shaka, S.; Carpo, N.; Tran, V.; Cepeda, C.; Espinosa-Jeffrey, A. Microgravity Significantly Influences Neural Stem Cells Size and Numbers: Implications for Long-term Space Missions. J. Stem Cells Res. Dev. Ther. 2021, 7, 1–9. [Google Scholar] [CrossRef]
- Normand, G.; King, R.W. Understanding Cytokinesis Failure. Adv. Exp. Med. Biol. 2010, 676, 27–55. [Google Scholar] [CrossRef]
- Kroemer, G. Tetraploid cancer cell precursors. Nat. Rev. Mol. Cell Biol. 2010, 11, 539. [Google Scholar] [CrossRef]
- Ohnuma, S.-I.; Harris, W.A. Neurogenesis and the Cell Cycle. Neuron 2003, 40, 199–208. [Google Scholar] [CrossRef]
- Obernier, K.; Alvarez-Buylla, A. Neural stem cells: Origin, heterogeneity and regulation in the adult mammalian brain. Development 2019, 146, dev156059. [Google Scholar] [CrossRef] [PubMed]
- Shaka, S.; Carpo, N.; Tran, V.; Ma, Y.-Y.; Karouia, F.; Espinosa-Jeffrey, A. Human Neural Stem Cells in Space Proliferate more than Ground Control Cells: Implications for Long-Term Space Travel. J. Stem Cells Res. Dev. Ther. 2021. [Google Scholar] [CrossRef]
- Collins, K.; Jacks, T.; Pavletich, N.P. The cell cycle and cancer. Proc. Natl. Acad. Sci. USA 1997, 94, 2776–2778. [Google Scholar] [CrossRef]
- King, T.C. Cell Injury, Cellular Responses to Injury, and Cell Death. In Elsevier’s Integrated Pathology; Elsevier: Amsterdam, The Netherlands, 2007; pp. 1–20. [Google Scholar] [CrossRef]
- Tse, H.T.K.; Weaver, W.M.; Di Carlo, D. Increased Asymmetric and Multi-Daughter Cell Division in Mechanically Confined Microenvironments. PLoS ONE 2012, 7, e38986. [Google Scholar] [CrossRef]
- Biancotti, J.C.; Carpo, N.; Zamudio, J.; Vergnes, L.; Espinosa-Jeffrey, A. Profiling the Secretome of Space Traveler Human Neural Stem Cells. J. Stem Cells Res. Dev. Ther. 2022, 8, 1–12. [Google Scholar] [CrossRef]
- Bornstein, P.; Sage, E. Matricellular proteins: Extracellular modulators of cell function. Curr. Opin. Cell Biol. 2002, 14, 608–616. [Google Scholar] [CrossRef]
- Brekken, R.A.; Sage, E. SPARC, a matricellular protein: At the crossroads of cell–matrix communication: [Matrix Biology (2000) 569–580]. Matrix Biol. 2001, 19, 815–827. [Google Scholar] [CrossRef]
- Tai, I.T.; Tang, M.J. SPARC in cancer biology: Its role in cancer progression and potential for therapy. Drug Resist. Updat. 2008, 11, 231–246. [Google Scholar] [CrossRef]
- Kelm, R.J., Jr.; Hair, G.A.; Mann, K.G.; Grant, B.W. Characterization of human osteoblast and megakaryocyte-derived osteonectin (SPARC). Blood 1992, 80, 3112–3119. [Google Scholar] [CrossRef]
- Chlenski, A.; Liu, S.; E Crawford, S.; Volpert, O.; Devries, G.H.; Evangelista, A.; Yang, Q.; Salwen, H.R.; Farrer, R.; Bray, J.; et al. SPARC is a key Schwannian-derived inhibitor controlling neuroblastoma tumor angiogenesi. Cancer Res. 2002, 62, 7357–7363. [Google Scholar]
- Raines, E.W.; Lane, T.F.; Iruela-Arispe, M.L.; Ross, R.; Sage, E.H. The extracellular glycoprotein SPARC interacts with platelet-derived growth factor (PDGF)-AB and -BB and inhibits the binding of PDGF to its receptors. Proc. Natl. Acad. Sci. USA 1992, 89, 1281–1285. [Google Scholar] [CrossRef] [PubMed]
- Reed, M.J.; Puolakkainen, P.; Lane, T.F.; Dickerson, D.; Bornstein, P.; Sage, E.H. Differential expression of SPARC and thrombospondin 1 in wound repair: Immunolocalization and in situ hybridization. J. Histochem. Cytochem. 1993, 41, 1467–1477. [Google Scholar] [CrossRef]
- Dhanesuan, N.; Sharp, J.A.; Blick, T.; Price, J.T.; Thompson, E.W. Doxycycline-Inducible Expression of SPARC/Osteonectin/ BM40 in MDA-MB-231 Human Breast Cancer Cells Results in Growth Inhibition. Breast Cancer Res. Treat. 2002, 75, 73–85. [Google Scholar] [CrossRef]
- Wong, S.Y.; Crowley, D.; Bronson, R.T.; Hynes, R.O. Analyses of the role of endogenous SPARC in mouse models of prostate and breast cancer. Clin. Exp. Metastasis 2007, 25, 109–118. [Google Scholar] [CrossRef]
- Ledda, M.F.; Adris, S.; Bravo, A.I.; Kairiyama, C.; Bover, L.; Chernajovsky, Y.; Mordoh, J.; Podhajcer, O.L. Suppression of SPARC expression by antisense RNA abrogates the tumorigenicity of human melanoma cells. Nat. Med. 1997, 3, 171–176. [Google Scholar] [CrossRef]
- Buravkova, L.; Romanov, Y. The role of cytoskeleton in cell changes under condition of simulated microgravity. Acta Astronaut. 2001, 48, 647–650. [Google Scholar] [CrossRef]
- Brinkley, B.R. Managing the centrosome numbers game: From chaos to stability in cancer cell division. Trends Cell Biol. 2001, 11, 18–21. [Google Scholar] [CrossRef]
- Izumi, H.; Kaneko, Y.; Nakagawara, A. The Role of MYCN in Symmetric vs. Asymmetric Cell Division of Human Neuroblastoma Cells. Front. Oncol. 2020, 10, 570815. [Google Scholar] [CrossRef]
- Jungas, T.; Joseph, M.; Fawal, M.-A.; Davy, A. Population Dynamics and Neuronal Polyploidy in the Developing Neocortex. Cereb. Cortex Commun. 2020, 1, tgaa063. [Google Scholar] [CrossRef]
- Frade, J.M. Unscheduled re-entry into the cell cycle induced by NGF precedes cell death in nascent retinal neurones. J. Cell Sci. 2000, 113, 1139–1148. [Google Scholar] [CrossRef]
- Aranda-Anzaldo, A.; Dent, M.A. Why Cortical Neurons Cannot Divide, and Why Do They Usually Die in the Attempt? J. Neurosci. Res. 2016, 95, 921–929. [Google Scholar] [CrossRef] [PubMed]
- Nandakumar, P.; Tian, C.; O’Connell, J.; Hinds, D.; Paterson, A.D.; Sondheimer, N. Nuclear genome-wide associations with Mitochondrial Heteroplasmy. Sci. Adv. 2021, 7, eabe7520. [Google Scholar] [CrossRef] [PubMed]
- Nagy, Z. Mechanisms of neuronal death in Down’s syndrome. In The Molecular Biology of Down Syndrome; Springer: Berlin/Heidelberg, Germany, 1999; Volume 57, pp. 233–245. [Google Scholar] [CrossRef]
- Nagy, Z. Cell cycle regulatory failure in neurones: Causes and consequences. Neurobiol. Aging 2000, 21, 761–769. [Google Scholar] [CrossRef]
- Zhu, X.; Siedlak, S.L.; Wang, Y.; Perry, G.; Castellani, R.J.; Cohen, M.L.; Smith, M.A. Neuronal binucleation in Alzheimer disease hippocampus. Neuropathol. Appl. Neurobiol. 2008, 34, 457–465. [Google Scholar] [CrossRef]
- Marfia, G.; Navone, S.E.; Guarnaccia, L.; Campanella, R.; Locatelli, M.; Miozzo, M.; Perelli, P.; Della Morte, G.; Catamo, L.; Tondo, P.; et al. Space flight and central nervous system: Friends or enemies? Challenges and opportunities for neuroscience and neuro-oncology. J. Neurosci. Res. 2022, 100, 1649–1663. [Google Scholar] [CrossRef]
- Wangler, S.; Kamali, A.; Wapp, C.; Wuertz-Kozak, K.; Häckel, S.; Fortes, C.; Benneker, L.M.; Haglund, L.; Richards, R.G.; Alini, M.; et al. Uncovering the secretome of mesenchymal stromal cells exposed to healthy, traumatic, and degenerative intervertebral discs: A proteomic analysis. Stem Cell Res. Ther. 2021, 12, 11. [Google Scholar] [CrossRef]


Publisher’s Note: MDPI stays neutral with regard to jurisdictional claims in published maps and institutional affiliations. |
© 2022 by the authors. Licensee MDPI, Basel, Switzerland. This article is an open access article distributed under the terms and conditions of the Creative Commons Attribution (CC BY) license (https://creativecommons.org/licenses/by/4.0/).
Share and Cite
Shaka, S.; Carpo, N.; Tran, V.; Cepeda, C.; Espinosa-Jeffrey, A. Space Microgravity Alters Neural Stem Cell Division: Implications for Brain Cancer Research on Earth and in Space. Int. J. Mol. Sci. 2022, 23, 14320. https://doi.org/10.3390/ijms232214320
Shaka S, Carpo N, Tran V, Cepeda C, Espinosa-Jeffrey A. Space Microgravity Alters Neural Stem Cell Division: Implications for Brain Cancer Research on Earth and in Space. International Journal of Molecular Sciences. 2022; 23(22):14320. https://doi.org/10.3390/ijms232214320
Chicago/Turabian StyleShaka, Sophia, Nicolas Carpo, Victoria Tran, Carlos Cepeda, and Araceli Espinosa-Jeffrey. 2022. "Space Microgravity Alters Neural Stem Cell Division: Implications for Brain Cancer Research on Earth and in Space" International Journal of Molecular Sciences 23, no. 22: 14320. https://doi.org/10.3390/ijms232214320
APA StyleShaka, S., Carpo, N., Tran, V., Cepeda, C., & Espinosa-Jeffrey, A. (2022). Space Microgravity Alters Neural Stem Cell Division: Implications for Brain Cancer Research on Earth and in Space. International Journal of Molecular Sciences, 23(22), 14320. https://doi.org/10.3390/ijms232214320