Article

The Correlation of Ten Immune Checkpoint Gene Expressions and Their Association with Gastric Cancer Development

1
Research Centre for Medical Genetics, 1 Moskvorechye St., 115522 Moscow, Russia
2
Blokhin National Medical Research Center of Oncology of the Ministry of Health of Russia, 24 Kashirskoe Shosse, 115478 Moscow, Russia
*
Author to whom correspondence should be addressed.
Int. J. Mol. Sci. 2022, 23(22), 13846; https://doi.org/10.3390/ijms232213846
Submission received: 6 October 2022 / Revised: 7 November 2022 / Accepted: 8 November 2022 / Published: 10 November 2022

Abstract

:
In the immunotherapy based on immune checkpoint inhibition (IC), additional ICs are being studied to increase its effectiveness. An almost unstudied feature is the possible co-expression of ICs, which can determine the therapeutic efficacy of their inhibition. For the selection of promising ICs, information on the association of their expression with cancer development may be essential. We have obtained data on the expression correlation of ADAM17, PVR, TDO2, CD274, CD276, CEACAM1, IDO1, LGALS3, LGALS9, and HHLA2 genes in gastric cancer (GC). All but one, TDO2, have other IC genes with co-expression at some stage. At the metastatic stage, the expression of the IDO1 does not correlate with any other gene. The correlations are positive, but the expressions of the CD276 and CEACAM1 genes are negatively correlated. The expression of TDO2 and LGALS3 is associated with GC metastasis. The expression of TDO2 four-fold higher in metastatic tumors than in non-metastatic tumors, but LGALS3 was two-fold lower. The differentiation is associated with IDO1. The revealed features of TDO2, with a significant increase in expression at the metastatic stage and the absence of other IC genes with correlated expression indicates that the prospect of inhibiting TDO2 in metastatic GC. IDO1 may be considered for inhibition in low-differentiated tumors.

1. Introduction

Inhibition of immune checkpoints (ICs) is considered as one of the most promising methods of cancer immunotherapy. Such inhibition leads to antitumor activation of the immune system due to the elimination of the IC blocking effect. At present, inhibition of PD-L1, PD-1 and CTLA-4 is mainly used in medical practice. Despite the high efficiency of the treatment achieved in some cases, the proportion of patients responding to such immunotherapy is not yet large. In this regard, other ICs are being explored, and understanding the criteria for identifying the most promising of them can contribute to a faster advancement of research in this direction. Our analysis of published data, both in terms of the effect of IC inhibition and the relationship of their expression with the clinical characteristics of tumors, led to a conclusion that there is a relationship between the properties of ICs as participants in cancer development and the properties that determine the activity of the immune system during their inhibition [1,2].
The presence of ICs, which may be expressed simultaneously with inhibited ICs, can lead to a decrease in the effectiveness of the immunotherapy due to their blocking of the immune system. This circumstance may be one of the reasons for the reduced proportion of patients responding to IC inhibition. This issue is practically unexplored.
Based on the circumstances described, we performed an appropriate examination of gastric cancer (GC) samples. GC is one of the most common cancers, ranking 5th for incidence and 4th for mortality globally [3]. It is difficult to cure and is characterized by a low survival rate, so the development of an effective therapy for this cancer is especially urgent [4].
The expression of 10 IC genes—ADAM17, PVR, TDO2, CD274, CD276, CEACAM1, IDO1, LGALS3, LGALS9, and HHLA2—was studied. The selection of these genes was based on the available data on the results of inhibition of the ICs encoded by them and their association with some clinical characteristics, mainly survival, of cancer patients. At the same time, the association of these genes with metastasis and other features of the GC development has not been sufficiently studied [1]. There is practically no data on their co-expression. The expression of these genes was investigated in the early stages of GC development and during metastasis. At these two stages of GC development, the expression correlations of the above genes were studied.

2. Results

2.1. The Association of IC Gene Expression with the Development of Metastases

The expression level of 10 IC genes was determined in 101 paired stomach tissue samples (tumor/normal). Among the genes studied, expression levels in non-metastatic tumors were slightly higher than in normal tissues for PVR, CD276 and LGALS3 genes. In metastatic tumors, TDO2 expression was higher (p = 0.024) and LGALS3 expression was lower (p = 0.031) relative to tumors without metastases. The expression of the remaining genes did not exhibit statistically significant changes (Table 1, Figure 1).
To characterize the relationship of the expression levels of these genes with metastasis, ROC analysis was used (Table 2). The analysis revealed that the expression of the TDO2 and LGALS3 genes had a statistically significant relationship with GC metastasis. The significance of the differences was retained when applying the Benjamini–Hochberg procedure for multiple comparisons (FDR). That is, an increase in the expression level of the TDO2 gene was an unfavorable prognosis for the development of metastases. For the LGALS3 gene, an unfavorable prognosis was associated with a decrease in its expression level.
Differences in the median of expression level and ROC analysis showed a relationship between TDO2 and LGALS3 genes expression and GC metastasis. In order to evaluate this relationship, we obtained odds ratio (OR) and relative risk (RR) values and determined the relationship between gene expression levels and metastases using Fisher’s exact test. ROC analysis revealed the cut-off values for expression levels in non-metastatic and metastatic GC that exhibited the best sensitivity and specificity (Table 2). For each gene, the frequency of expression was determined to be higher/lower the cut-off value in GC with and without metastases (Table 3). According to the results of the Fisher’s exact test and 95% CI for OR and RR, there was a significant association of the TDO2, LGALS3 and LGALS9 expression level with the metastasis. The OR for these genes ranged from 4.2 to 6.6, and the RR ranged from 3.0 to 3.5, with a minimum value of 95% CI greater than 1. The highest OR and RR values were found for the TDO2 gene.

2.2. The Correlations of Gene Expressions

In addition to the level of IC expression, an important feature that can determine the therapeutic efficacy of IC inhibition may be the expression of another IC that correlates with it. These features have still been poorly studied. To elucidate them, we revealed the expression correlation coefficients for all genes studied in this work and HER2, significant for GC therapy, at different stages of GC (Figure 2, Figure 3, Figure 4 and Figure 5).
Spearman’s correlation analysis (p < 0.01) showed that correlation of expression levels at stage IV looks similar to stage I + II (Figure 2, Figure 3, Figure 4 and Figure 5). The expression of the CD276 gene showed the highest number of correlations: in the early stages with the ADAM17, PVR, CEACAM1, and LGALS9 genes, R = −0.458–0.586; at stage IV with the ADAM17, PVR, CEACAM1, and LGALS3 genes, R = 0.486–−0.710). CD274 gene expression at stage I + II correlated only with IDO1 expression (R = 0.653, the highest correlation coefficient at stage I + II), but at stage IV only with LGALS9 expression (R = 0.518). Almost all of the genes studied, except TDO2, have at some stage other IC genes with co-expression. At stage IV, the expression of the IDO1 gene does not correlate with any other gene. As a rule, the correlation is positive, although there are exceptions. The expression of the CD276 and CEACAM1 genes negatively correlates both at early and late stages. At stage IV CEACAM1 is expressed ‘in antiphase’ with the ADAM17 gene. The expression of the CEACAM1 gene has only negative correlation coefficients with the expression of other genes. HER2 expression correlated with HHLA2 and LGALS3 genes at stage IV (R = −0.459 and −0.457, respectively), but none in the stage I + II.

2.3. The Relationship of IC Gene Expression with the Degree of Tumor Differentiation

Distant metastasis in GC is associated with poor prognosis. Other clinical and pathological characteristics, including tumor differentiation degree, also affect the prognosis [5]. In this regard, the relationship between IC gene expression and tumor differentiation degree was studied.
Figure 6 shows the values of the gene expression levels and the significantly different medians for IDO1 and LGALS9 genes in GC with well/moderate and poor degree of tumor differentiation.
ROC analysis revealed that the expression of the IDO1 (p = 0.025) and LGALS9 (p = 0.024) genes had a statistically significant relationship with the degree of tumor differentiation (Table 4).
Thus, in poorly differentiated tumors increased expression of the IDO1 and LGALS9 genes (relatively to well/moderately differentiated tumors) was observed. As it is known, the degree of tumor differentiation correlates with the type by Lauren classification: in diffuse type, a low differentiation degree is observed the most frequently. The Lauren type is also considered as one of the most important characteristics for GC prognosis [6,7]. Thereby, the relationship between the expression of the IDO1 and LGALS9 genes and the Lauren type was studied.

2.4. The Relationship of IC Gene Expression with the Lauren Type

To characterize the relationship between the expression levels of these genes and the Lauren type, ROC analysis was used. The analysis revealed that the expression of the LGALS9 gene had a statistically significant relationship with the Lauren type (Table 5) with increased expression level in the diffuse/mixed type, while the expression of the IDO1 gene was not associated with the Lauren type. In this regard, all analyzed IC genes were studied. ROC analysis revealed a significant p-value for the CD274 gene (AUC = 0.645; sensitivity = 54.29; specificity = 85.29; p-value = 0.039), remaining genes did not show significant relationship with Lauren type (AUC ranged from 0.522 to 0.627; p-value ranged from 0.059 to 0.755).
We found a relationship between LGALS9 gene expression both with the degree of tumor differentiation and Lauren type. Since these pathological characteristics are interconnected, in order to reveal which characteristic is basic, multiple logistic regression analysis was carried out (Table 6).
According to the results of the multiple regression analysis, the Lauren type is an independent feature. Thus, the expression of the LGALS9 gene is associated with the Lauren type, while the degree of tumor differentiation is a secondary (tumor-type dependent) characteristic.

3. Discussion

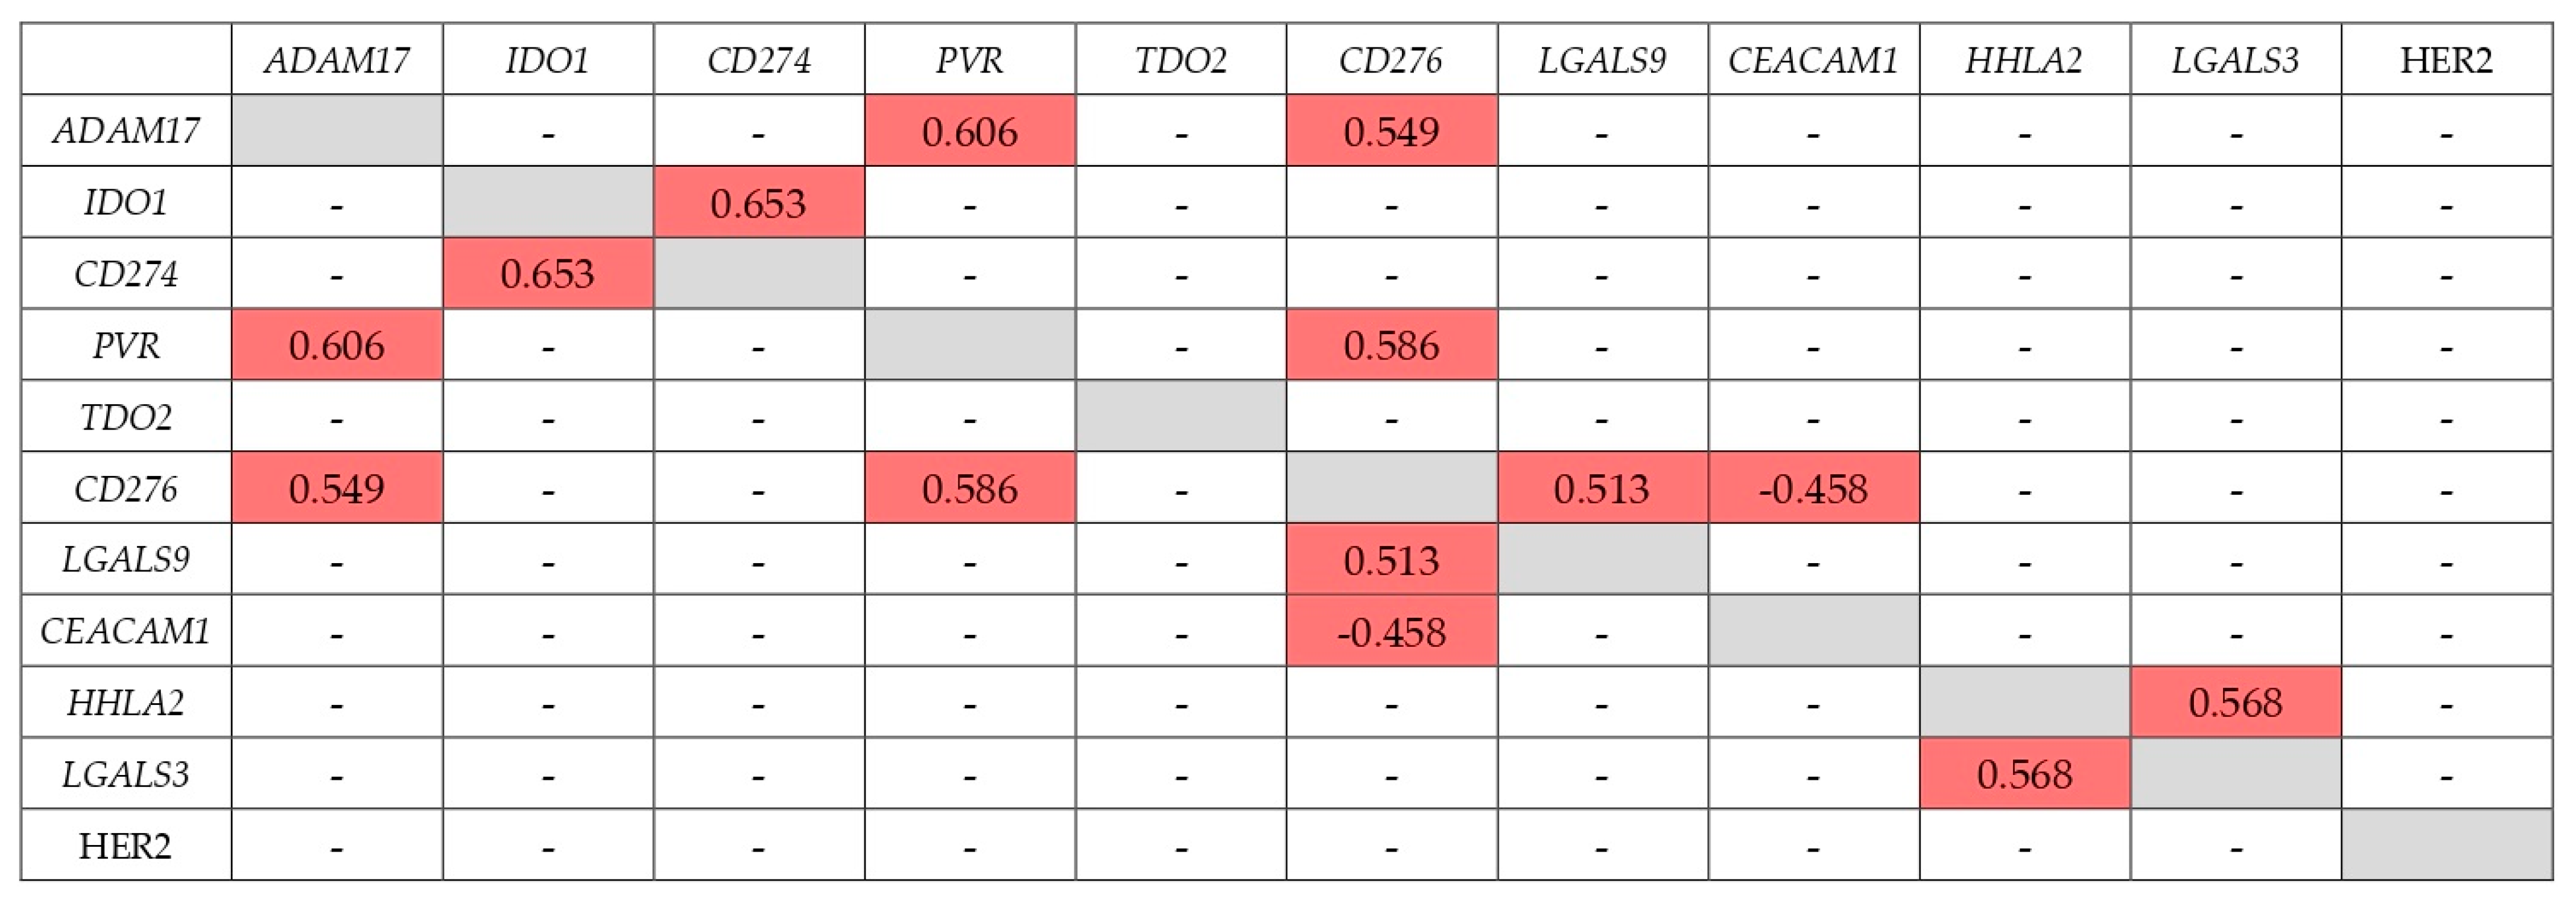
A very significant factor influencing the therapeutic effect of IC inhibition may be the co-expression of another IC with respect to the inhibited one. Such co-expression may also be able to block the antitumor effect of the immune system, which would lead to the lack of a therapeutic effect of immunotherapy based on the inhibition of IC. In this work, for the first time, we studied the co-expression of a set of IC genes—ADAM17, PVR, TDO2, CD274, CD276, CEACAM1, IDO1, LGALS3, LGALS9, and HHLA2—in GC tumors at the early stages of its development and during metastasis.
As was found, 9 out of 10 genes studied have at some stage other IC genes with expression coordinated with them. The exception is the TDO2 gene, whose expression does not correlate with the expression of other genes studied at all stages of GC. However, Cui et al. found a correlation between TDO2 expression level and a number of IC genes and, including the CD274, CD276, and IDO1 genes in a sample of GC from the TCGA database, that may be due to the difference in samples [8]. In metastatic GC, the expression of the 
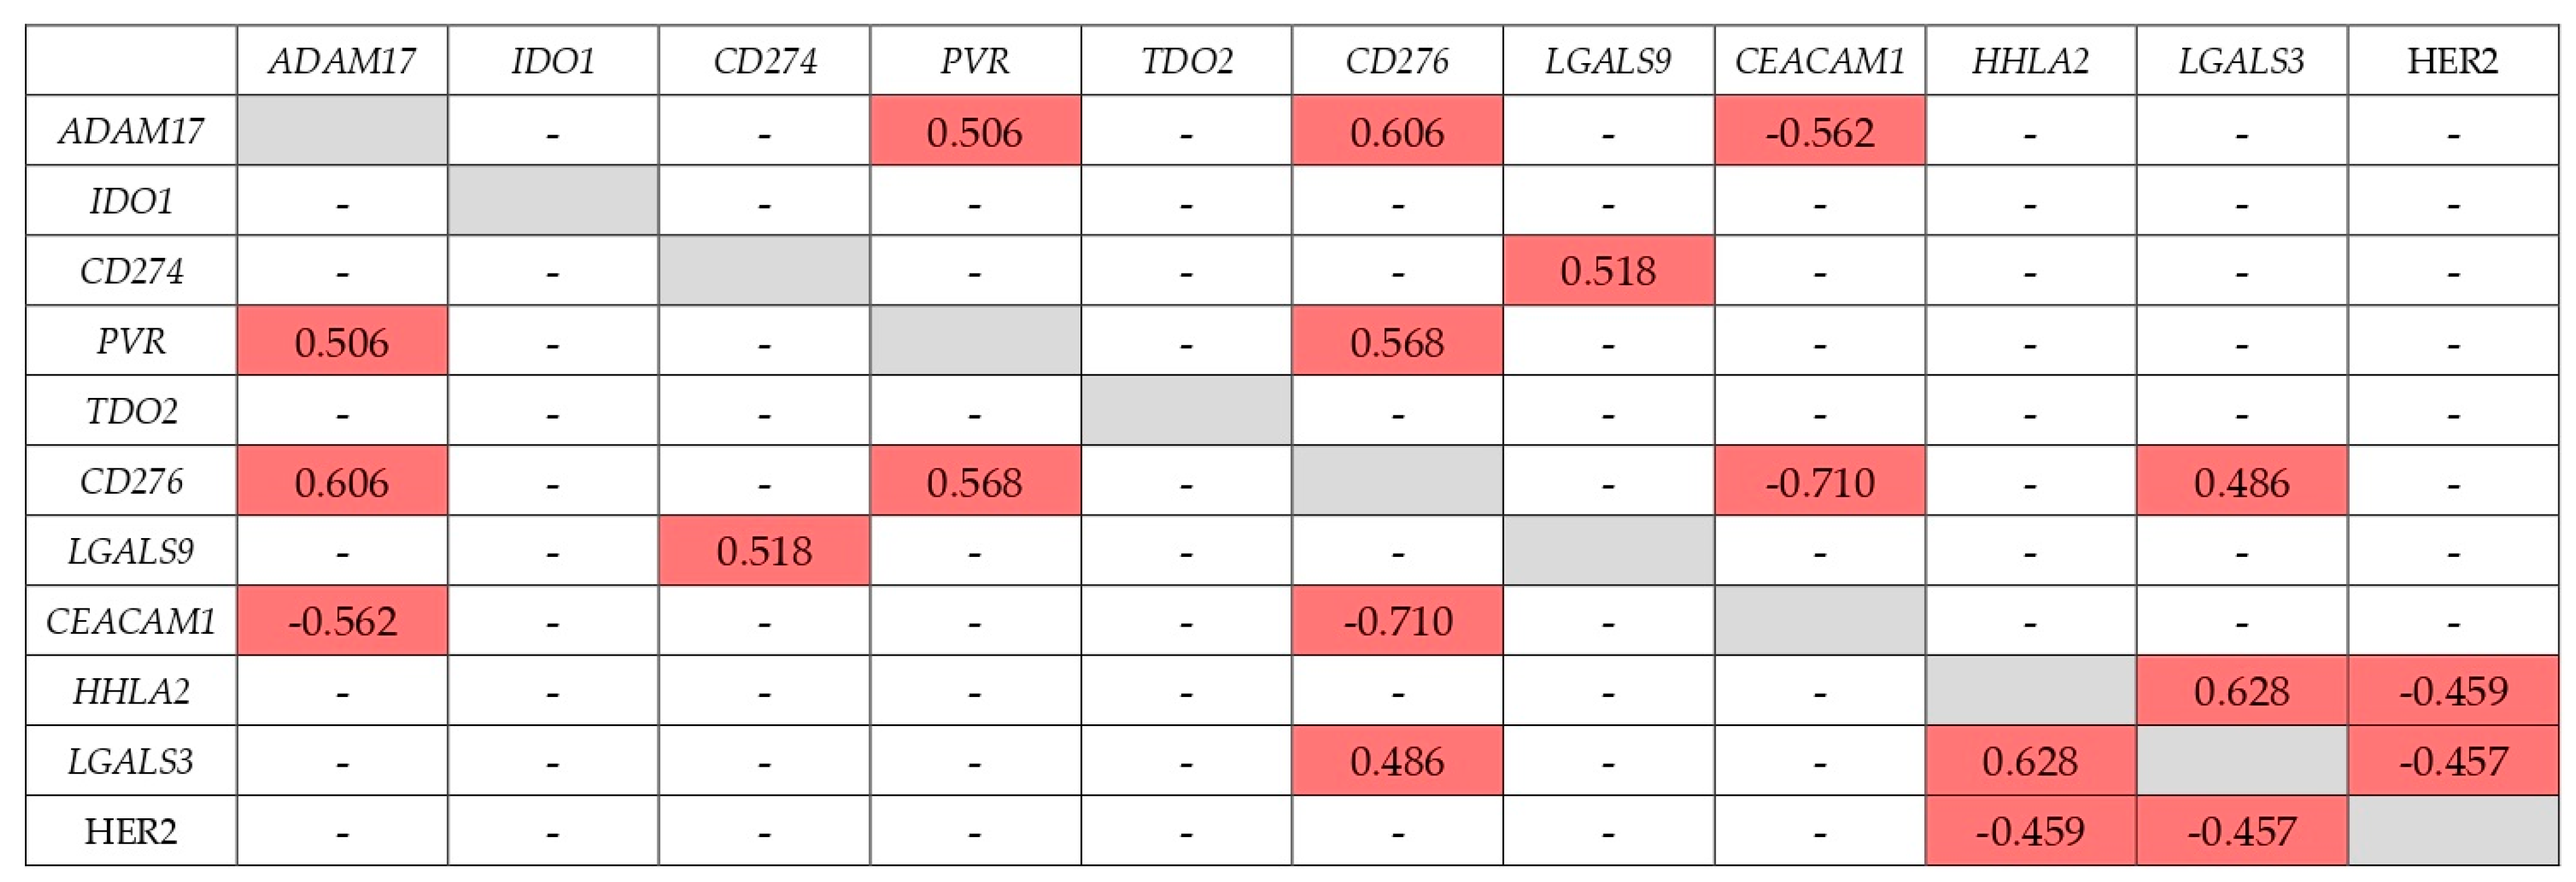
IDO1 gene does not correlate with any other gene. Except these genes, for the remaining eight there is a significant probability of co-expression of other IC genes. This is especially important to keep in mind for the 
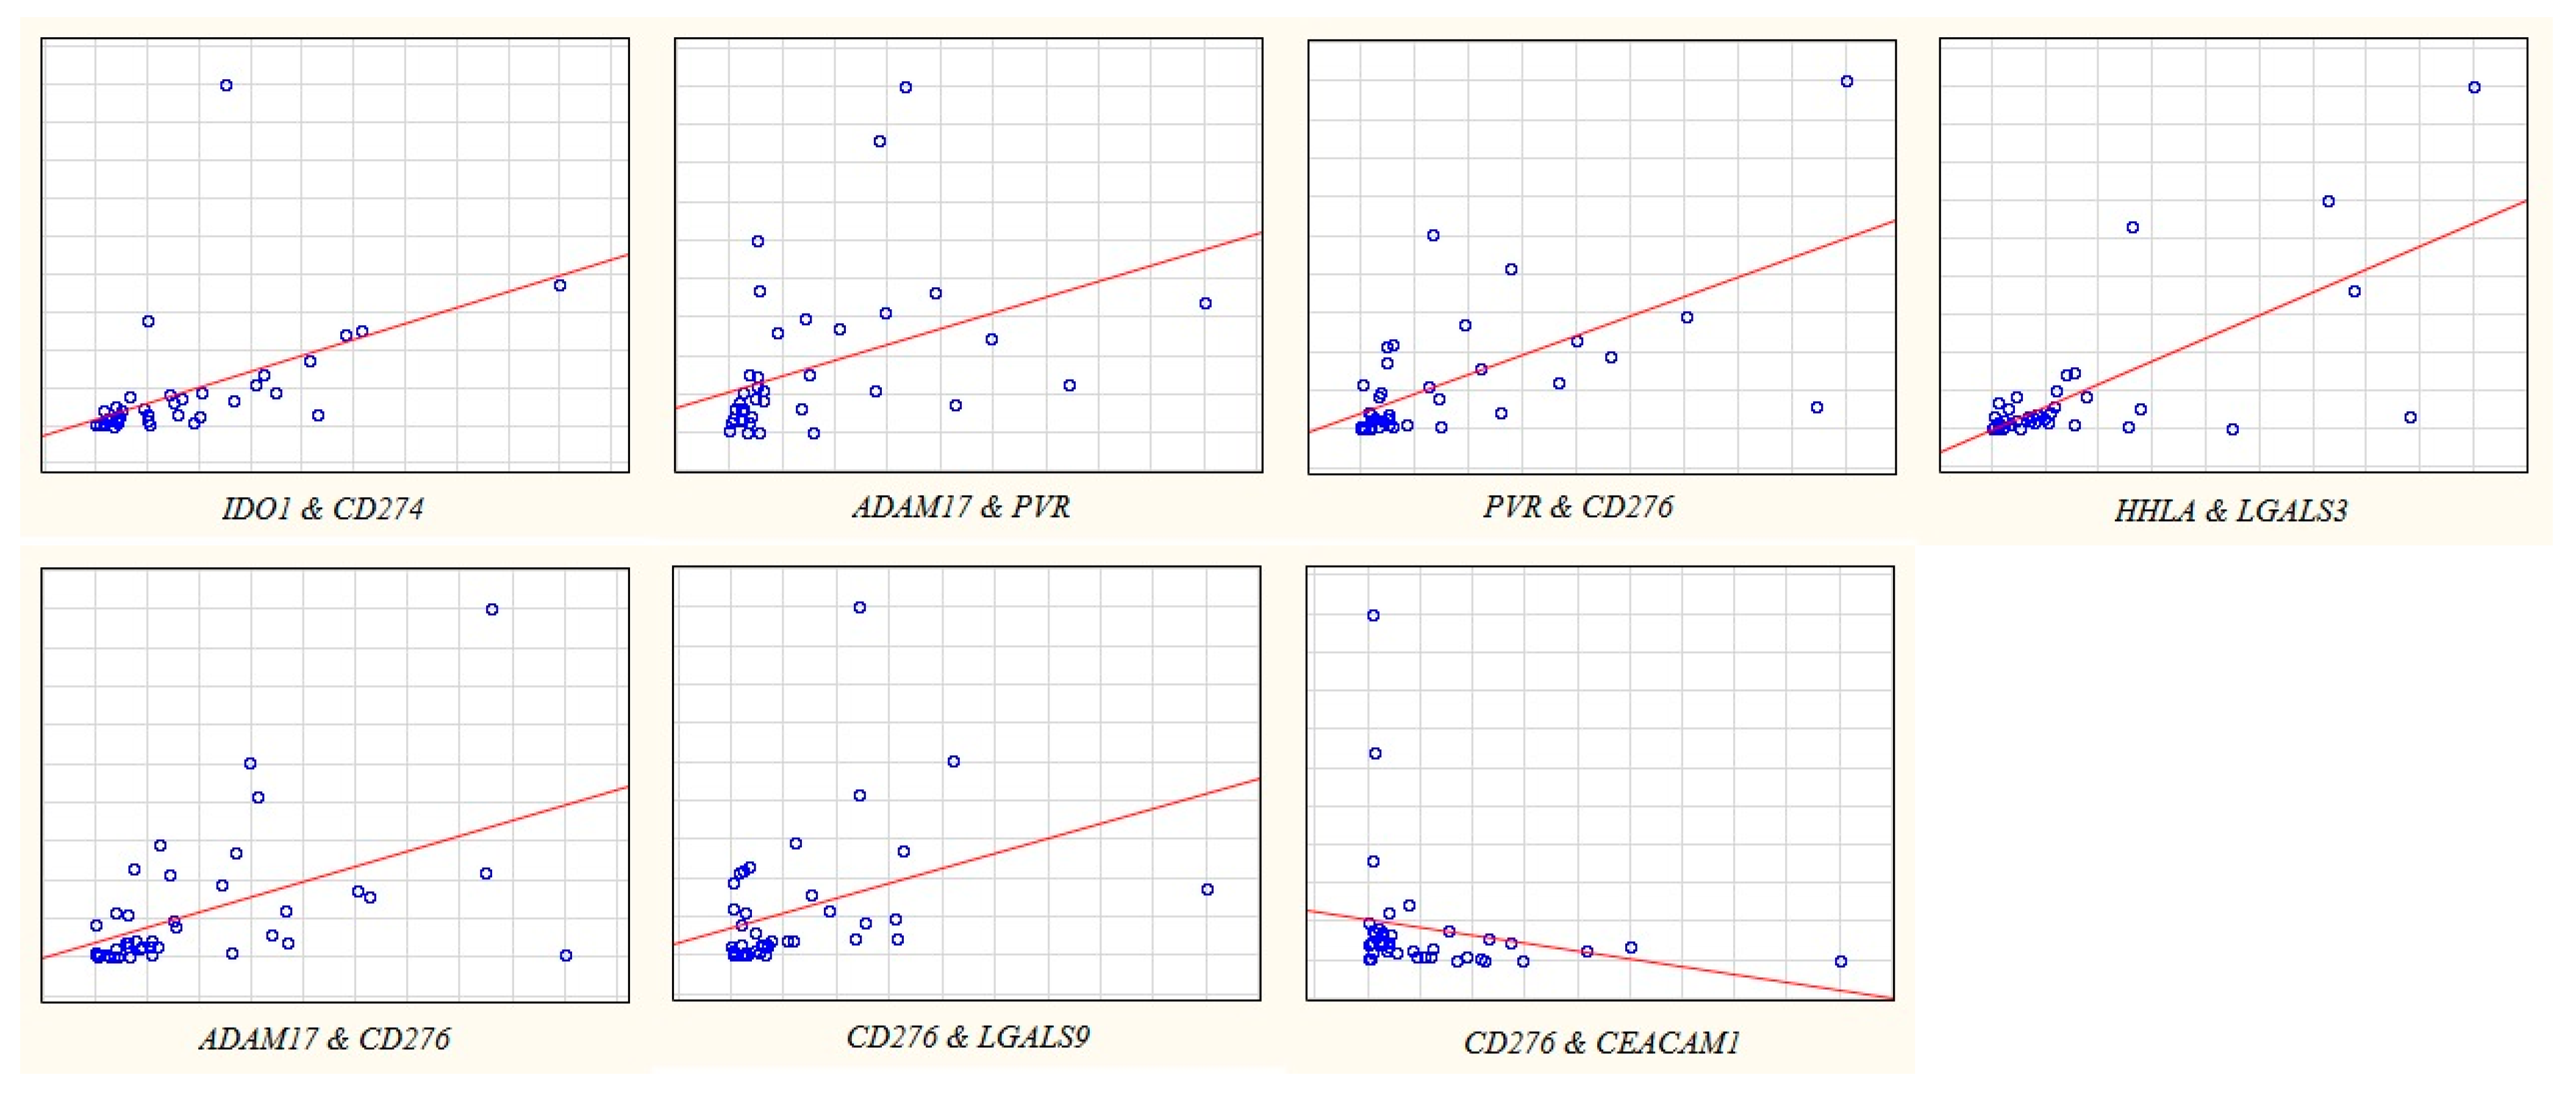
CD274 gene, encoding PD-L1, which is co-expressed with IDO1 at early stage of GC and with LGALS9 at late stage. Although the inhibition of these ICs has not yet been used in practice, they are being actively studied and have the prospect of entering the arsenal of immunotherapy tools [9,10].
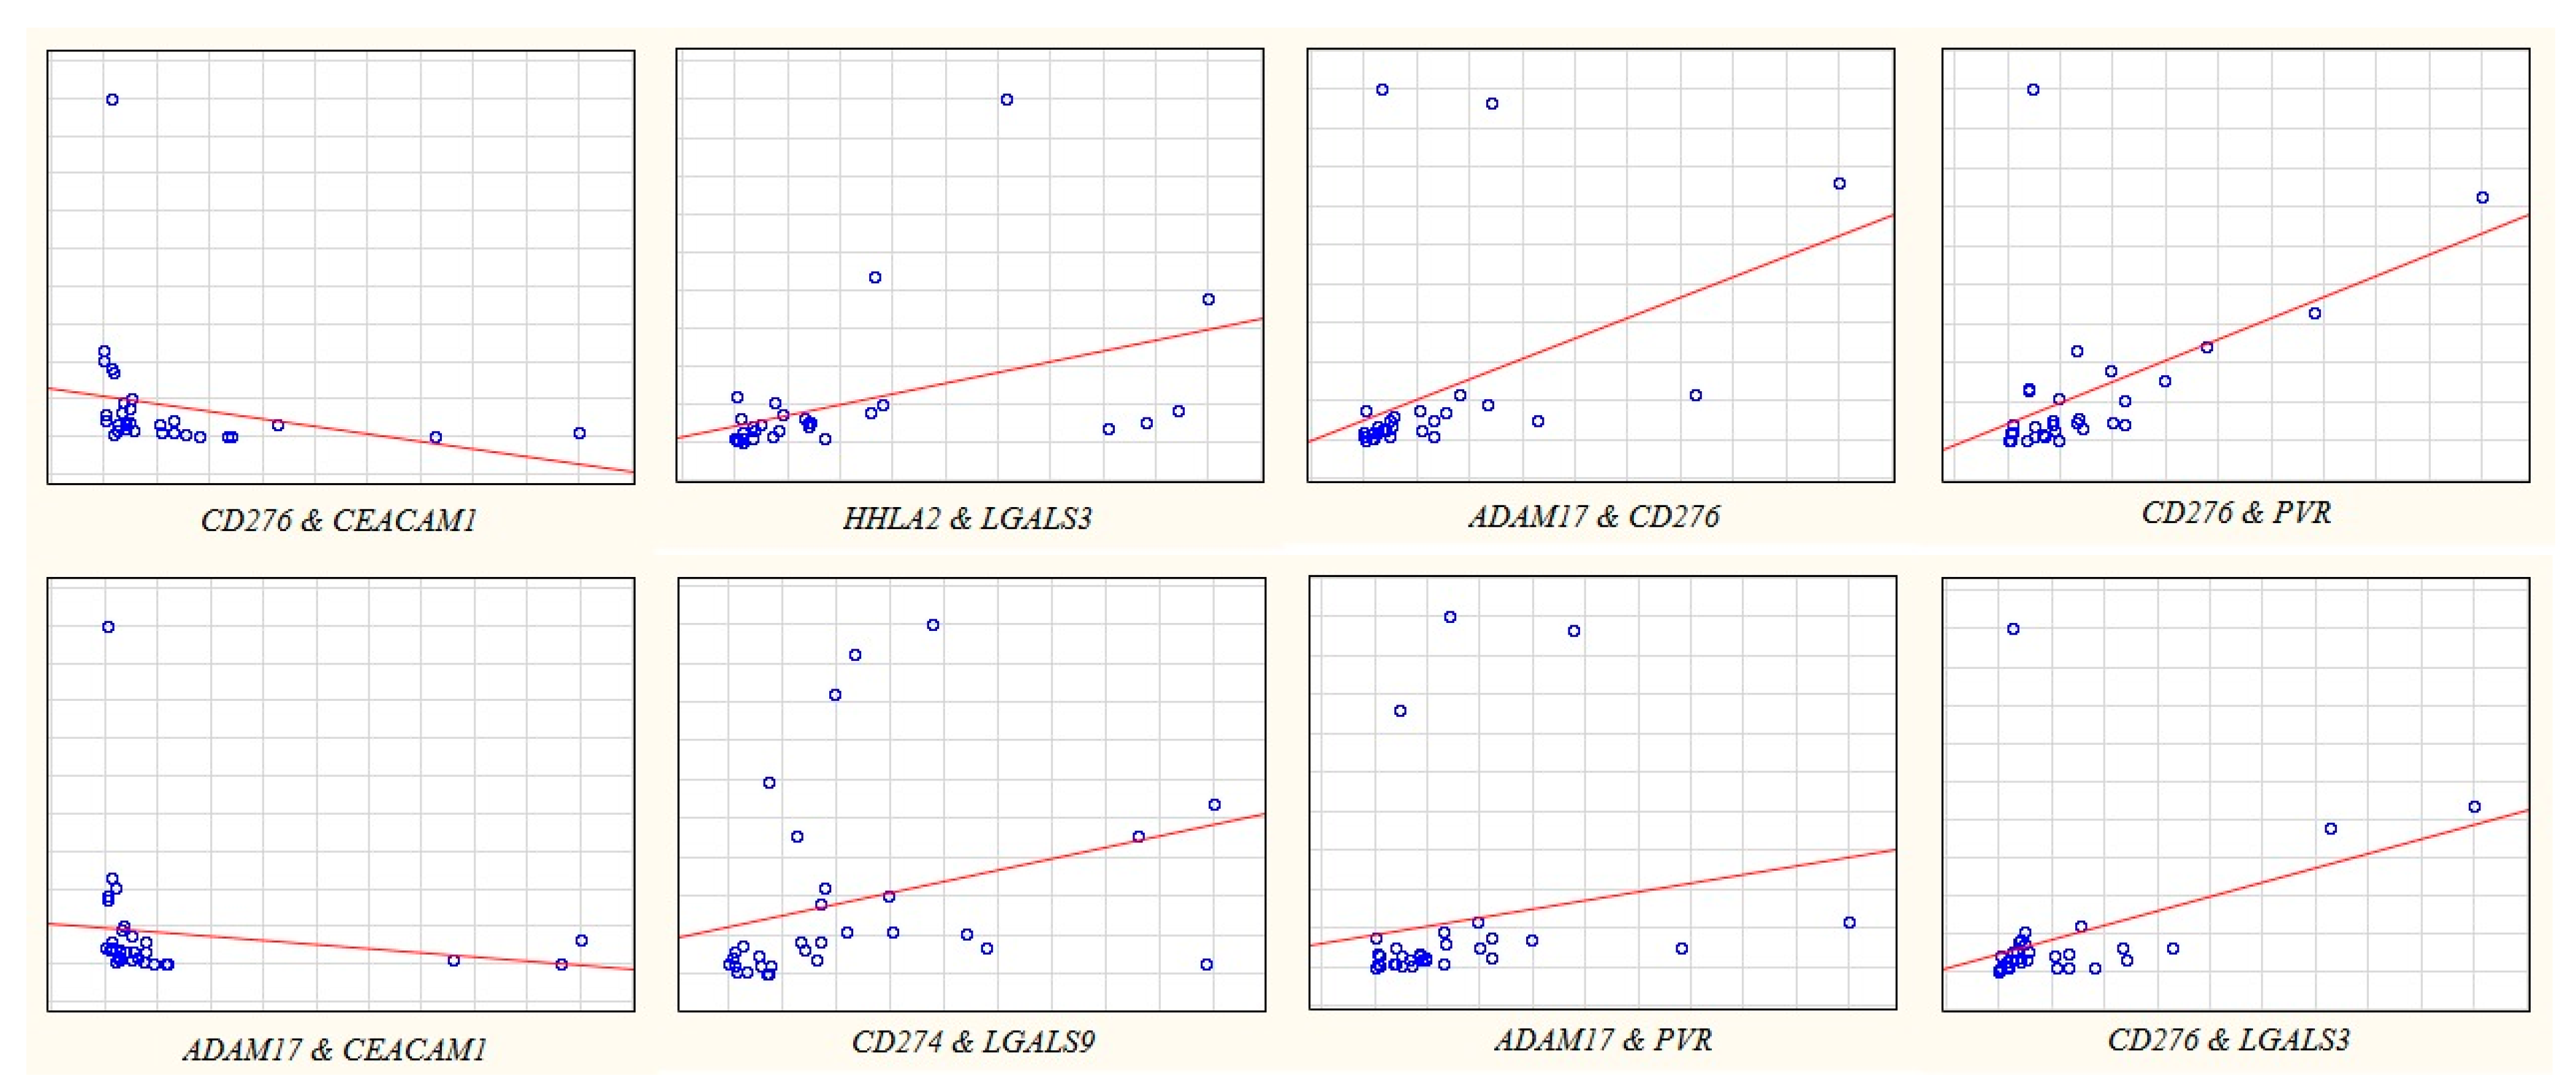
Basically, the correlation of the expression of the genes studied is positive. An exception is the negative correlation between CD276 and CEACAM1 gene expression both at the early and metastatic stages. So far, the therapeutic efficacy of CEACAM1 inhibition has not been determined, but the sum of available results does not exclude such a prospect [1]. In this case, inhibition of CEACAM1 may be particularly beneficial in the absence of expression of B7-H3, encoded by the CD276 gene. It should be noted that this gene has the highest number of expression correlations with other ICs among the ones studied. This feature may reduce the therapeutic efficacy of B7-H3 inhibition.
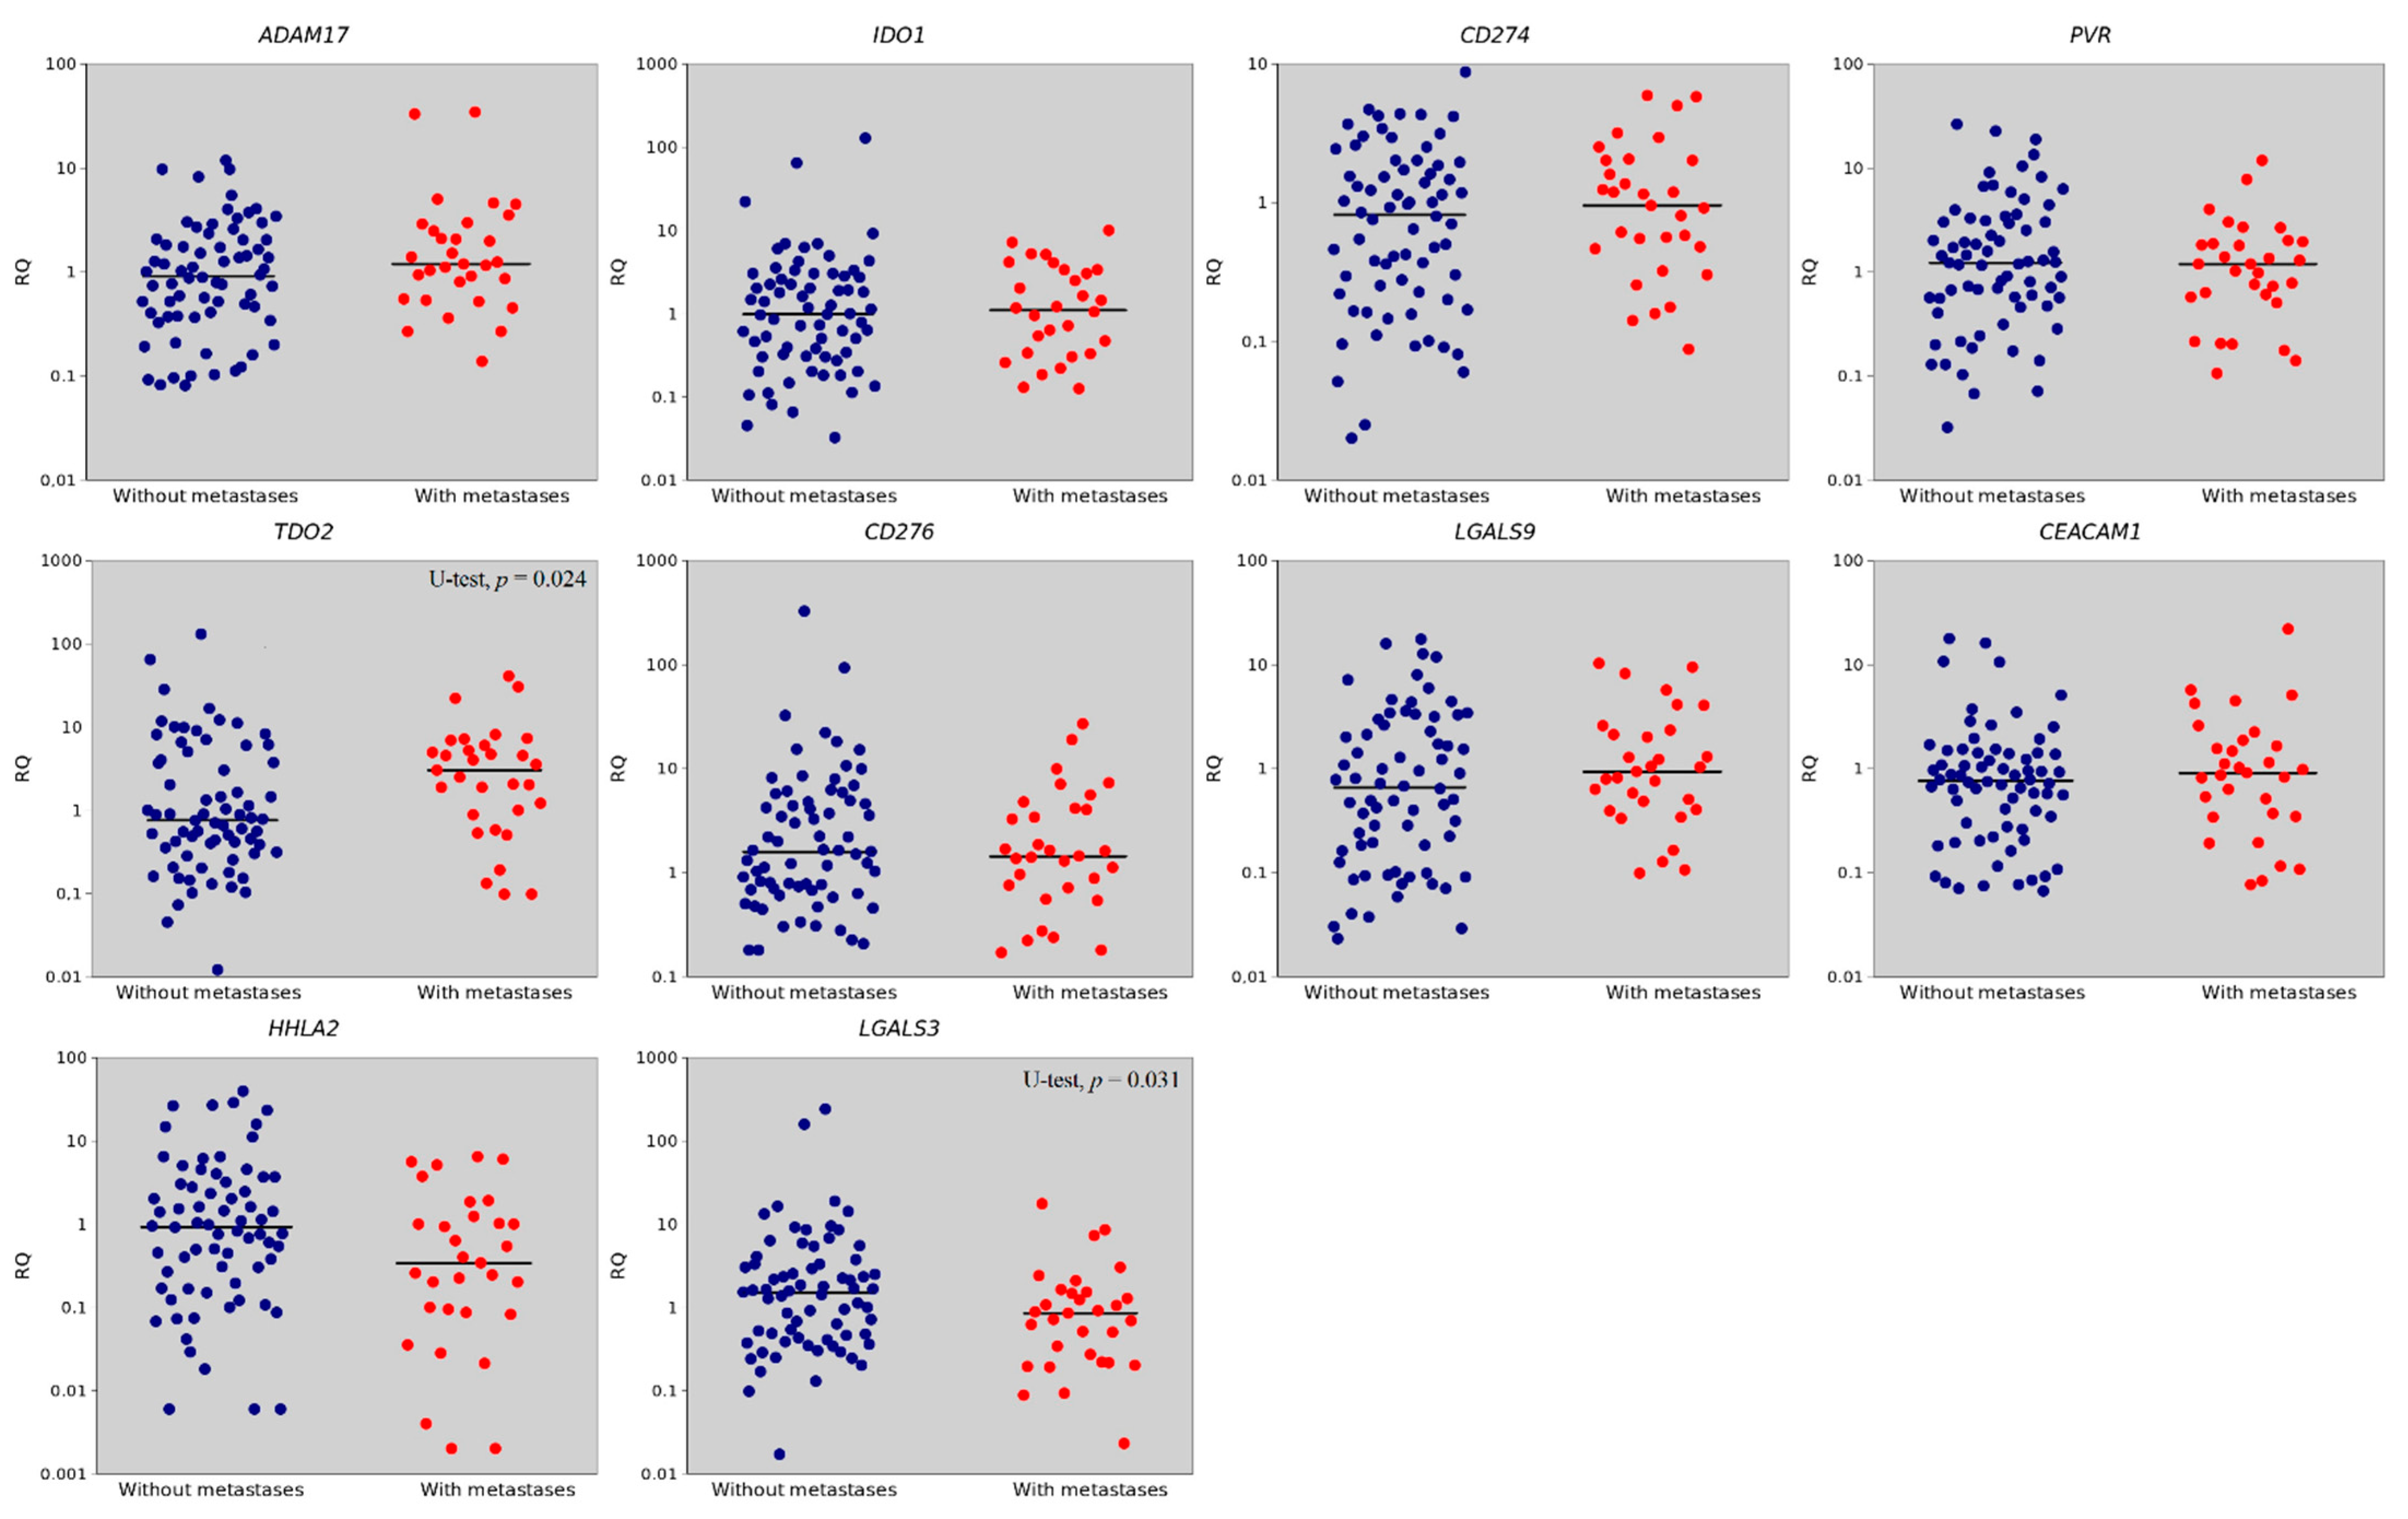
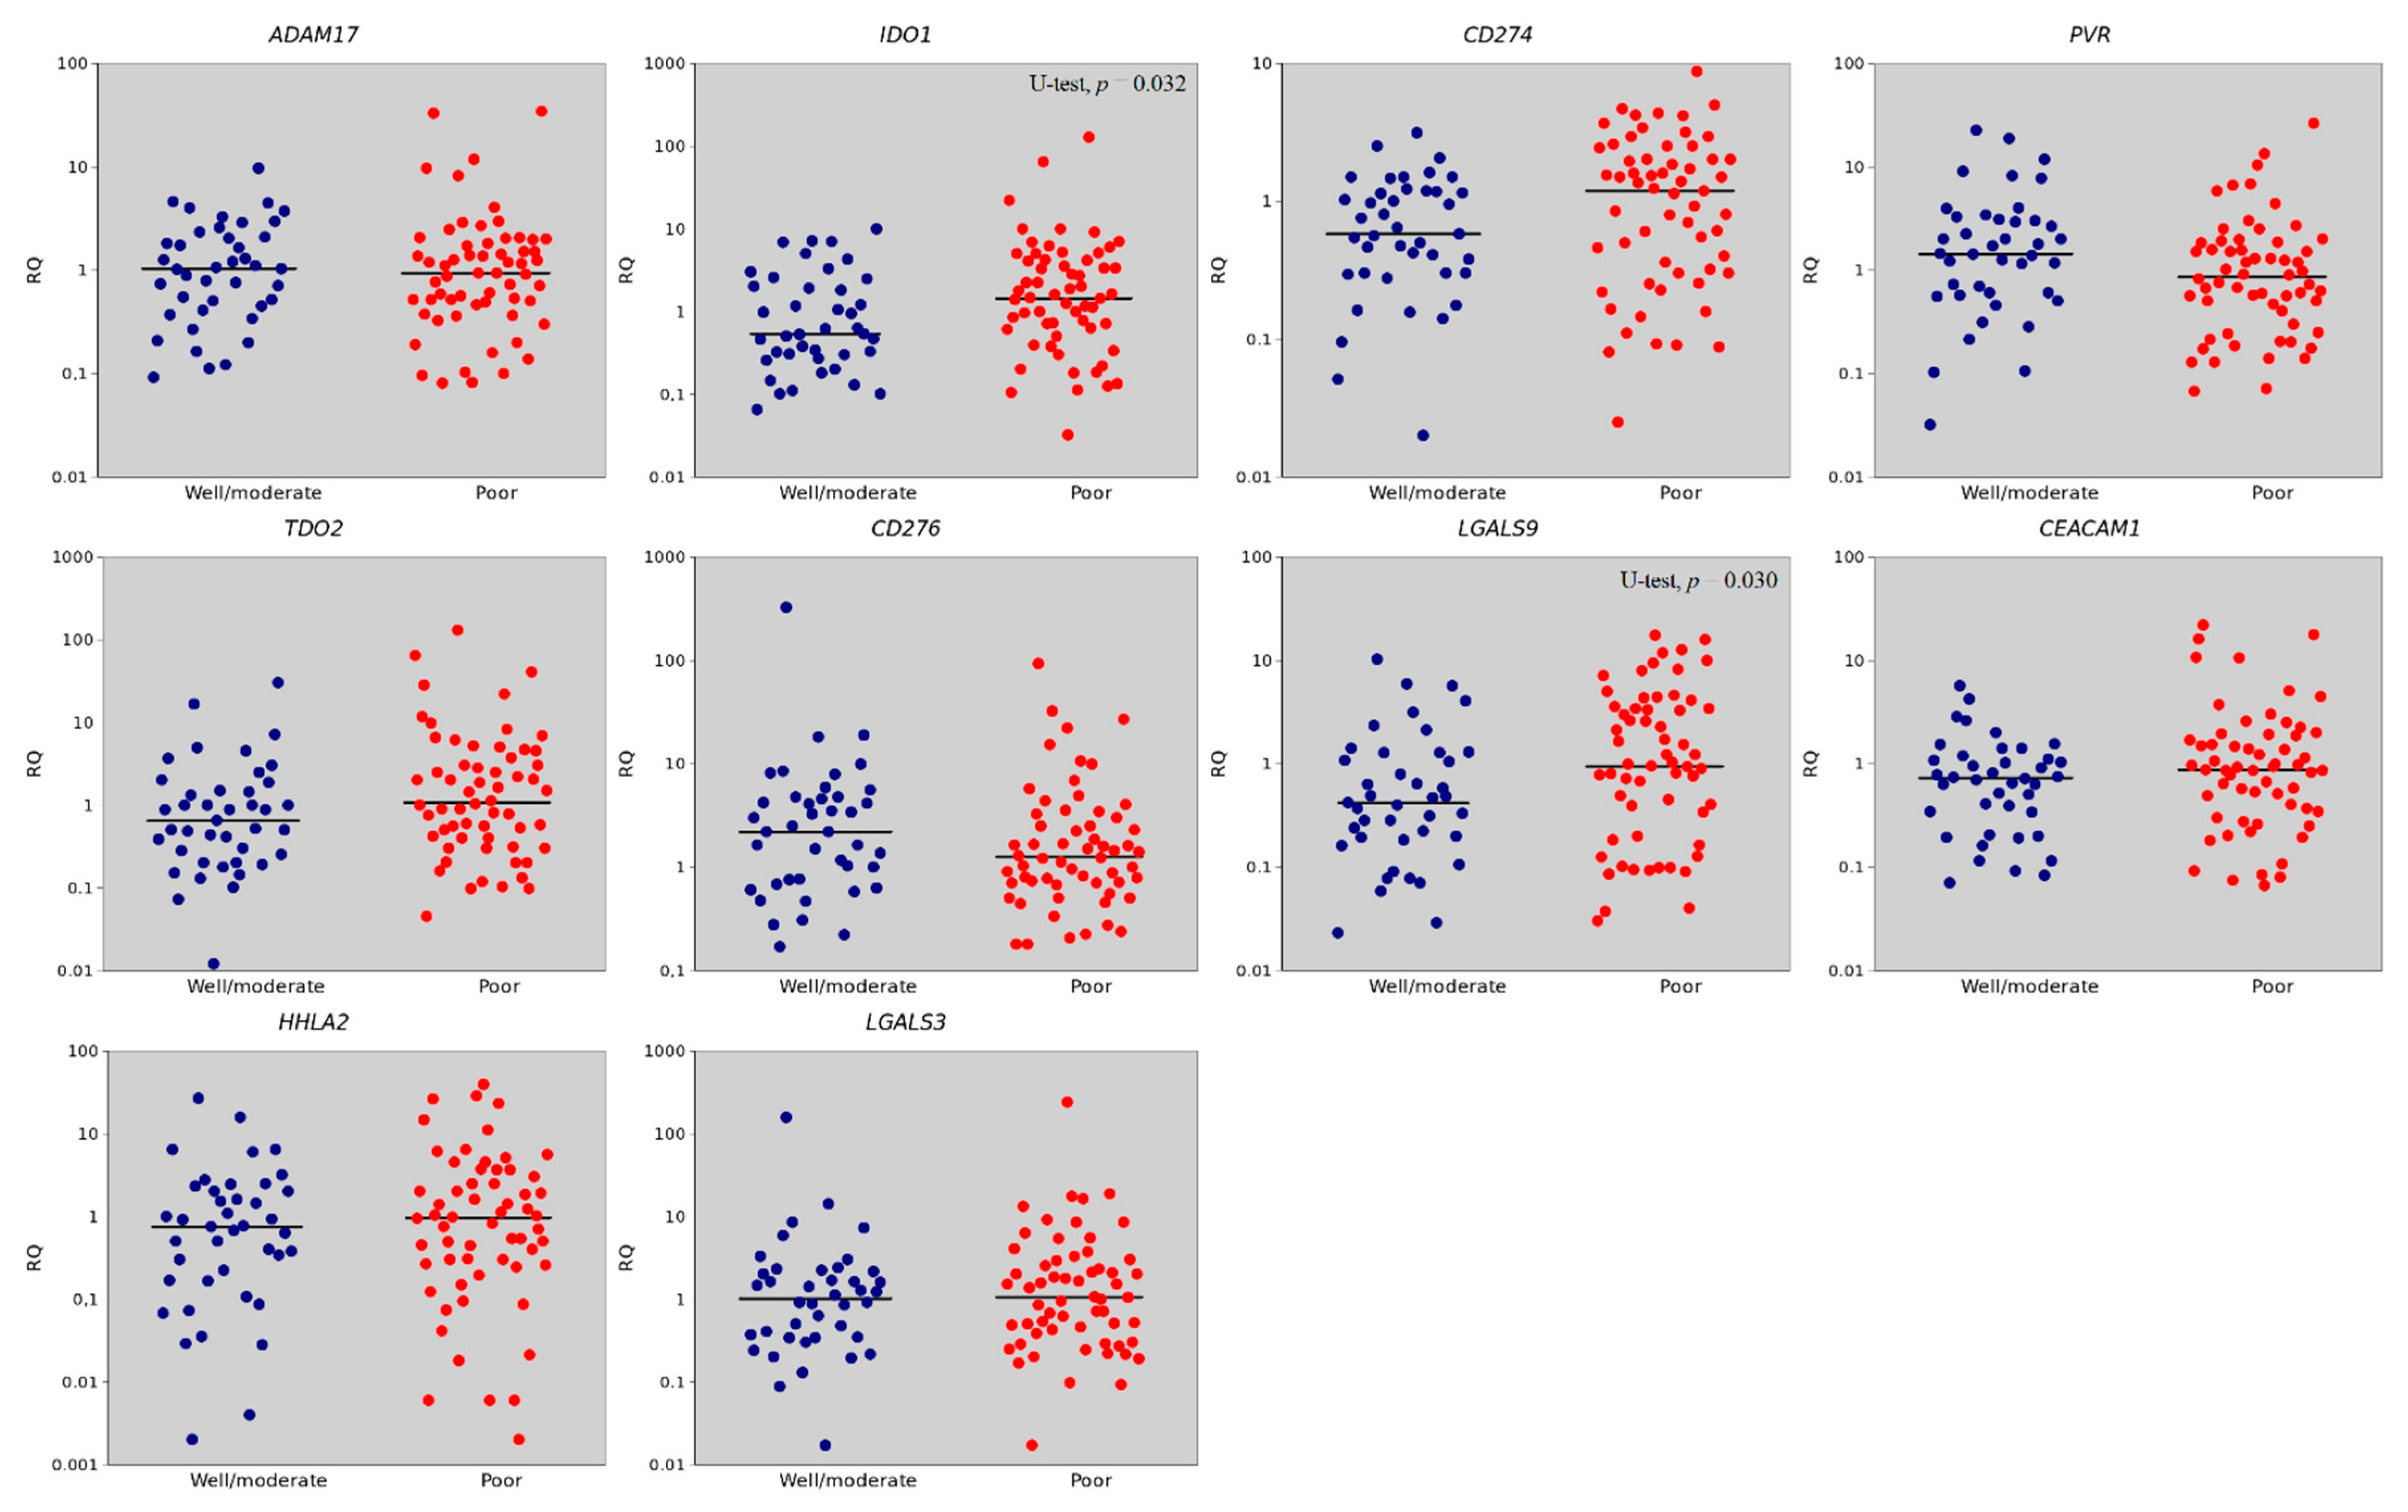
An essential characteristic of IC is the association of expression with tumor metastasis, which may be due to the blocking of the action of the immune system on cells detached from the tumor. On the other hand, differences in expression at different stages of tumor development may serve as an indication of the stage at which inhibition of this IC may be the most effective therapeutically. In our study, the expression levels of two genes were associated with GC metastasis—TDO2 and LGALS3. TDO2 has one of the key roles in the catabolism of the Tryptophan to Kynurenine, along with IDO1 and IDO2. It is known that IDO1 catabolizes most of the tryptophan in various organs, while TDO2 is mainly expressed in the liver [11]. Increased TDO2 expression accelerates this process, leading to a decrease in the concentration of Tryptophan and an increase in the concentration of Kynurenine. This reduces the proliferation and activity of CD8+ T-cells and the strengthening of their apoptosis, contributing to the evasion of the tumor from the immune response [12]. This mechanism corresponds to our experimental results, in which increased TDO2 mRNA expression was first associated with distant metastasis in GC. In metastatic tumors TDO2 was expressed four times higher than in non-metastatic. In Pham et al. study, TDO2 expression was correlated with progression and outcome in GC [13]. Meta-analysis on prognosis and clinical features of TDO2 expression in various malignancies revealed that TDO2 overexpression has been associated with poor survival, TNM stage, and regional lymph node metastasis [14]. Moreover, bioinformatic analysis showed a correlation of high TDO2 expression with a poor prognosis in many cancer types [8]. The revealed features of TDO2—a significant increase in expression at the metastatic stage, the absence of other IC genes with correlated expression—indicate the prospect of inhibiting this gene in a metastatic GC.
Galectin-3 (Gal-3) is a member of the galectin family that is widespread in mammalian tissues and is determined by its carbohydrate recognition domains with a specific binding affinity for β-galactosides [15]. Gal-3, encoded by the LGALS3 gene, is involved in the regulation of tumor cell growth, transformation, apoptosis, immunosuppression, angiogenesis, adhesion, invasion, and metastasis [16]. A decrease in Gal-3 expression reduces adhesion between tumor cells and facilitates the invasion of cancer cells [17]. Earlier, in the meta-analysis of Gal-3 expression in GC, measured by immunohistochemistry (IHC) method, the association of reduced Gal-3 expression with poor prognosis and high TNM stage was shown [18]. In our work, for the first time we have shown the association of reduced LGALS3 gene expression in the tumor with a distant metastasis in GC. In metastatic tumors, LGALS3 was expressed two-fold lower than in non-metastatic one. This suggests a greater therapeutic efficacy of inhibition of LGALS3 in the early stages of GC in relation to metastatic tumors, if any.
IDO1 and TDO2 are intracellular metalloproteins that catalyze the first step of the kynurenine pathway that converts the essential amino acid tryptophan to kynurenine. IDO1 expression may be induced by IFN-γ. Overactivation of the kynurenine pathway results in a decrease in tryptophan and an increase in the kynurenine level. Accumulation of kynurenine is toxic to immune cells and can lead to arrest of cell cycle in CD8+ T-cells, NK-cells, and NKT-cells through the GCN and mTOR signaling pathways [19]. High expression of IDO1 in patients with GC is positively associated with tumor invasion and metastasis. In addition, increased IDO1 expression is associated with fewer number of CD4+ and CD8+ T-cells and higher number of Treg cells in tumors [20,21]. In GC, increased expression of IDO1 is associated with poor OS [20,22,23]. We found the association of increased expression of the IDO1 gene with a poor differentiation in GC for the first time. The IDO1 may be considered for inhibition in tumors with a low differentiation degree, as connected with GC differentiation.
CD274 gene encodes the PD-L1 IC, which is essential in the immune response. Interaction of PD-L1 with PD-1 receptor leads to inhibition of T-cell activation, CD8+ cytotoxic T-cells apoptosis, and increase of Foxp3+ Tregs number, which contributes the tumor to evade the immunity [24]. PD-L1 expression is regulated by several signaling pathways such as PI3K/AKT, MAPK, JAK-STAT, WNT, NF-κB, and Hedgehog [25]. PD-L1 is expressed in tumor cells of 30% of GC cases, but not in non-neoplastic gastric epithelium [26]. The expression of PD-L1 is being studied as a marker of poor prognosis in various types of malignancies [27,28,29]. Increased PD-L1 expression is also associated with a poor prognosis in GC [30,31,32]. We found an association of increased CD274 mRNA expression with a diffuse/mixed type according to the Lauren classification. Chen et al. study also showed that the expression of PD-L1, measured by the IHC method, correlated with the Lauren type [33]. LGALS9 gene encodes Galectin-9 (Gal-9), another member of the galectin family. Gal-9 triggers the signaling pathways required for stimulation of innate immunity, recruits eosinophils and neutrophils to the site of infection, and facilitates the maturation of dendritic cells. Interaction of Gal-9 with receptors on the cell surface leads to the production of pro-inflammatory cytokines and chemokines by activated T-cells. Changes in intra- and extracellular Gal-9 concentration lead to physiological changes [34]. One of the Gal-9 receptors is Tim-3, an exhaustion marker that is expressed by activated T-cells. Binding of Gal-9 to Tim-3 leads to apoptosis of peripheral T-cells through the calcium-calpain-caspase-1 pathway. Most TIM-3+ T-cells in tumors co-express PD-1, another receptor of Gal-9. Gal-9–PD-1 binding contributes to the persistence of PD-1 + TIM-3+ T cells and attenuates Gal-9/Tim-3-induced cell death [9]. Gal-9 expression is significantly altered in most malignant tumors [35]. In solid tumors, increased expression of Gal-9 was significantly correlated with a lower depth of invasion, an earlier histopathological stage, the absence of lymph node metastases and the absence of distant metastases [36]. In GC some studies find better survival with increased expression of Gal-9, and there are also conflicting results in different studies [35,37,38].
In our study, elevated LGALS9 expression was associated with poor differentiation and diffuse/mixed Lauren type. Furthermore, according to the results of multiple logistic regression, the Lauren type is an independent feature, while tumor differentiation degree is associated with the expression of LGALS9 as a secondary characteristic. The feature found should be taken into account in further studies of this gene as a therapeutic target for immunotherapy. The expression of the IC genes studied does not correlate positively with the expression of HER2. This result indicates in favor of the possibility of independent use of inhibitors of the studied ICs and HER2.

4. Materials and Methods

4.1. Clinical Samples

The samples were obtained at the N.N. Blokhin National Medical Research Center of Oncology (N.N. Blokhin NMRCO). All samples underwent histological examination (including HER2 status) in the Department of Pathological Anatomy of Human Tumors at N.N. Blokhin NMRCO, and were clinically characterized. A total of 101 paired samples of gastric tissue (tumor tissue and morphologically normal tissue from the same stomach) were examined (Table 7). The samples were freshly frozen surgical or esophagogastroduodenoscopy material. The normal stomach tissue was used as a control. There were 54 males and 47 females with average age of 62 years (ranging from 27 to 85 years). The samples were classified using the 8th edition of the AJCC TNM classification from clinical stages I–IV. There were 10 (9.9%) stage I, 31 (30.7%) stage II, 29 (28.7%) stage III, and 31 (30.7%) stage IV samples. Because of the small number of stage I samples and the similarity of their clinical characteristics to stage II samples, the two sets of data were combined: stage I + II = stage I/II = 41 (40.6%).

4.2. Gene Expression Analysis

Expression of the following 10 IC genes were studied in 101 GC tumor samples: ADAM17, PVR, TDO2, CD274, CD276, CEACAM1, IDO1, LGALS3, LGALS9 and HHLA2. Genes from each GC tumor sample were paired with and compared to those of a sample of normal tissue from the same stomach.
The commercial RNeasy Mini Kit (Qiagen, Frederick, MD, USA) was used to isolate total RNA from tumor and normal stomach tissue samples. The presence and intensity of 28S/18S rRNA bands of the total RNA were checked via electrophoresis on a 1.8% agarose gel using the Bio-Rad Subcell horizontal electrophoresis chamber (Bio-Rad, Hercules, CA, USA) and gel imaging with the GelDoc XR+ imaging and gel documentation system (Bio-Rad, CA, USA). The quantity and quality of RNA was evaluated using the Nanodrop-ND 1000 UV–Vis Spectrophotometer (Thermo Fisher, Waltham, MA, USA). RNA was considered of acceptable quality if the two bands corresponding to 28S and 18S rRNA had an intensity ratio of ~2:1, and the A260/A280 ratio was 1.8–2.1. MMLV RT kit (Evrogen, Moscow, Russia) was used for the reverse transcription reaction. RT-PCR was performed using the qPCRmix-HS SYBR + HighROX Master Mix (Evrogen, Moscow, Russia). Quantitative RT-PCR (qRT-PCR) proceeded using the QuantStudio 5 Real-Time PCR System (Applied Biosystems, Foster City, CA, USA). RT-PCR was performed in triplicate for each gene along with a no-template negative control. The samples were amplified using a predenaturation phase of 5 min at 95 °C, followed by 45 cycles of 20 s at 95 °C, 20 s of primer annealing at 60 °C, and 20 s of extension at 72 °C. After the 45 cycles were completed, a melting curve analysis was performed. The GAPDH gene was used as an endogenous control. The relative level of mRNA expression of each gene was calculated in tumor tissues relative to normal stomach tissue using QuantStudio Design and Analysis Software (Applied Biosystems, CA, USA) for the ΔΔCt (RQ) method. The primer sequences for each gene and their predicted size are listed in Table 8.

4.3. Statistical Analysis

Statistical data processing was performed using Statistica 10.0 software, MedCalc program and the online calculator: https://www.medcalc.org/calc (accessed on 30 September 2022). Differences in the expression levels were evaluated using the U criterion; ROC analysis, Fisher’s exact test, and the logistic regression method were used to evaluate the relationship between the expression levels and clinicopathological characteristics. The significance level was established at p < 0.05.
Since we conducted a study on the association between clinicopathological characteristics and simultaneous expression of several genes, we applied the correction for the multiplicity of comparisons using the false discovery rate method (FDR). The application of this amendment avoids false ‘discoveries’ that might arise for statistical reasons in multiple comparisons. The significance level was set at p < 0.05.

5. Conclusions

For the first time, data were obtained on the correlation of the expression of 10 IC genes in GC at early stages of development and during metastasis. Almost all genes studied, except TDO2, have at some stage other IC genes with expression coordinated with them. This should be taken into account in the study and in the possible use of IC inhibition. Of particular interest in this regard is the co-expression of the CD274 gene, which encodes PD-L1, at early stage of GC with IDO1 and with LGALS9 at late stage. It is not excluded, that correlation of PD-L1 expression with another ICs may be a cause of resistance to PD-L1 inhibition. At stage IV, the expression of the IDO1 gene does not correlate with any other gene. This suggests that IDO1 inhibition at stage IV may be the most effective. As a rule, the correlation is positive, although there are exceptions. The expression of the CD276 and CEACAM1 genes negatively correlates both at the early and metastatic stages. The inhibition of CEACAM1 may be used in absence of B7-H3 expression, encoded by the CD276—gene with the highest number of expression correlations with other ICs. These data and their possible practical consequence accented the importance of parallel investigation of IC expression association with cancer development and IC expression coordination.
In particular, the expression of the TDO2 and LGALS3 genes had a statistically significant relationship with GC metastasis. In metastatic tumors TDO2 was expressed four-fold higher than in non-metastatic tumors, but LGALS3 was two-fold lower. The differentiation was associated with another IC gene, IDO1. The expression of CD274 (PD-L1) and LGALS9 was associated with the type of GC by Lauren classification that should be considered in future studies and practical PD-L1 inhibition.
The revealed features of TDO2—a significant increase in expression at the metastatic stage, the absence of other IC genes with correlated expression—indicate the prospect of inhibiting this gene in a metastatic GC tumor. The IDO1, as connected with GC differentiation, may be considered for inhibition in tumors with a low differentiation degree.

Author Contributions

Conceptualization, D.M. and A.K.; methodology, A.K.; software, D.M.; validation, D.M.; formal analysis, N.A.; investigation, D.M.; resources, M.N., O.M., I.S. and F.K.; data curation, F.K. and N.A.; writing—original draft preparation, F.K.; writing—review and editing, D.M. and A.K.; visualization, D.M.; supervision, A.K. and I.S.; funding acquisition, A.K. All authors have read and agreed to the published version of the manuscript.

Funding

The research was carried out within the state assignment and funding of Ministry of Science and Higher Education of the Russian Federation, FGFF-2022-0011.

Institutional Review Board Statement

The study was conducted in accordance with the Declaration of Helsinki and approved by the Ethics Committee of Federal State Budgetary Scientific Institution “Research Centre for Medical Genetics” (protocol code № 7/4, 9 November 2020).

Informed Consent Statement

Informed consent was obtained from all subjects involved in the study.

Data Availability Statement

Not applicable.

Conflicts of Interest

The authors declare no conflict of interest.

References

  1. Mansorunov, D.; Apanovich, N.; Apanovich, P.; Kipkeeva, F.; Muzaffarova, T.; Kuzevanova, A.; Nikulin, M.; Malikhova, O.; Karpukhin, A. Expression of Immune Checkpoints in Malignant Tumors: Therapy Targets and Biomarkers for the Gastric Cancer Prognosis. Diagnostics 2021, 11, 2370. [Google Scholar] [CrossRef]
  2. Kuzevanova, A.; Apanovich, N.; Mansorunov, D.; Korotaeva, A.; Karpukhin, A. The Features of Checkpoint Receptor—Ligand Interaction in Cancer and the Therapeutic Effectiveness of Their Inhibition. Biomedicines 2022, 10, 2081. [Google Scholar] [CrossRef] [PubMed]
  3. Sung, H.; Ferlay, J.; Siegel, R.L.; Laversanne, M.; Soerjomataram, I.; Jemal, A.; Bray, F. Global Cancer Statistics 2020: GLOBOCAN Estimates of Incidence and Mortality Worldwide for 36 Cancers in 185 Countries. CA Cancer J. Clin. 2021, 71, 209–249. [Google Scholar] [CrossRef] [PubMed]
  4. Etemadi, A.; Safiri, S.; Sepanlou, S.G.; Ikuta, K.; Bisignano, C.; Shakeri, R.; Amani, M.; Fitzmaurice, C.; Nixon, M.; Abbasi, N.; et al. The global, regional, and national burden of stomach cancer in 195 countries, 1990–2017: A systematic analysis for the Global Burden of Disease study 2017. Lancet Gastroenterol. Hepatol. 2020, 5, 42–54. [Google Scholar] [CrossRef] [Green Version]
  5. Feng, F.; Liu, J.; Wang, F.; Zheng, G.; Wang, Q.; Liu, S.; Xu, G.; Guo, M.; Lian, X.; Zhang, H. Prognostic value of differentiation status in gastric cancer. BMC Cancer 2018, 18, 865. [Google Scholar] [CrossRef] [PubMed]
  6. Tang, D.; Ni, M.; Zhu, H.; Cao, J.; Zhou, L.; Shen, S.; Peng, C.; Lv, Y.; Xu, G.; Wang, L.; et al. Differential prognostic implications of gastric adenocarcinoma based on Lauren’s classification: A Surveillance, Epidemiology, and End Results (SEER)-based cohort study. Ann. Transl. Med. 2021, 9, 646. [Google Scholar] [CrossRef] [PubMed]
  7. Lee, J.H.; Chang, K.K.; Yoon, C.; Tang, L.H.; Strong, V.E.; Yoon, S.S. Lauren Histologic Type Is the Most Important Factor Associated With Pattern of Recurrence Following Resection of Gastric Adenocarcinoma. Ann. Surg. 2018, 267, 105–113. [Google Scholar] [CrossRef] [PubMed]
  8. Cui, J.; Tian, Y.; Liu, T.; Lin, X.; Li, L.; Li, Z.; Shen, L. Pancancer Analysis of Revealed TDO2 as a Biomarker of Prognosis and Immunotherapy. Dis. Markers 2022, 2022, 5447017. [Google Scholar] [CrossRef]
  9. Yang, R.; Sun, L.; Li, C.-F.; Wang, Y.-H.; Yao, J.; Li, H.; Yan, M.; Chang, W.-C.; Hsu, J.-M.; Cha, J.-H.; et al. Galectin-9 interacts with PD-1 and TIM-3 to regulate T cell death and is a target for cancer immunotherapy. Nat. Commun. 2021, 12, 832. [Google Scholar] [CrossRef]
  10. Kawatoko, S.; Kohashi, K.; Torisu, T.; Sasaki, T.; Umekita, S.; Oki, E.; Nakamura, M.; Kitazono, T.; Oda, Y. Solid-type poorly differentiated adenocarcinoma of the stomach: A characteristic morphology reveals a distinctive immunoregulatory tumor microenvironment. Pathol.—Res. Pract. 2022, 238, 154124. [Google Scholar] [CrossRef]
  11. Ye, Z.; Yue, L.; Shi, J.; Shao, M.; Wu, T. Role of IDO and TDO in Cancers and Related Diseases and the Therapeutic Implications. J. Cancer 2019, 10, 2771–2782. [Google Scholar] [CrossRef] [PubMed] [Green Version]
  12. Peyraud, F.; Guegan, J.-P.; Bodet, D.; Cousin, S.; Bessede, A.; Italiano, A. Targeting Tryptophan Catabolism in Cancer Immunotherapy Era: Challenges and Perspectives. Front. Immunol. 2022, 13, 200. [Google Scholar] [CrossRef] [PubMed]
  13. Pham, Q.T.; Taniyama, D.; Akabane, S.; Takashima, T.; Maruyama, R.; Sekino, Y.; Sentani, K.; Yasui, W.; Oue, N. Essential Roles of TDO2 in Gastric Cancer: TDO2 Is Associated with Cancer Progression, Patient Survival, PD-L1 Expression, and Cancer Stem Cells. Pathobiology, 2022; 1–12, Online ahead of print. [Google Scholar] [CrossRef]
  14. Hu, Y.; Liu, Z.; Tang, H. Tryptophan 2,3-dioxygenase may be a potential prognostic biomarker and immunotherapy target in cancer: A meta-analysis and bioinformatics analysis. Front. Oncol. 2022, 12, 977640. [Google Scholar] [CrossRef] [PubMed]
  15. Yang, R.-Y.; Rabinovich, G.A.; Liu, F.-T. Galectins: Structure, function and therapeutic potential. Expert Rev. Mol. Med. 2008, 10, e17. [Google Scholar] [CrossRef]
  16. Newlaczyl, A.U.; Yu, L.-G. Galectin-3—A jack-of-all-trades in cancer. Cancer Lett. 2011, 313, 123–128. [Google Scholar] [CrossRef]
  17. De Oliveira, J.T.; de Matos, A.J.; Gomes, J.; Vilanova, M.; Hespanhol, V.; Manninen, A.; Rutteman, G.; Chammas, R.; Gärtner, F.; Bernardes, E.S. Coordinated expression of galectin-3 and galectin-3-binding sites in malignant mammary tumors: Implications for tumor metastasis. Glycobiology 2010, 20, 1341–1352. [Google Scholar] [CrossRef] [Green Version]
  18. Long, B.; Yu, Z.; Zhou, H.; Ma, Z.; Ren, Y.; Zhan, H.; Li, L.; Cao, H.; Jiao, Z. Clinical characteristics and prognostic significance of galectins for patients with gastric cancer: A meta-analysis. Int. J. Surg. 2018, 56, 242–249. [Google Scholar] [CrossRef]
  19. Yu, C.-P.; Fu, S.-F.; Chen, X.; Ye, J.; Ye, Y.; Kong, L.-D.; Zhu, Z. The Clinicopathological and Prognostic Significance of IDO1 Expression in Human Solid Tumors: Evidence from a Systematic Review and Meta-Analysis. Cell Physiol. Biochem. 2018, 49, 134–143. [Google Scholar] [CrossRef]
  20. Li, F.; Sun, Y.; Huang, J.; Xu, W.; Liu, J.; Yuan, Z. CD4/CD8 + T cells, DC subsets, Foxp3, and IDO expression are predictive indictors of gastric cancer prognosis. Cancer Med. 2019, 8, 7330–7344. [Google Scholar] [CrossRef]
  21. Zhang, R.; Liu, H.; Li, F.; Li, H.; Yu, J.; Ren, X. The Correlation Between the Subsets of Tumor Infiltrating Memory T Cells and the Expression of Indoleamine 2,3-Dioxygenase in Gastric Cancer. Dig. Dis. Sci. 2013, 58, 3494–3502. [Google Scholar] [CrossRef]
  22. Lu, S.; Wang, L.J.; Lombardo, K.; Kwak, Y.; Kim, W.H.; Resnick, M.B. Expression of Indoleamine 2, 3-dioxygenase 1 (IDO1) and Tryptophanyl-tRNA Synthetase (WARS) in Gastric Cancer Molecular Subtypes. Appl. Immunohistochem. Mol. Morphol. 2020, 28, 360–368. [Google Scholar] [CrossRef]
  23. Nishi, M.; Yoshikawa, K.; Higashijima, J.; Tokunaga, T.; Kashihara, H.; Takasu, C.; Ishikawa, D.; Wada, Y.; Shimada, M. The Impact of Indoleamine 2,3-dioxygenase (IDO) Expression on Stage III Gastric Cancer. Anticancer Res. 2018, 38, 3387–3392. [Google Scholar] [CrossRef]
  24. Keir, M.E.; Butte, M.J.; Freeman, G.J.; Sharpe, A.H. PD-1 and Its Ligands in Tolerance and Immunity. Annu. Rev. Immunol. 2008, 26, 677–704. [Google Scholar] [CrossRef] [Green Version]
  25. Han, Y.; Liu, D.; Li, L. PD-1/PD-L1 pathway: Current researches in cancer. Am. J. Cancer Res. 2020, 10, 727. [Google Scholar]
  26. Böger, C.; Behrens, H.-M.; Mathiak, M.; Krüger, S.; Kalthoff, H.; Röcken, C. PD-L1 is an independent prognostic predictor in gastric cancer of Western patients. Oncotarget 2016, 7, 24269–24283. [Google Scholar] [CrossRef] [Green Version]
  27. Wu, P.; Wu, D.; Li, L.; Chai, Y.; Huang, J. PD-L1 and Survival in Solid Tumors: A Meta-Analysis. PLoS ONE 2015, 10, e0131403. [Google Scholar] [CrossRef]
  28. Xiang, X.; Yu, P.-C.; Long, D.; Liao, X.-L.; Zhang, S.; You, X.-M.; Zhong, J.-H.; Li, L.-Q. Prognostic value of PD -L1 expression in patients with primary solid tumors. Oncotarget 2018, 9, 5058–5072. [Google Scholar] [CrossRef] [Green Version]
  29. Dai, C.; Wang, M.; Lu, J.; Dai, Z.; Lin, S.; Yang, P.; Tian, T.; Liu, X.; Min, W.; Dai, Z. Prognostic and predictive values of PD-L1 expression in patients with digestive system cancer: A meta-analysis. Onco. Targets. Ther. 2017, 10, 3625–3634. [Google Scholar] [CrossRef] [Green Version]
  30. Qiu, Z.; Du, Y. Clinicopathological and prognostic significance of programmed death ligant-1 expression in gastric cancer: A meta-analysis. J. Gastrointest. Oncol. 2021, 12, 112–120. [Google Scholar] [CrossRef]
  31. Gu, L.; Chen, M.; Guo, D.; Zhu, H.; Zhang, W.; Pan, J.; Zhong, X.; Li, X.; Qian, H.; Wang, X. PD-L1 and gastric cancer prognosis: A systematic review and meta-analysis. PLoS ONE 2017, 12, e0182692. [Google Scholar] [CrossRef]
  32. Zhang, M.; Dong, Y.; Liu, H.; Wang, Y.; Zhao, S.; Xuan, Q.; Wang, Y.; Zhang, Q. The clinicopathological and prognostic significance of PD-L1 expression in gastric cancer: A meta-analysis of 10 studies with 1901 patients. Sci. Rep. 2016, 6, 37933. [Google Scholar] [CrossRef] [Green Version]
  33. Chen, X.; Zhang, H.; Wang, M.; Liu, H.; Hu, Y.; Lin, T.; Chen, H.; Zhao, M.; Chen, T.; Li, G.; et al. Relationship Between Programmed Death Ligand 1 Expression and Other Clinicopathological Features in a Large Cohort of Gastric Cancer Patients. Front. Immunol. 2022, 13, 783695. [Google Scholar] [CrossRef]
  34. Moar, P.; Tandon, R. Galectin-9 as a biomarker of disease severity. Cell. Immunol. 2021, 361, 104287. [Google Scholar] [CrossRef]
  35. Wang, Y.; Zhao, E.; Zhang, Z.; Zhao, G.; Cao, H. Association between Tim-3 and Gal-9 expression and gastric cancer prognosis. Oncol. Rep. 2018, 40, 2115–2126. [Google Scholar] [CrossRef]
  36. Zhou, X.; Sun, L.; Jing, D.; Xu, G.; Zhang, J.; Lin, L.; Zhao, J.; Yao, Z.; Lin, H. Galectin-9 Expression Predicts Favorable Clinical Outcome in Solid Tumors: A Systematic Review and Meta-Analysis. Front. Physiol. 2018, 9, 452. [Google Scholar] [CrossRef] [Green Version]
  37. Choi, S.I.; Seo, K.W.; Kook, M.C.; Kim, C.G.; Kim, Y.W.; Cho, S.J. Prognostic value of tumoral expression of galectin-9 in gastric cancer. Turk. J. Gastroenterol. 2017, 28, 166–170. [Google Scholar] [CrossRef] [Green Version]
  38. Jiang, J.; Jin, M.-S.; Kong, F.; Cao, D.; Ma, H.-X.; Jia, Z.; Wang, Y.-P.; Suo, J.; Cao, X. Decreased galectin-9 and increased Tim-3 expression are related to poor prognosis in gastric cancer. PLoS ONE 2013, 8, e81799. [Google Scholar] [CrossRef]
Figure 1. The relative gene expression (RQ) in groups with metastases (red dots) and without metastases (blue dots). Gene expression values are presented on a logarithmic scale. The line marks the median.
Ijms 23 13846 g001
Figure 2. Correlation of expression at stage I + II (early GC). Ijms 23 13846 i001 significant correlation; Ijms 23 13846 i002 there is no sig-nificant correlation.
Ijms 23 13846 g002
Figure 3. Correlation of expression at stage IV (metastatic GC). Ijms 23 13846 i001 significant correlation; Ijms 23 13846 i002 there is no significant correlation.
Ijms 23 13846 g003
Figure 4. Scatterplot of gene expression at stage I + II (early GC).
Ijms 23 13846 g004
Figure 5. Scatterplot of gene expression at stage IV (metastatic GC).
Ijms 23 13846 g005
Figure 6. The relative gene expression (RQ) in poorly differentiated tumors (red dots) and well/moderately differentiated tumors (blue dots). Gene expression values are presented on a logarithmic scale. The line marks the median.
Ijms 23 13846 g006
Table 1. The medians of expression and significance of their differences in GC samples with and without metastases.
GeneGene NameThe Median Value in the Non-Metastatic GroupThe Median Value in the Metastatic Groupp = (Mann-Whitey U-Test)
ADAM17A Disintegrin and Metalloproteinase Domain 170.911.190.198
IDO1Indoleamine 2,3-Dioxygenase0.991.100.726
CD274Cluster of Differentiation 2740.820.950.444
PVRPoliovirus Receptor1.231.190.657
TDO2Tryptophan 2,3-Dioxygenase0.763.030.024
CD276Cluster of Differentiation 2761.581.430.732
LGALS9Galectin-90.660.930.202
CEACAM1Carcinoembryonic Antigen-Related Cell Adhesion Molecule 10.760.910.405
HHLA2Human Endogenous Retrovirus-H Long Terminal Repeat-Associating Protein 20.920.340.109
LGALS3Galectin-31.510.850.031
Table 2. The relationship of gene expression with the development of metastases using ROC analysis.
GeneArea under ROC Curve (AUC)/95% CICut-Off ValueSensitivitySpecificitySignificance Level p (Area = 0.5)Benjamini-Hochberg Adjusted p-Value
ADAM170.584/0.462–0.706>0.8--0.179-
IDO10.525/0.392–0.657>0.1--0.716-
CD2740.552/0.423–0.682>0.5--0.428-
PVR0.529/0.407–0.651≤3--0.639-
TDO20.662/0.524–0.800>1.66876.090.0210.042
CD2760.522/0.398–0.645≤0.3--0.729-
LGALS90.582/0.467–0.698>0.3--0.161-
CEACAM10.553/0.428–0.678>0.8--0.41-
HHLA20.611/0.476–0.746≤0.3--0.106-
LGALS30.639/0.519–0.758≤1.682.7646.380.0230.023
Table 3. The frequencies of gene expression level relative to the cut-off value in groups of patients with GC metastases and without metastases and the association of gene expression with metastasis by Fisher’s exact test.
GeneFrequency of Expression Higher/Lower From the Cut-Off Value in Non-Metastatic GCFrequency of Expression Higher/Lower From the Cut-off Value in Metastatic GCOdds Ratio/95% CIRelative
Risk/95% CI
Fisher’s Exact Test, p =Benjamini-Hochberg Adjusted p-Value
ADAM1737/3322/92.18/0.88–5.401.74/0.89–3.390.125-
IDO162/831/08.57/0.48–153.276.03/0.40–90.540.102-
CD27442/2824/72.29/0.87–6.021.82/0.87–3.790.114-
PVR19/513/283.48/0.95–12.782.60/0.87–7.750.067-
TDO217/5321/106.55/2.58–16.603.48/1.84–6.58<0.001<0.001
CD27666/426/53.17/0.79–12.751.97/1.01–3.840.128-
LGALS943/2727/44.24/1.34–13.452.99/1.14–7.820.010.01
CEACAM133/3719/121.78/0.75–4.201.49/0.81–2.740.204-
HHLA248/2215/162.33/0.98–5.541.77/0.99–3.150.075-
LGALS332/385/264.38/1.51–12.723.01/1.26–7.160.0070.011
Table 4. The relationship of gene expression with the degree of tumor differentiation—ROC analysis.
GeneArea under ROC Curve (AUC)/95% CICut-Off ValueSensitivitySpecificitySignificance Level p (Area = 0.5)Benjamini-Hochberg Adjusted p-Value
ADAM170.531/0.403–0.659≤1.5--0.637-
IDO10.644/0.518–0.769>0.674.4758.060.0250.025
CD2740.601/0.474–0.728>1.2--0.118-
PVR0.622/0.498–0.745≤1.0--0.054-
TDO20.604/0.466–0.742>0.5--0.141-
CD2760.566/0.440–0.692≤1.8--0.303-
LGALS90.635/0.518–0.752>0.666.0467.570.0240.048
CEACAM10.570/0.452–0.688>0.8--0.243-
HHLA20.546/0.419–0.674>3.2--0.476-
LGALS30.539/0.419–0.659>2.4--0.523-
Table 5. The relationship of gene expression with the type by Lauren classification—ROC analysis.
GeneArea under ROC Curve (AUC)/95% CICut-Off ValueSensitivitySpecificitySignificance Level p (Area = 0.5)Benjamini-Hochberg Adjusted p-Value
IDO10.552/0.405–0.698>0.668.4248.280.4890.489
LGALS90.766/0.659–0.873>0.675.6175.00<0.0001<0.0001
Table 6. Identification of independent feature for LGALS9 gene expression—multiple logistic regression.
CharacteristicCoefficientStandard Errorp-ValueOdds Ratio/95% CI
Differentiation−0.3260.8510.7020.72/0.14–3.84
Lauren type2.4750.8430.00311.88/2.28–62.00
Table 7. Patient characteristics.
Clinicopathological FeaturesNumber of Patients
GenderMale54
Female47
Age<60 34
>6067
Tumor locationUpper19
Middle44
Lower35
Whole3
DifferentiationWell/moderate41
Poor60
Lauren typeIntestinal46
Diffuse45
Mixed9
Non-classified1
Depth of tumor invasion (T)17
210
323
461
Lymph node metastasis (N)043
122
222
314
Distant metastasis (M)M070
M131
Stage (8th AJCC)IA6
IB4
IIA9
IIB22
IIIA11
IIIB14
IIIC4
IV31
Table 8. Primer sequences for qRT-PCR and their amplicon size.
GenePrimer DirectionPrimer Sequence (From 5′→3′)Product Size (bp)
GAPDHForwardGGCTGCTTTTAACTCTGG190
ReverseGGAGGGATCTCGCTCC
ADAM17ForwardGCTTGGATCTTGGCAAGTGT150
ReverseCATCGACATAGGGCACACAG
IDO1ForwardCCAGCTATCAGACGGTCTG228
ReverseCGGACTGAGGGATTTGACTC
CD274ForwardGTGCCGACTACAAGCGAATT104
ReverseTGTCAGTTCATGTTCAGAGGTG
PVRForwardCTACACCTGCCTGTTCGTCA186
ReverseTCTGAGTGCCAGGTGATTTG
TDO2ForwardTCCTCAGGCTATCACTACCTGC110
ReverseATCTTCGGTATCCAGTGTCGG
CD276ForwardGGCTGTCTGTCTGTCTCATTG176
ReverseTCCATCATCTTCTTTGCTGTCA
LGALS9ForwardGATGAGAATGCTGTGGTCCG260
ReverseGAAGCCGCCTATGTCTGCA
CEACAM1ForwardTCTACCCTGAACTTTGAAGCCCA150
ReverseTGAGAGACTTGAAATACATCAGCACTG
HHLA2ForwardAGTGGTGCTAAAGGTGGGAGTT154
ReverseCATGTTGTTTTCAGAGATAGGTGTGT
LGALS3ForwardGGCCACTGATTGTGCCTTAT154
ReverseAAGCGTGGGTTAAAGTGGAAG
Publisher’s Note: MDPI stays neutral with regard to jurisdictional claims in published maps and institutional affiliations.

