
Convolutional Neural Network Model Based on 2D Fingerprint for Bioactivity Prediction

 , ,
, ,  ,
, 

Abstract
1. Introduction
2. Results
2.1. Benchmarking
2.2. Stage 1
2.3. Stage 2
2.4. Stage 3
3. Discussion
3.1. Similarity Searching
3.2. Convolutional Neural Network for Biological Activity Prediction
4. Materials and Methods
4.1. Data Sets
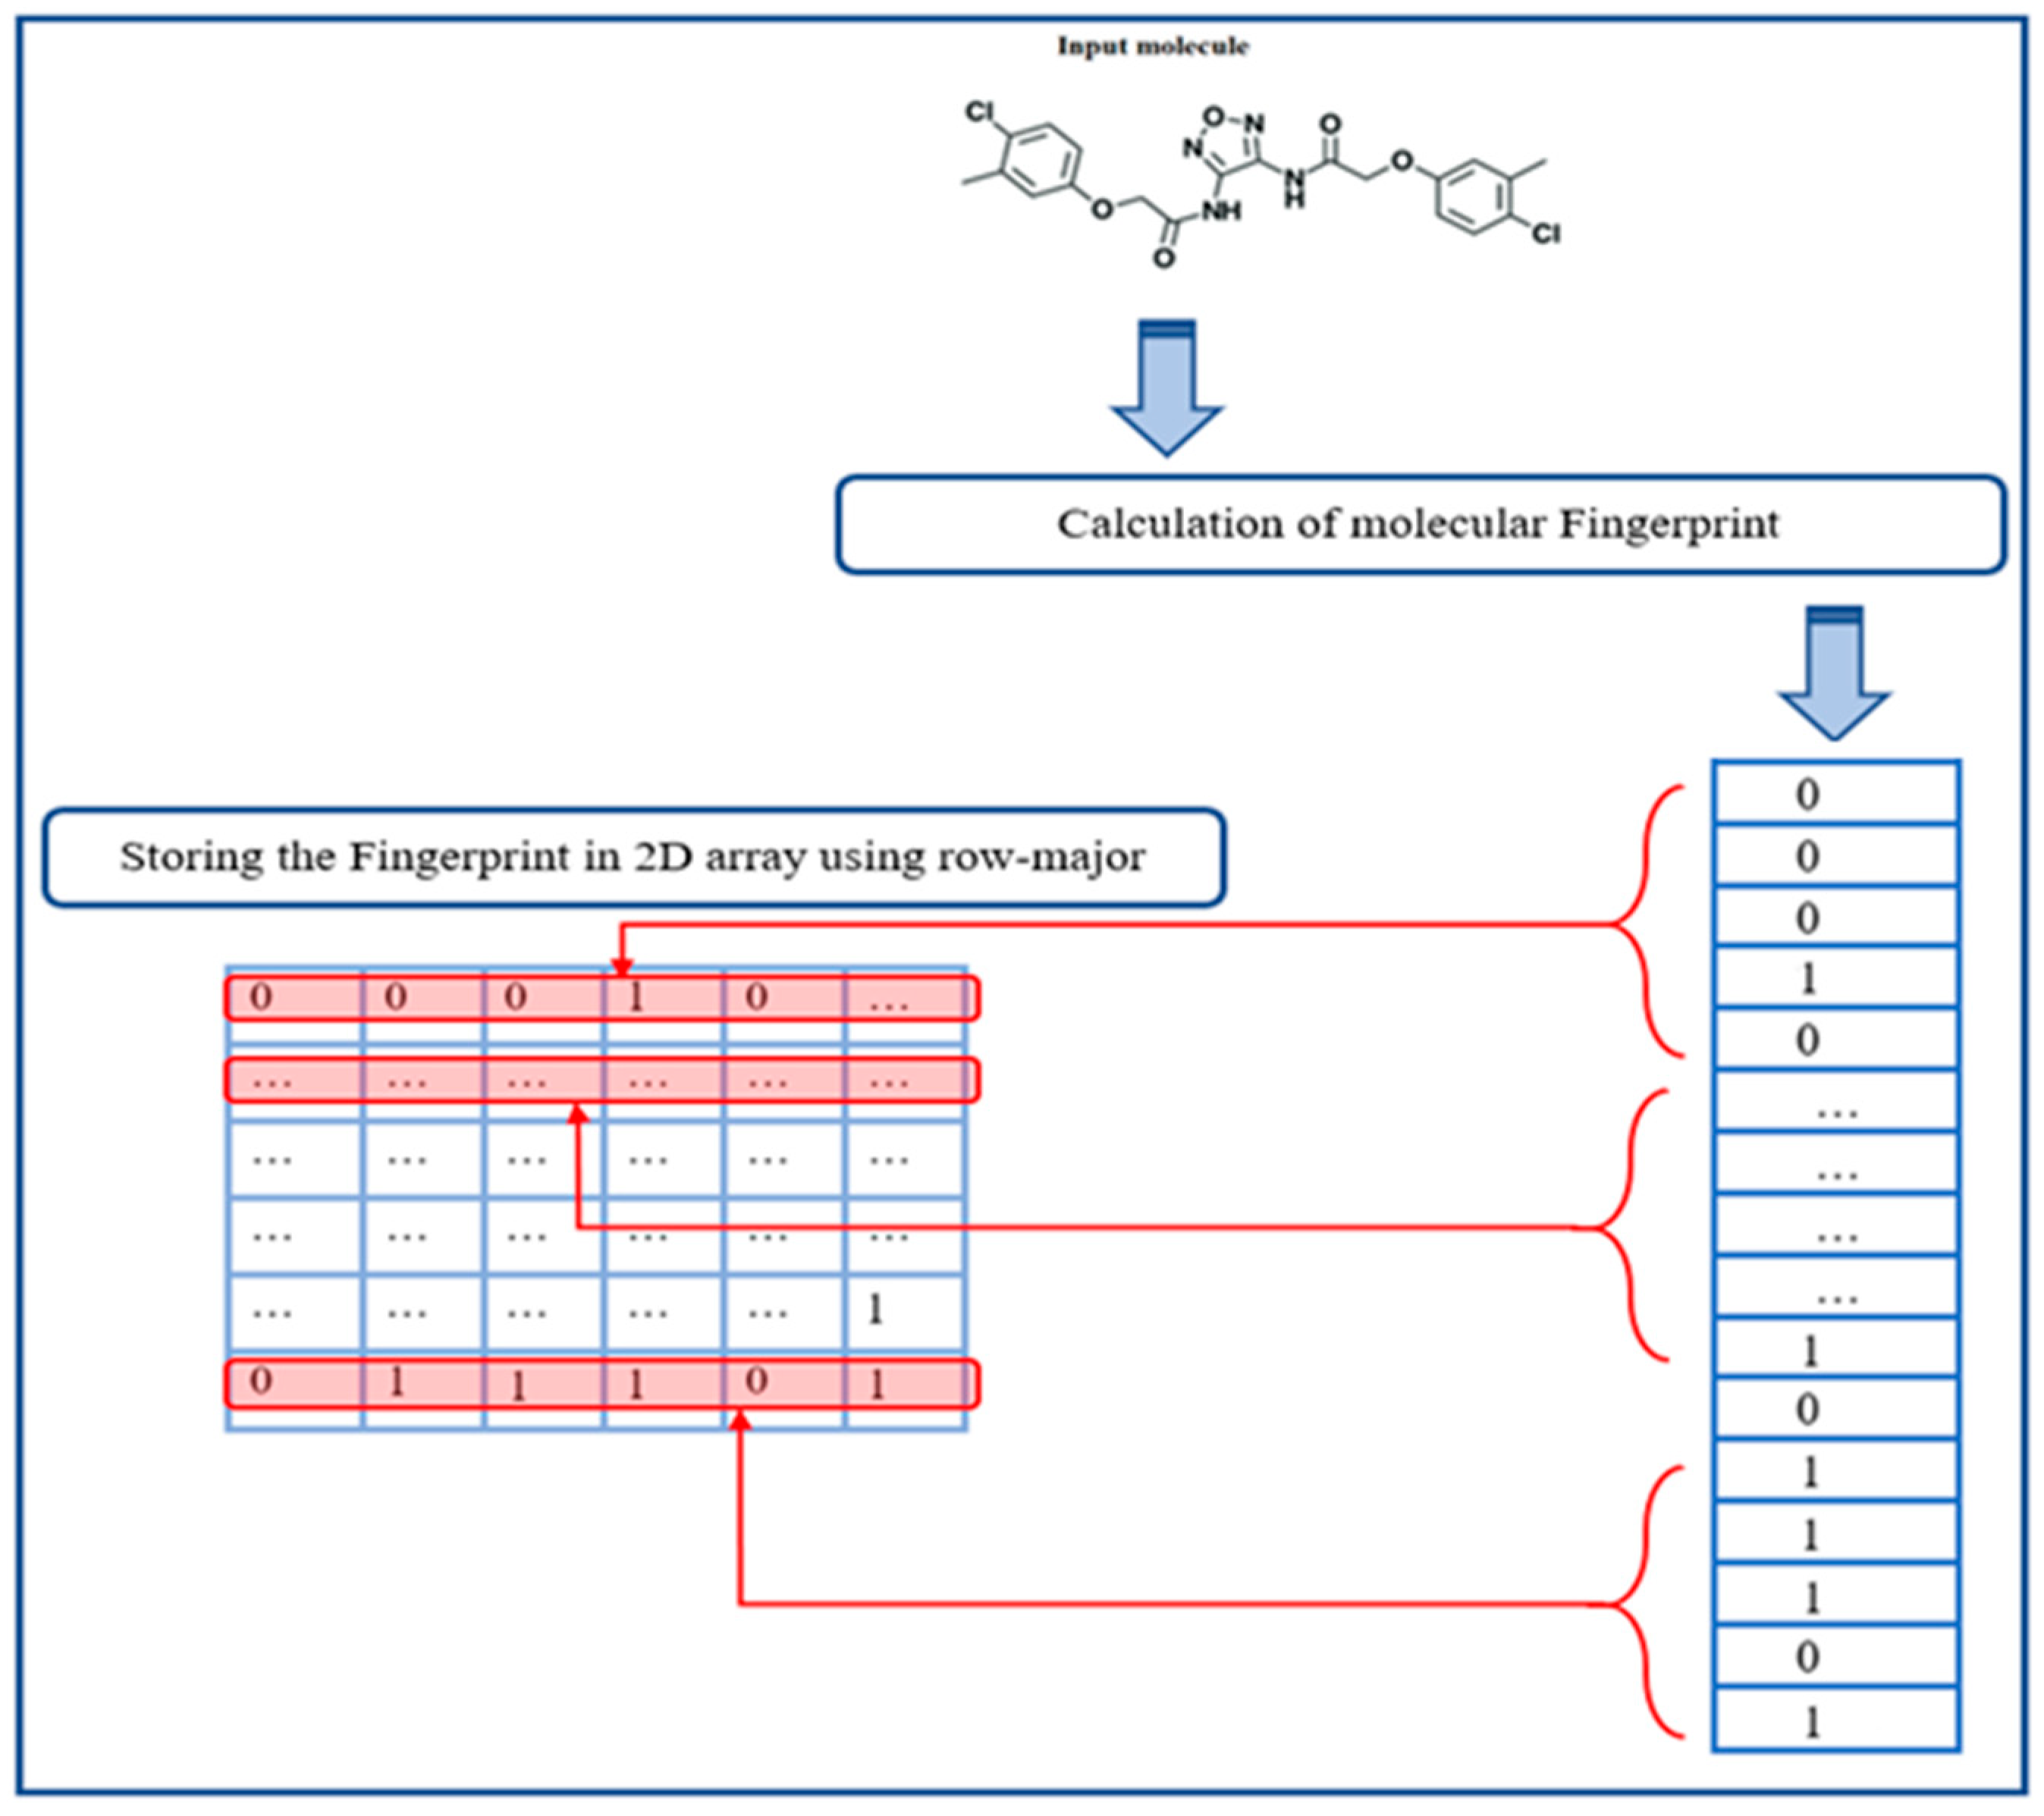
4.2. Input Representation
| Algorithm 1: Storing fingerprint in a 2D array |
 |
4.3. Convolutional Neural Network
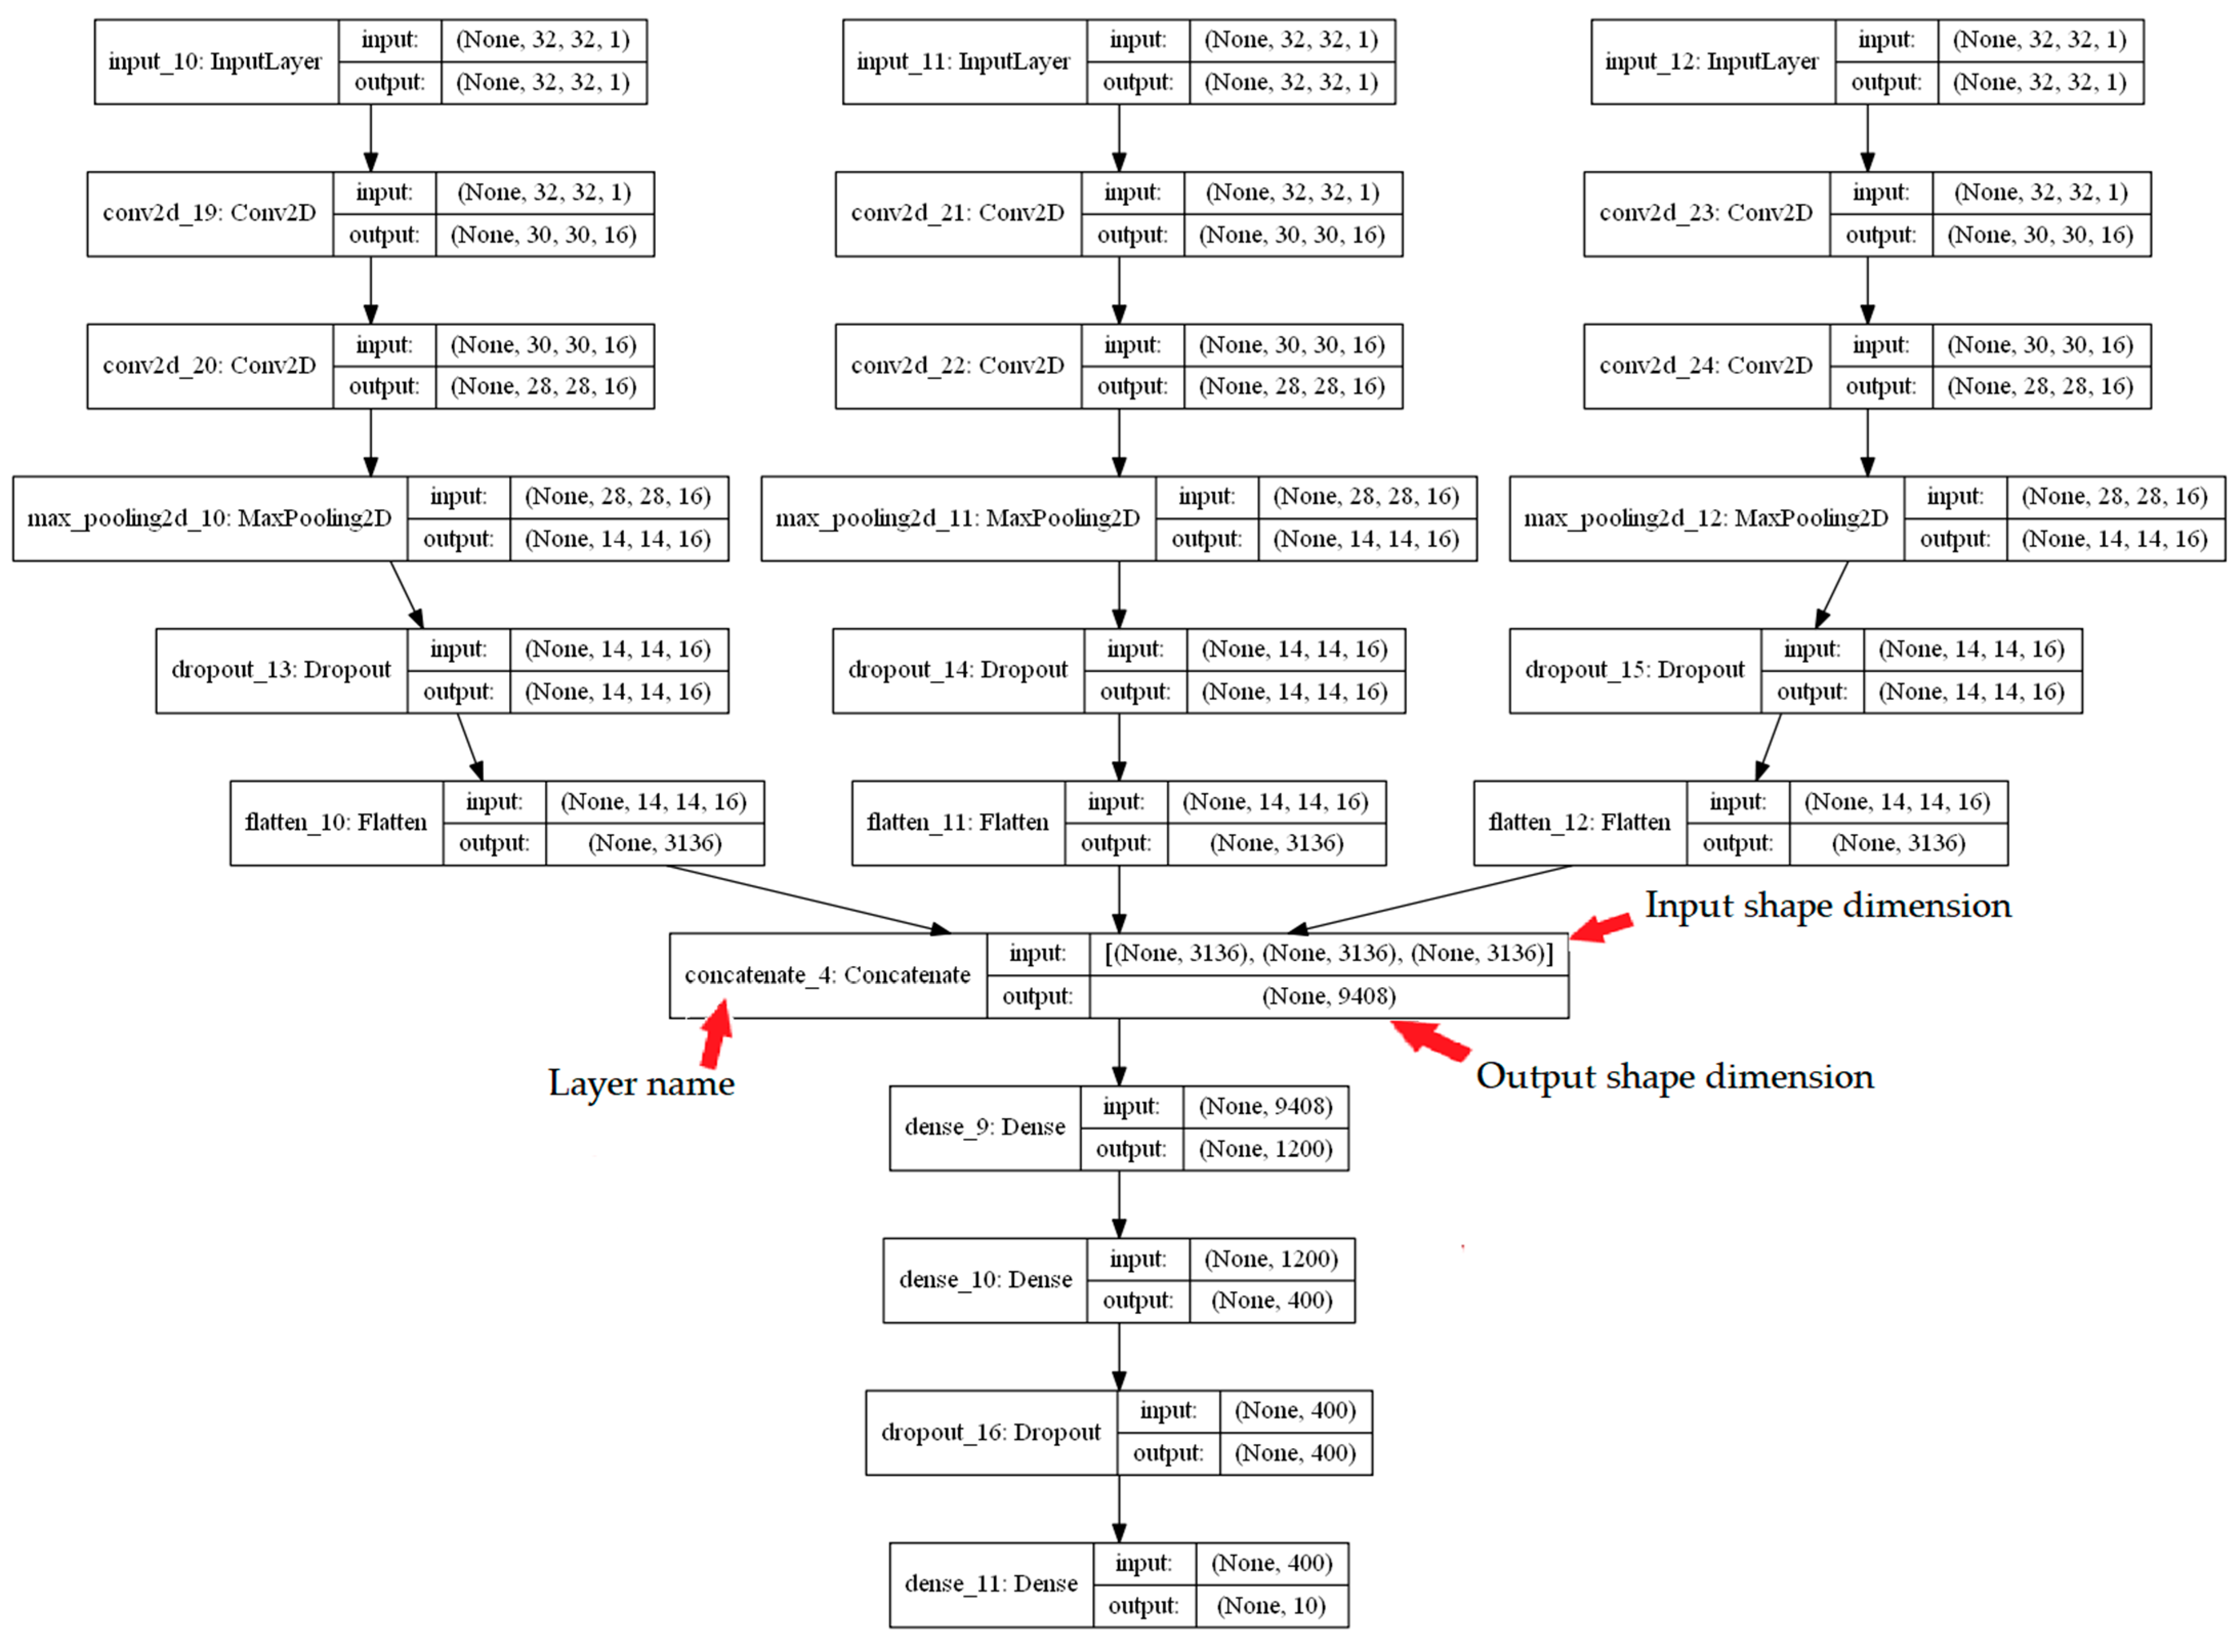
4.4. Network Architecture
5. Conclusions
Author Contributions
Funding
Institutional Review Board Statement
Informed Consent Statement
Data Availability Statement
Acknowledgments
Conflicts of Interest
References
- Willett, P.; Barnard, J.M.; Downs, G.M. Chemical Similarity Searching. J. Chem. Inf. Comput. Sci. 1998, 38, 983–996. [Google Scholar] [CrossRef]
- Li, J.; Luo, D.; Wen, T.; Liu, Q.; Mo, Z. Representative Feature Selection of Molecular Descriptors in QSAR Modeling. J. Mol. Struct. 2021, 1244, 131249. [Google Scholar] [CrossRef]
- Willett, P. Similarity-Based Virtual Screening Using 2D Fingerprints. Drug Discov. Today 2006, 11, 1046–1053. [Google Scholar] [CrossRef]
- Du, Z.; Wang, D.; Li, Y. Comprehensive Evaluation and Comparison of Machine Learning Methods in QSAR Modeling of Antioxidant Tripeptides. ACS Omega 2022, 7, 25760–25771. [Google Scholar] [CrossRef]
- Priyanka, D.; Supratik, K.; Pravin, A.; Kunal, R. Prediction Reliability of QSAR Models: An Overview of Various Validation Tools. Arch. Toxicol. 2022, 96, 1279–1295. [Google Scholar]
- Huang, T.; Guohui, S.; Lijiao, Z.; Na, Z.; Rugang, Z.; Yongzhen, P. Quantitative Structure-Activity Relationship (QSAR) Studies on the Toxic Effects of Nitroaromatic Compounds. Int. J. Mol. Sci. 2021, 22, 8557. [Google Scholar] [CrossRef]
- Hentabli, H.; Saeed, F.; Abdo, A.; Salim, N. A New Graph-Based Molecular Descriptor Using the Canonical Representation of the Molecule. Sci. World J. 2014, 2014, 286974. [Google Scholar] [CrossRef] [PubMed]
- Wang, D.; Yu, J.; Chen, L.; Li, X.; Jiang, H.; Chen, K.; Zheng, M.; Luo, X. A Hybrid Framework for Improving Uncertainty Quantification in Deep Learning-Based QSAR Regression Modeling. J. Cheminform. 2021, 13, 69. [Google Scholar] [CrossRef]
- Kumari, M.; Tiwari, N.; Chandra, S.; Subbarao, N. Comparative Analysis of Machine Learning Based QSAR Models and Molecular Docking Studies to Screen Potential Anti-Tubercular Inhibitors against InhA of Mycobacterium Tuberculosis. Int. J. Comput. Biol. Drug Des. 2018, 11, 209–235. [Google Scholar] [CrossRef]
- Ding, Y.; Chen, M.; Guo, C.; Zhang, P.; Wang, J. Molecular Fingerprint-Based Machine Learning Assisted QSAR Model Development for Prediction of Ionic Liquid Properties. J. Mol. Liq. 2021, 326, 115212. [Google Scholar] [CrossRef]
- Nasser, M.; Salim, N.; Saeed, F.; Basurra, S.; Rabiu, I.; Hamza, H.; Alsoufi, M.A. Feature Reduction for Molecular Similarity Searching Based on Autoencoder Deep Learning. Biomolecules 2022, 12, 508. [Google Scholar] [CrossRef] [PubMed]
- Li, Y.; Xu, Y.; Yu, Y. CRNNTL: Convolutional Recurrent Neural Network and Transfer Learn-Ing for QSAR Modelling. arXiv 2021, arXiv:2109.03309. [Google Scholar]
- Chollet, F. Keras Documentation. Keras.Io. 2015. Available online: https://keras.io/ (accessed on 18 October 2020).
- Bastien, F.; Lamblin, P.; Pascanu, R.; Bergstra, J.; Goodfellow, I.; Bergeron, A.; Bouchard, N.; Warde-Farley, D.; Bengio, Y. Theano: New Features and Speed Improvements. arXiv 2012, arXiv:1211.5590. [Google Scholar]
- Ammar, A.; Valérie, L.; Philippe, J.; Naomie, S.; Maude, P. Prediction of New Bioactive Molecules Using a Bayesian Belief Network. J. Chem. Inf. Model. 2014, 54, 30–36. [Google Scholar] [CrossRef]
- Witten, I.H.; Frank, E.; Hall, M.A.; Pal, C.J. Data Mining: Practical Machine Learning Tools and Techniques; Morgan Kaufmann: Burlington, MA, USA, 2016. [Google Scholar]
- John, G.H.; Langley, P. Estimating Continuous Distributions in Bayesian Classifiers. arXiv 2013, arXiv:1302.4964. [Google Scholar]
- Chih-Chung, C. LIBSVM: A Library for Support Vector Machines. ACM Trans. Intell. Syst. Technol. 2011, 2, 27. [Google Scholar]
- Bugmann, G. Normalized Gaussian Radial Basis Function Networks. Neurocomputing 1998, 20, 97–110. [Google Scholar] [CrossRef]
- Dolz, J.; Desrosiers, C.; Ayed, I. ben IVD-Net: Intervertebral Disc Localization and Segmentation in MRI with a Multi-Modal UNet. In Proceedings of the MICCAI 2018 IVD Challenge, Granada, Spain, 16 September 2018; pp. 1–7. [Google Scholar] [CrossRef]
- Williams, J.; Comanescu, R.; Radu, O.; Tian, L. DNN Multimodal Fusion Techniques for Predicting Video Sentiment. In Proceedings of the Grand Challenge and Workshop on Human Multimodal Language (Challenge-HML), Melbourne, Australia, 20 July 2018; pp. 64–72. [Google Scholar]
- Das, A.; Ghosh, S.; Sarkhel, R.; Choudhuri, S.; Das, N.; Nasipuri, M. Combining Multilevel Contexts of Superpixel Using Convolutional Neural Networks to Perform Natural Scene Labeling. Adv. Intell. Syst. Comput. 2019, 740, 297–306. [Google Scholar] [CrossRef]
- Lagos, C.F.; Segovia, G.F.; Nu ez-Navarro, N.; Faúndez, M.A.; Zacconi, F.C. Novel FXa Inhibitor Identification through Integration of Ligand- and Structure-Based Approaches. Molecules 2017, 22, 1588. [Google Scholar] [CrossRef]
- Hentabli, H.; Naomie, S.; Saeed, F. An activity prediction model using shape-based descriptor method. J. Teknol. 2016, 78, 1–8. [Google Scholar]
- Filimonov, D.; Poroikov, V.; Borodina, Y.; Gloriozova, T. Chemical Similarity Assessment through Multilevel Neighborhoods of Atoms: Definition and Comparison with the Other Descriptors. J. Chem. Inf. Comput. Sci. 1999, 39, 666–670. [Google Scholar] [CrossRef]
- Willett, P.; Wilton, D.; Hartzoulakis, B.; Tang, R.; Ford, J.; Madge, D. Prediction of Ion Channel Activity Using Binary Kernel Discrimination. J. Chem. Inf. Model. 2007, 47, 1961–1966. [Google Scholar] [CrossRef] [PubMed]
- Chen, B.; Mueller, C.; Willett, P. Evaluation of a Bayesian Inference Network for Ligand-Based Virtual Screening. J. Cheminform. 2009, 1, 5. [Google Scholar] [CrossRef]
- Xia, X.; Maliski, E.G.; Gallant, P.; Rogers, D. Classification of Kinase Inhibitors Using a Bayesian Model. J. Med. Chem. 2004, 47, 4463–4470. [Google Scholar] [CrossRef]
- Winkler, D.A.; Burden, F.R. Application of Neural Networks to Large Dataset QSAR, Virtual Screening, and Library Design. Methods Mol. Biol. 2002, 201, 325–367. [Google Scholar] [CrossRef] [PubMed]
- Kawai, K.; Fujishima, S.; Takahashi, Y. Predictive Activity Profiling of Drugs by Topological-Fragment-Spectra-Based Support Vector Machines. J. Chem. Inf. Model. 2008, 48, 1152–1160. [Google Scholar] [CrossRef]
- Berrhail, F.; Belhadef, H. Genetic Algorithm-Based Feature Selection Approach for Enhancing the Effectiveness of Similarity Searching in Ligand-Based Virtual Screening. Curr. Bioinform. 2019, 15, 431–444. [Google Scholar] [CrossRef]
- Ma, J.; Sheridan, R.P.; Liaw, A.; Dahl, G.E.; Svetnik, V. Deep Neural Nets as a Method for Quantitative Structure-Activity Relationships. J. Chem. Inf. Model. 2015, 55, 263–274. [Google Scholar] [CrossRef]
- Dahl, G.E.; Jaitly, N.; Salakhutdinov, R. Multi-Task Neural Networks for QSAR Predictions. arXiv 2014, arXiv:1406.1231. [Google Scholar]
- Unterthiner, T.; Mayr, A.; Klambauer, G.; Hochreiter, S. Toxicity Prediction Using Deep Learning. arXiv 2015, arXiv:1503.01445. [Google Scholar] [CrossRef]
- Unterthiner, T.; Mayr, A.; Klambauer, G.; Steijaert, M.; Wegner, J.K.; Ceulemans, H. Deep Learning as an Opportunity in Virtual Screening. In Proceedings of the Deep Learning and Representation Learning Workshop: NIPS, Montreal, QC, Cananda, 12 December 2014; pp. 1–9. [Google Scholar]
- Ramsundar, B.; Kearnes, S.; Riley, P.; Webster, D.; Konerding, D.; Pande, V. Massively Multitask Networks for Drug Discovery. arXiv 2015, arXiv:1502.02072. [Google Scholar]
- Wang, Y.; Xiao, J.; Suzek, T.O.; Zhang, J.; Wang, J.; Zhou, Z.; Han, L.; Karapetyan, K.; Dracheva, S.; Shoemaker, B.A.; et al. PubChem’s BioAssay Database. Nucleic Acids Res. 2011, 40, D400–D412. [Google Scholar] [CrossRef] [PubMed]
- Bento, A.P.; Gaulton, A.; Hersey, A.; Bellis, L.J.; Chambers, J.; Davies, M.; Krüger, F.A.; Light, Y.; Mak, L.; McGlinchey, S.; et al. The ChEMBL Bioactivity Database: An Update. Nucleic Acids Res. 2014, 42, D1083–D1090. [Google Scholar] [CrossRef] [PubMed]
- Rogers, D.; Hahn, M. Extended-Connectivity Fingerprints. J. Chem. Inf. Model. 2010, 50, 742–754. [Google Scholar] [CrossRef] [PubMed]
- Dana, D.; Gadhiya, S.V.; St Surin, L.G.; Li, D.; Naaz, F.; Ali, Q.; Paka, L.; Yamin, M.A.; Narayan, M.; Goldberg, I.D.; et al. Deep Learning in Drug Discovery and Medicine; Scratching the Surface. Molecules 2018, 23, 2384. [Google Scholar] [CrossRef]
- MLA, J.; Maggiora, G.M. Concepts and Application of Molecular Similarity. Wiley Interdiscip. Rev. Comput. Mol. Sci. 1990, 50, 376–377. [Google Scholar]
- Martin, Y.C.; Kofron, J.L.; Traphagen, L.M. Do Structurally Similar Molecules Have Similar Biological Activity? J. Med. Chem. 2002, 45, 4350–4358. [Google Scholar] [CrossRef]
- Sci Tegic Accelrys Inc. Available online: http://accelrys.com/products/collaborative-science/databases/bioactivity-databases/mddr.html (accessed on 15 January 2020).
- Sutherland, J.J.; O’Brien, L.A.; Weaver, D.F. Spline-Fitting with a Genetic Algorithm: A Method for Developing Classification Structure-Activity Relationships. J. Chem. Inf. Comput. Sci. 2003, 43, 1906–1915. [Google Scholar] [CrossRef]
- Hentabli, H.; Salim, N.; Abdo, A.; Saeed, F. LINGO-DOSM: LINGO for Descriptors of Outline. In Intelligent Information and Database Systems; Springer: Berlin/Heidelberg, Germany, 2013; pp. 315–324. [Google Scholar]
- Hentabli, H.; Salim, N.; Abdo, A.; Saeed, F. LWDOSM: Language for Writing Descriptors. In Advanced Machine Learning Technologies and Applications; Springer: Berlin/Heidelberg, Germany, 2012; pp. 247–256. [Google Scholar]
- Stevenson, J.M.; Mulready, P.D. Pipeline Pilot 2.1 By Scitegic, 9665 Chesapeake Drive, Suite 401, San Diego, CA 92123-1365. J. Am. Chem. Soc. 2003, 125, 1437–1438. [Google Scholar] [CrossRef]
- Simonyan, K.; Zisserman, A. Two-Stream Convolutional Networks for Action Recognition in Videos. Adv. Neural Inf. Process. Syst. 2014, 27, 568–576. [Google Scholar] [CrossRef]
- Karpathy, A.; Toderici, G.; Shetty, S.; Leung, T.; Sukthankar, R.; Fei-Fei, L. Large-Scale Video Classification with Convolutional Neural Networks. In Proceedings of the International Computer Vision and Pattern Recognition (CVPR 2014), Columbus, ON, USA, 23–28 June 2014. [Google Scholar] [CrossRef]
- Krizhevsky, A.; Sutskever, I.; Hinton, G.E. ImageNet Classification with Deep Convolutional Neural Networks. Commun. ACM 2017, 60, 84–90. [Google Scholar] [CrossRef]
- Gupta, V. Image Classification Using Convolutional Neural Networks in Keras. Available online: https://www.learnopencv.com/image-classification-using-convolutional-neural-networks-in-keras/ (accessed on 18 October 2020).
- Angermueller, C.; Pärnamaa, T.; Parts, L.; Stegle, O. Deep Learning for Computational Biology. Mol. Syst. Biol 2016, 12, 878. [Google Scholar] [CrossRef] [PubMed]
- Wang, H.; Raj, B. On the Origin of Deep Learning. ArXiv 2017, arXiv:1702.07800. [Google Scholar] [CrossRef]
- Su, H.; Maji, S.; Kalogerakis, E.; Learned-Miller, E. Multi-View Convolutional Neural Networks for 3D Shape Recognition. In Proceedings of the IEEE International Conference on Computer Vision, Santiago, Chile, 7–13 December 2015; Volume 1, pp. 945–953. [Google Scholar] [CrossRef]
- Cheng, Y.; Wang, F.; Zhang, P.; Hu, J. Risk Prediction with Electronic Health Records: A Deep Learning Approach. In Proceedings of the 2016 SIAM International Conference on Data Mining, Miami, FL, USA, 5–7 May 2016; pp. 432–440. [Google Scholar] [CrossRef]


| Labels | Combination | CDK | ECFP4 | EPFP4 | Graph | ECFC4 |
|---|---|---|---|---|---|---|
| A | 2 | √ | √ | |||
| B | 2 | √ | √ | |||
| C | 2 | √ | √ | |||
| D | 2 | √ | √ | |||
| E | 2 | √ | √ | |||
| F | 2 | √ | √ | |||
| G | 2 | √ | √ | |||
| H | 2 | √ | √ | |||
| I | 2 | √ | √ | |||
| J | 2 | √ | √ | |||
| K | 3 | √ | √ | √ | ||
| L | 3 | √ | √ | √ | ||
| M | 3 | √ | √ | √ | ||
| N | 3 | √ | √ | √ | ||
| O | 3 | √ | √ | √ | ||
| P | 3 | √ | √ | √ | ||
| Q | 3 | √ | √ | √ | ||
| R | 3 | √ | √ | √ | ||
| S | 3 | √ | √ | √ | ||
| T | 3 | √ | √ | √ | ||
| U | 4 | √ | √ | √ | √ | |
| V | 4 | √ | √ | √ | √ | |
| W | 4 | √ | √ | √ | √ | |
| X | 4 | √ | √ | √ | √ | |
| Y | 4 | √ | √ | √ | √ | |
| Z | 5 | √ | √ | √ | √ | √ |
| Activity Index | CNNfp | NaïveB | RBFN | LSVM | ||||||||
|---|---|---|---|---|---|---|---|---|---|---|---|---|
| Sens | Spec | AUC | Sens | Spec | AUC | Sens | Spec | AUC | Sens | Spec | AUC | |
| 7707 | 1.00 | 1.00 | 1.00 | 0.99 | 1.00 | 0.99 | 0.63 | 1.00 | 0.82 | 0.93 | 0.95 | 0.94 |
| 7708 | 1.00 | 1.00 | 1.00 | 0.97 | 1.00 | 0.99 | 0.51 | 1.00 | 0.75 | 0.96 | 0.96 | 0.96 |
| 31420 | 1.00 | 1.00 | 1.00 | 1.00 | 1.00 | 1.00 | 0.96 | 0.96 | 0.96 | 0.92 | 0.99 | 0.96 |
| 42710 | 0.99 | 0.99 | 0.99 | 0.94 | 1.00 | 0.97 | 0.43 | 1.00 | 0.72 | 0.95 | 0.99 | 0.97 |
| 64100 | 0.97 | 0.99 | 0.98 | 0.95 | 1.00 | 0.97 | 0.97 | 0.90 | 0.94 | 0.96 | 0.99 | 0.98 |
| 64200 | 0.96 | 0.99 | 0.98 | 0.87 | 0.95 | 0.91 | 0.43 | 1.00 | 0.71 | 0.94 | 1.00 | 0.97 |
| 64220 | 1.00 | 1.00 | 1.00 | 0.97 | 0.99 | 0.96 | 0.95 | 0.97 | 0.96 | 0.92 | 1.00 | 0.96 |
| 64500 | 1.00 | 1.00 | 1.00 | 0.91 | 0.93 | 0.92 | 0.44 | 1.00 | 0.72 | 0.84 | 0.95 | 0.90 |
| 64350 | 1.00 | 1.00 | 1.00 | 0.94 | 0.96 | 0.95 | 0.80 | 1.00 | 0.90 | 0.90 | 0.94 | 0.92 |
| 75755 | 1.00 | 1.00 | 1.00 | 0.94 | 0.98 | 0.96 | 0.76 | 1.00 | 0.88 | 0.94 | 0.97 | 0.96 |
| mean | 0.98 | 0.99 | 0.99 | 0.94 | 0.98 | 0.96 | 0.69 | 0.98 | 0.84 | 0.93 | 0.97 | 0.95 |
| Activity Index | CNNfp | NaïveB | RBFN | LSVM | ||||||||
|---|---|---|---|---|---|---|---|---|---|---|---|---|
| Sens | Spec | AUC | Sens | Spec | AUC | Sens | Spec | AUC | Sens | Spec | AUC | |
| 9249 | 1.00 | 1.00 | 1.00 | 0.91 | 0.99 | 0.95 | 0.82 | 0.98 | 0.90 | 0.95 | 0.97 | 0.96 |
| 12455 | 1.00 | 1.00 | 1.00 | 0.88 | 0.97 | 0.92 | 0.66 | 0.98 | 0.82 | 0.93 | 0.96 | 0.94 |
| 12464 | 1.00 | 1.00 | 1.00 | 0.85 | 0.99 | 0.92 | 0.75 | 0.95 | 0.85 | 0.89 | 0.97 | 0.93 |
| 31281 | 1.00 | 1.00 | 1.00 | 0.94 | 1.00 | 0.97 | 0.53 | 1.00 | 0.76 | 0.95 | 0.97 | 0.96 |
| 43210 | 0.99 | 0.99 | 0.99 | 0.84 | 0.99 | 0.91 | 0.78 | 0.97 | 0.87 | 0.93 | 0.96 | 0.94 |
| 71522 | 1.00 | 1.00 | 1.00 | 0.82 | 0.99 | 0.91 | 0.75 | 0.97 | 0.86 | 0.91 | 0.97 | 0.94 |
| 75721 | 1.00 | 1.00 | 1.00 | 0.91 | 0.99 | 0.95 | 0.86 | 0.98 | 0.92 | 0.96 | 0.97 | 0.96 |
| 78331 | 0.98 | 0.99 | 0.99 | 0.81 | 0.96 | 0.89 | 0.79 | 0.93 | 0.86 | 0.81 | 0.96 | 0.88 |
| 78348 | 0.99 | 0.99 | 0.99 | 0.65 | 0.99 | 0.82 | 0.74 | 0.96 | 0.85 | 0.88 | 0.97 | 0.92 |
| 78351 | 0.99 | 0.99 | 0.99 | 0.82 | 0.94 | 0.88 | 0.59 | 0.96 | 0.78 | 0.91 | 0.95 | 0.93 |
| mean | 0.99 | 0.99 | 0.99 | 0.84 | 0.98 | 0.91 | 0.73 | 0.97 | 0.85 | 0.91 | 0.97 | 0.94 |
| Activity Class | CNNfp | NaïveB | RBFN | LSVM | ||||||||
|---|---|---|---|---|---|---|---|---|---|---|---|---|
| Sens | Spec | AUC | Sens | Spec | AUC | Sens | Spec | AUC | Sens | Spec | AUC | |
| Estrogen receptor | 1.00 | 1.00 | 1.00 | 1.00 | 1.00 | 1.00 | 0.62 | 0.70 | 0.64 | 0.98 | 1.00 | 0.99 |
| Dihydrofolate reductase | 0.99 | 0.99 | 0.99 | 0.99 | 1.00 | 0.99 | 0.86 | 0.80 | 0.84 | 0.90 | 0.98 | 0.94 |
| Cyclooxygenase-2 inhibitors | 1.00 | 1.00 | 1.00 | 1.00 | 0.99 | 1.00 | 0.93 | 0.76 | 0.84 | 1.00 | 0.99 | 0.99 |
| Benzodiazepine receptor | 1.00 | 1.00 | 1.00 | 0.94 | 0.61 | 0.78 | 0.99 | 0.65 | 0.82 | 0.95 | 0.92 | 0.93 |
| mean | 0.99 | 0.99 | 0.99 | 0.98 | 0.90 | 0.94 | 0.85 | 0.73 | 0.79 | 0.95 | 0.97 | 0.96 |
| Activity Index | Activity Class | Active Molecules | Pairwise Similarity |
|---|---|---|---|
| 07707 | Adenosine agonists A1 | 207 | 0.229 |
| 07708 | Adenosine agonists A2 | 156 | 0.305 |
| 31420 | Rennin inhibitors | 1130 | 0.290 |
| 42710 | CCK agonists | 111 | 0.361 |
| 64100 | Monocyclic_-lactams | 1346 | 0.336 |
| 64200 | Cephalosporins | 113 | 0.322 |
| 64220 | Carbacephems | 1051 | 0.269 |
| 64500 | Carbapenems | 126 | 0.260 |
| 64350 | Tribactams | 388 | 0.305 |
| 75755 | Vitamin D analogues | 455 | 0.386 |
| Activity Index | Activity Class | Active Molecules | Pairwise Similarity |
|---|---|---|---|
| 09249 | Muscarinic (M1) agonists | 900 | 0.111 |
| 12455 | NMDAreceptor antagonists | 1400 | 0.098 |
| 12464 | Nitric oxide synthase inhibitor | 505 | 0.102 |
| 31281 | Dopamine hydroxylase inhibitors | 106 | 0.125 |
| 43210 | Aldose reductase inhibitors | 957 | 0.119 |
| 71522 | Reverse transcriptase inhibitors | 700 | 0.103 |
| 75721 | Aromatase inhibitors | 636 | 0.110 |
| 78331 | Cyclooxygenase inhibitors | 636 | 0.108 |
| 78348 | Phospholipase A2 inhibitors | 617 | 0.123 |
| 78351 | Lipoxygenase inhibitors | 2111 | 0.113 |
| Activity Class | Active Molecules | Pairwise Similarity |
|---|---|---|
| Estrogen receptor | 141 | 0.468 |
| Ddihydrofolate reductase | 393 | 0.502 |
| Cyclooxygenase-2 inhibitors | 303 | 0.687 |
| Benzodiazepine receptor | 306 | 0.536 |
| Fingerprint | Features Size | Mol2mat Size n × n | |
|---|---|---|---|
| ALOGP | 120 | 10.95 | 11 × 11 |
| CDK | 1024 | 32 | 32 × 32 |
| ECFC4 | 1024 | 32 | 32 × 32 |
| ECFP4 | 1024 | 32 | 32 × 32 |
| EPFP4 | 1024 | 32 | 32 × 32 |
| GOFP | 1024 | 32 | 32 × 32 |
| PCFP | 881 | 29.68 | 30 × 30 |
| MDL | 166 | 12.88 | 13 × 13 |
| Combined Case | Combined Layer Size | Number of Nodes in 1st Fully Connected Layer | Number of Nodes in 2nd Fully Connected Layer |
|---|---|---|---|
| 2 Fingerprints | 6272 | 128 | 64 |
| 3 Fingerprints | 9408 | 256 | 128 |
| 4 Fingerprints | 12,544 | 512 | 256 |
| 5 Fingerprints | 15,680 | 1024 | 512 |
Publisher’s Note: MDPI stays neutral with regard to jurisdictional claims in published maps and institutional affiliations. |
© 2022 by the authors. Licensee MDPI, Basel, Switzerland. This article is an open access article distributed under the terms and conditions of the Creative Commons Attribution (CC BY) license (https://creativecommons.org/licenses/by/4.0/).
Share and Cite
Hentabli, H.; Bengherbia, B.; Saeed, F.; Salim, N.; Nafea, I.; Toubal, A.; Nasser, M. Convolutional Neural Network Model Based on 2D Fingerprint for Bioactivity Prediction. Int. J. Mol. Sci. 2022, 23, 13230. https://doi.org/10.3390/ijms232113230
Hentabli H, Bengherbia B, Saeed F, Salim N, Nafea I, Toubal A, Nasser M. Convolutional Neural Network Model Based on 2D Fingerprint for Bioactivity Prediction. International Journal of Molecular Sciences. 2022; 23(21):13230. https://doi.org/10.3390/ijms232113230
Chicago/Turabian StyleHentabli, Hamza, Billel Bengherbia, Faisal Saeed, Naomie Salim, Ibtehal Nafea, Abdelmoughni Toubal, and Maged Nasser. 2022. "Convolutional Neural Network Model Based on 2D Fingerprint for Bioactivity Prediction" International Journal of Molecular Sciences 23, no. 21: 13230. https://doi.org/10.3390/ijms232113230
APA StyleHentabli, H., Bengherbia, B., Saeed, F., Salim, N., Nafea, I., Toubal, A., & Nasser, M. (2022). Convolutional Neural Network Model Based on 2D Fingerprint for Bioactivity Prediction. International Journal of Molecular Sciences, 23(21), 13230. https://doi.org/10.3390/ijms232113230