
Circulating Small EVs miRNAs as Predictors of Pathological Response to Neo-Adjuvant Therapy in Breast Cancer Patients

 , , ,
, , ,  ,
, 
 ,
,  ,
, 
Abstract
1. Introduction
2. Results
2.1. Patients and Tumor Characteristics
2.2. Selection of miRNAs of Interest
2.3. Investigation of microRNA Expression in Plasma sEVs
2.4. Investigation of microRNA Expression in Tissue Biopsies
2.5. Prediction Analysis of miRNA Expression in Relation with Pathological Response
2.6. Functional Analysis of miRNA Target Genes and Drug Interactions
3. Discussion
4. Materials and Methods
4.1. BC Patients and Samples Collection
4.2. Plasma Processing and RNA Extraction from sEVs
4.3. Biopsies Processing and RNA Extraction
4.4. miRNA Selection
4.5. miRNA Expression Evaluation
4.6. TCGA Data Analysis and Bioinformatics
4.7. Gene Set Enrichment and Drug Prediction Analysis
4.8. Statistical Analysis
5. Conclusions
Supplementary Materials
Author Contributions
Funding
Institutional Review Board Statement
Informed Consent Statement
Data Availability Statement
Conflicts of Interest
References
- Goldhirsch, A.; Winer, E.P.; Coates, A.S.; Gelber, R.D.; Piccart-Gebhart, M.; Thürlimann, B.; Senn, H.-J. Personalizing the treatment of women with early breast cancer: Highlights of the St Gallen International Expert Consensus on the Primary Therapy of Early Breast Cancer 2013. Ann. Oncol. 2013, 24, 2206–2223. [Google Scholar] [CrossRef]
- Godone, R.; Leitão, G.; Araújo, N.; Castelletti, C.; Lima-Filho, J.; Martins, D. Clinical and molecular aspects of breast cancer: Targets and therapies. Biomed. Pharmacother. 2018, 106, 14–34. [Google Scholar] [CrossRef]
- McDonald, E.S.; Clark, A.S.; Tchou, J.; Zhang, P.; Freedman, G.M. Clinical Diagnosis and Management of Breast Cancer. J. Nucl. Med. 2016, 57, 9S–16S. [Google Scholar] [CrossRef]
- Thompson, A.M.; Moulder-Thompson, S.L. Neoadjuvant treatment of breast cancer. Ann. Oncol. 2012, 23, x231–x236. [Google Scholar] [CrossRef]
- Sikov, W.; Boughey, J.; Al-Hilli, Z. UpToDate: General Principles of Neoadjuvant Management of Breast Cancer. UpToDate 2021, 1–21. [Google Scholar]
- Spring, L.M.; Fell, G.; Arfe, A.; Sharma, C.; Greenup, R.A.; Reynolds, K.L.; Smith, B.L.; Alexander, B.M.; Moy, B.; Isakoff, S.J.; et al. Pathologic Complete Response after Neoadjuvant Chemotherapy and Impact on Breast Cancer Recurrence and Survival: A Comprehensive Meta-analysis. Clin. Cancer Res. 2020, 26, 2838–2848. [Google Scholar] [CrossRef]
- Ogston, K.N.; Miller, I.D.; Payne, S.; Hutcheon, A.W.; Sarkar, T.K.; Smith, I.; Schofield, A.; Heys, S.D. A new histological grading system to assess response of breast cancers to primary chemotherapy: Prognostic significance and survival. Breast 2003, 12, 320–327. [Google Scholar] [CrossRef]
- Symmans, W.F.; Peintinger, F.; Hatzis, C.; Rajan, R.; Kuerer, H.; Valero, V.; Assad, L.; Poniecka, A.; Hennessy, B.; Green, M.; et al. Measurement of Residual Breast Cancer Burden to Predict Survival After Neoadjuvant Chemotherapy. J. Clin. Oncol. 2007, 25, 4414–4422. [Google Scholar] [CrossRef]
- Wang, W.; Liu, Y.; Zhang, H.; Zhang, S.; Duan, X.; Ye, J.; Xu, L.; Zhao, J.; Cheng, Y.; Liu, Q. Prognostic value of residual cancer burden and Miller-Payne system after neoadjuvant chemotherapy for breast cancer. Gland Surg. 2021, 10, 3211–3221. [Google Scholar] [CrossRef]
- Carvalho, T.M.; Brasil, G.O.; Jucoski, T.S.; Adamoski, D.; de Lima, R.S.; Spautz, C.C.; Anselmi, K.F.; Ozawa, P.M.M.; Cavalli, I.J.; de Oliveira, J.C.; et al. MicroRNAs miR-142-5p, miR-150-5p, miR-320a-3p, and miR-4433b-5p in Serum and Tissue: Potential Biomarkers in Sporadic Breast Cancer. Front. Genet. 2022, 13. [Google Scholar] [CrossRef]
- Ryan, B.M.; Robles, A.I.; Harris, C.C. Genetic variation in microRNA networks: The implications for cancer research. Nat. Rev. Cancer 2010, 10, 389–402. [Google Scholar] [CrossRef]
- Mehrgou, A.; Ebadollahi, S.; Seidi, K.; Ayoubi-Joshaghani, M.H.; Yazdi, A.A.; Zare, P.; Jaymand, M.; Jahanban-Esfahlan, R. Roles of miRNAs in Colorectal Cancer: Therapeutic Implications and Clinical Opportunities. Adv. Pharm. Bull. 2021, 11, 233–247. [Google Scholar] [CrossRef]
- Gaál, Z. Implication of microRNAs in Carcinogenesis with Emphasis on Hematological Malignancies and Clinical Translation. Int. J. Mol. Sci. 2022, 23, 5838. [Google Scholar] [CrossRef]
- Loh, H.-Y.; Norman, B.P.; Lai, K.-S.; Rahman, N.M.A.N.A.; Alitheen, N.B.M.; Osman, M.A. The Regulatory Role of MicroRNAs in Breast Cancer. Int. J. Mol. Sci. 2019, 20, 4940. [Google Scholar] [CrossRef]
- Kim, M.W.; Park, S.; Lee, H.; Gwak, H.; Hyun, K.; Kim, J.Y.; Jung, H.; Kim, S.I. Multi-miRNA panel of tumor-derived extracellular vesicles as promising diagnostic biomarkers of early-stage breast cancer. Cancer Sci. 2021, 112, 5078–5087. [Google Scholar] [CrossRef]
- Ichimura, A.; Ruike, Y.; Terasawa, K.; Tsujimoto, G. miRNAs and regulation of cell signaling. FEBS J. 2011, 278, 1610–1618. [Google Scholar] [CrossRef]
- Inui, M.; Martello, G.; Piccolo, S. MicroRNA control of signal transduction. Nat. Rev. Mol. Cell Biol. 2010, 11, 252–263. [Google Scholar] [CrossRef]
- Stavast, C.J.; van Zuijen, I.; Erkeland, S.J. MicroRNA-139, an Emerging Gate-Keeper in Various Types of Cancer. Cells 2022, 11, 769. [Google Scholar] [CrossRef]
- Gao, Y.; Qin, Y.; Wan, C.; Sun, Y.; Meng, J.; Huang, J.; Hu, Y.; Jin, H.; Yang, K. Small Extracellular Vesicles: A Novel Avenue for Cancer Management. Front. Oncol. 2021, 11. [Google Scholar] [CrossRef]
- Wang, H.-X.; Gires, O. Tumor-derived extracellular vesicles in breast cancer: From bench to bedside. Cancer Lett. 2019, 460, 54–64. [Google Scholar] [CrossRef]
- Cardinali, B.; Tasso, R.; Piccioli, P.; Ciferri, M.C.; Quarto, R.; Del Mastro, L. Circulating miRNAs in Breast Cancer Diagnosis and Prognosis. Cancers 2022, 14, 2317. [Google Scholar] [CrossRef] [PubMed]
- Yi, Y.; Wu, M.; Zeng, H.; Hu, W.; Zhao, C.; Xiong, M.; Lv, W.; Deng, P.; Zhang, Q.; Wu, Y. Tumor-Derived Exosomal Non-Coding RNAs: The Emerging Mechanisms and Potential Clinical Applications in Breast Cancer. Front. Oncol. 2021, 11, 4173. [Google Scholar] [CrossRef]
- Manier, S.; Liu, C.-J.; Avet-Loiseau, H.; Park, J.; Shi, J.; Campigotto, F.; Salem, K.Z.; Huynh, D.; Glavey, S.V.; Rivotto, B.; et al. Prognostic role of circulating exosomal miRNAs in multiple myeloma. Blood 2017, 129, 2429–2436. [Google Scholar] [CrossRef]
- Schwarzenbach, H. The clinical relevance of circulating, exosomal miRNAs as biomarkers for cancer. Expert Rev. Mol. Diagn. 2015, 15, 1159–1169. [Google Scholar] [CrossRef] [PubMed]
- Nagamitsu, Y.; Nishi, H.; Sasaki, T.; Takaesu, Y.; Terauchi, F.; Isaka, K. Profiling analysis of circulating microRNA expression in cervical cancer. Mol. Clin. Oncol. 2016, 5, 189–194. [Google Scholar] [CrossRef]
- García-Vazquez, R.; Ruiz-García, E.; García, A.M.; la Vega, H.A.-D.; Lara-Medina, F.; Alvarado-Miranda, A.; Maldonado-Martínez, H.; González-Barrios, J.A.; Campos-Parra, A.D.; Cuevas, S.R.; et al. A microRNA signature associated with pathological complete response to novel neoadjuvant therapy regimen in triple-negative breast cancer. Tumor Biol. 2017, 39, 47–68. [Google Scholar] [CrossRef]
- Sueta, A.; Fujiki, Y.; Goto-Yamaguchi, L.; Tomiguchi, M.; Yamamoto-Ibusuki, M.; Iwase, H.; Yamamoto, Y. Exosomal miRNA profiles of triple-negative breast cancer in neoadjuvant treatment. Oncol. Lett. 2021, 22, 1–10. [Google Scholar] [CrossRef]
- Kahraman, M.; Röske, A.; Laufer, T.; Fehlmann, T.; Backes, C.; Kern, F.; Kohlhaas, J.; Schrörs, H.; Saiz, A.; Zabler, C.; et al. MicroRNA in diagnosis and therapy monitoring of early-stage triple-negative breast cancer. Sci. Rep. 2018, 8, 11584. [Google Scholar] [CrossRef]
- Xing, A.-Y.; Wang, B.; Li, Y.H.; Chen, X.; Wang, Y.-W.; Liu, H.-T.; Gao, P. Identification of miRNA Signature in Breast Cancer to Predict Neoadjuvant Chemotherapy Response. Pathol. Oncol. Res. 2021, 27, 1609753. [Google Scholar] [CrossRef]
- Todorova, V.K.; Byrum, S.D.; Gies, A.J.; Haynie, C.; Smith, H.; Reyna, N.S.; Makhoul, I. Circulating Exosomal microRNAs as Predictive Biomarkers of Neoadjuvant Chemotherapy Response in Breast Cancer. Curr. Oncol. 2022, 29, 613–630. [Google Scholar] [CrossRef]
- Tryfonidis, K.; Senkus, E.; Cardoso, M.J.; Cardoso, F. Management of locally advanced breast cancer—Perspectives and future directions. Nat. Rev. Clin. Oncol. 2015, 12, 147–162. [Google Scholar] [CrossRef] [PubMed]
- Mandilaras, V.; Bouganim, N.; Spayne, J.; Dent, R.; Arnaout, A.; Boileau, J.; Brackstone, M.; Meterissian, S.; Clemons, M. Concurrent Chemoradiotherapy for Locally Advanced Breast Cancer—Time for a New Paradigm? Curr. Oncol. 2015, 22, 25–32. [Google Scholar] [CrossRef] [PubMed]
- Prat, A.; Ellis, M.J.; Perou, C.M. Practical implications of gene-expression-based assays for breast oncologists. Nat. Rev. Clin. Oncol. 2011, 9, 48–57. [Google Scholar] [CrossRef] [PubMed]
- Zeng, C.; Zhang, J. A Narrative Review of Five Multigenetic Assays in Breast Cancer. Transl. Cancer Res. 2022, 11, 897–907. [Google Scholar] [CrossRef] [PubMed]
- Dong, X.; Bai, X.; Ni, J.; Zhang, H.; Duan, W.; Graham, P.; Li, Y. Exosomes and breast cancer drug resistance. Cell Death Dis. 2020, 11, 987. [Google Scholar] [CrossRef]
- Dong, M.; Liu, Q.; Xu, Y.; Zhang, Q. Extracellular Vesicles: The Landscape in the Progression, Diagnosis, and Treatment of Triple-Negative Breast Cancer. Front. Cell Dev. Biol. 2022, 10, 1–14. [Google Scholar] [CrossRef]
- Sahoo, S.; Lester, S.C. Pathology of Breast Carcinomas after Neoadjuvant Chemotherapy: An Overview with Recommendations on Specimen Processing and Reporting. Arch. Pathol. Lab. Med. 2009, 133, 633–642. [Google Scholar] [CrossRef]
- Davey, M.G.; Davey, M.S.; Richard, V.; Wyns, W.; Soliman, O.; Miller, N.; Lowery, A.J.; Kerin, M.J. Overview of MicroRNA Expression in Predicting Response to Neoadjuvant Therapies in Human Epidermal Growth Receptor-2 Enriched Breast Cancer—A Systematic Review. Breast Cancer 2022, 16, 11782234221086684. [Google Scholar] [CrossRef]
- Shao, B.; Wang, X.; Zhang, L.; Li, D.; Liu, X.; Song, G.; Cao, H.; Zhu, J.; Li, H. Plasma MicroRNAs Predict Chemoresistance in Patients with Metastatic Breast Cancer. Technol. Cancer Res. Treat. 2019, 18, 1533033819828709. [Google Scholar] [CrossRef]
- Zhang, Z.; Zhang, H.; Li, C.; Xiang, Q.; Xu, L.; Liu, Q.; Pang, X.; Zhang, W.; Zhang, H.; Zhang, S.; et al. Circulating MicroRNAs as Indicators in the Prediction of Neoadjuvant Chemotherapy Response in Luminal B Breast Cancer. Thorac. Cancer 2021, 12, 3396–3406. [Google Scholar] [CrossRef]
- Schwarzenbach, H.; Da Silva, A.M.; Calin, G.; Pantel, K. Data Normalization Strategies for MicroRNA Quantification. Clin. Chem. 2015, 61, 1333–1342. [Google Scholar] [CrossRef] [PubMed]
- Squadrito, M.L.; Baer, C.; Burdet, F.; Maderna, C.; Gilfillan, G.D.; Lyle, R.; Ibberson, M.; De Palma, M. Endogenous RNAs Modulate MicroRNA Sorting to Exosomes and Transfer to Acceptor Cells. Cell Rep. 2014, 8, 1432–1446. [Google Scholar] [CrossRef] [PubMed]
- Teng, Y.; Ren, Y.; Hu, X.; Mu, J.; Samykutty, A.; Zhuang, X.; Deng, Z.; Kumar, A.; Zhang, L.; Merchant, M.L.; et al. MVP-Mediated Exosomal Sorting of MiR-193a Promotes Colon Cancer Progression. Nat. Commun. 2017, 8, 14448. [Google Scholar] [CrossRef] [PubMed]
- Campos, A.; Sharma, S.; Obermair, A.; Salomon, C. Extracellular Vesicle-Associated MiRNAs and Chemoresistance: A Systematic Review. Cancers 2021, 13, 4608. [Google Scholar] [CrossRef]
- Rodríguez-Martínez, A.; De Miguel-Pérez, D.; Ortega, F.G.; García-Puche, J.L.; Robles-Fernández, I.; Exposito, J.; Martorell-Marugan, J.; Carmona-Sáez, P.; Garrido-Navas, M.D.C.; Rolfo, C.; et al. Exosomal MiRNA Profile as Complementary Tool in the Diagnostic and Prediction of Treatment Response in Localized Breast Cancer under Neoadjuvant Chemotherapy. Breast Cancer Res. 2019, 21, 1–9. [Google Scholar] [CrossRef] [PubMed]
- Müller, V.; Gade, S.; Steinbach, B.; Loibl, S.; Von Minckwitz, G.; Untch, M.; Schwedler, K.; Lübbe, K.; Schem, C.; Fasching, P.A.; et al. Changes in Serum Levels of MiR-21, MiR-210, and MiR-373 in HER2-Positive Breast Cancer Patients Undergoing Neoadjuvant Therapy: A Translational Research Project within the Geparquinto Trial. Breast Cancer Res. Treat. 2014, 147, 61–68. [Google Scholar] [CrossRef] [PubMed]
- Liu, B.; Su, F.; Lv, X.; Zhang, W.; Shang, X.; Zhang, Y.; Zhang, J. Serum MicroRNA-21 Predicted Treatment Outcome and Survival in HER2-Positive Breast Cancer Patients Receiving Neoadjuvant Chemotherapy Combined with Trastuzumab. Cancer Chemother. Pharmacol. 2019, 84, 1039–1049. [Google Scholar] [CrossRef]
- Zhang, Z.; Zhang, H.; Yu, J.; Xu, L.; Pang, X.; Xiang, Q.; Liu, Q.; Cui, Y. MiRNAs as Therapeutic Predictors and Prognostic Biomarkers of Neoadjuvant Chemotherapy in Breast Cancer: A Systematic Review and Meta-Analysis. Breast Cancer Res. Treat. 2022, 194, 483–505. [Google Scholar] [CrossRef]
- de Mattos-Arruda, L.; Bottai, G.; Nuciforo, P.G.; di Tommaso, L.; Giovannetti, E.; Peg, V.; Losurdo, A.; Pérez-Garcia, J.; Masci, G.; Corsi, F.; et al. MicroRNA-21 Links Epithelial-to-Mesenchymal Transition and Inflammatory Signals to Confer Resistance to Neoadjuvant Trastuzumab and Chemotherapy in HER2-Positive Breast Cancer Patients. Oncotarget 2015, 6, 37269–37280. [Google Scholar] [CrossRef]
- McGuire, A.; Casey, M.C.; Waldron, R.M.; Heneghan, H.; Kalinina, O.; Holian, E.; McDermott, A.; Lowery, A.J.; Newell, J.; Dwyer, R.M.; et al. Prospective Assessment of Systemic MicroRNAs as Markers of Response to Neoadjuvant Chemotherapy in Breast Cancer. Cancers 2020, 12, 1820. [Google Scholar] [CrossRef]
- Sun, L.H.; Tian, D.; Yang, Z.C.; Li, J.L. Exosomal MiR-21 Promotes Proliferation, Invasion and Therapy Resistance of Colon Adenocarcinoma Cells through Its Target PDCD4. Sci. Rep. 2020, 10, 1–8. [Google Scholar] [CrossRef] [PubMed]
- Vandewalle, V.; Essaghir, A.; Bollaert, E.; Lenglez, S.; Graux, C.; Schoemans, H.; Saussoy, P.; Michaux, L.; Valk, P.J.M.; Demoulin, J.B.; et al. MiR-15a-5p and MiR-21-5p Contribute to Chemoresistance in Cytogenetically Normal Acute Myeloid Leukaemia by Targeting PDCD4, ARL2 and BTG2. J. Cell. Mol. Med. 2021, 25, 575–585. [Google Scholar] [CrossRef] [PubMed]
- Shi, G.H.; Ye, D.W.; Yao, X.D.; Zhang, S.L.; Dai, B.; Zhang, H.L.; Shen, Y.J.; Zhu, Y.; Zhu, Y.P.; Xiao, W.J.; et al. Involvement of MicroRNA-21 in Mediating Chemo-Resistance to Docetaxel in Androgen-Independent Prostate Cancer PC3 Cells. Acta Pharmacol. Sin. 2010, 31, 867–873. [Google Scholar] [CrossRef]
- Sharma, P.C.; Gupta, A. MicroRNAs: Potential Biomarkers for Diagnosis and Prognosis of Different Cancers. Transl. Cancer Res. 2020, 9, 5798–5818. [Google Scholar] [CrossRef] [PubMed]
- Di Martino, M.T.; Arbitrio, M.; Caracciolo, D.; Cordua, A.; Cuomo, O.; Grillone, K.; Riillo, C.; Caridà, G.; Scionti, F.; Labanca, C.; et al. MiR-221/222 as Biomarkers and Targets for Therapeutic Intervention on Cancer and Other Diseases: A Systematic Review. Mol. Ther. Nucleic Acids 2022, 27, 1191–1224. [Google Scholar] [CrossRef] [PubMed]
- Yan, L.X.; Huang, X.F.; Shao, Q.; Huang, M.Y.; Deng, L.; Wu, Q.L.; Zeng, Y.X.; Shao, J.Y. MicroRNA MiR-21 Overexpression in Human Breast Cancer Is Associated with Advanced Clinical Stage, Lymph Node Metastasis and Patient Poor Prognosis. RNA 2008, 14, 2348–2360. [Google Scholar] [CrossRef]
- Hanna, J.A.; Wimberly, H.; Kumar, S.; Slack, F.; Agarwal, S.; Rimm, D.L. Quantitative Analysis of MicroRNAs in Tissue Microarrays by in Situ Hybridization. Biotechniques 2012, 52, 235. [Google Scholar] [CrossRef]
- Yin, Y.; Wang, X.; Li, T.; Ren, Q.; Li, L.; Sun, X.; Zhang, B.; Wang, X.; Han, H.; He, Y.; et al. MicroRNA-221 Promotes Breast Cancer Resistance to Adriamycin via Modulation of PTEN/Akt/MTOR Signaling. Cancer Med. 2020, 9, 1544–1552. [Google Scholar] [CrossRef]
- Di Leva, G.; Gasparini, P.; Piovan, C.; Ngankeu, A.; Garofalo, M.; Taccioli, C.; Iorio, M.V.; Li, M.; Volinia, S.; Alder, H.; et al. MicroRNA Cluster 221-222 and Estrogen Receptor Alpha Interactions in Breast Cancer. J. Natl. Cancer Inst. 2010, 102, 706–721. [Google Scholar] [CrossRef]
- Gan, R.; Yang, Y.; Yang, X.; Zhao, L.; Lu, J.; Meng, Q.H. Downregulation of MiR-221/222 Enhances Sensitivity of Breast Cancer Cells to Tamoxifen through Upregulation of TIMP3. Cancer Gene Ther. 2014, 21, 290–296. [Google Scholar] [CrossRef]
- Yuwen, D.; Ma, Y.; Wang, D.; Gao, J.; Li, X.; Xue, W.; Fan, M.; Xu, Q.; Shen, Y.; Shu, Y. Prognostic Role of Circulating Exosomal MiR-425-3p for the Response of NSCLC to Platinum-Based Chemotherapy. Cancer Epidemiol. Biomarkers Prev. 2019, 28, 163–173. [Google Scholar] [CrossRef] [PubMed]
- Zhong, S.; Golpon, H.; Zardo, P.; Borlak, J. MiRNAs in Lung Cancer. A Systematic Review Identifies Predictive and Prognostic MiRNA Candidates for Precision Medicine in Lung Cancer. Transl. Res. 2021, 230, 164–196. [Google Scholar] [CrossRef] [PubMed]
- Habib, E.M.; Nosiar, N.A.; Eid, M.A.; Taha, A.M.; Sherief, D.E.; Hassan, A.E.; Abdel Ghafar, M.T. Circulating MiR-146a Expression Predicts Early Treatment Response to Imatinib in Adult Chronic Myeloid Leukemia. J. Investig. Med. 2021, 69, 333–337. [Google Scholar] [CrossRef] [PubMed]
- Kopcalic, K.; Petrovic, N.; Stanojkovic, T.P.; Stankovic, V.; Bukumiric, Z.; Roganovic, J.; Malisic, E.; Nikitovic, M. Association between MiR-21/146a/155 Level Changes and Acute Genitourinary Radiotoxicity in Prostate Cancer Patients: A Pilot Study. Pathol. Res. Pract. 2019, 215, 626–631. [Google Scholar] [CrossRef]
- Zhang, Y.; Zhao, J.; Ding, M.; Su, Y.; Cui, D.; Jiang, C.; Zhao, S.; Jia, G.; Wang, X.; Ruan, Y.; et al. Loss of Exosomal MiR-146a-5p from Cancer-Associated Fibroblasts after Androgen Deprivation Therapy Contributes to Prostate Cancer Metastasis. J. Exp. Clin. Cancer Res. 2020, 39, 1–19. [Google Scholar] [CrossRef]
- Li, X.; Xu, L.; Sheng, X.; Cai, J.; Liu, J.; Yin, T.; Xiao, F.; Chen, F.; Zhong, H. Upregulated MicroRNA-146a Expression Induced by Granulocyte Colony-Stimulating Factor Enhanced Low-Dosage Chemotherapy Response in Aged Acute Myeloid Leukemia Patients. Exp. Hematol. 2018, 68, 66–79. [Google Scholar] [CrossRef]
- Yuwen, D.L.; Sheng, B.B.; Liu, J.; Wenyu, W.; Shu, Y.Q. MiR-146a-5p Level in Serum Exosomes Predicts Therapeutic Effect of Cisplatin in Non-Small Cell Lung Cancer. Eur. Rev. Med. Pharmacol. Sci. 2017, 21, 2650–2658. [Google Scholar]
- Garcia, A.I.; Buisson, M.; Bertrand, P.; Rimokh, R.; Rouleau, E.; Lopez, B.S.; Lidereau, R.; Mikaélian, I.; Mazoyer, S. Down-Regulation of BRCA1 Expression by MiR-146a and MiR-146b-5p in Triple Negative Sporadic Breast Cancers. EMBO Mol. Med. 2011, 3, 279–290. [Google Scholar] [CrossRef]
- Mastroianni, J.; Stickel, N.; Andrlova, H.; Hanke, K.; Melchinger, W.; Duquesne, S.; Schmidt, D.; Falk, M.; Andrieux, G.; Pfeifer, D.; et al. MiR-146a Controls Immune Response in the Melanoma Microenvironment. Cancer Res. 2019, 79, 183–195. [Google Scholar] [CrossRef]
- Sun, X.; Zhang, J.; Hou, Z.; Han, Q.; Zhang, C.; Tian, Z. MiR-146a Is Directly Regulated by STAT3 in Human Hepatocellular Carcinoma Cells and Involved in Anti-Tumor Immune Suppression. Cell Cycle 2015, 14, 243–252. [Google Scholar] [CrossRef]
- Rizzo, S.; Cangemi, A.; Galvano, A.; Fanale, D.; Buscemi, S.; Ciaccio, M.; Russo, A.; Castorina, S.; Bazan, V. Analysis of MiRNA Expression Profile Induced by Short Term Starvation in Breast Cancer Cells Treated with Doxorubicin. Oncotarget 2017, 8, 71924. [Google Scholar] [CrossRef] [PubMed]
- Tan, S.; Ding, K.; Li, R.; Zhang, W.; Li, G.; Kong, X.; Qian, P.; Lobie, P.E.; Zhu, T. Identification of MiR-26 as a Key Mediator of Estrogen Stimulated Cell Proliferation by Targeting CHD1, GREB1 and KPNA2. Breast Cancer Res. 2014, 16, R40. [Google Scholar] [CrossRef] [PubMed]
- Maillot, G.; Lacroix-Triki, M.; Pierredon, S.; Gratadou, L.; Schmidt, S.; Bénès, V.; Roché, H.; Dalenc, F.; Auboeuf, D.; Millevoi, S.; et al. Widespread Estrogen-Dependent Repression of Micrornas Involved in Breast Tumor Cell Growth. Cancer Res. 2009, 69, 8332–8340. [Google Scholar] [CrossRef] [PubMed]
- Ichikawa, T.; Sato, F.; Terasawa, K.; Tsuchiya, S.; Toi, M.; Tsujimoto, G.; Shimizu, K. Trastuzumab Produces Therapeutic Actions by Upregulating MiR-26a and MiR-30b in Breast Cancer Cells. PLoS ONE 2012, 7, e31422. [Google Scholar] [CrossRef]
- Tormo, E.; Adam-Artigues, A.; Ballester, S.; Pineda, B.; Zazo, S.; González-Alonso, P.; Albanell, J.; Rovira, A.; Rojo, F.; Lluch, A.; et al. The Role of MiR-26a and MiR-30b in HER2+ Breast Cancer Trastuzumab Resistance and Regulation of the CCNE2 Gene. Sci. Rep. 2017, 7, srep41309. [Google Scholar] [CrossRef]
- Enderle, D.; Spiel, A.; Coticchia, C.M.; Berghoff, E.; Mueller, R.; Schlumpberger, M.; Sprenger-Haussels, M.; Shaffer, J.M.; Lader, E.; Skog, J.; et al. Characterization of RNA from Exosomes and Other Extracellular Vesicles Isolated by a Novel Spin Column-Based Method. PLoS ONE 2015, 10, e0136133. [Google Scholar] [CrossRef]


| Variable | Plasma Study | Tissue Study |
|---|---|---|
| n = 72 | n = 53 | |
| Age | ||
| Median (range) | 61.5 (35–76) | 61 (29–76) |
| Grading biopsy | ||
| G1 | 9 (12.5%) | 6 (11.3%) |
| G2 | 39 (54.2%) | 26 (49.1%) |
| G3 | 24 (33.3%) | 21 (39.6%) |
| Estrogen Receptor | ||
| ER- | 20 (27.8%) | 14 (26.4%) |
| ER+ | 52 (72.2%) | 39 (73.6%) |
| Progesteron receptor | ||
| PR- | 32 (44.4%) | 24 (45.3%) |
| PR+ | 40 (55.6%) | 29 (54.7%) |
| HER2 | ||
| HER2- | 64 (88.9%) | 47 (88.7%) |
| HER2+ | 8 (11.1%) | 5 (9.4%) |
| NA | - | 1 (1.9%) |
| KI67 | ||
| ≤20 | 31 (43.1%) | 20 (37.7%) |
| >20 | 41 (56.9%) | 33(62.3%) |
| Molecular Subtype | ||
| Luminal A | 23 (31.9%) | 15 (28.3%) |
| Luminal B | 26 (36.2%) | 22 (41.5%) |
| LuminalB_HER2+ | 3 (4.2%) | 1 (1.9%) |
| HER2+ | 5 (6.9%) | 4 (7.5%) |
| TNBC | 15 (20.8%) | 10 (18.9%) |
| NA | - | 1 (1.9%) |
| Tumor size (c) | ||
| cT1 | 4 (5.6%) | 2 (3.8%) |
| cT2 | 36 (50%) | 25 (47.2%) |
| cT3 | 11 (15.3%) | 9 (17.0%) |
| cT4 | 16 (22.2%) | 13 (24.5%) |
| NA | 5 (6.9%) | 4 (7.5%) |
| Lymph nodes (c) | ||
| cN0 | 17 (23.6%) | 9 (17.0%) |
| cN1 | 22 (30.6%) | 16 (30.2%) |
| cN2 | 26 (36.1%) | 23 (43.4%) |
| cN3 | 2 (2.8%) | 1 (1.9%) |
| NA | 5 (6.9%) | 4 (7.5%) |
| Metastasis (c) | ||
| cM0 | 62 (86.1%) | 45 (84.9%) |
| cM1 | 2 (2.8%) | 1 (1.9%) |
| NA | 8 (11.1%) | 7 (13.2%) |
| Clinical stage | ||
| S-I | 3 (4.2%) | 2 (3.8%) |
| S-II | 23 (31.9%) | 15 (28.3%) |
| S-III | 36 (50.0%) | 29 (54.7%) |
| S-IV | 2 (2.8%) | 1 (1.9%) |
| NA | 8 (11.1%) | 6 (11.3%) |
| Tumor size (p) | ||
| pT0 | 11 (15.3%) | 7 (13.2%) |
| pT1 | 22 (30.5%) | 21 (39.6%) |
| pT2 | 28 (38.9%) | 19 (35.8%) |
| pT3 | 2 (2.8%) | 2 (3.8%) |
| NA | 9 (12.5%) | 4 (7.6%) |
| Lymph nodes (p) | ||
| pN0 | 29 (40.3%) | 25 (47.1%) |
| pN1 | 20 (27.8%) | 14 (26.4%) |
| pN2 | 12 (16.7%) | 8 (15.1%) |
| pN3 | 4 (5.6%) | 3 (5.7%) |
| NA | 7 (9.6%) | 3 (5.7%) |
| Metastasis (p) | ||
| pM0 | 1 (1.4%) | 0 |
| pMx | 58 (80.5%) | 44 (83%) |
| NA | 13 (18.1%) | 9 (17%) |
| Lymphatic Invasion | ||
| L0 | 40 (55.6%) | 30 (56.6%) |
| L1 | 24 (33.3%) | 20 (37.7%) |
| NA | 8 (11.1%) | 3 (5.7%) |
| n = 62 | n = 53 | |
| Neodjuvant therapy | ||
| Only CT | 46 (74.2%) | 41 (77.4%) |
| Only HT | 10 (16.1%) | 9 (17%) |
| CT + HT | 5 (8.1%) | 3 (5.6%) |
| CT + HT + RTE | 1 (1.6%) | - |
| MP System | ||
| Grade 1 | 19 (30.6%) | 18 (34%) |
| Grade 2 | 7 (11.3%) | 6 (11.3%) |
| Grade 3 | 17 (27.4%) | 16 (30.2%) |
| Grade 4 | 6 (9.7%) | 4 (7.5%) |
| Grade 5 | 13 (21.0%) | 9 (17%) |
| RCB | ||
| RCB 0 | 10 (16.1%) | 8 (15.1%) |
| RCB-I | 5 (8.1%) | 5 (9.4%) |
| RCB-II | 31 (50.0%) | 25 (47.2%) |
| RCB-III | 16 (25.8%) | 15 (28.3%) |
| miRNA | Amplification in Plasma sEVs | GSE25066 | Pharmaco-miR | NCI-60 |
|---|---|---|---|---|
| hsa-miR-125b-5p | high | predicted | paclitaxel | doxorubicin |
| hsa-miR-146a-5p | doxorubicin | doxorubicin | ||
| hsa-miR-17-5p | ||||
| hsa-miR-185-5p | ||||
| hsa-miR-193b-3p | ||||
| hsa-miR-21-5p | docetaxel, paclitaxel doxorubicin | |||
| hsa-miR-221-3p | ||||
| hsa-miR-24-3p | doxorubicin | |||
| hsa-miR-26a-5p | ||||
| hsa-miR-484 | ||||
| hsa-miR-92a-3p | taxol | |||
| hsa-miR-143-3p | docetaxel | |||
| hsa-let7c-5p | low | predicted | ||
| hsa-miR-130b-3p | taxol | taxol | ||
| hsa-miR-140-3p and 5p | ||||
| hsa-miR-18a-5p | ||||
| hsa-miR-192-5p | taxol | |||
| hsa-miR-328-3p | taxol | |||
| hsa-miR-195-5p | ||||
| hsa-let-7e-5p | taxol | |||
| hsa-miR-31-5p | doxorubicin | |||
| hsa-miR-197-3p | negative | predicted | ||
| hsa-miR-200b-5p | ||||
| hsa-miR-203a-3p and 5p | paclitaxel | doxorubicin | ||
| hsa-miR-215-5p | ||||
| hsa-miR-34a-5p | docetaxel, paclitaxel | |||
| hsa-miR-373-3p | ||||
| hsa-miR-520h | ||||
| hsa-let-7a-3p | doxorubicin, paclitaxel | taxol | ||
| hsa-miR-375-3p | doxorubicin | |||
| hsa-miR-589-5p |
| miR-21-5p | miR-125-5p | miR-221-3p | miR-143-3p | miR-146a-5p | miR-24-3p | miR-193b-3p | miR-92a-3p | miR-484 | miR-185-5p | miR-17-5p | miR-26a-5p | |
|---|---|---|---|---|---|---|---|---|---|---|---|---|
| p-Value | p-Value | p-Value | p-Value | p-Value | p-Value | p-Value | p-Value | p-Value | p-Value | p-Value | p-Value | |
| Age | 0.592 | 0.722 | 0.329 | 0.982 | 0.773 | 0.341 | 0.904 | 0.404 | 0.817 | 0.110 | 0.393 | 0.811 |
| R = 0.06 | R = 0.04 | R = 0.12 | R = −0.003 | R = −0.03 | R = −0.11 | R = 0.02 | R = −0.10 | R = −0.03 | R = −0.19 | R = −0.10 | R = −0.03 | |
| Grading Biopsy | 0.193 | 0.138 | 0.385 | 0.215 | 0.287 | 0.320 | 0.529 | 0.253 | 0.690 | 0.418 | 0.639 | 0.846 |
| G3 vs. G2 vs. G1 | ||||||||||||
| Estrogen receptor | 0.820 | 0.415 | 0.387 | 0.802 | 0.145 | 0.222 | 0.722 | 0.149 | 0.238 | 0.015 * | 0.933 | 0.933 |
| ER+ vs. ER− | FR = −1.21 | |||||||||||
| Progesteron receptor | 0.939 | 0.155 | 0.378 | 0.596 | 0.059 | 0.064 | 0.935 | 0.105 | 0.228 | 0.039 * | 0.614 | 0.828 |
| PR+ vs. PR− | FR = −1.02 | |||||||||||
| HER2 | 0.156 | 0.060 | 0.887 | 0.316 | 0.057 | 0.044 * | 0.782 | 0.199 | 0.268 | 0.035 * | 0.728 | 0.286 |
| HER2+ vs. HER2− | FR = 1.54 | FR = 2.11 | ||||||||||
| KI67 | 0.686 | 0.801 | 0.735 | 0.608 | 0.320 | 0.449 | 0.204 | 0.469 | 0.758 | 0.378 | 0.823 | 0.917 |
| >20 vs. ≤20 | ||||||||||||
| Molecular Subtype | 0.998 | 0.736 | 0.641 | 0.934 | 0.338 | 0.519 | 0.964 | 0.109 | 0.435 | 0.028 * | 0.795 | 0.938 |
| TNBC vs. | FR TNBC vs. LumB = 1.56 ** | |||||||||||
| LuminalB vs. LuminalA | ||||||||||||
| cT | 0.104 | 0.799 | 0.426 | 0.399 | 0.208 | 0.652 | 0.456 | 0.986 | 0.608 | 0.149 | 0.530 | 0.503 |
| T4 vs. T3 vs. T1 + T2 | ||||||||||||
| cN | 0.060 | 0.718 | 0.285 | 0.009 ** | 0.025 * | 0.027 * | 0.025 * | 0.001 ** | 0.005 ** | 0.0006 *** | 0.054 | 0.030 * |
| Positive (N1 + N2 + N3) vs. Negative (N0) | FR = −1.47 | FR = −1.47 | FR = −1.64 | FR = −1.69 | FR = −2.13 | FR = −2.34 | FR = −2.19 | FR = −2.01 | ||||
| Clinical Stage | 0.329 | 0.747 | 0.715 | 0.360 | 0.499 | 0.233 | 0.193 | 0.622 | 0.540 | 0.351 | 0.037 * | 0.794 |
| High (S3 + S4) vs. Low (S1 + S2) | FR = −1.93 | |||||||||||
| pT | 0.341 | 0.752 | 0.209 | 0.755 | 0.634 | 0.746 | 0.127 | 0.891 | 0.845 | 0.448 | 0.915 | 0.673 |
| T2 vs. T1 vs. T0 | ||||||||||||
| pN | 0.286 | 0.682 | 0.024 * | 0.614 | 0.999 | 0.499 | 0.537 | 0.551 | 0.407 | 0.615 | 0.329 | 0.183 |
| Positive (N1 + N2 + N3) vs. Negative (N0) | FR = 1.69 * | |||||||||||
| Lymphatic Invasion | 0.637 | 0.850 | 0.789 | 0.843 | 0.515 | 0.586 | 0.909 | 0.590 | 0.103 | 0.166 | 0.253 | 0.915 |
| L1 vs. L0 | ||||||||||||
| MP | 0.0004 *** FR G5 vs. G1 = −2.32 ** FR G3 vs. G1 = −3.54 **** FR G2 vs. G1 = −3.31 ** | 0.161 | 0.008 ** FR G5 vs. G1 = −1.33 * FR G3 vs. G1 = −1.87 *** | 0.174 | 0.017 * FR G4 vs. G3 = 2.27 * FR G3 vs. G1 = −3.79 ** | 0.703 | 0.175 | 0.120 | 0.528 | 0.178 | 0.994 | 0.045 * FR G3 vs. G1 = −2.32 ** FR G2 vs. G1 = −1.88 * |
| G5 vs. G4 vs. G3 vs. G2 vs. G1 | ||||||||||||
| RCB | 0.303 | 0.596 | 0.794 | 0.686 | 0.761 | 0.442 | 0.423 | 0.497 | 0.672 | 0.097 | 0.477 | 0.860 |
| III vs. II vs.0 + I |
| miR-21-5p | miR-221-3p | miR-146a-5p | miR-26a-5p | |
|---|---|---|---|---|
| p-Value | p-Value | p-Value | p-Value | |
| Age | 0.817 | 0.183 | 0.276 | 0.086 |
| R = −0.03 | R = 0.19 | R = −0.15 | R = 0.24 | |
| Grading Biopsy | 0.045 * | 0.435 | 0.052 | 0.679 |
| G3 vs. G2 vs. G1 | FR G3 vs. G2 = 1.39 * | |||
| FR G2 vs. G1 = −1.58 * | ||||
| Estrogen receptor | 0.344 | 0.304 | 0.0003 *** | 0.573 |
| ER+ vs. ER− | FR = −3.11 | |||
| Progesteron receptor | 0.629 | 0.265 | 0.042 * | 0.454 |
| PR+ vs. PR− | FR = −2.02 | |||
| HER2 | 0.428 | 0.034 * | 0.061 | 0.034 * |
| HER2+ vs. HER2− | FR = 1.60 | FR = 1.50 | ||
| KI67 | 0.946 | 0.982 | 0.314 | 0.158 |
| >20 vs. ≤20 | ||||
| Molecular Subtype | 0.395 | 0.641 | 0.019 * | 0.042 * |
| TNBC vs. | FR TNBC vs. LumB = 3.81 ** | FR TN vs. LumA = −1.87 * | ||
| LuminalB vs. LuminalA | ||||
| cT | 0.191 | 0.907 | 0.123 | 0.875 |
| T4 vs. T3 vs. T1 + T2 | ||||
| cN | 0.065 | 0.377 | 0.382 | 0.767 |
| Positive (N1 + N2 + N3) vs. Negative (N0) | ||||
| Clinical Stage | 0.129 | 0.883 | 0.089 | 0.730 |
| High (S3 + S4) vs. Low (S1 + S2) | ||||
| pT | 0.648 | 0.151 | 0.074 | 0.561 |
| T2 vs. T1 vs. T0 | ||||
| pN | 0.655 | 0.444 | 0.318 | 0.100 |
| Positive (N1 + N2 + N3) vs. Negative (N0) | ||||
| Lymphatic Invasion | 0.586 | 0.864 | 0.735 | 0.139 |
| L1 vs. L0 | ||||
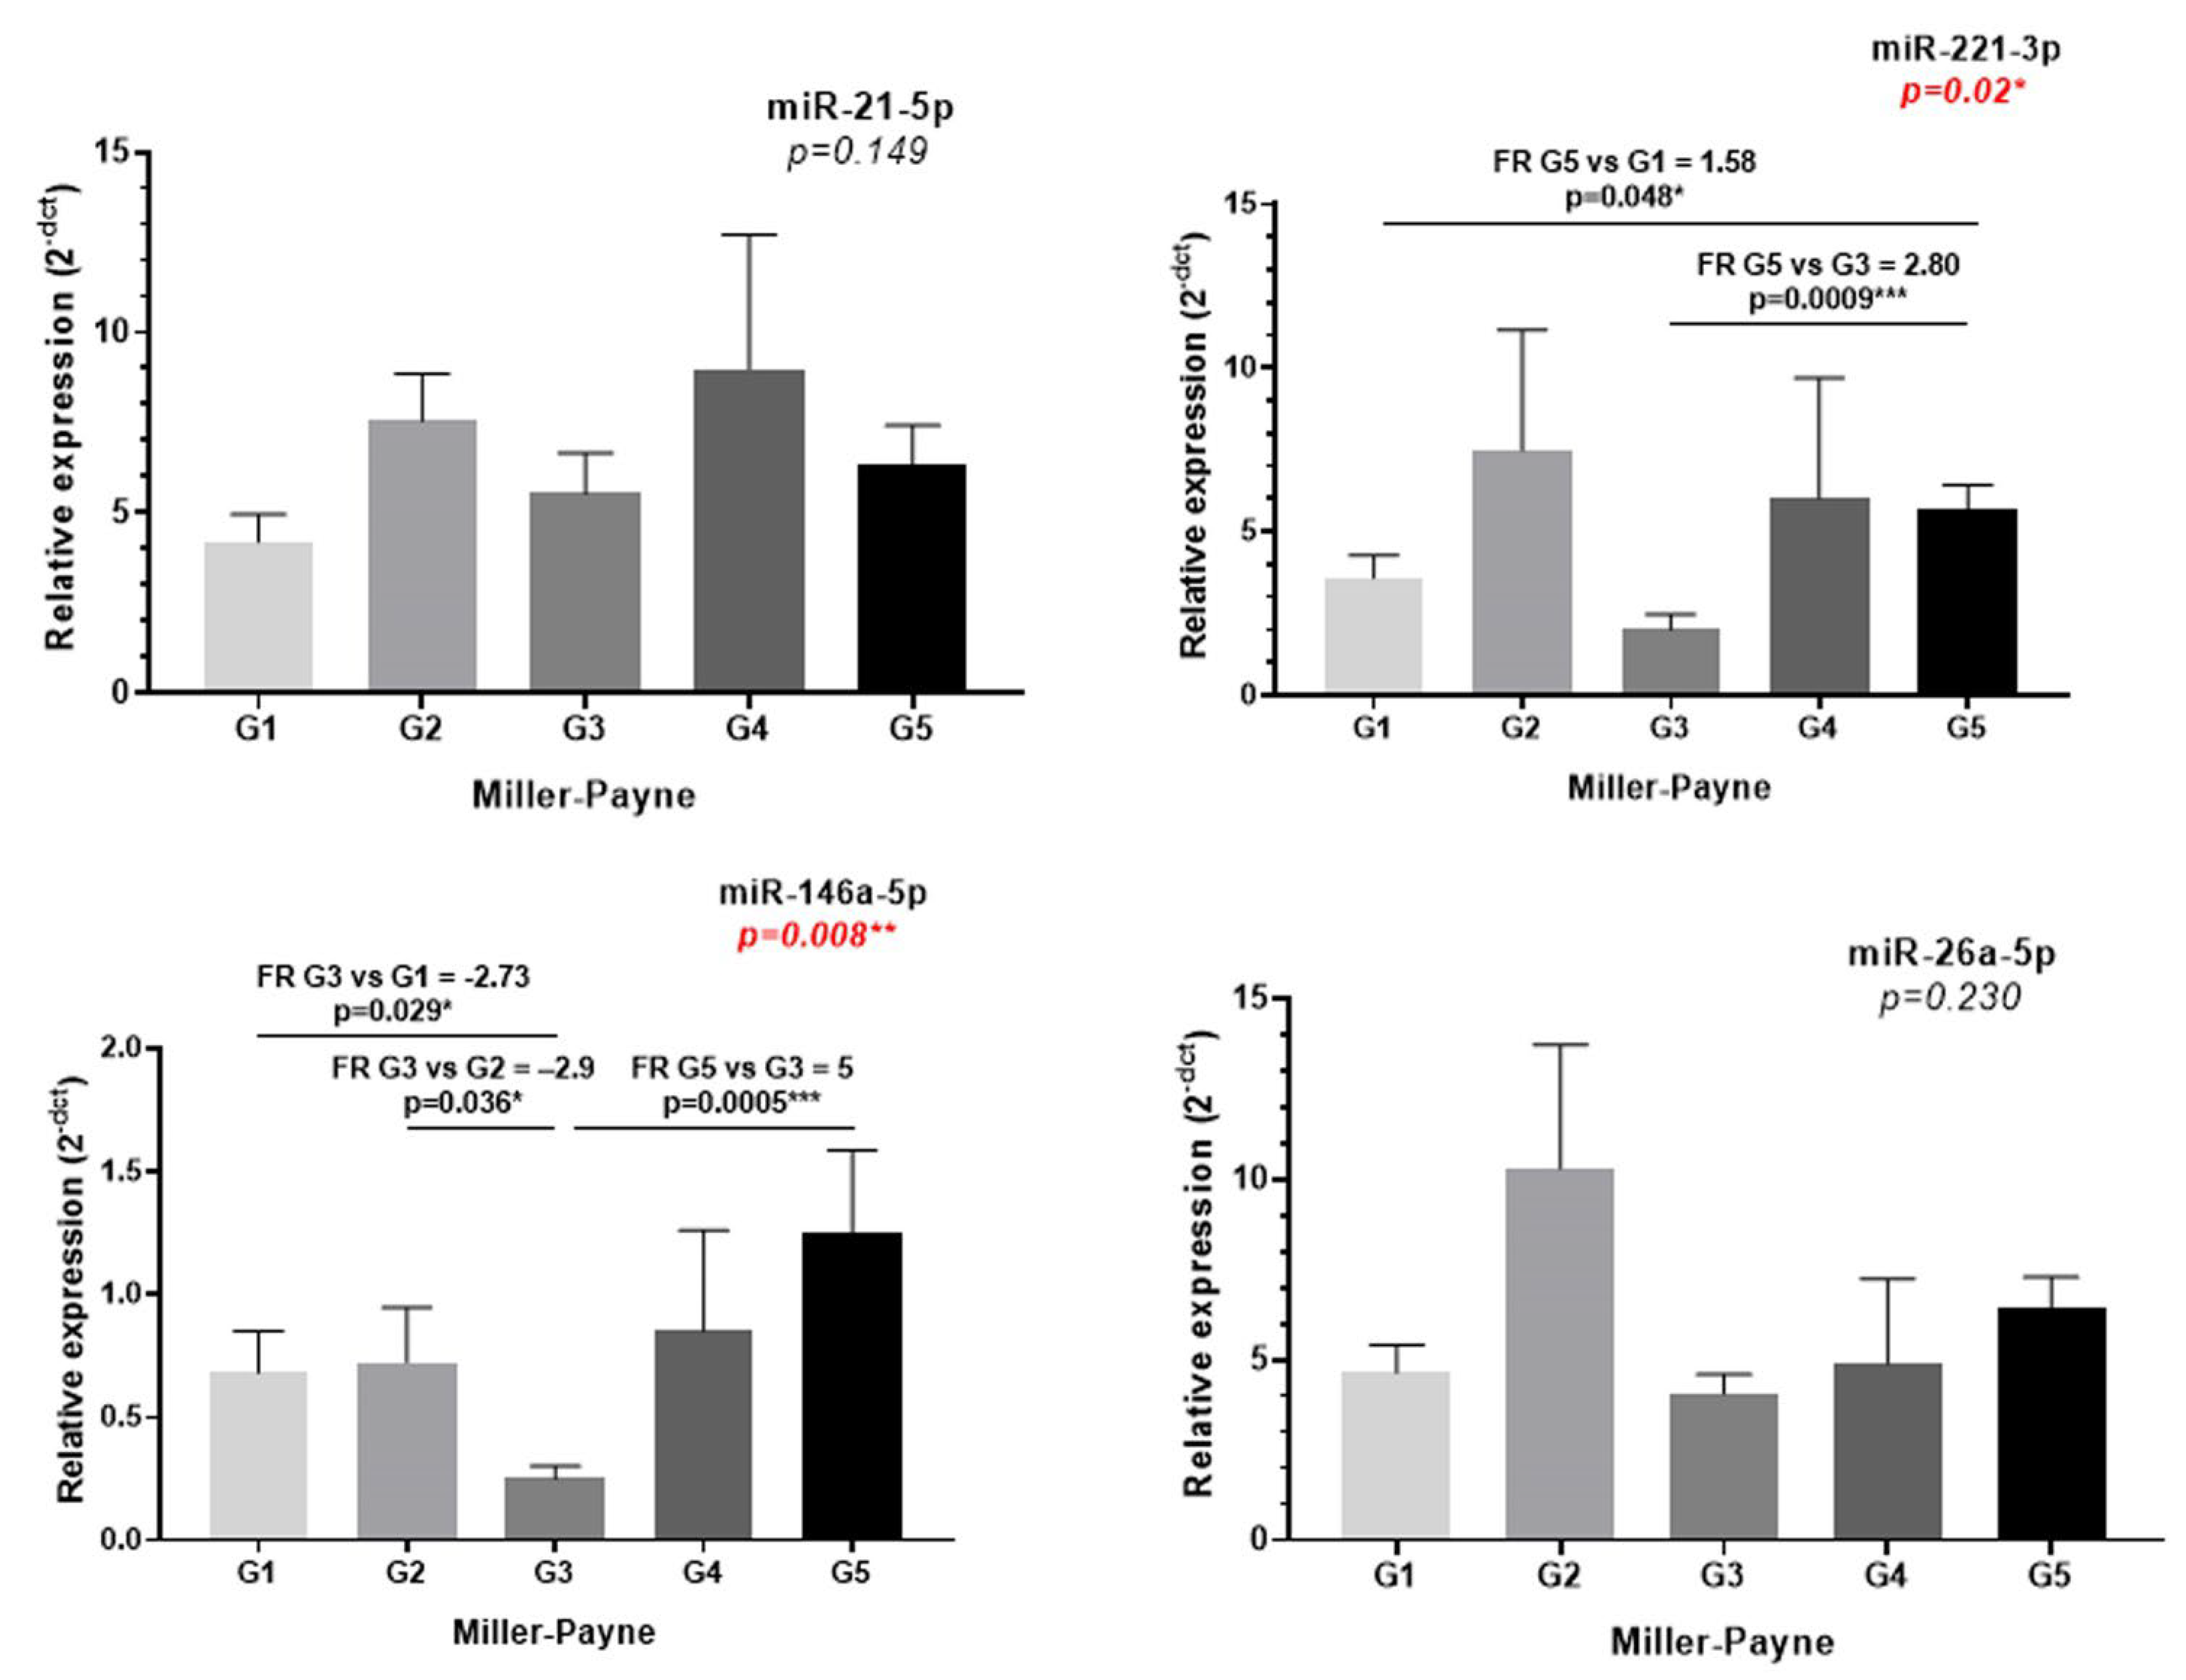
| MP G5 vs. G4 vs. G3 vs. G2 vs. G1 | 0.149 | 0.020 * | 0.008 ** | 0.230 |
| FR G5 vs. G3 = 2.80 *** | FR G5 vs. G3 = 5.00 *** | |||
| FR G5 vs. G1 = 1.58 * | FR G3 vs. G2 = −2.90 * | |||
| FR G3 vs. G1 = −2.73 * | ||||
| RCB | 0.176 | 0.197 | 0.180 | 0.938 |
| III vs. II vs.0 + I | ||||
| Correlations between miRNAs expression in tumor tissue and sEVs | ||||
| 0.781 | 0.421 | 0.543 | 0.953 | |
| R = 0.04 | R = 0.13 | R = 0.09 | R = −0.01 | |
| Name | Genes | Adj p-Value * |
|---|---|---|
| miR-21-5p | ||
| GO:0004674 Protein serine/threonine kinase activity | GSK3B; MAPK6 | 0 |
| GO:0004842 Ubiquitin-protein transferase activity | TOPORS; TRIM33; RMND5A | 0.0046 |
| miR-221-3p | ||
| R-HSA-9609507 Protein localization | PEX1; CROT; PEX19 | 0.013 |
| R-HSA-74160 Gene expression (Transcription) | ESR1; TFAP2A; SIRT1; MDM2; APAF1; DICER1; BCL2L11; ZKSCAN8; ZNF571; WDR61; ZFP30; ARID1A; CSTF2T | 0.0136 |
| R-HSA-73857 RNA Polymerase II Transcription | ESR1; TFAP2A; SIRT1; MDM2; APAF1; BCL2L11; ZKSCAN8; ZNF571; WDR61; ZFP30; ARID1A; CSTF2T | 0.0139 |
| R-HSA-212436 Generic Transcription Pathway | ESR1; TFAP2A; SIRT1; MDM2; APAF1; BCL2L11; ZKSCAN8; ZNF571; ZFP30; ARID1A | 0.0179 |
| R-HSA-5663202 Diseases of signal transduction by growth factor receptors and second messengers | ESR1; ERBB4; MDM2; BCL2L11; AP3B1; BRAP | 0.0335 |
| GO:0006625 Protein targeting to peroxisome | PEX1; CROT; PEX19 | 0 |
| GO:0031648 Protein destabilization | SIRT1; MDM2; MYLIP | 0 |
| GO:0006511 Ubiquitin-dependent protein catabolic process | MDM2; MYLIP; RNF20; NDFIP1 | 0.003 |
| GO:0016567 Protein ubiquitination | SIRT1; MDM2; WDR61; BRAP; MYLIP; RNF20 | 0.0058 |
| GO:0007399 Nervous system development | ERBB4; APAF1; EVL; ARID1A; MYLIP | 0.0101 |
| GO:0043065 Positive regulation of apoptotic process | SIRT1; APAF1; BCL2L11 | 0.0167 |
| GO:0045893 Positive regulation of_transcription,_DNA-templated | ESR1; TFAP2A; ERBB4; ARID1A; RNF20 | 0.019 |
| GO:0008285 Negative regulation of cell_population_proliferation | TFAP2A; ERBB4; EIF2AK1; DDAH1; BECN1 | 0.0196 |
| GO:0045892 Negative regulation of transcription, DNA-templated | TFAP2A; PHF12; SIRT1; MDM2 | 0.0231 |
| GO:0005777 Peroxisome | PEX1; CROT; PEX19 | 0 |
| GO:0005778 Peroxisomal membrane | PEX1; PEX19; ACSL3 | 0 |
| GO:0032991 Protein-containing complex | ESR1; ACVR2B; MDM2; APAF1; PEX19; RBM39; SNX4 | 0.0006 |
| GO:0004842 Ubiquitin-protein transferase activity | MDM2; HECTD2; BRAP; MYLIP; RNF20 | 0.0002 |
| GO:0061630 Ubiquitin protein ligase activity | MDM2; BRAP; MYLIP; HECTD1 | 0.0002 |
| GO:0003677 DNA binding | HMGXB4; TFAP2A; POGZ; DICER1; GLYR1; ARID1A; CERS2; PALB2 | 0.0032 |
| miR-146a-5p | ||
| GO:0043235 Receptor complex | ERBB4; LRP2 | 0 |
| miR-26a | ||
| R-HSA-162582_Signal Transduction | GSK3B; KPNA2; MAPK6 | 0.05 |
| GO:0098978 Glutamatergic synapse | GSK3B; KPNA2; HSPA8 | 0 |
| GO:0004674 Protein serine/threonine kinase activity | GSK3B; MAPK6 | 0 |
| miRNA | Target Gene | Targeting Drug |
|---|---|---|
| hsa-miR-21-5p | AP1 | topotecan |
| BCL2; PTEN; RECK | gemcitabine | |
| CDC25A | 3,3′-diindolylmethane | |
| ICAM1; SERPINB5 | tretinoin | |
| LRRFIP1 | teniposide | |
| MSH2; PDCD2; PTEN; SPRY2 | 5-fluorouracil | |
| PDCD4 | arsenic trioxide, cytarabine, cisplatin, docetaxel, doxorubicin, paclitaxel, | |
| PTEN | curcumin, daunorubicin, doxorubicin, transtuzumab, | |
| SPRY2 | metformin | |
| hsa-miR-221-3p | ABCB1 | trail |
| CDKN1A | glucocorticoids | |
| CDKN1B; ESR1 | tamoxifen | |
| CDKN4 | gemcitabine | |
| hsa-miR-146a-5p | CFH | pyrollidine dithiocarbamate, resveratrol |
| ERBB4 | doxorubicin |
Publisher’s Note: MDPI stays neutral with regard to jurisdictional claims in published maps and institutional affiliations. |
© 2022 by the authors. Licensee MDPI, Basel, Switzerland. This article is an open access article distributed under the terms and conditions of the Creative Commons Attribution (CC BY) license (https://creativecommons.org/licenses/by/4.0/).
Share and Cite
Baldasici, O.; Balacescu, L.; Cruceriu, D.; Roman, A.; Lisencu, C.; Fetica, B.; Visan, S.; Cismaru, A.; Jurj, A.; Barbu-Tudoran, L.; et al. Circulating Small EVs miRNAs as Predictors of Pathological Response to Neo-Adjuvant Therapy in Breast Cancer Patients. Int. J. Mol. Sci. 2022, 23, 12625. https://doi.org/10.3390/ijms232012625
Baldasici O, Balacescu L, Cruceriu D, Roman A, Lisencu C, Fetica B, Visan S, Cismaru A, Jurj A, Barbu-Tudoran L, et al. Circulating Small EVs miRNAs as Predictors of Pathological Response to Neo-Adjuvant Therapy in Breast Cancer Patients. International Journal of Molecular Sciences. 2022; 23(20):12625. https://doi.org/10.3390/ijms232012625
Chicago/Turabian StyleBaldasici, Oana, Loredana Balacescu, Daniel Cruceriu, Andrei Roman, Carmen Lisencu, Bogdan Fetica, Simona Visan, Andrei Cismaru, Ancuta Jurj, Lucian Barbu-Tudoran, and et al. 2022. "Circulating Small EVs miRNAs as Predictors of Pathological Response to Neo-Adjuvant Therapy in Breast Cancer Patients" International Journal of Molecular Sciences 23, no. 20: 12625. https://doi.org/10.3390/ijms232012625
APA StyleBaldasici, O., Balacescu, L., Cruceriu, D., Roman, A., Lisencu, C., Fetica, B., Visan, S., Cismaru, A., Jurj, A., Barbu-Tudoran, L., Pileczki, V., Vlase, L., Tudoran, O., & Balacescu, O. (2022). Circulating Small EVs miRNAs as Predictors of Pathological Response to Neo-Adjuvant Therapy in Breast Cancer Patients. International Journal of Molecular Sciences, 23(20), 12625. https://doi.org/10.3390/ijms232012625