
mTOR Contributes to the Proteome Diversity through Transcriptome-Wide Alternative Splicing

 , , and
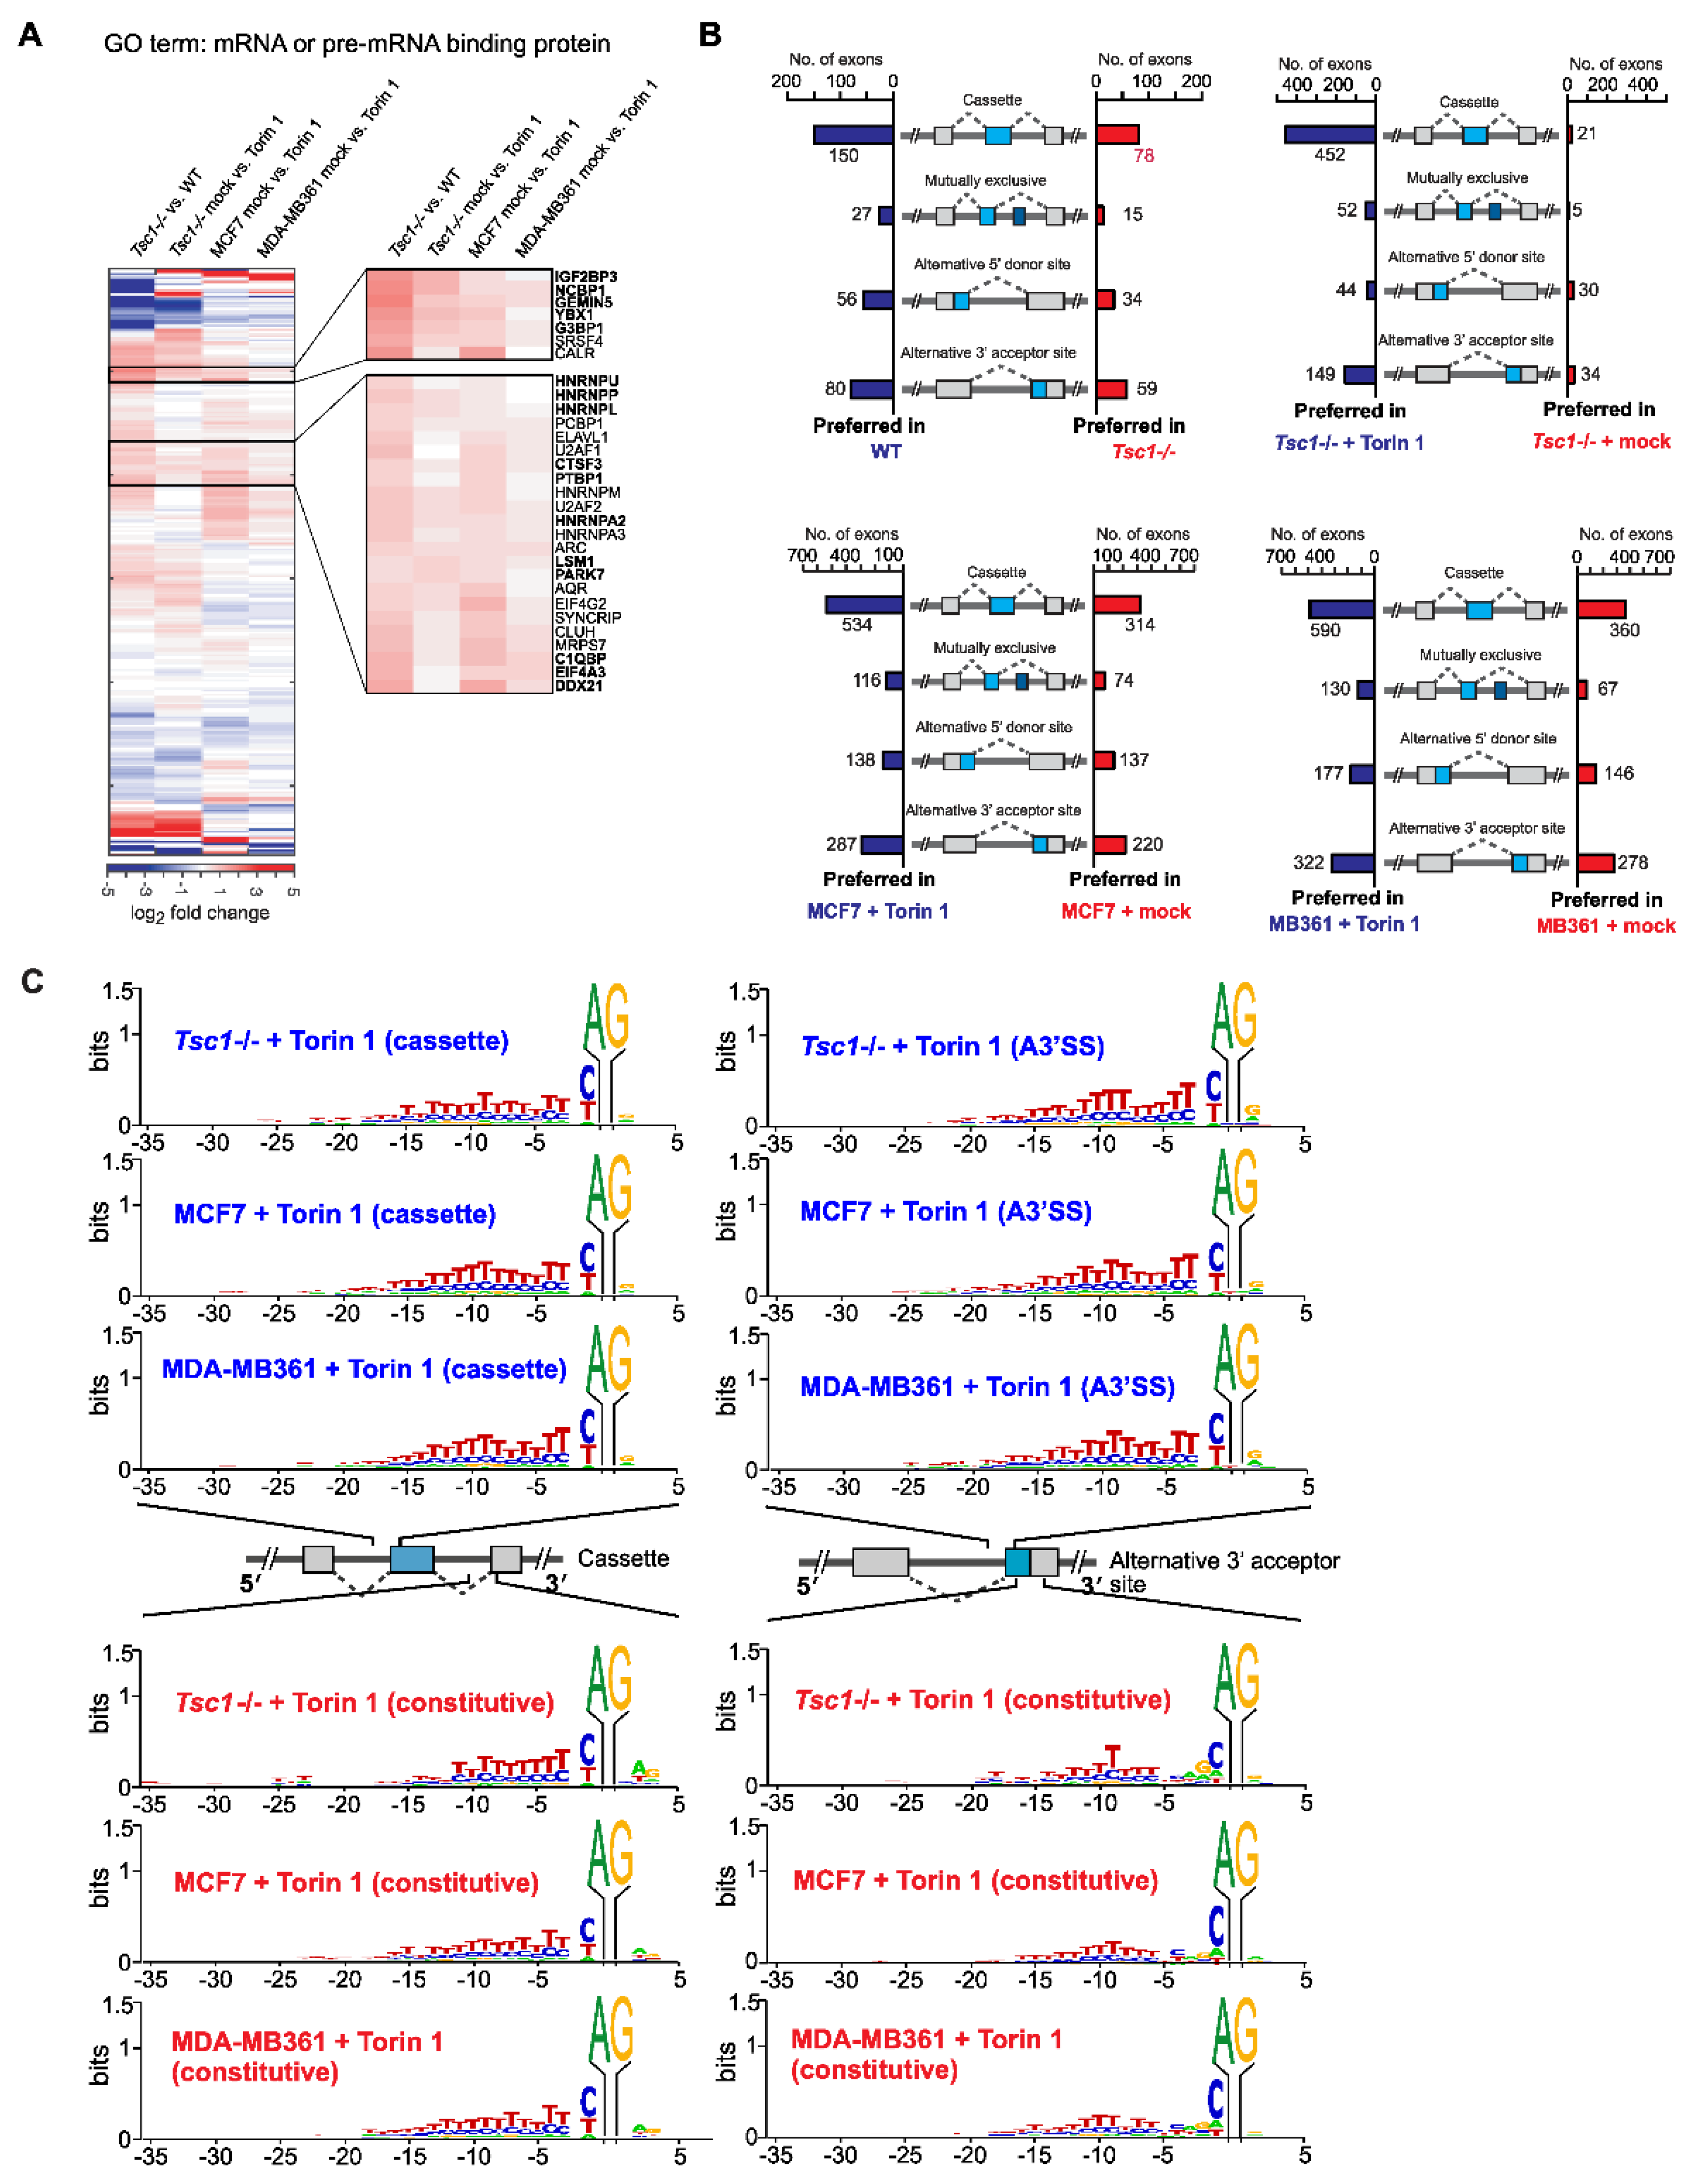
Abstract
1. Introduction
2. Results
2.1. mTOR Activation Leads to Exon Skipping
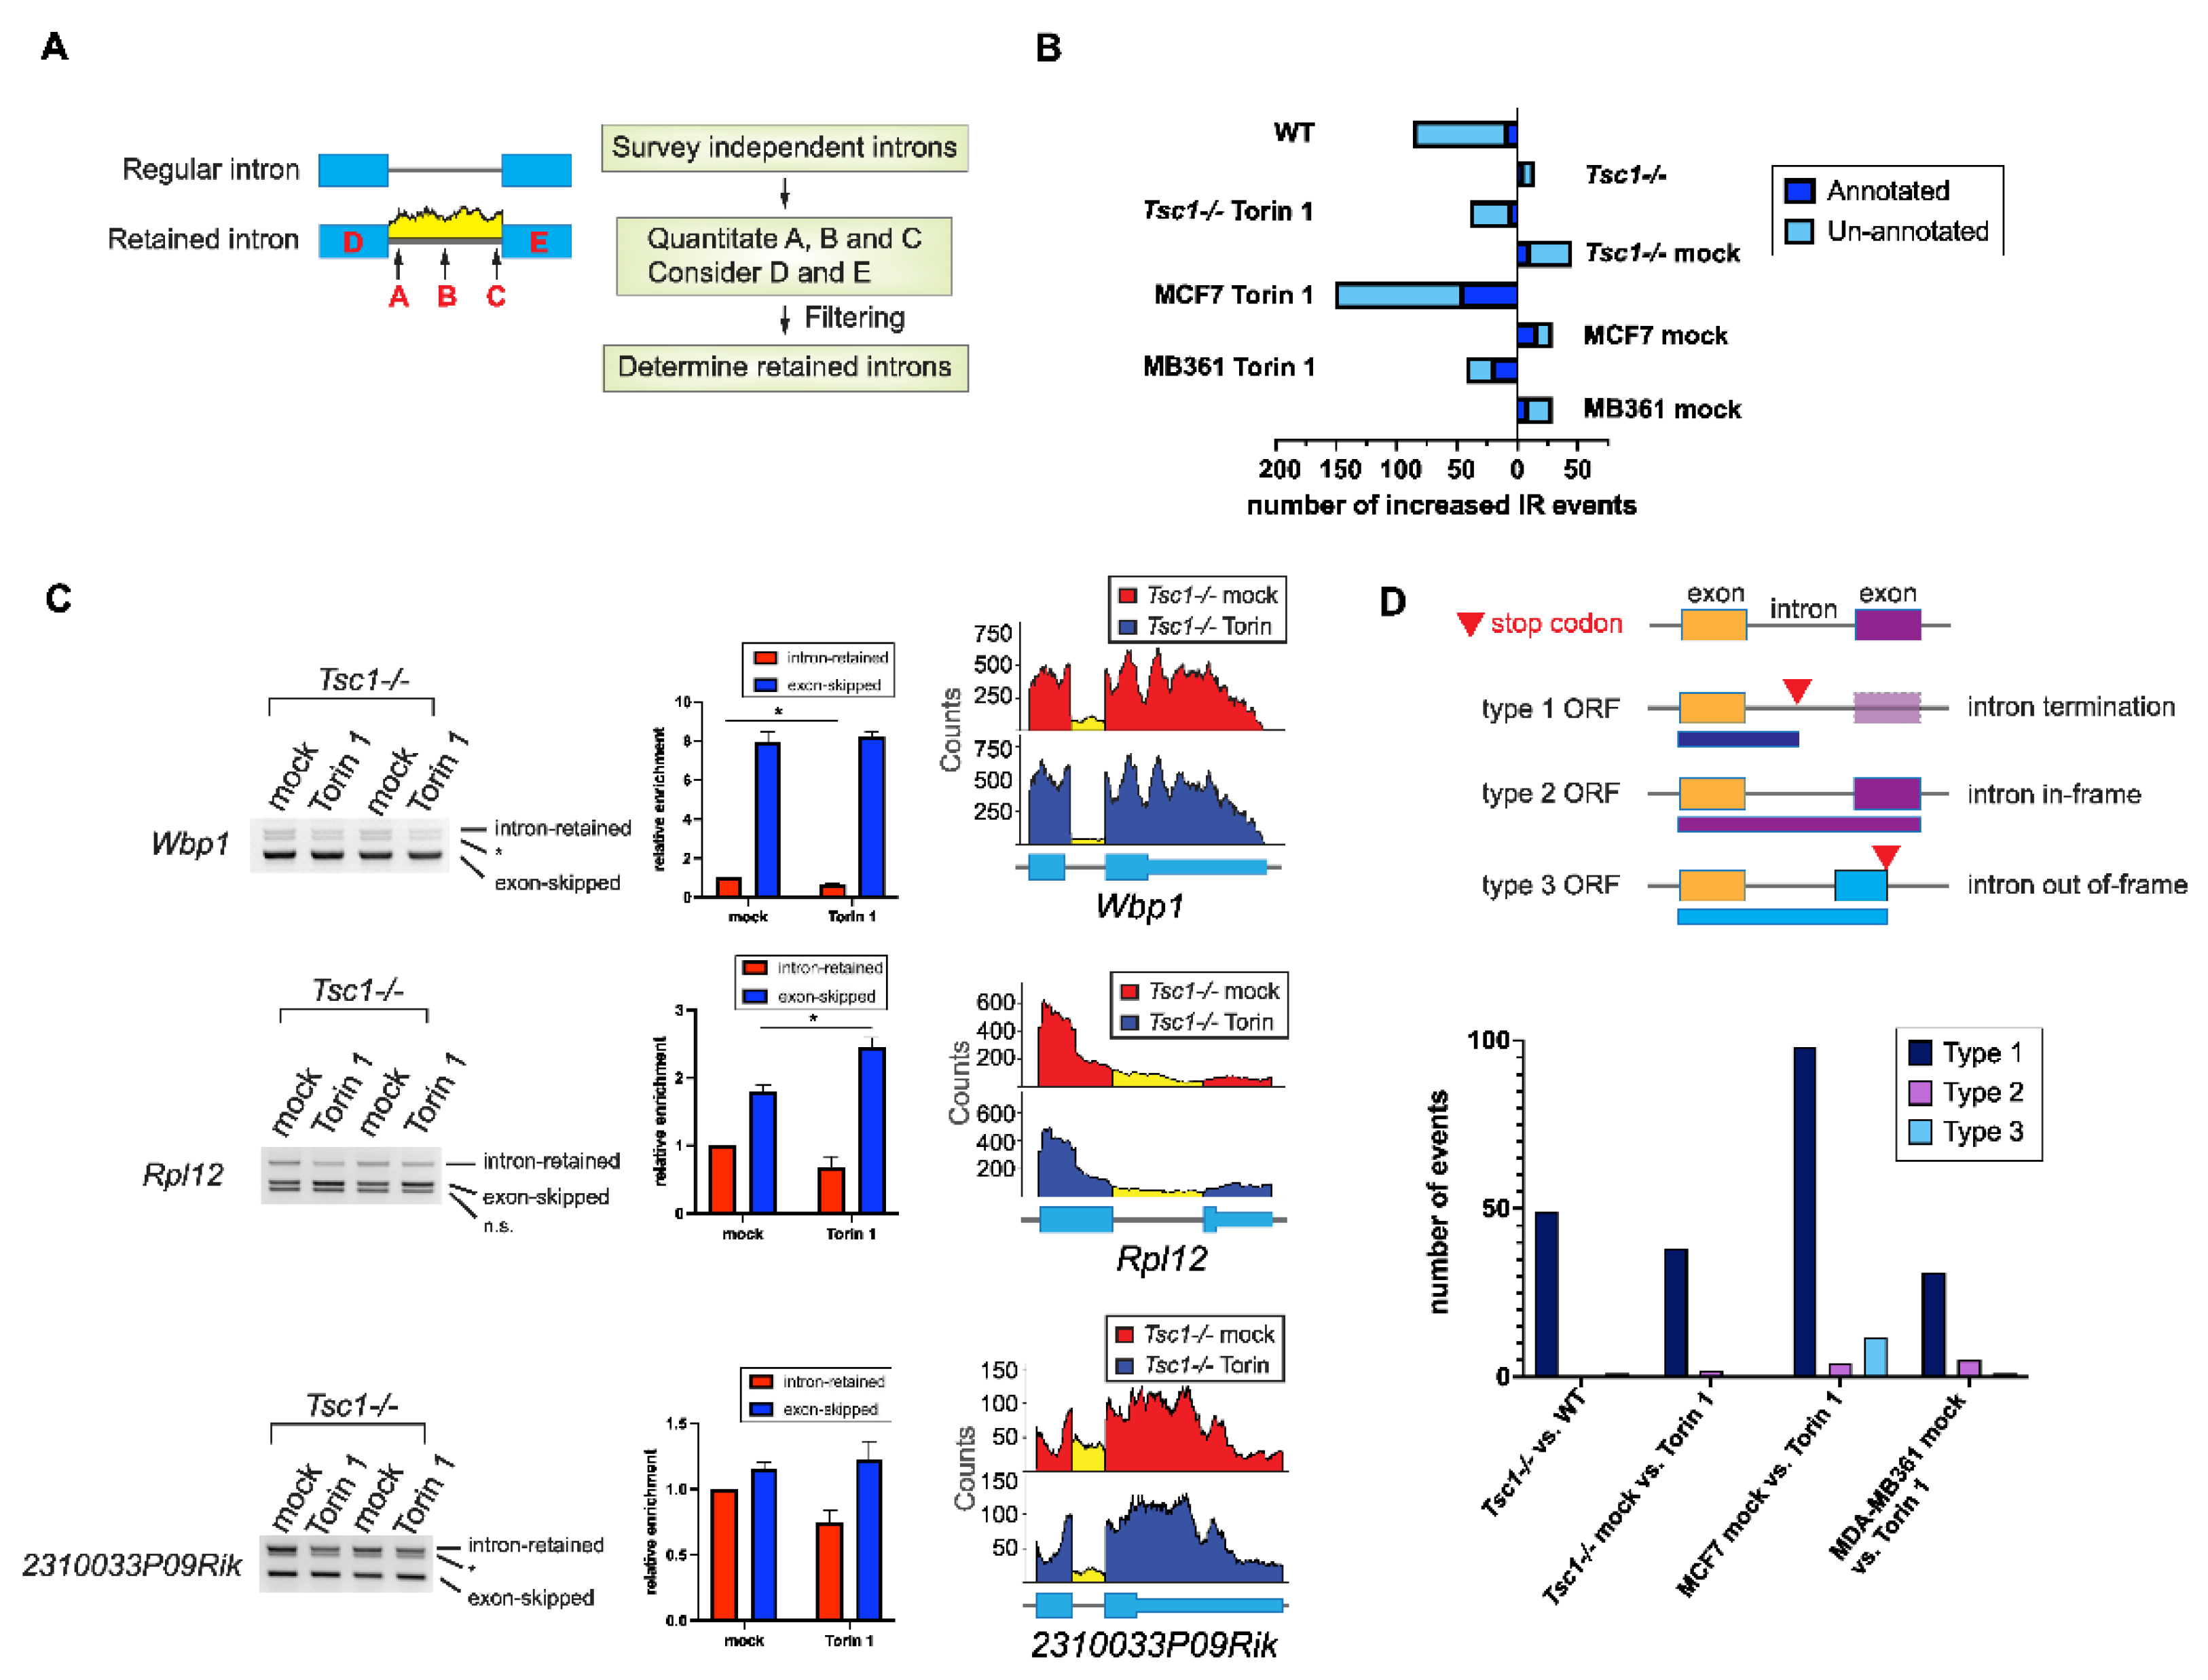
2.2. Increased Intron Retention of Ribosomal Genes by mTOR Activation
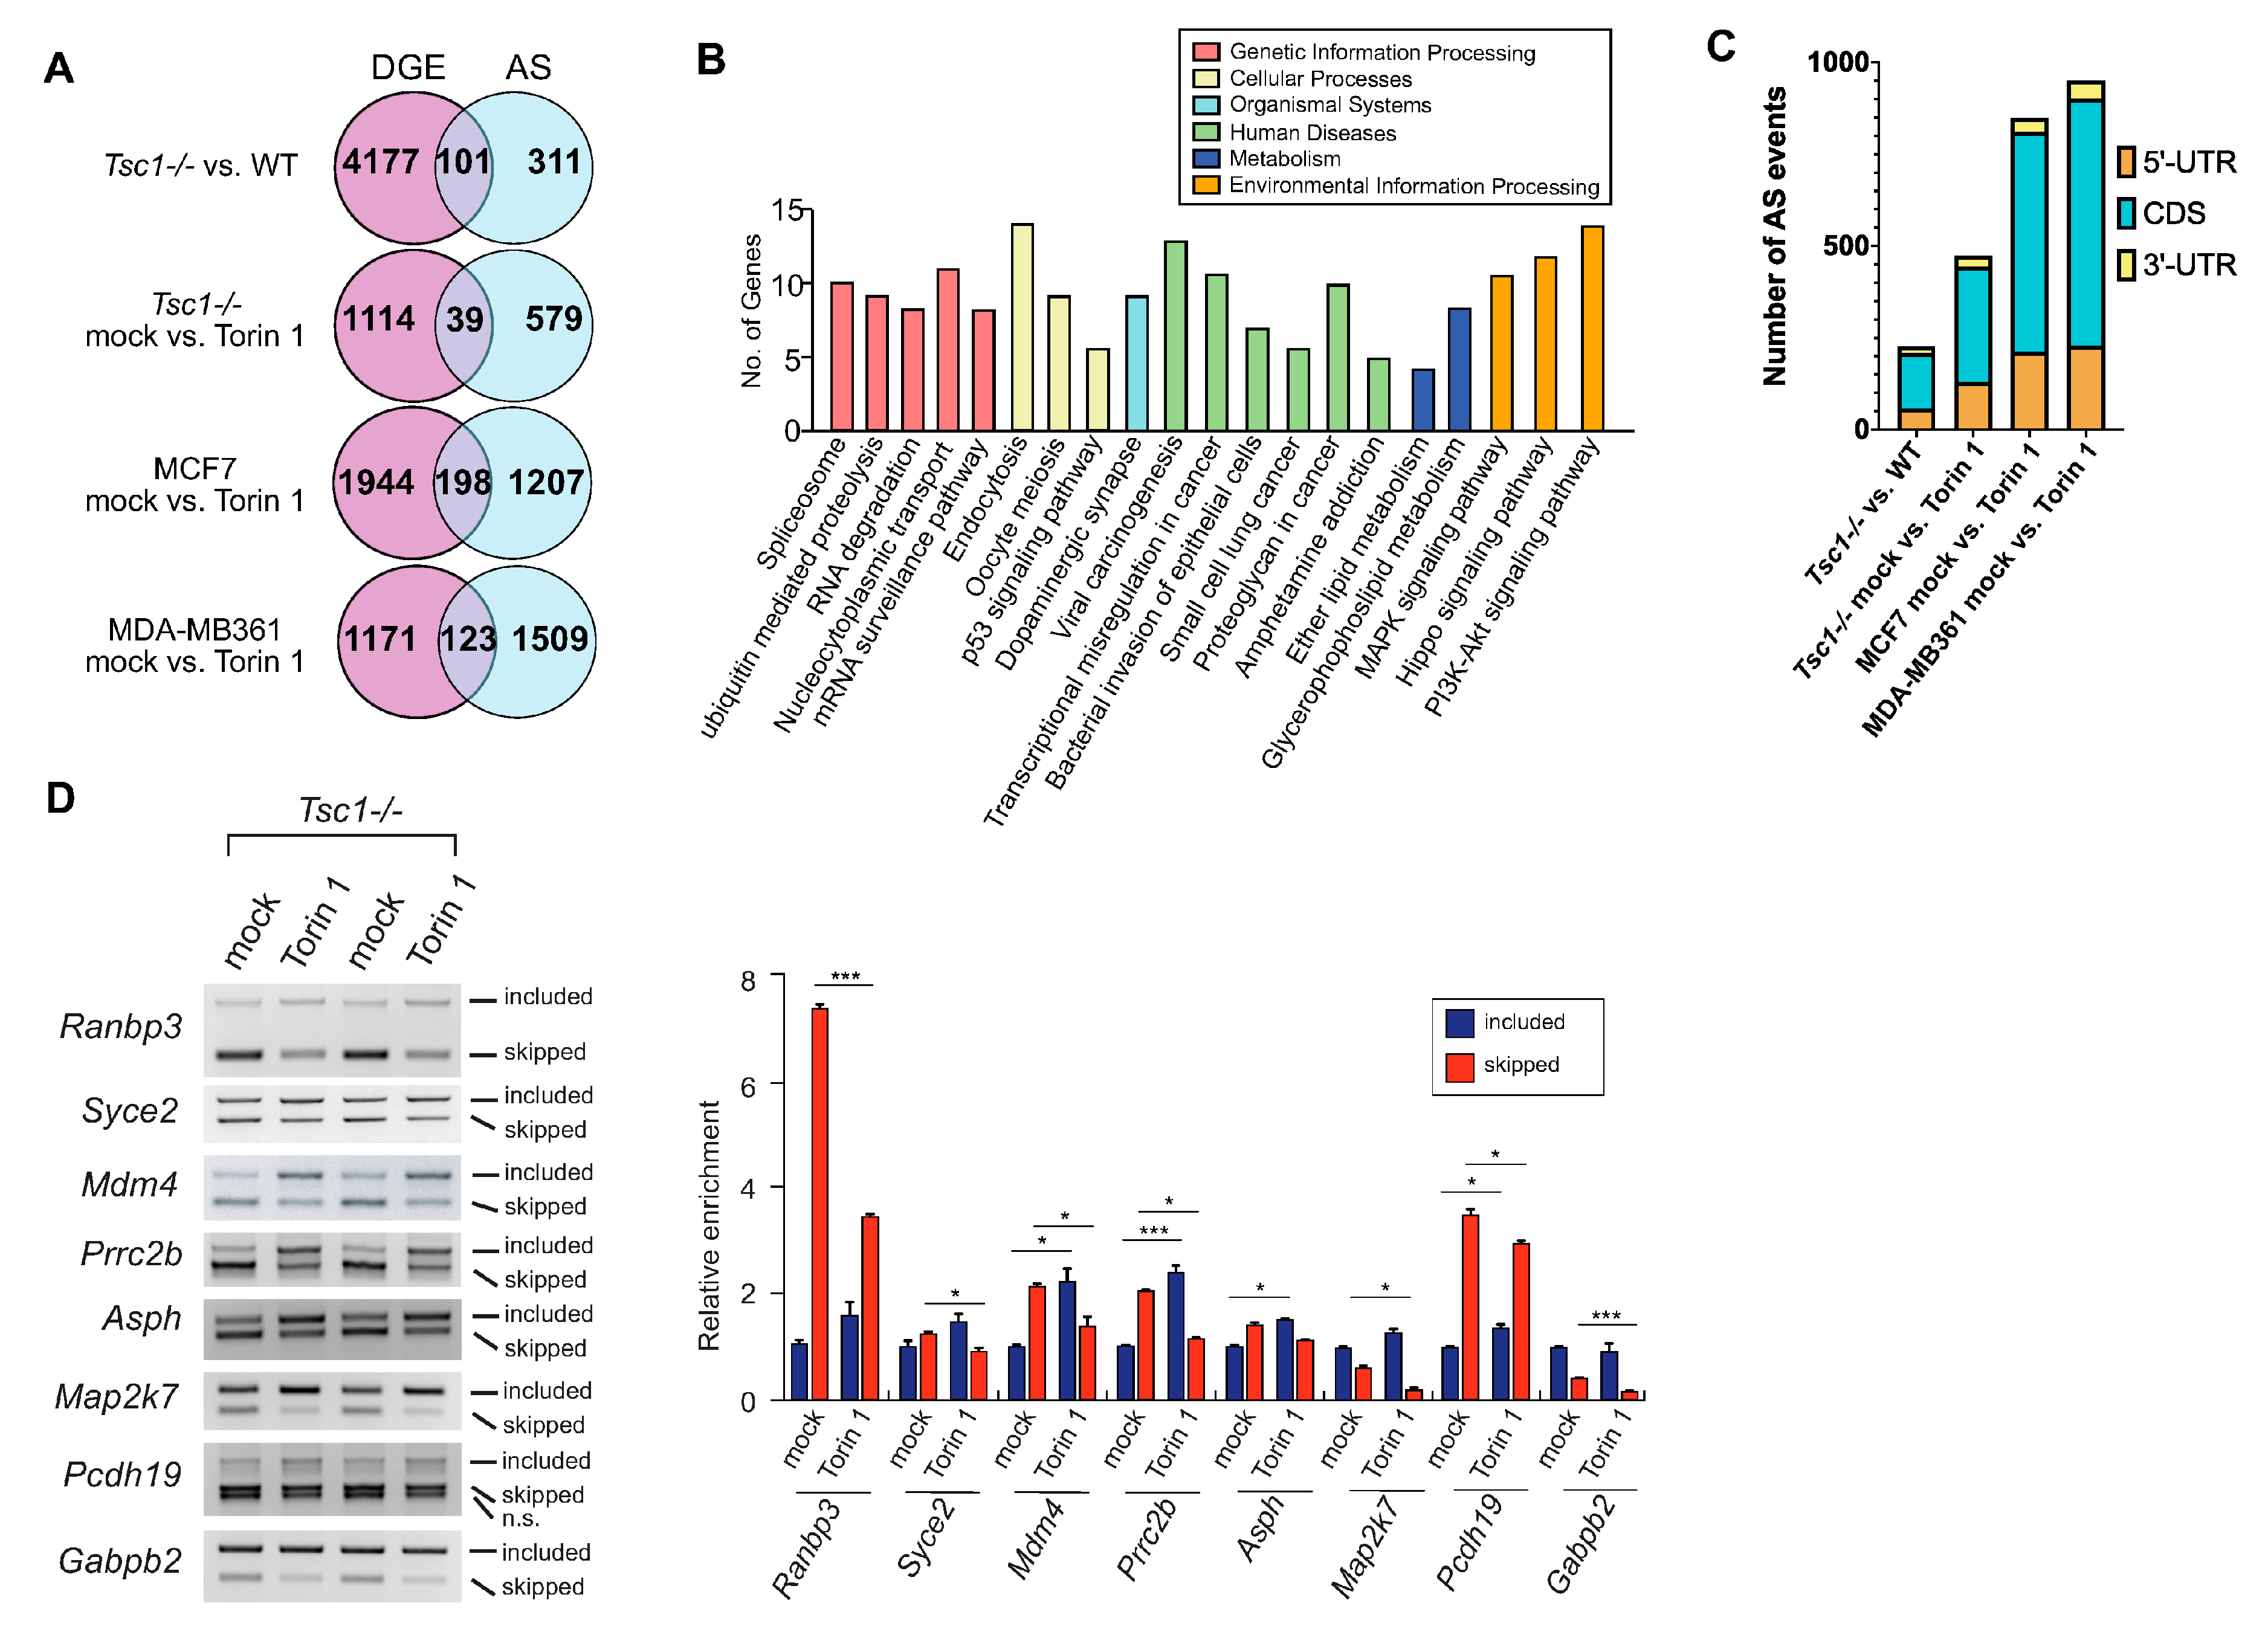
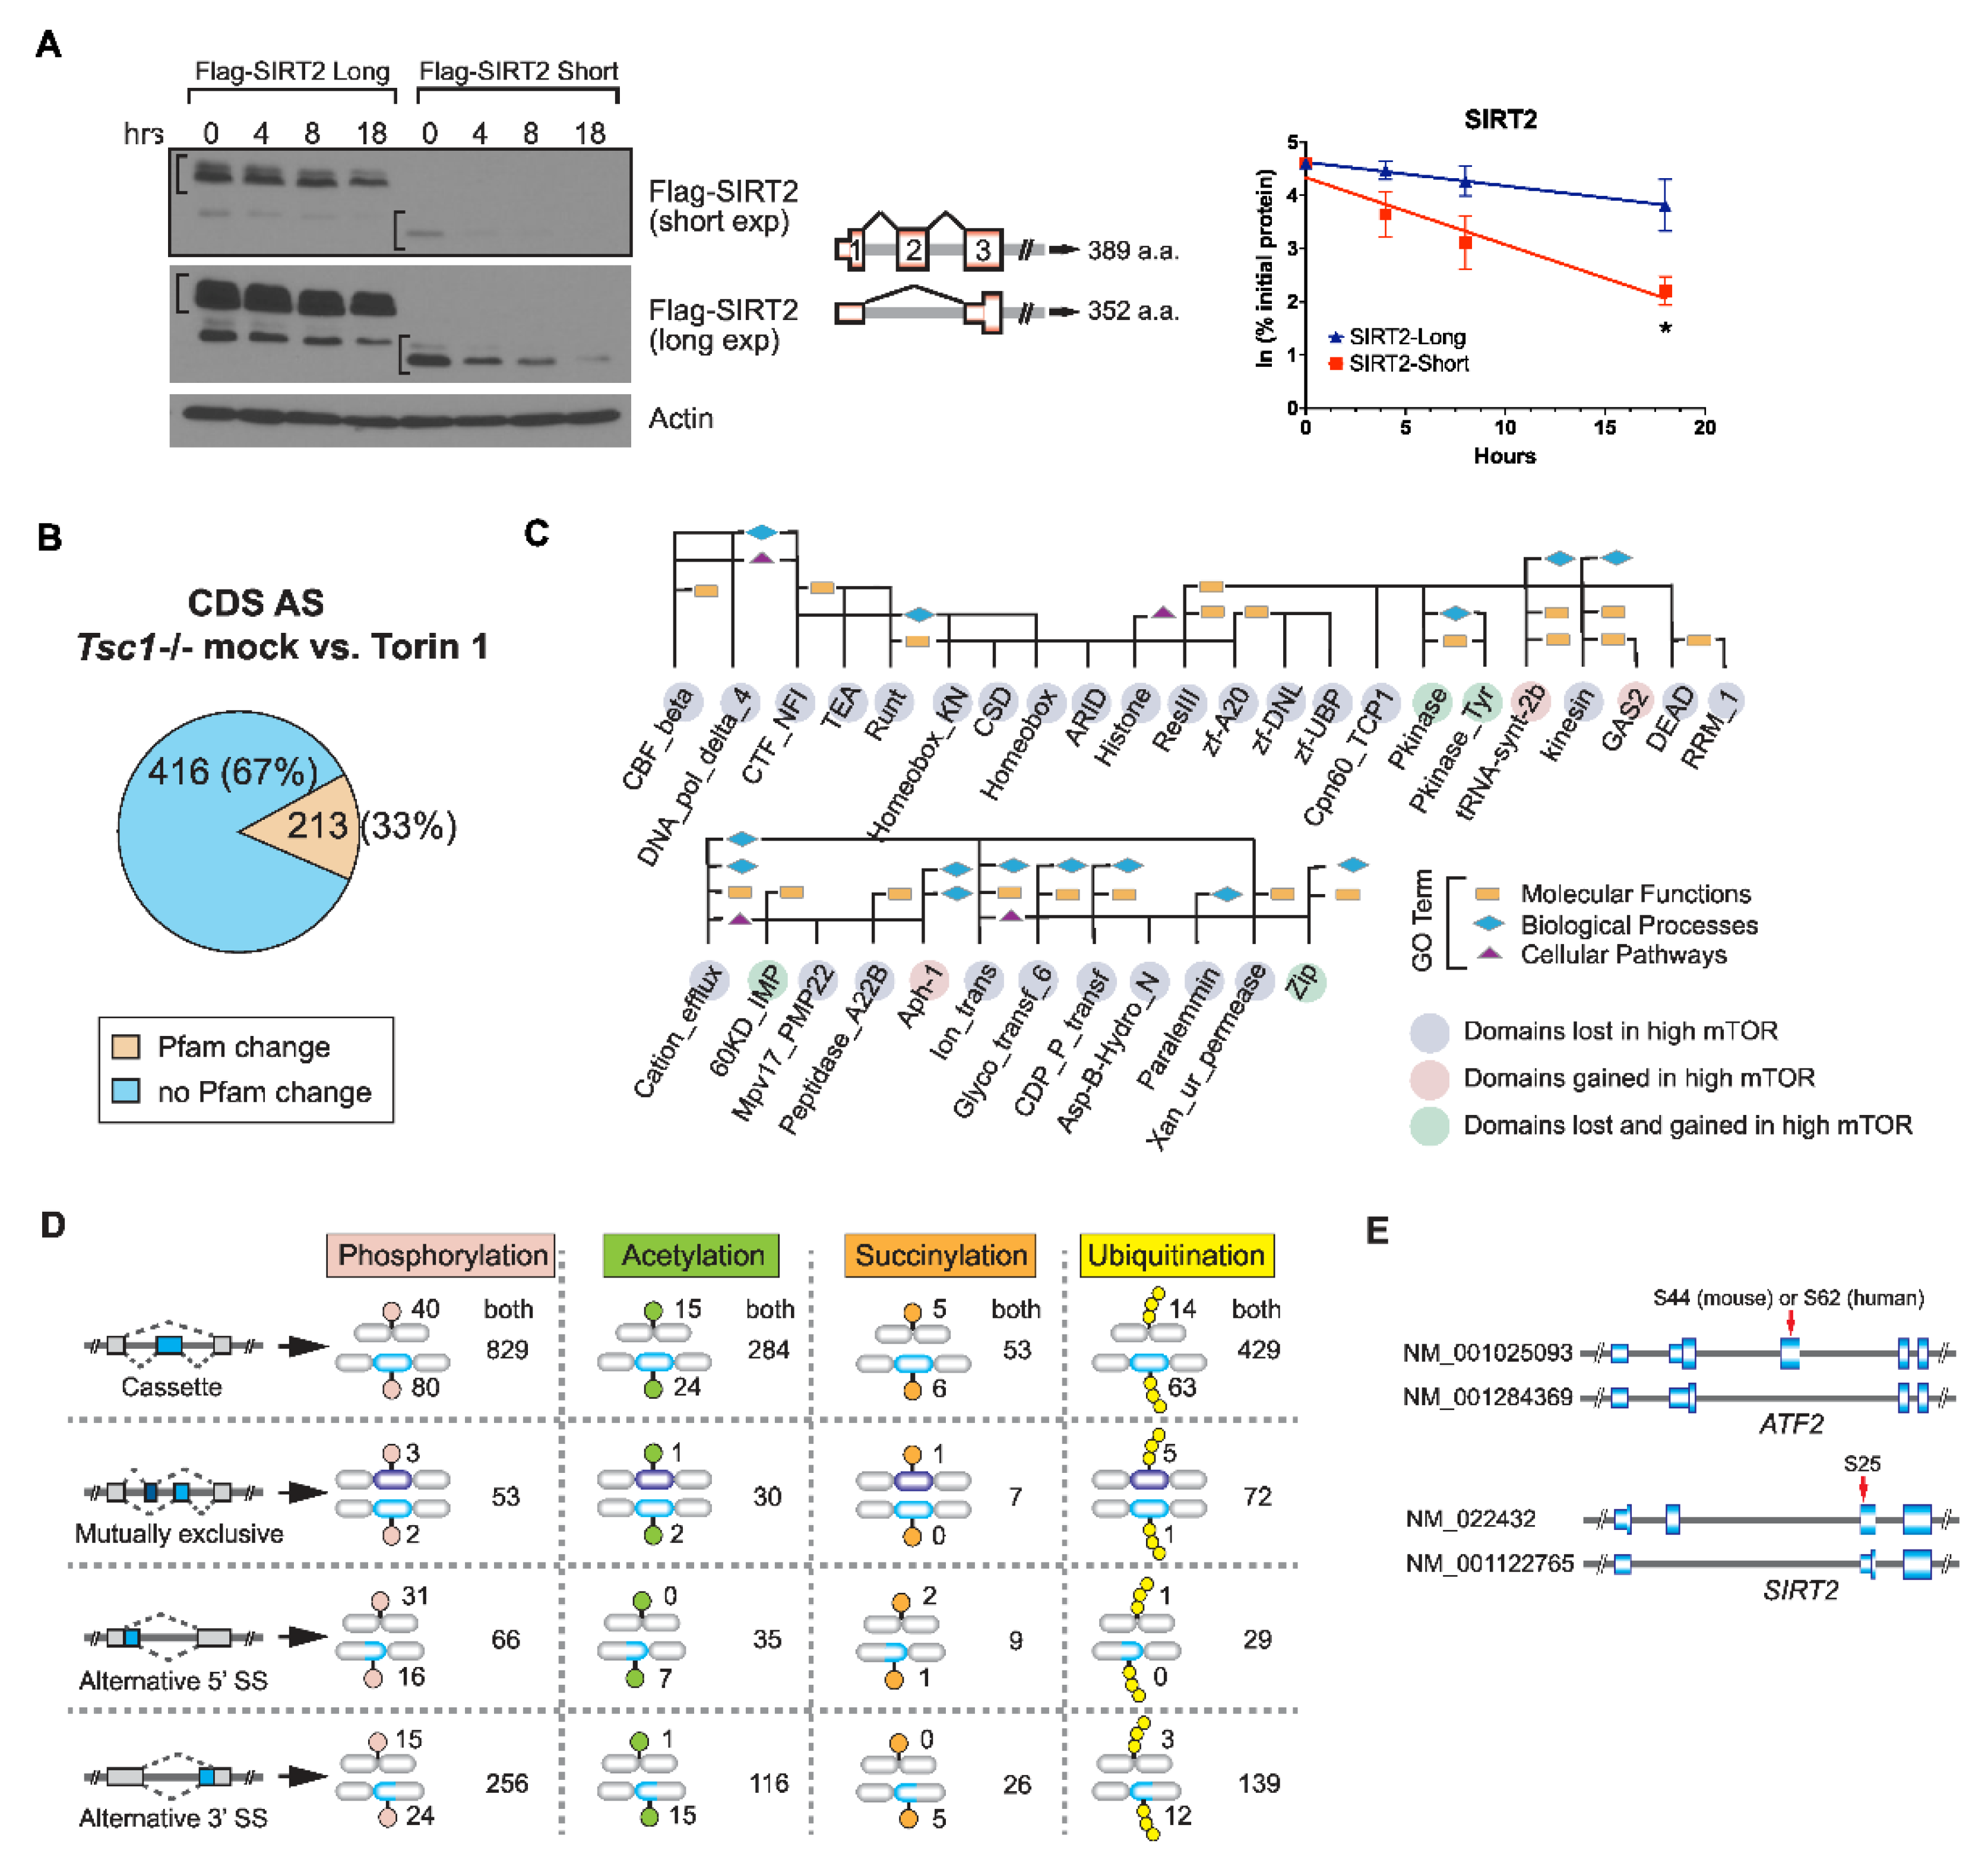
2.3. AS Contributes to the mTOR-Programmed Functional Proteome at Multiple Levels
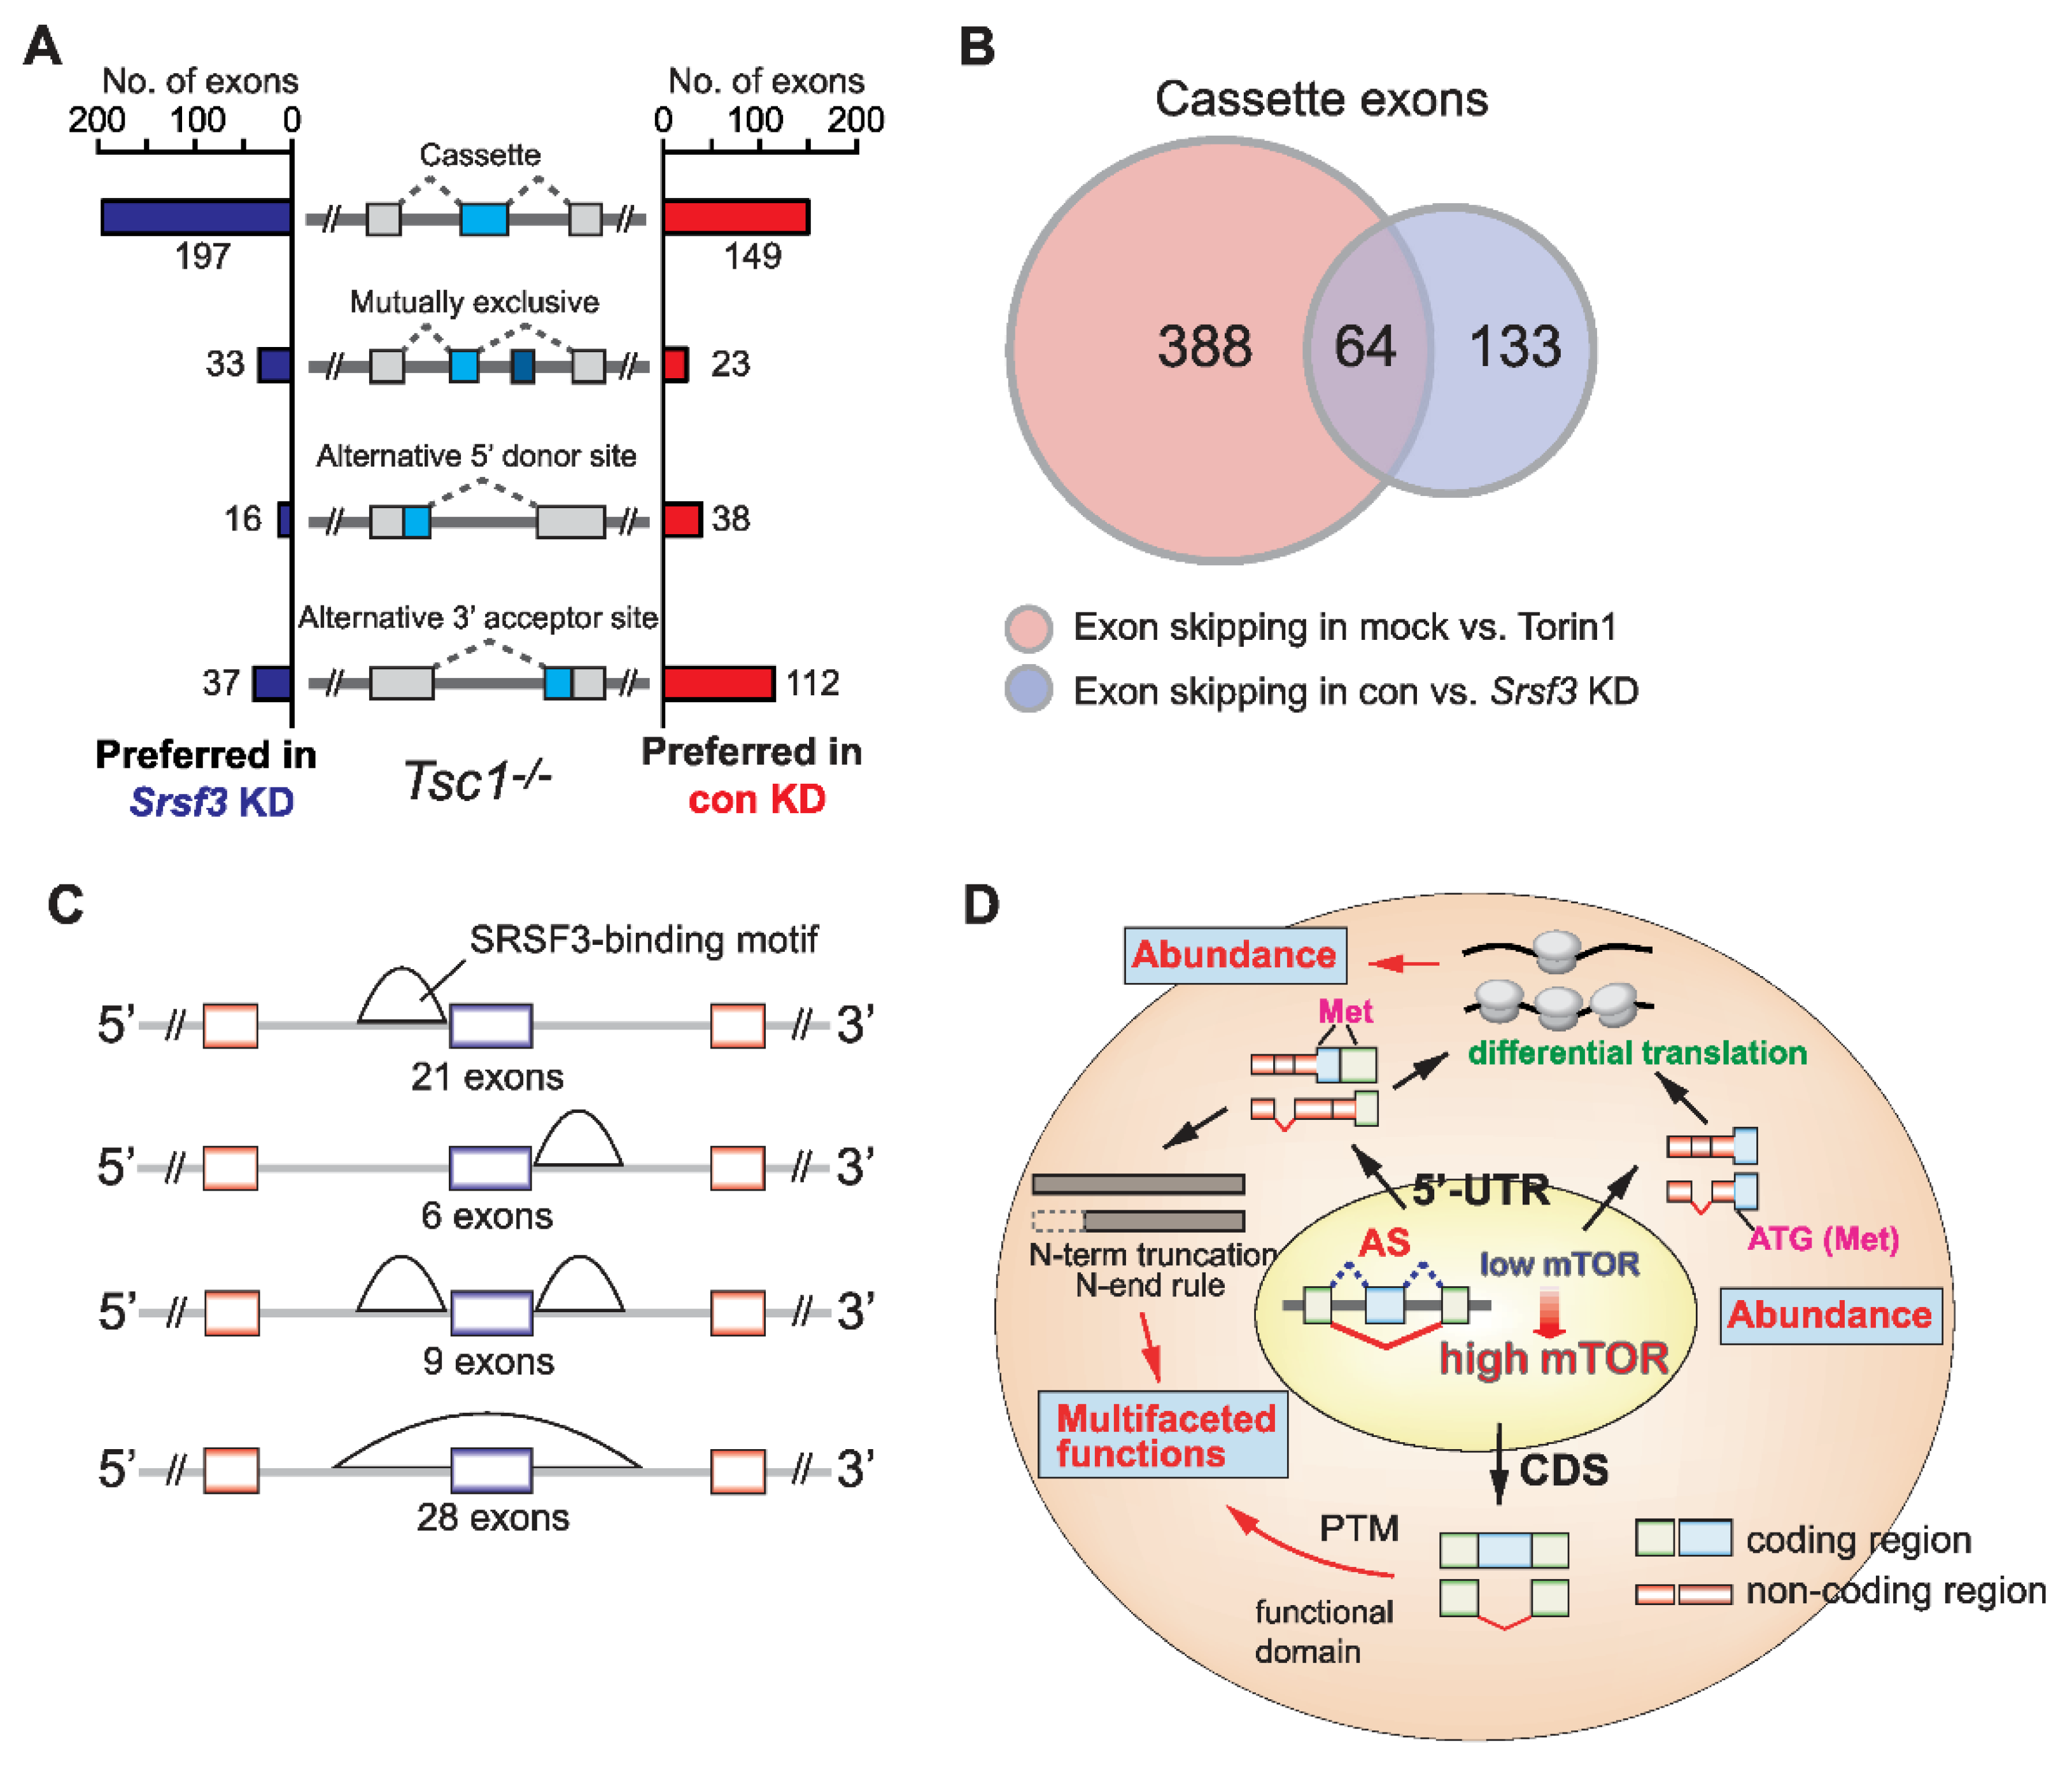
2.4. SRSF3 Promotes Exon Skipping in the mTOR-Activated Transcriptome
3. Discussion
4. Materials and Methods
4.1. Cell Lines
4.2. Chemicals
4.3. Plasmids
4.4. Real-Time PCR (RT-PCR) Analysis
4.5. List of Primers Used for RT-PCR
4.6. siRNA Knockdown and Antibodies
4.7. Protein Stability
4.8. RNA-Seq Data Analyses
4.9. AS-Quant (Alternative Splicing Quantitation) Pipeline
4.10. De Novo Intron Retention Analysis
4.11. Pfam Domain Analysis
4.12. Quantification and Statistical Analysis
Supplementary Materials
Author Contributions
Funding
Institutional Review Board Statement
Informed Consent Statement
Data Availability Statement
Acknowledgments
Conflicts of Interest
References
- Han, J.; Xiong, J.; Wang, D.; Fu, X.D. Pre-MRNA Splicing: Where and When in the Nucleus. Trends Cell Biol. 2011, 21, 336–343. [Google Scholar] [CrossRef] [PubMed]
- Faustino, N.A.; Cooper, T.A. Pre-MRNA Splicing and Human Disease. Genes Dev. 2003, 17, 419–437. [Google Scholar] [CrossRef] [PubMed]
- Green, M.R. PRE-MRNA Splicing. Annu. Rev. Genet. 1986, 20, 671–708. [Google Scholar] [CrossRef] [PubMed]
- Jurica, M.S.; Moore, M.J. Pre-MRNA Splicing: Awash in a Sea of Proteins. Mol. Cell 2003, 12, 5–14. [Google Scholar] [CrossRef]
- Black, D.L. Protein Diversity from Alternative Splicing: A Challenge for Bioinformatics and Post-Genome Biology. Cell 2000, 103, 367–370. [Google Scholar] [CrossRef]
- Lopez, A.J. ALTERNATIVE SPLICING OF PRE-MRNA: Developmental Consequences and Mechanisms of Regulation. Annu. Rev. Genet. 1998, 32, 279–305. [Google Scholar] [CrossRef] [PubMed]
- Gonçalves, V.; Pereira, J.F.S.; Jordan, P. Signaling Pathways Driving Aberrant Splicing in Cancer Cells. Genes 2018, 9, 9. [Google Scholar] [CrossRef] [PubMed]
- Lynch, K.W. Regulation of Alternative Splicing by Signal Transduction Pathways. Adv. Exp. Med. Biol. 2007, 623, 161–174. [Google Scholar] [CrossRef]
- Saxton, R.A.; Sabatini, D.M. MTOR Signaling in Growth, Metabolism, and Disease. Cell 2017, 168, 960–976. [Google Scholar] [CrossRef]
- Laplante, M.; Sabatini, D.M. MTOR Signaling at a Glance. J. Cell Sci. 2009, 122, 3589–3594. [Google Scholar] [CrossRef] [PubMed]
- Laplante, M.; Sabatini, D.M. MTOR Signaling. Cold Spring Harb. Perspect. Biol. 2012, 4, a011593. [Google Scholar] [CrossRef] [PubMed]
- Jefferies, H.B.J.; Reinhard, C.; Kozma, S.C.; Thomas, G. Rapamycin Selectively Represses Translation of the “polypyrimidine Tract” MRNA Family. Proc. Natl. Acad. Sci. USA 1994, 91, 4441–4445. [Google Scholar] [CrossRef] [PubMed]
- Avni, D.; Biberman, Y.; Meyuhas, O. The 5′ Terminal Oligopyrimidine Tract Confers Translational Control on TOP MRNAs in a Cell Type-and Sequence Context-Dependent Manner. Nucleic Acids Res. 1997, 25, 995–1001. [Google Scholar] [CrossRef]
- Meyuhas, O. Synthesis of the Translational Apparatus Is Regulated at the Translational Level. Eur. J. Biochem. 2000, 267, 6321–6330. [Google Scholar] [CrossRef]
- Gentilella, A.; Thomas, G. The Director’s Cut. Nature 2012, 485, 50–51. [Google Scholar] [CrossRef]
- Pasacantilli, I.; Frisone, P.; De Paola, E.; Fidaleo, M.; Paronetto, M.P. HnRNPM Guides an Alternative Splicing Program in Response to Inhibition of the PI3K/AKT/MTOR Pathway in Ewing Sarcoma Cells. Nucleic Acids Res. 2017, 45, 12270–12284. [Google Scholar] [CrossRef]
- Lee, G.; Zheng, Y.; Cho, S.; Jang, C.; England, C.; Dempsey, J.M.; Yu, Y.; Liu, X.; He, L.; Cavaliere, P.M.; et al. Post-Transcriptional Regulation of De Novo Lipogenesis by MTORC1-S6K1-SRPK2 Signaling. Cell 2017, 171, 1545–1558.e18. [Google Scholar] [CrossRef]
- Csibi, A.; Fendt, S.M.; Li, C.; Poulogiannis, G.; Choo, A.Y.; Chapski, D.J.; Jeong, S.M.; Dempsey, J.M.; Parkhitko, A.; Morrison, T.; et al. The MTORC1 Pathway Stimulates Glutamine Metabolism and Cell Proliferation by Repressing SIRT4. Cell 2013, 153, 840–854. [Google Scholar] [CrossRef]
- Chang, J.W.; Zhang, W.; Yeh, H.S.; De Jong, E.P.; Jun, S.; Kim, K.H.; Bae, S.S.; Beckman, K.; Hwang, T.H.; Kim, K.S.; et al. MRNA 3′-UTR Shortening Is a Molecular Signature of MTORC1 Activation. Nat. Commun. 2015, 6, 7218. [Google Scholar] [CrossRef] [PubMed]
- Chang, J.W.; Zhang, W.; Yeh, H.S.; Park, M.; Yao, C.; Shi, Y.; Kuang, R.; Yong, J. An Integrative Model for Alternative Polyadenylation, IntMAP, Delineates MTOR-Modulated Endoplasmic Reticulum Stress Response. Nucleic Acids Res. 2018, 46, 5996–6008. [Google Scholar] [CrossRef] [PubMed]
- Chang, J.-W.; Yeh, H.-S.; Park, M.; Erber, L.; Sun, J.; Cheng, S.; Bui, A.M.; Fahmi, N.A.; Nasti, R.; Kuang, R.; et al. MTOR-Regulated U2af1 Tandem Exon Splicing Specifies Transcriptome Features for Translational Control. Nucleic Acids Res. 2019, 47, 10373–10387. [Google Scholar] [CrossRef]
- Zhou, Y.; Huang, T.; Siu, H.L.; Wong, C.C.; Dong, Y.; Wu, F.; Zhang, B.; Wu, W.K.K.; Cheng, A.S.L.; Yu, J.; et al. IGF2BP3 Functions as a Potential Oncogene and Is a Crucial Target of MiR-34a in Gastric Carcinogenesis. Mol. Cancer 2017, 16, 77. [Google Scholar] [CrossRef] [PubMed]
- Zhang, H.; Wang, A.; Tan, Y.; Wang, S.; Ma, Q.; Chen, X.; He, Z. NCBP1 Promotes the Development of Lung Adenocarcinoma through Up-regulation of CUL4B. J. Cell. Mol. Med. 2019, 23, 6965. [Google Scholar] [CrossRef] [PubMed]
- Lee, J.H.; Horak, C.E.; Khanna, C.; Meng, Z.; Yu, L.R.; Veenstra, T.D.; Steeg, P.S. Alterations in Gemin5 Expression Contribute to Alternative MRNA Splicing Patterns and Tumor Cell Motility. Cancer Res. 2008, 68, 639–644. [Google Scholar] [CrossRef] [PubMed]
- Kuwano, M.; Shibata, T.; Watari, K.; Ono, M. Oncogenic Y-Box Binding Protein-1 as an Effective Therapeutic Target in Drug-Resistant Cancer. Cancer Sci. 2019, 110, 1536–1543. [Google Scholar] [CrossRef] [PubMed]
- Dou, N.; Chen, J.; Yu, S.; Gao, Y.; Li, Y. G3BP1 Contributes to Tumor Metastasis via Upregulation of Slug Expression in Hepatocellular Carcinoma. Am. J. Cancer Res. 2016, 6, 2641. [Google Scholar]
- Zhang, B.; Wang, H.Y.; Zhao, D.X.; Wang, D.X.; Zeng, Q.; Xi, J.F.; Nan, X.; He, L.J.; Zhou, J.N.; Pei, X.T.; et al. The Splicing Regulatory Factor HnRNPU Is a Novel Transcriptional Target of C-Myc in Hepatocellular Carcinoma. FEBS Lett. 2021, 595, 68–84. [Google Scholar] [CrossRef]
- Chen, E.B.; Qin, X.; Peng, K.; Li, Q.; Tang, C.; Wei, Y.C.; Yu, S.; Gan, L.; Liu, T.S. HnRNPR-CCNB1/CENPF Axis Contributes to Gastric Cancer Proliferation and Metastasis. Aging 2019, 11, 7473–7491. [Google Scholar] [CrossRef]
- Fei, T.; Chen, Y.; Xiao, T.; Li, W.; Cato, L.; Zhang, P.; Cotter, M.B.; Bowden, M.; Lis, R.T.; Zhao, S.G.; et al. Genome-Wide CRISPR Screen Identifies HNRNPL as a Prostate Cancer Dependency Regulating RNA Splicing. Proc. Natl. Acad. Sci. USA 2017, 114, E5207–E5215. [Google Scholar] [CrossRef] [PubMed]
- Miles, W.O.; Lembo, A.; Volorio, A.; Brachtel, E.; Tian, B.; Sgroi, D.; Provero, P.; Dyson, N. Alternative Polyadenylation in Triple-Negative Breast Tumors Allows NRAS and c-JUN to Bypass PUMILIO Posttranscriptional Regulation. Cancer Res. 2016, 76, 7231–7241. [Google Scholar] [CrossRef]
- Wang, X.; Li, Y.; Fan, Y.; Yu, X.; Mao, X.; Jin, F. PTBP1 Promotes the Growth of Breast Cancer Cells through the PTEN/Akt Pathway and Autophagy. J. Cell. Physiol. 2018, 233, 8930. [Google Scholar] [CrossRef] [PubMed]
- Little, E.C.; Camp, E.R.; Wang, C.; Watson, P.M.; Watson, D.K.; Cole, D.J. The CaSm (LSm1) Oncogene Promotes Transformation, Chemoresistance and Metastasis of Pancreatic Cancer Cells. Oncogenesis 2016, 5, e182. [Google Scholar] [CrossRef] [PubMed]
- Kim, R.H.; Peters, M.; Jang, Y.; Shi, W.; Pintilie, M.; Fletcher, G.C.; DeLuca, C.; Liepa, J.; Zhou, L.; Snow, B.; et al. DJ-1, a Novel Regulator of the Tumor Suppressor PTEN. Cancer Cell 2005, 7, 263–273. [Google Scholar] [CrossRef] [PubMed]
- Kim, K.; Kim, M.J.; Kim, K.H.; Ahn, S.A.; Kim, J.H.; Cho, J.Y.; Yeo, S.G. C1QBP Is Upregulated in Colon Cancer and Binds to Apolipoprotein A-I. Exp. Ther. Med. 2017, 13, 2493. [Google Scholar] [CrossRef] [PubMed]
- Lin, Y.; Zhang, J.; Cai, J.; Liang, R.; Chen, G.; Qin, G.; Han, X.; Yuan, C.; Liu, Z.; Li, Y.; et al. Systematic Analysis of Gene Expression Alteration and Co-Expression Network of Eukaryotic Initiation Factor 4A-3 in Cancer. J. Cancer 2018, 9, 4568–4577. [Google Scholar] [CrossRef]
- Cao, J.; Wu, N.; Han, Y.; Hou, Q.; Zhao, Y.; Pan, Y.; Xie, X.; Chen, F. DDX21 Promotes Gastric Cancer Proliferation by Regulating Cell Cycle. Biochem. Biophys. Res. Commun. 2018, 505, 1189–1194. [Google Scholar] [CrossRef]
- Fahmi, N.A.; Nassereddeen, H.; Chang, J.W.; Park, M.; Yeh, H.S.; Sun, J.; Fan, D.; Yong, J.; Zhang, W. AS-Quant: Detection and Visualization of Alternative Splicing Events with RNA-Seq Data. Int. J. Mol. Sci. 2021, 22, 4468. [Google Scholar] [CrossRef] [PubMed]
- Raudvere, U.; Kolberg, L.; Kuzmin, I.; Arak, T.; Adler, P.; Peterson, H.; Vilo, J. G: Profiler: A Web Server for Functional Enrichment Analysis and Conversions of Gene Lists (2019 Update). Nucleic Acids Res. 2019, 47, W191–W198. [Google Scholar] [CrossRef] [PubMed]
- Wong, J.J.L.; Ritchie, W.; Ebner, O.A.; Selbach, M.; Wong, J.W.H.; Huang, Y.; Gao, D.; Pinello, N.; Gonzalez, M.; Baidya, K.; et al. Orchestrated Intron Retention Regulates Normal Granulocyte Differentiation. Cell 2013, 154, 583–595. [Google Scholar] [CrossRef]
- Ni, T.; Yang, W.; Han, M.; Zhang, Y.; Shen, T.; Nie, H.; Zhou, Z.; Dai, Y.; Yang, Y.; Liu, P.; et al. Global Intron Retention Mediated Gene Regulation during CD4+ T Cell Activation. Nucleic Acids Res. 2016, 44, 6817. [Google Scholar] [CrossRef] [PubMed]
- Varshavsky, A. The N-End Rule Pathway and Regulation by Proteolysis. Protein Sci. 2011, 20, 1298. [Google Scholar] [CrossRef]
- Rajendran, V.; Kalita, P.; Shukla, H.; Kumar, A.; Tripathi, T. Aminoacyl-TRNA Synthetases: Structure, Function, and Drug Discovery. Int. J. Biol. Macromol. 2018, 111, 400–414. [Google Scholar] [CrossRef]
- Hsu, P.P.; Kang, S.A.; Rameseder, J.; Zhang, Y.; Ottina, K.A.; Lim, D.; Peterson, T.R.; Choi, Y.; Gray, N.S.; Yaffe, M.B.; et al. The MTOR-Regulated Phosphoproteome Reveals a Mechanism of MTORC1-Mediated Inhibition of Growth Factor Signaling. Science 2011, 332, 1317–1322. [Google Scholar] [CrossRef] [PubMed]
- Jin, L.; Chen, Y.; Yan, C.; Guo, X.; Jiang, T.; Guli, A.; Song, X.; Wan, Q.; Shu, Q.; Ding, S. Phosphoproteome Profiling Revealed the Importance of MTOR Inhibition on CDK1 Activation to Further Regulate Cell Cycle Progression. J. Proteome Res. 2021, 20, 2329–2339. [Google Scholar] [CrossRef]
- Zhou, Z.; Chen, Y.; Jin, M.; He, J.; Guli, A.; Yan, C.; Ding, S. Comprehensive Analysis of Lysine Acetylome Reveals a Site-Specific Pattern in Rapamycin-Induced Autophagy. J. Proteome Res. 2019, 18, 865–877. [Google Scholar] [CrossRef]
- Zhao, J.; Zhai, B.; Gygi, S.P.; Goldberg, A.L. MTOR Inhibition Activates Overall Protein Degradation by the Ubiquitin Proteasome System as Well as by Autophagy. Proc. Natl. Acad. Sci. USA 2015, 112, 15790–15797. [Google Scholar] [CrossRef]
- Lin, H.; Su, X.; He, B. Protein Lysine Acylation and Cysteine Succination by Intermediates of Energy Metabolism. ACS Chem. Biol. 2012, 7, 947–960. [Google Scholar] [CrossRef]
- Zoncu, R.; Efeyan, A.; Sabatini, D.M. MTOR: From Growth Signal Integration to Cancer, Diabetes and Ageing. Nat. Rev. Mol. Cell Biol. 2011, 12, 21–35. [Google Scholar] [CrossRef] [PubMed]
- Robitaille, A.M.; Christen, S.; Shimobayashi, M.; Cornu, M.; Fava, L.L.; Moes, S.; Prescianotto-Baschong, C.; Sauer, U.; Jenoe, P.; Hall, M.N. Quantitative Phosphoproteomics Reveal MTORC1 Activates de Novo Pyrimidine Synthesis. Science 2013, 339, 1320–1323. [Google Scholar] [CrossRef] [PubMed]
- Yu, Y.; Yoon, S.O.; Poulogiannis, G.; Yang, Q.; Ma, X.M.; Villén, J.; Kubica, N.; Hoffman, G.R.; Cantley, L.C.; Gygi, S.P.; et al. Phosphoproteomic Analysis Identifies Grb10 as an MTORC1 Substrate That Negatively Regulates Insulin Signaling. Science 2011, 332, 1322–1326. [Google Scholar] [CrossRef]
- Chen, Y.; Zhao, W.; Yang, J.S.; Cheng, Z.; Luo, H.; Lu, Z.; Tan, M.; Gu, W.; Zhao, Y. Quantitative Acetylome Analysis Reveals the Roles of SIRT1 in Regulating Diverse Substrates and Cellular Pathways. Mol. Cell. Proteom. 2012, 11, 1048–1062. [Google Scholar] [CrossRef] [PubMed]
- Sol, E.M.; Wagner, S.A.; Weinert, B.T.; Kumar, A.; Kim, H.S.; Deng, C.X.; Choudhary, C. Proteomic Investigations of Lysine Acetylation Identify Diverse Substrates of Mitochondrial Deacetylase Sirt3. PLoS ONE 2012, 7, e50545. [Google Scholar] [CrossRef] [PubMed]
- Park, J.; Chen, Y.; Tishkoff, D.X.; Peng, C.; Tan, M.; Dai, L.; Xie, Z.; Zhang, Y.; Zwaans, B.M.M.; Skinner, M.E.; et al. SIRT5-Mediated Lysine Desuccinylation Impacts Diverse Metabolic Pathways. Mol. Cell 2013, 50, 919–930. [Google Scholar] [CrossRef] [PubMed]
- van der Wal, L.; Bezstarosti, K.; Sap, K.A.; Dekkers, D.H.W.; Rijkers, E.; Mientjes, E.; Elgersma, Y.; Demmers, J.A.A. Improvement of Ubiquitylation Site Detection by Orbitrap Mass Spectrometry. J. Proteom. 2018, 172, 49–56. [Google Scholar] [CrossRef]
- Pereira, J.M.; Chevalier, C.; Chaze, T.; Gianetto, Q.; Impens, F.; Matondo, M.; Cossart, P.; Hamon, M.A. Infection Reveals a Modification of SIRT2 Critical for Chromatin Association. Cell Rep. 2018, 23, 1124–1137. [Google Scholar] [CrossRef]
- Rack, J.G.M.; Vanlinden, M.R.; Lutter, T.; Aasland, R.; Ziegler, M. Constitutive Nuclear Localization of an Alternatively Spliced Sirtuin-2 Isoform. J. Mol. Biol. 2014, 426, 1677–1691. [Google Scholar] [CrossRef]
- Sevilla, A.; Santos, C.R.; Vega, F.M.; Lazo, P.A. Human Vaccinia-Related Kinase 1 (VRK1) Activates the ATF2 Transcriptional Activity by Novel Phosphorylation on Thr-73 and Ser-62 and Cooperates with JNK. J. Biol. Chem. 2004, 279, 27458–27465. [Google Scholar] [CrossRef]
- Paz, I.; Kosti, I.; Ares, M.; Cline, M.; Mandel-Gutfreund, Y. RBPmap: A Web Server for Mapping Binding Sites of RNA-Binding Proteins. Nucleic Acids Res. 2014, 42, W361–W367. [Google Scholar] [CrossRef]
- Philippe, L.; Vasseur, J.-J.; Debart, F.; Thoreen, C.C. La-Related Protein 1 (LARP1) Repression of TOP MRNA Translation Is Mediated through Its Cap-Binding Domain and Controlled by an Adjacent Regulatory Region. Nucleic Acids Res. 2018, 46, 1457–1469. [Google Scholar] [CrossRef]
- Nandagopal, N.; Roux, P.P. Regulation of Global and Specific MRNA Translation by the MTOR Signaling Pathway. Translation 2015, 3, e983402. [Google Scholar] [CrossRef]
- Laplante, M.; Sabatini, D.M. Regulation of MTORC1 and Its Impact on Gene Expression at a Glance. J. Cell Sci. 2013, 126, 1713–1719. [Google Scholar] [CrossRef] [PubMed]
- Änkö, M.L.; Müller-McNicoll, M.; Brandl, H.; Curk, T.; Gorup, C.; Henry, I.; Ule, J.; Neugebauer, K.M. The RNA-Binding Landscapes of Two SR Proteins Reveal Unique Functions and Binding to Diverse RNA Classes. Genome Biol. 2012, 13, R17. [Google Scholar] [CrossRef]
- Broseus, L.; Ritchie, W. Challenges in Detecting and Quantifying Intron Retention from next Generation Sequencing Data. Comput. Struct. Biotechnol. J. 2020, 18, 501–508. [Google Scholar] [CrossRef] [PubMed]
- Vanichkina, D.P.; Schmitz, U.; Wong, J.J.L.; Rasko, J.E.J. Challenges in Defining the Role of Intron Retention in Normal Biology and Disease. Semin. Cell Dev. Biol. 2018, 75, 40–49. [Google Scholar] [CrossRef]
- Anders, S.; Reyes, A.; Huber, W. Detecting Differential Usage of Exons from RNA-Seq Data. Genome Res. 2012, 22, 2008–2017. [Google Scholar] [CrossRef]
- Kwiatkowski, D.J.; Zhang, H.; Bandura, J.L.; Heiberger, K.M.; Glogauer, M.; el-Hashemite, N.; Onda, H. A Mouse Model of TSC1 Reveals Sex-Dependent Lethality from Liver Hemangiomas, and up-Regulation of P70S6 Kinase Activity in Tsc1 Null Cells. Hum. Mol. Genet. 2002, 11, 525–534. [Google Scholar] [CrossRef] [PubMed]
- Kim, D.; Pertea, G.; Trapnell, C.; Pimentel, H.; Kelley, R.; Salzberg, S.L. TopHat2: Accurate Alignment of Transcriptomes in the Presence of Insertions, Deletions and Gene Fusions. Genome Biol. 2013, 14, R36. [Google Scholar] [CrossRef]
- Bray, N.L.; Pimentel, H.; Melsted, P.; Pachter, L. Near-Optimal Probabilistic RNA-Seq Quantification. Nat. Biotechnol. 2016, 34, 525–527. [Google Scholar] [CrossRef] [PubMed]
- O’Leary, N.A.; Wright, M.W.; Brister, J.R.; Ciufo, S.; Haddad, D.; McVeigh, R.; Rajput, B.; Robbertse, B.; Smith-White, B.; Ako-Adjei, D.; et al. Reference Sequence (RefSeq) Database at NCBI: Current Status, Taxonomic Expansion, and Functional Annotation. Nucleic Acids Res. 2016, 44, D733–D745. [Google Scholar] [CrossRef] [PubMed]
- Bateman, A.; Coin, L.; Durbin, R.; Finn, R.D.; Hollich, V.; Griffiths-Jones, S.; Khanna, A.; Marshall, M.; Moxon, S.; Sonnhammer, E.L.L.; et al. The Pfam Protein Families Database. Nucleic Acids Res. 2004, 32, D138–D141. [Google Scholar] [CrossRef] [PubMed]
- Mitchell, A.; Chang, H.Y.; Daugherty, L.; Fraser, M.; Hunter, S.; Lopez, R.; McAnulla, C.; McMenamin, C.; Nuka, G.; Pesseat, S.; et al. The InterPro Protein Families Database: The Classification Resource after 15 Years. Nucleic Acids Res. 2015, 43, D213–D221. [Google Scholar] [CrossRef] [PubMed]
- Kanehisa, M.; Goto, S.; Kawashima, S.; Nakaya, A. The KEGG Databases at GenomeNet. Nucleic Acids Res. 2002, 30, 42–46. [Google Scholar] [CrossRef] [PubMed]


Publisher’s Note: MDPI stays neutral with regard to jurisdictional claims in published maps and institutional affiliations. |
© 2022 by the authors. Licensee MDPI, Basel, Switzerland. This article is an open access article distributed under the terms and conditions of the Creative Commons Attribution (CC BY) license (https://creativecommons.org/licenses/by/4.0/).
Share and Cite
Cheng, S.; Fahmi, N.A.; Park, M.; Sun, J.; Thao, K.; Yeh, H.-S.; Zhang, W.; Yong, J. mTOR Contributes to the Proteome Diversity through Transcriptome-Wide Alternative Splicing. Int. J. Mol. Sci. 2022, 23, 12416. https://doi.org/10.3390/ijms232012416
Cheng S, Fahmi NA, Park M, Sun J, Thao K, Yeh H-S, Zhang W, Yong J. mTOR Contributes to the Proteome Diversity through Transcriptome-Wide Alternative Splicing. International Journal of Molecular Sciences. 2022; 23(20):12416. https://doi.org/10.3390/ijms232012416
Chicago/Turabian StyleCheng, Sze, Naima Ahmed Fahmi, Meeyeon Park, Jiao Sun, Kaitlyn Thao, Hsin-Sung Yeh, Wei Zhang, and Jeongsik Yong. 2022. "mTOR Contributes to the Proteome Diversity through Transcriptome-Wide Alternative Splicing" International Journal of Molecular Sciences 23, no. 20: 12416. https://doi.org/10.3390/ijms232012416
APA StyleCheng, S., Fahmi, N. A., Park, M., Sun, J., Thao, K., Yeh, H.-S., Zhang, W., & Yong, J. (2022). mTOR Contributes to the Proteome Diversity through Transcriptome-Wide Alternative Splicing. International Journal of Molecular Sciences, 23(20), 12416. https://doi.org/10.3390/ijms232012416