Article

Assessment of Brain-Derived Neurotrophic Factor (BDNF) Concentration in Children with Idiopathic Nephrotic Syndrome

by
Andrzej Badeński
1,*,
Marta Badeńska
1,
Elżbieta Świętochowska
2,
Agnieszka Didyk
3,
Aurelia Morawiec-Knysak
3 and
Maria Szczepańska
1,*
1
Department of Pediatrics, Faculty of Medical Sciences in Zabrze, Medical University of Silesia, 40-055 Katowice, Poland
2
Department of Medical and Molecular Biology, Faculty of Medical Sciences in Zabrze, Medical University of Silesia, 40-055 Katowice, Poland
3
Department of Pediatric Nephrology with Dialysis Division for Children, Independent Public Clinical Hospital No. 1, 41-800 Zabrze, Poland
*
Authors to whom correspondence should be addressed.
Int. J. Mol. Sci. 2022, 23(20), 12312; https://doi.org/10.3390/ijms232012312
Submission received: 16 September 2022 / Revised: 7 October 2022 / Accepted: 12 October 2022 / Published: 14 October 2022
(This article belongs to the Special Issue Molecular Mechanisms of Kidney Disease: From Neonates to Adolescents)

Abstract

:
Idiopathic nephrotic syndrome (INS) is a chronic disease affecting children in early childhood. It is characterized by proteinuria, hypoalbuminemia, edema and hyperlipidemia. To date, the diagnosis is usually established at an advanced stage of proteinuria. Therefore, new methods of early INS detection are desired. This study was designed to assess brain-derived neurotrophic factor (BDNF) as a potential marker in the early diagnosis of INS. The study group included patients with a diagnosis of idiopathic nephrotic syndrome (n = 30) hospitalized in Clinical Hospital No. 1 in Zabrze, from December 2019 to December 2021. Our study shows that serum BDNF concentration decreased and urine BDNF concentration increased in a group of patients with INS, compared with healthy controls. Such outcomes might be related to loss of the BDNF contribution in podocyte structure maintenance. Moreover, we anticipate the role of BDNF in urine protein concentration increase, which could be used as a direct predictor of urine protein fluctuations in clinical practice. Moreover, the ROC curve has also shown that serum BDNF and urine BDNF levels might be useful as an INS marker.

1. Introduction

1.1. The Idiopathic Nephrotic Syndrome

Idiopathic nephrotic syndrome (INS) is a glomerular disease, most frequently with an early childhood onset. Pathophysiology of INS is based on a podocyte damage, leading to disturbances in the glomerular filtration barrier functioning [1]. INS is defined by nephrotic-range proteinuria (≥40 mg/m2/hour or urine protein/creatinine ratio ≥200 mg/g or 3 + protein on urine dipstick), hypoalbuminemia (<25 g/L) and edema [2,3].
In the majority of patients, the clinical course is characterized by frequent relapses, often related to infectious events. Patients are classified by their response to steroid therapy. Most INS children require long-term steroid and/or immunosuppressive therapy aiming to control disease activity. Such control is usually achieved within 4 weeks of steroid therapy (steroid-sensitive NS [SSNS]). Unfortunately, 50% of patients are likely to become steroid-dependent or present with frequent relapses of the disease [4,5]. Studies have proven that the more relapses a patient develops, and whether there is a need for non-steroidal immunosuppressants, the more active the disease will be in early adulthood [6,7,8,9]. For SSNS patients, after 10 years, the risk of progression to chronic kidney disease is quite low, at about 5% [10], while children with steroid-resistant INS are much more likely to develop end-stage renal disease, mainly those who do not achieve remission [11].
Nevertheless, the determinants of a long-term prognosis for INS patients should be investigated more [1].

1.2. The Similarity of Neuronal Cells to Podocytes

Podocytes maintain the glomerular filtration barrier through their unique cellular structure, which includes major processes and foot processes covering the glomerular basement membrane (GBM) [12,13].
A typical neuron comprises the cell body (perikaryon) and its projections: the axon and dendrites. Neurons contact each other through synapses to form neural networks.
Podocytes, similarly to neurons, show a complex system of branches consisting of the major processes, which are further divided into foot extensions. The branches of podocytes alternate with those that depart from neighboring cells, also forming a tight network that completely surrounds the basal membrane of the glomeruli [14].
These two cell types share a dynamic actin-based cytoskeleton architecture. It is worth mentioning that actin is mainly concentrated in specialized, thin branches—in the foot processes in podocyte cells, and in dendritic extensions in neurons. Such structures enable them to keep their desired shape and function [15,16].
In neuronal cells, actin remodeling is the driving force for the formation, shaping, and stabilization of dendritic projections. Studies on neuronal and psychiatric disorders, such as Alzheimer’s disease or schizophrenia, have defined the underlying pathology as a damage of these processes, which, in turn, results in a reduced number and altered morphology of dendritic projections [17]. Similarly, the dynamics of podocyte actin serves to maintain the correct shape and arrangement of the foot extensions along the glomerular basement membrane. In patients with focal segmental glomerulosclerosis (FSGS), minimal change nephropathy and diabetic nephropathy (DN), architectural changes in the glomeruli are observed in the form of reduction of foot processes [18,19].

1.3. Brain-Derived Neurotrophic Factor (BDNF)

BDNF is a pleiotropic neurotrophin that binds to the tropomyosin-related kinase B (TrkB) receptor and plays a key role in the maturation, survival and activity of neurons. TrkB is also produced in the renal glomeruli, collecting tubules, and the glomerular apparatus [20,21,22,23]. In addition, BDNF has been shown to have TrkB-dependent trophic activity on podocyte foot cells, resulting in actin polymerization. In vitro exposure to BDNF results in an increase in length and number of podocyte branches [14]. Similar changes were repeatedly observed in neuronal cells, where the application of BDNF increased axon length and the number of dendritic spikes and synapses. Importantly, BDNF is effective in repairing podocyte damage in vitro, opening up a potential new perspective on treating podocyte disorders [24,25]. BDNF levels in serum and urine have not yet been determined in a pediatric population with INS.

1.4. Main Aims of the Study

INS is a chronic, progressive disease affecting children in early childhood. Up to this point, the diagnosis has usually been established at an advanced stage of proteinuria. Therefore, new methods of early INS detection are desired. This study was designed to assess BDNF as a potential marker in the early diagnosis of INS, as well as a predictor of proteinuria, also among patients with relapse of the disease.

2. Results

2.1. Descriptive Analysis and Comparison—INS Patients and Control Group

All 74 patients met the inclusion criteria, among which 30 represented the study group and 44 represented the control group. The study group included 14 girls (46.6%) and 16 boys (53.4%), with a mean age of 7.67 ± 4.14 years. The control group consisted of 18 girls (40.9%) and 26 boys (59.1%), with a mean age of 7.75 ± 4.10 years. Among children with INS mean urine protein level was 4.45 ± 8.78 g/L; however, serum creatinine levels were within normal range for all patients with mean creatinine level at 34.00 ± 14.60 μmol/L.
Seven individuals (23.3%) from the study group were admitted to the clinic with an initial manifestation of INS, whereas the remaining twenty-three patients (76.7%) were hospitalized due to a relapse.
Cyclosporine therapy was conducted in 10 cases (33.3%), with only 1 patient from the group receiving cyclophosphamide, whereas the rest of the group (19 individuals) were treated with steroids only.
Patients from the control group were not diagnosed with any kidney disorders, neither congenital nor acquired, whereas the study group only included patients with INS.
Table 1 presents the full characteristics of the studied groups of children with INS and the control group.

2.2. BDNF Results

To investigate whether BDNF concentration was dependent on the INS manifestation, we used Student’s t-test for independent samples of both urine and serum. Significantly higher concentrations of BDNF in urine (p = 3.9 × 10⁻¹⁰) and significantly lower serum concentrations (p = 2.6 × 10⁻⁸) were observed in the study group compared with the control group (Figure 1).
Additionally, we determined the serum BDNF to serum creatinine ratio for both the study and control groups. Among patients with INS, the mean BDNF/creatinine ratio was 0.3, whereas in the study group, it reached 0.02 (Table 2).
To identify possible correlations between serum and urine BDNF concentrations, we applied the Pearson correlation coefficient separately for both groups. There was a significant positive correlation in the control group (R = 0.84, p < 0.0001); however, in the study group, the correlation was not statistically significant (Figure 2).
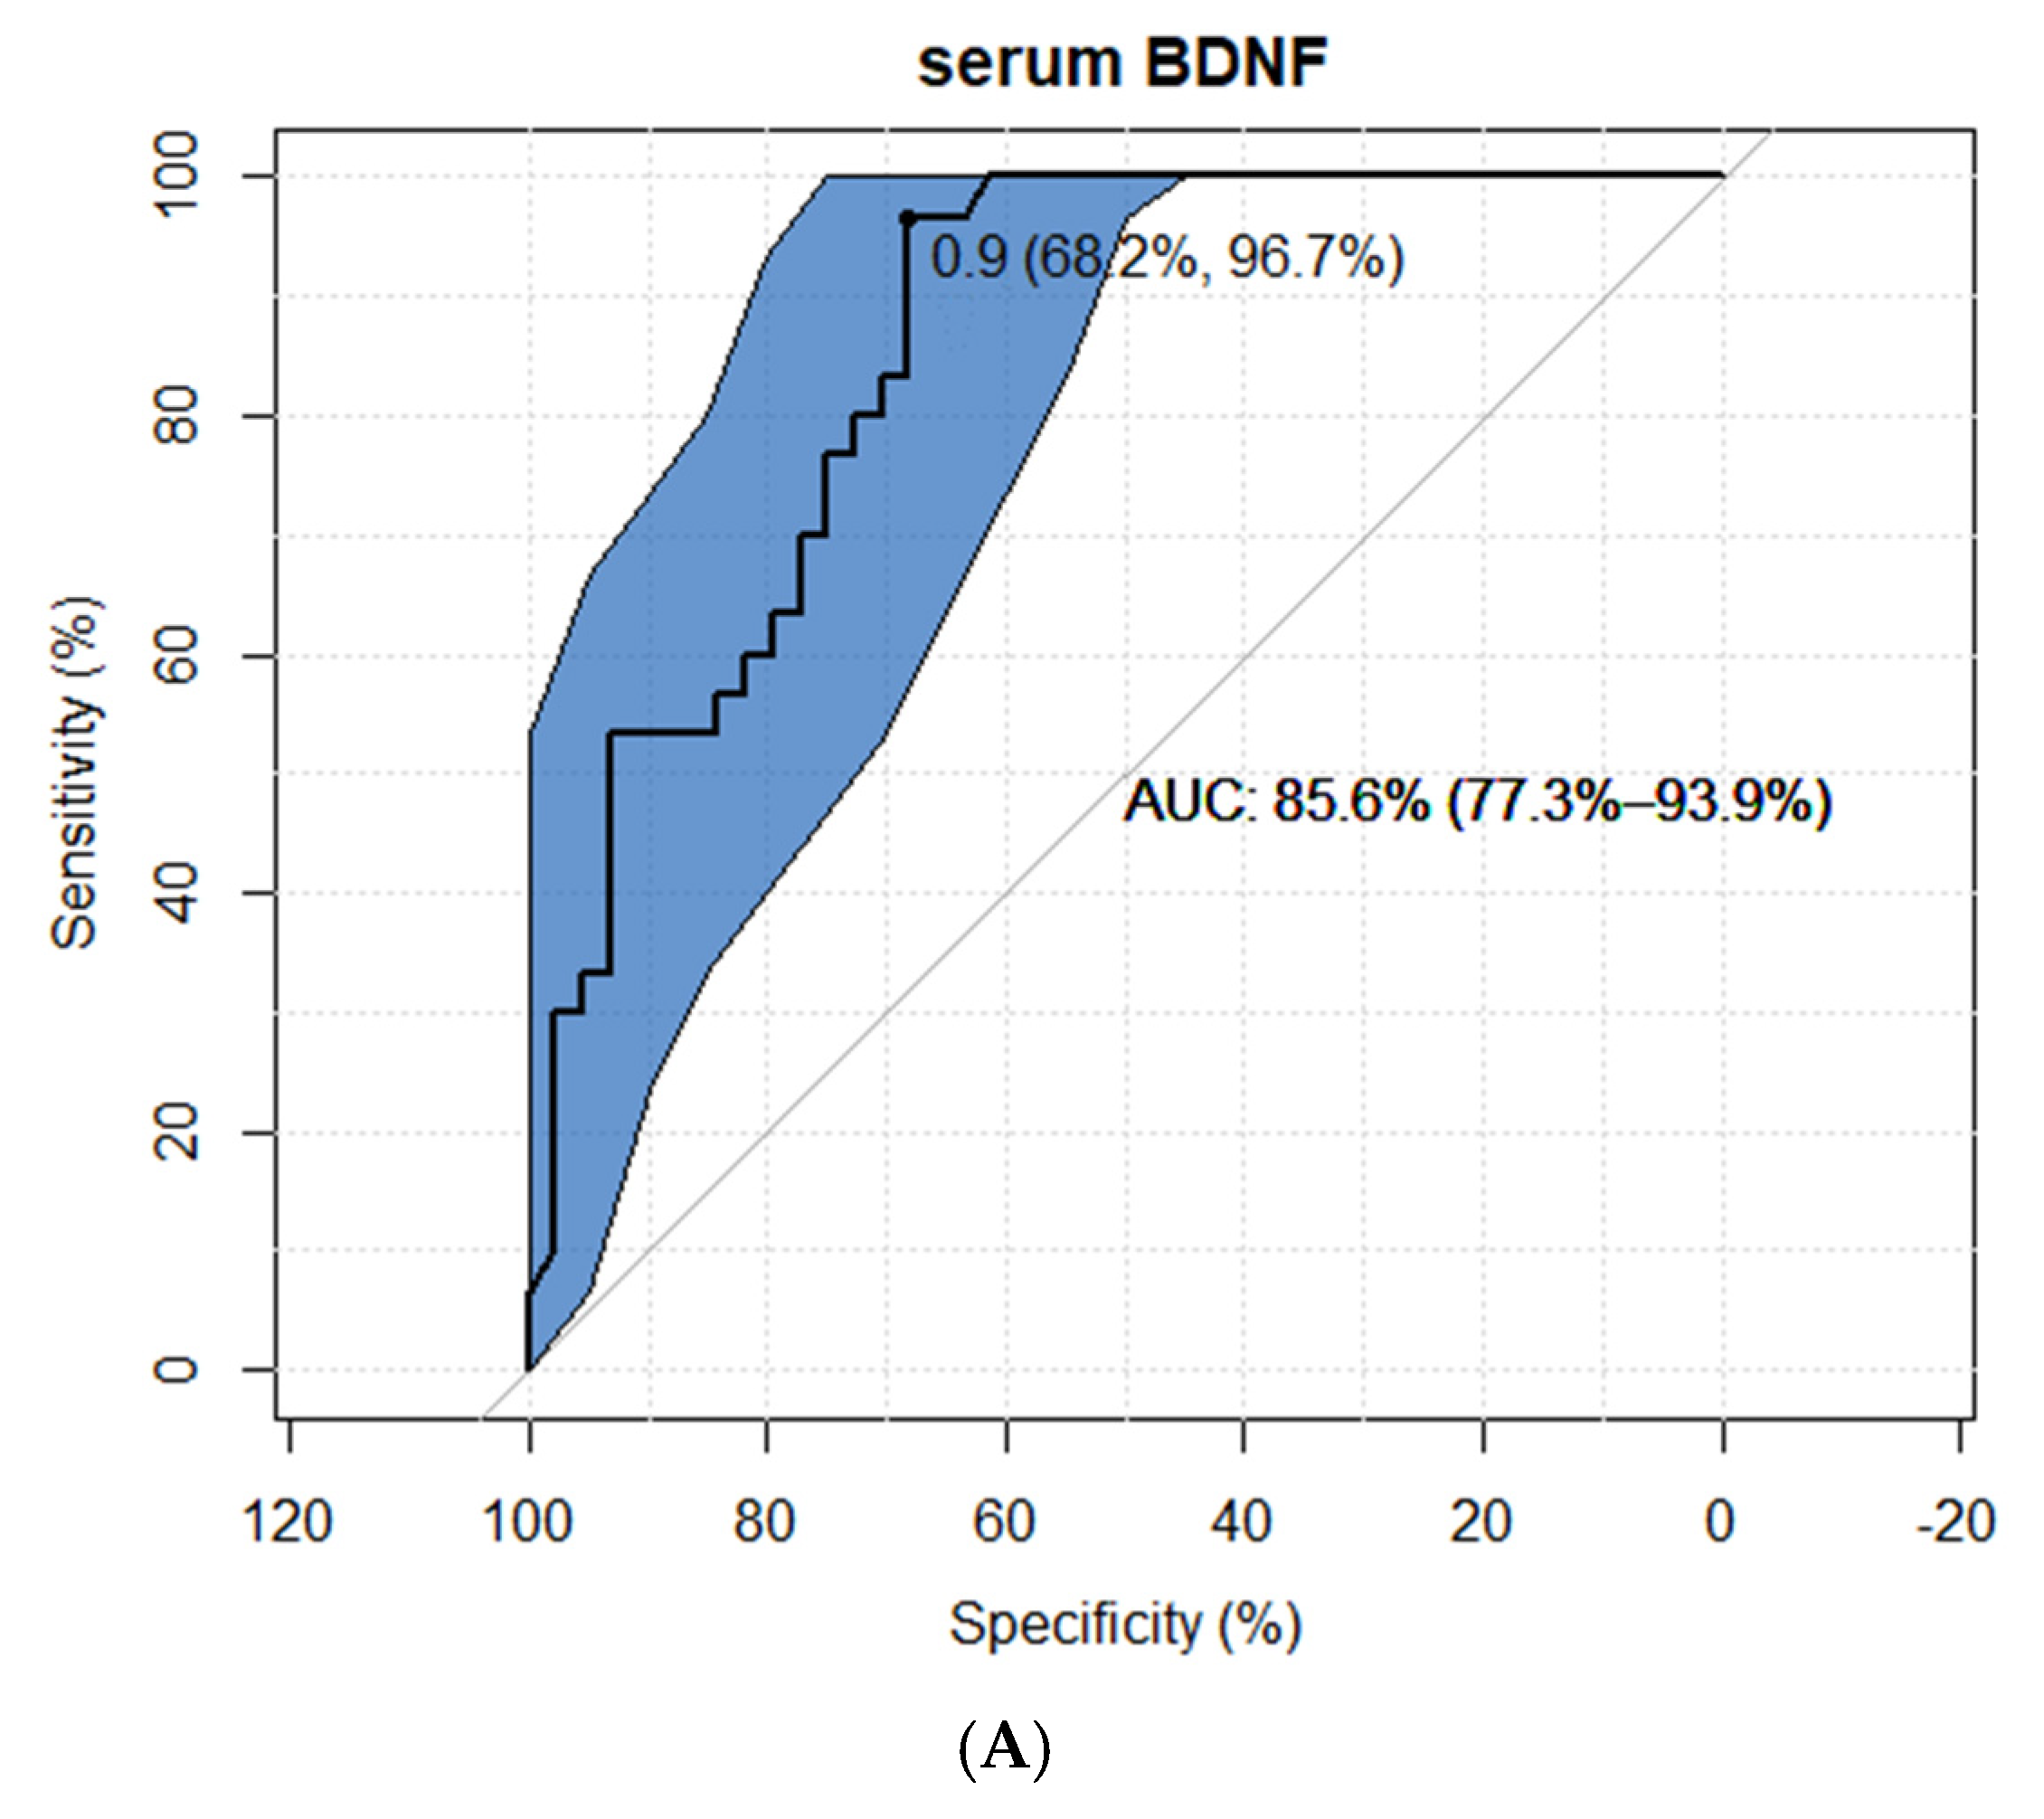
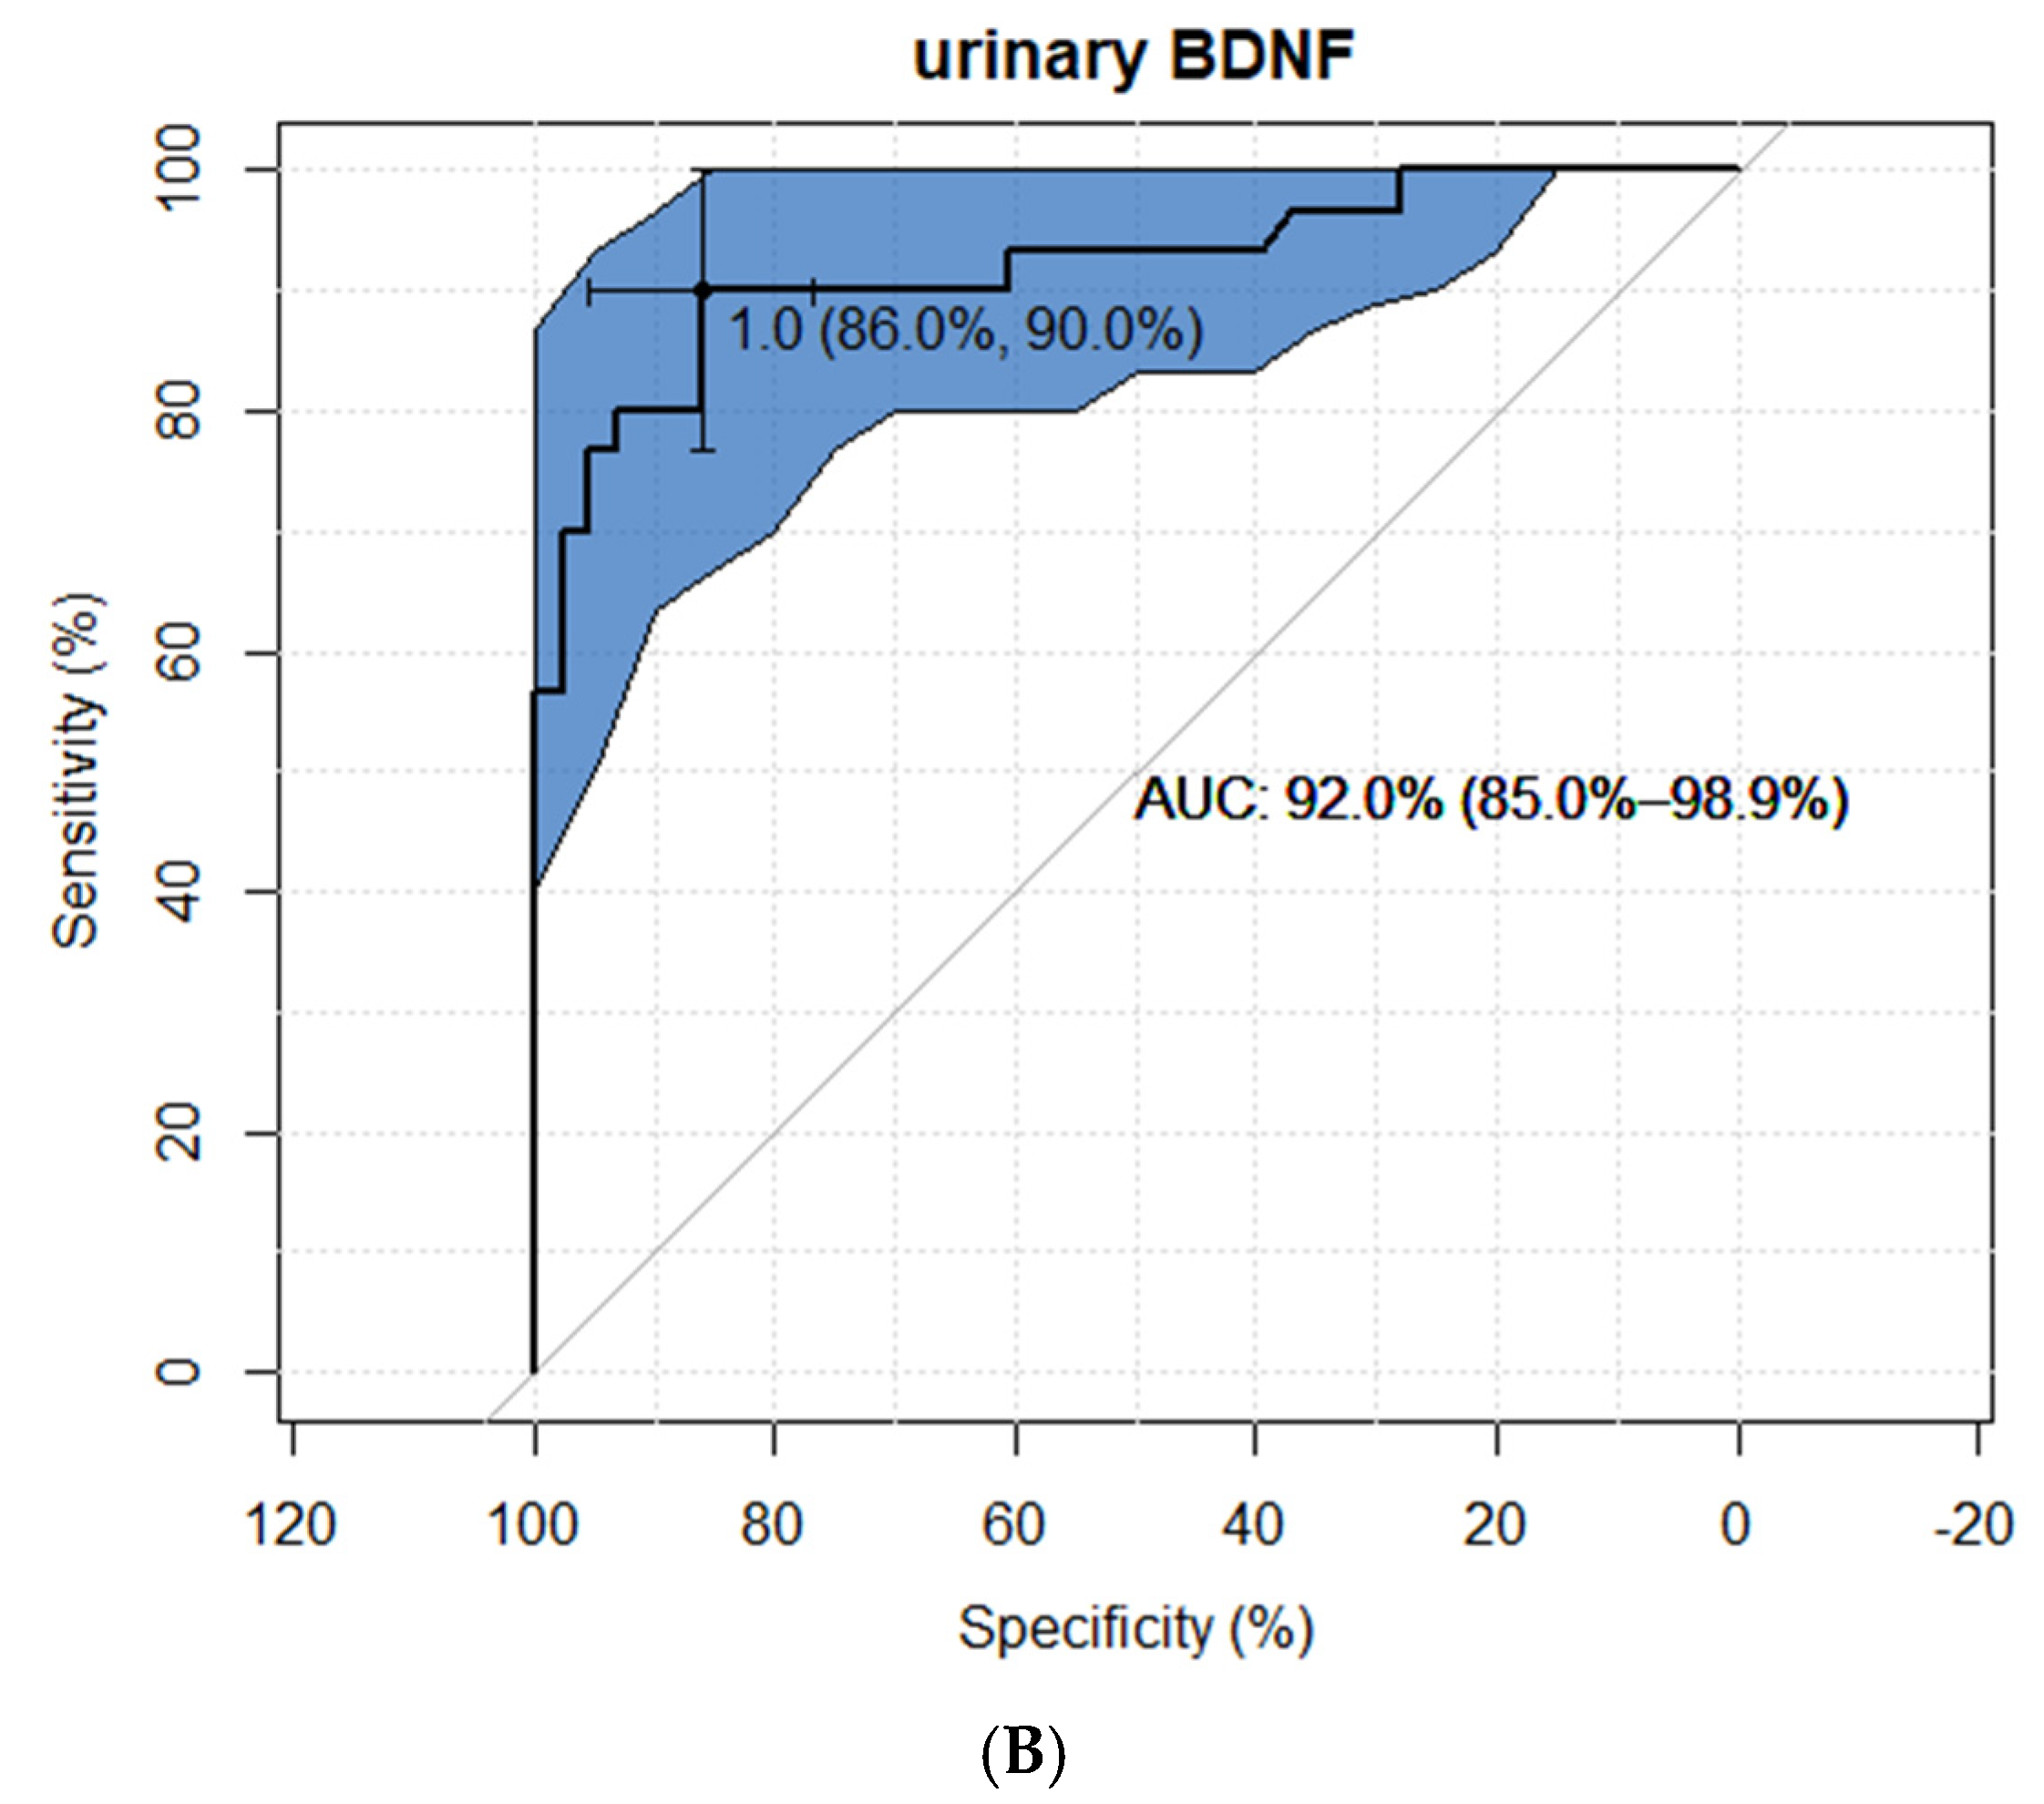
We assessed the possible usefulness of BDNF as an INS marker using the ROC curve. The suggested cut-off point for serum BDNF was established at 0.9 pg/mL, with the AUC at 86.5%. Additionally, the urine BDNF cut-off point reached 1.0 pg/mL with AUC at 92.0% (Figure 3).
Furthermore, there were no significant differences in serum or urine BDNF among INS patients treated with cyclosporine and those on other medication (Figure 4).
The general linear model showed a significant negative correlation between the concentration of BDNF in the blood serum and the intensity of proteinuria. On its basis, it was established that a 1 unit decrease in serum BDNF concentration increases the amount of protein in urine by 26 units. It proves more precisely that the concentration of BDNF in the serum is directly related to the intensity of proteinuria (Table 3). Other significant correlations were not detected.

3. Discussion

3.1. BDNF as an INS Marker

As mentioned before, diagnosis of INS is established based on nephrotic-range proteinuria, hypoalbuminemia and edema. Such characteristics are a consequence of the leakage of protein from the blood into the urine through damaged glomeruli. Therefore, we assume that the discovery of new markers for the disease is crucial.
In our study, we assessed BDNF as a potential marker for podocyte damage in serum and urine. Significantly lower serum concentrations of BDNF in the study group, in addition to higher urine levels, might suggest that the concentration of serum BDNF decreases in cases of kidney damage. Regarding the chosen treatment for INS, our study revealed that there is no substantial influence on BDNF concentrations during cyclosporine therapy.
Moreover, the prediction of the sensitivity and specificity of BDNF as a marker showed a promising outcome. The ROC models presented high AUC (85.6% for serum concentration and 92% for urine concentration), which means that it had a good measure of separability. However, the study group size in this study seemed to be a limitation for such conclusions; therefore, further assessments on larger groups of patients should be conducted.
Linear regression analysis proved that the concentration of BDNF in the serum is directly related to the intensity of proteinuria. We believe that BDNF may also serve as a predictor of urinary protein levels, especially among patients in remission, serving as an early detector of a relapse. Nevertheless, further research in this field is still required.

3.2. BDNF as a Potential Therapy for Damaged Podocytes

Actin is responsible for the shape and function of podocytes as the main cytoskeletal component of podocytes’ processes. During podocyte damage, many changes occur, such as a loss of stress fibers, cell rounding and shortening of branches in vitro, as well as clogging of the major process and the transformation of microvilli in vivo. These changes are related to the evolution of actin dynamics [26].
The dynamics and reorganization of actin filaments are regulated in time and space by numerous actin-binding proteins and upstream signaling molecules that collectively control the folding and unfolding of actin filaments [27].
Proteins from the actin depolymerization factor (ADF)/cophilin family play a key role in the reorganization of actin filaments. They stimulate the depolymerization of actin filaments [28]. Cophilin-1 is involved in the homeostasis of the podocyte foot process [29].
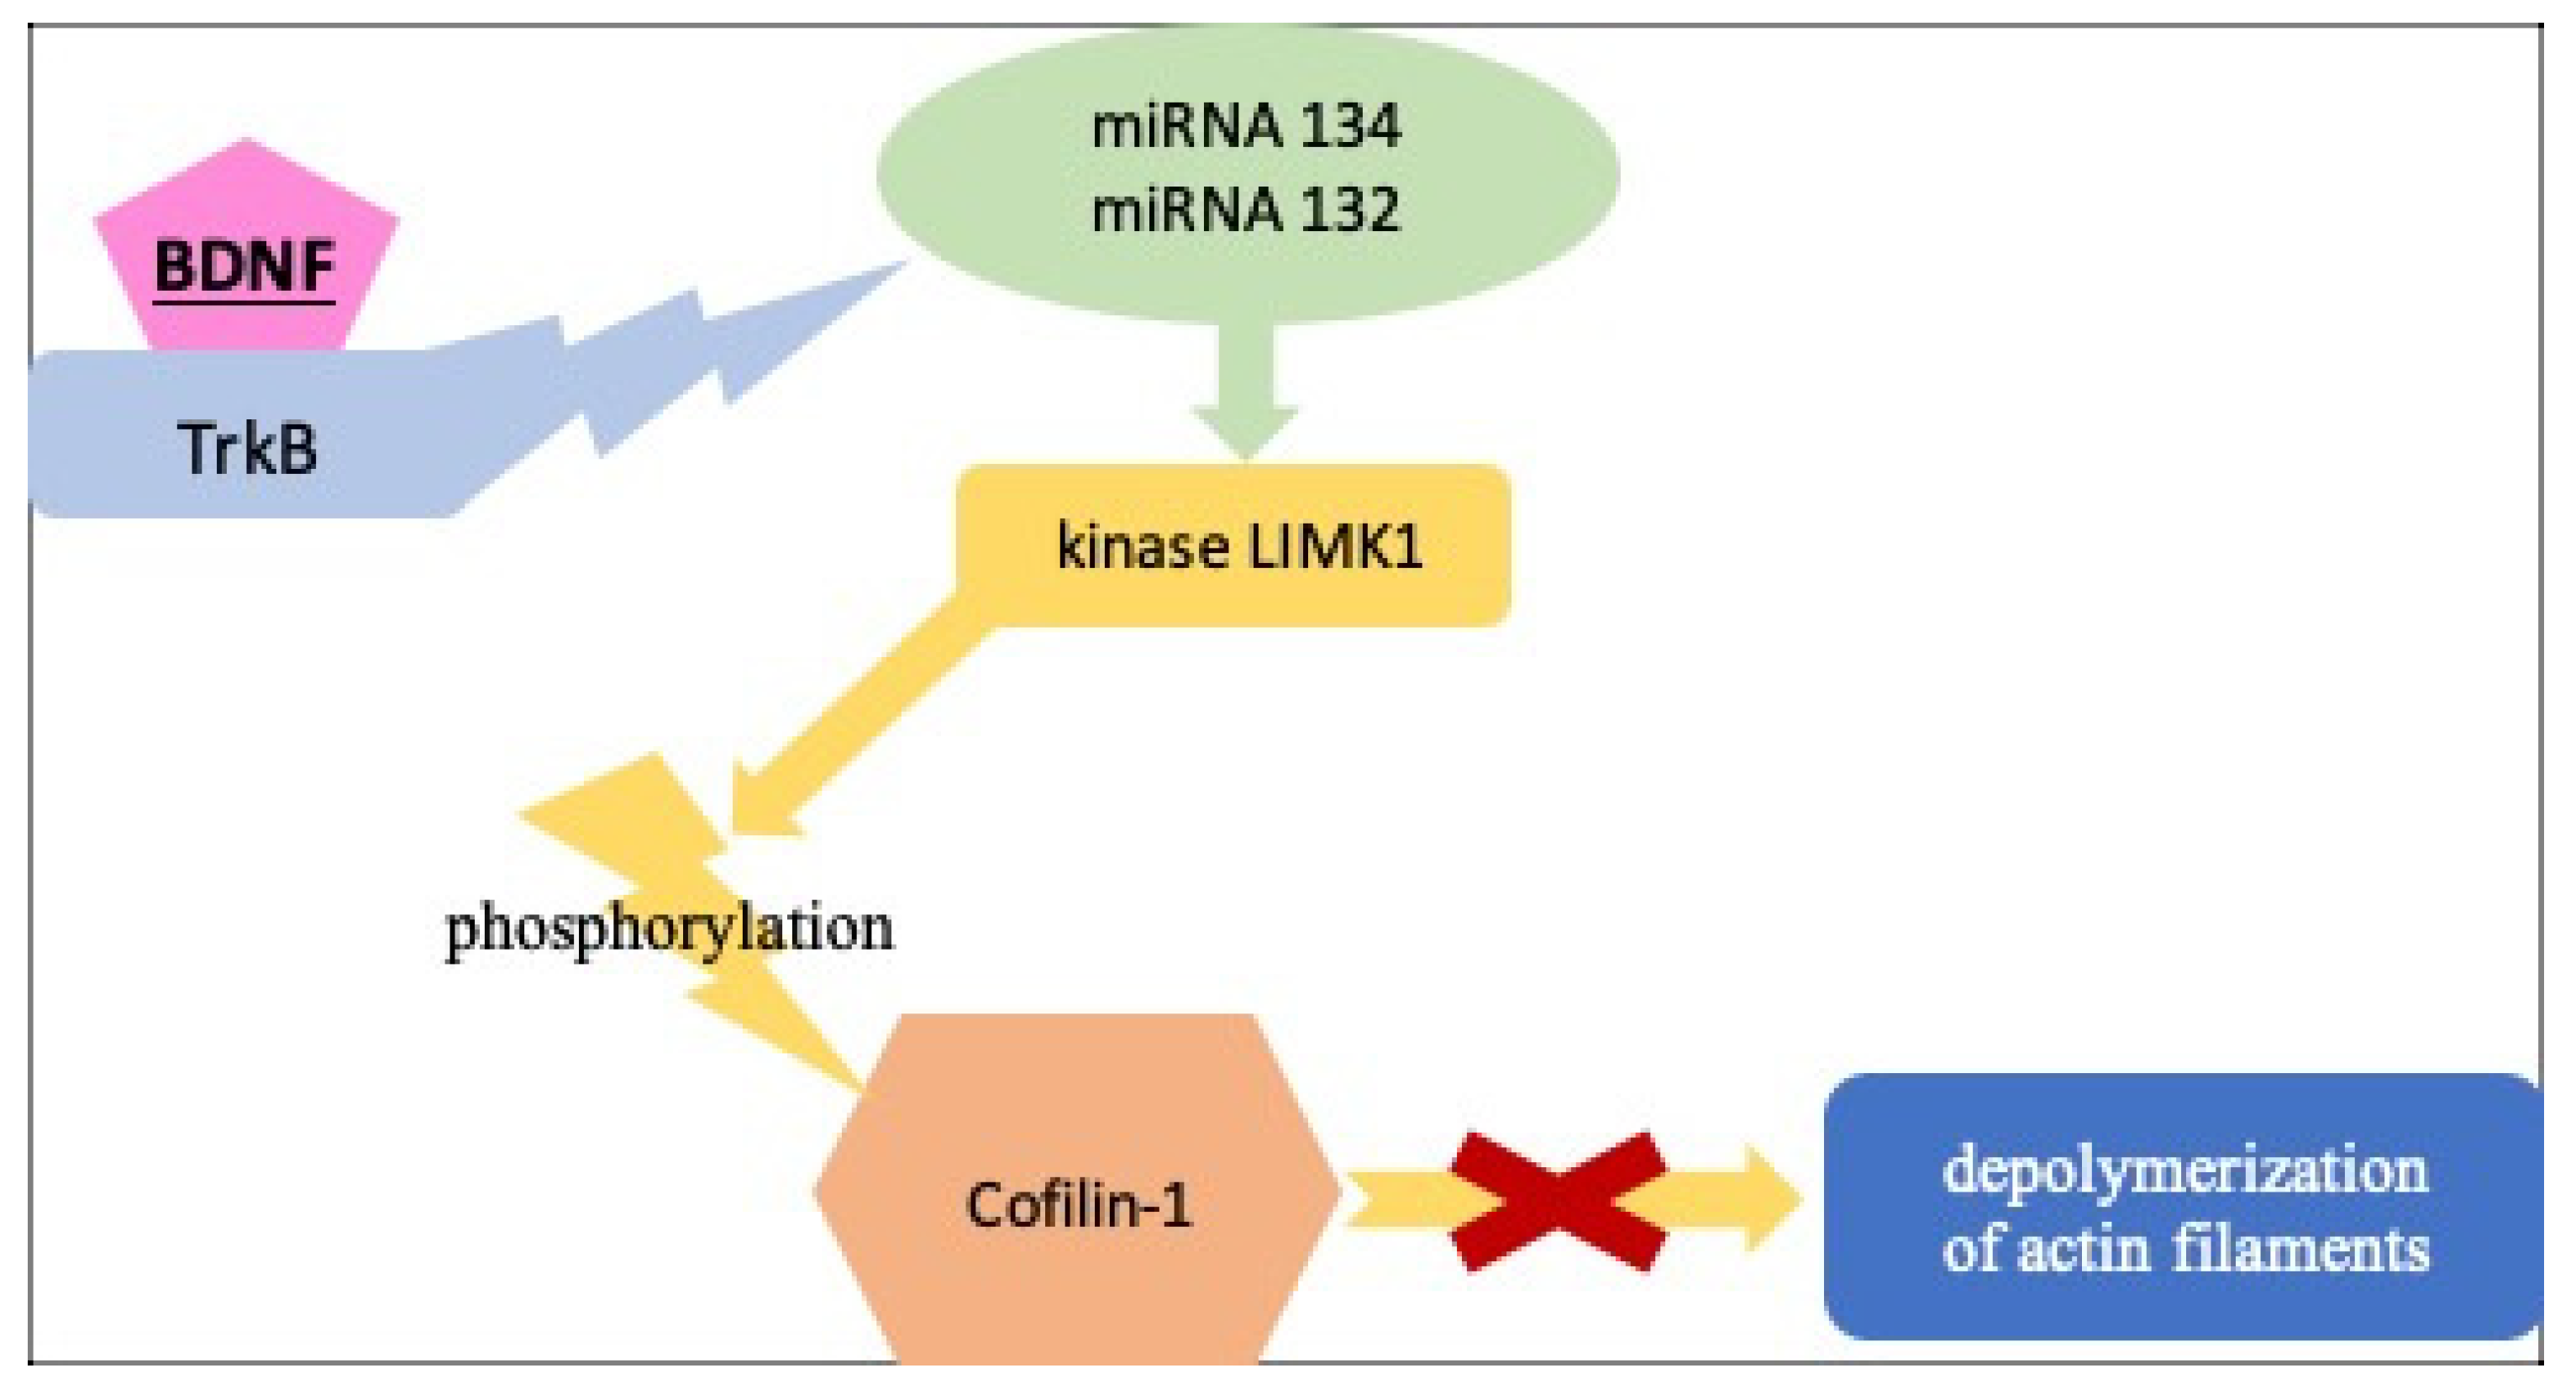
The phosphorylation of cofilin-1 leads to its inactivation, which, in turn, is mainly regulated by Limk1 kinase [30]. In dendritic spines, Limk1 is kept under the direct control of miRNA-132 and miRNA-134, which further confirms the similarities between the dynamics of the dendritic spine and the podocyte process [14] (Figure 5).
Li et al. posited the hypothesis that, in damaged podocytes, BDNF might contribute towards prolonging the podocyte processes, which contrasts with the flattening induced under nephrotic conditions both in vitro and in vivo, opening up a potential treatment option for damaged podocytes, especially in focal segmental glomerulosclerosis (FSGS) [14].
On the other hand, Hahn et al. performed one study which suggests a possible correlation between IgA nephropathy (IgAN) and single nucleotide polymorphisms (SNPs) of genes encoding BDNF, including BDNF rs11030104 (intron), BDNF rs7103411 (intron), BDNF rs7103873 (intron), and BDNF rs6484320 (intron). Such outcomes led to a conclusion that the abovementioned SNPs might contribute to a greater susceptibility for IgAN and the progression of disease, because they could affect the expression of the protein and its function [31]. Therefore, we might assume that genetic polymorphisms of BDNF might have various impacts on podocyte structure; broader research in this field is required.
The promising actin-trophic activity of BDNF encouraged us to conduct other several studies, where this potential was exploited as a treatment in several neurological diseases. Positive results were obtained in experimental models of neurological diseases [32,33,34]. However, in clinical trials, crossing the human blood–brain barrier by BDNF appeared to be a significant obstacle [35].
TrkB is also expressed by several types of neuronal, epithelial, and connective neoplastic cells [36]; therefore, it can be assumed that when trying to use BDNF as a drug in diseases with podocyte damage, it will be necessary to deliver BDNF targeted at podocytes, to increase its effectiveness and specificity.

4. Materials and Methods

4.1. Studied Groups—Characteristics, Laboratory Outcome and Anthropometric Measures

The study group included patients aged 2 to 17 years with a diagnosis of idiopathic nephrotic syndrome (n = 30) hospitalized in the Department of Pediatric Nephrology with the Subdivision of Dialysis at the Clinical Hospital No. 1 in Zabrze, Medical University of Silesia in Katowice in the period from December 2019 to December 2021.
Inclusion criteria for this group were as follows: confirmed diagnosis of INS, patient newly diagnosed or in relapse of underlying disease, children older than 3 months (to exclude congenital NS) and less than 18 years of age. The exclusion criteria comprised: non-nephrotic proteinuria, congenital NS and NS secondary to metabolic, infectious, vascular, malignant, and cardiac diseases.
Idiopathic nephrotic syndrome was diagnosed on the basis of the Recommendations of Polish Society for Pediatric Nephrology dedicated to the management of the child with nephrotic syndrome from 2015 [37]. The medical history included information on the medications used, the recurrence of underlying disease, and the coexistence of comorbidities.
The control group (n = 44) consisted of patients hospitalized in the same period in the Department of Pediatric Nephrology with the Subdivision of Dialysis due to bedwetting or visiting the Department of Surgery of Child Developmental Defects and Traumatology of the Clinical Hospital No.1 in Zabrze, Medical University of Silesia in Katowice in order to undergo procedures as part of one-day surgery. These patients were not diagnosed with chronic diseases nor infectious diseases, and their kidney function was normal.
This research project was approved by the Ethics Committee of the Medical University of Silesia in Katowice (PCN/0022/KB1/133/19). Written informed consent was obtained from caregivers of all the children and, in cases where participants were older than 16 years, also from the child.
The children underwent complete blood count and biochemical tests (serum urea, serum creatinine, serum uric acid, cholesterol level, level of triglycerides, total serum protein concentration, blood ionogram, blood gas test, and urinalysis). The estimated glomerular filtration rate (eGFR) was calculated using the classic Schwartz formula, taking into account the age-appropriate k-coefficient [mL/min/1.73 m2].
BDNF concentration in blood serum and urine was detected with ELISA test using the Cloud-Clone (USA)—Human BDNF kit, catalog number SEAO11Hu. The analytical procedure was in accordance with the technological instructions included in the kit by the manufacturer. Absorbance readings were taken on a SYNERGY/H1 reader (BioTek, Santa Clara, CA, USA) at a wavelength of 450 nm using a 620 nm reference wavelength. Elaboration of the results was performed using the Gen5 v 3.05 computer program (BioTek, Santa Clara, CA, USA). The sensitivity of the method reached 11.7 pg/mL. The precision of the method in the simultaneous series (imprecision) was 3.8%.
In all studied children, anthropometric parameters (weight, height) and blood pressure were determined. Weight was given in kilograms (with 0.01 kg precision), and height was measured with 0.01 cm precision using a standardized stadiometer. Based on such data for each patient, the body mass index (BMI) was calculated (using the equation: weight/height2 (kg/m2)).
Weight, height, BMI and blood pressure were plotted for age and sex using the percentile charts as a result of the OLA and OLAF trials (estimated for polish children population) [38,39].
To compare blood pressure, body weight, BMI, and height between different groups of children, SDS values for systolic and diastolic blood pressure, body weight, BMI and height were calculated.
There were no missing data in the collected groups.

4.2. Statistical Analysis

Statistical analysis was performed using R Studio software. Descriptive statistics were presented using means with standard deviation and medians with quartile range. Normal distribution was assessed using the Shapiro–Wilk test. The assessment of the homogeneity of variance was performed using the Levene’s test. The Pearson correlation coefficient was used to assess the correlation between the parameters. In the comparative analysis between the parameters of the control group and the study group, the t-test for independent variables was used. The usefulness of the tested proteins as disease markers was assessed through the ROC curve using the bootstrap method to determine cutoff point and 95% confidence interval.
p values < 0.05 were considered statistically significant. For more precise assessments of the association between BDNF and proteinuria, general linear modeling was performed to detect potential correlations between the severity of proteinuria and the concentration of BDNF in serum, taking into account the age and sex of the patient. Autocorrelation was assessed using the Durbin–Watson test.

5. Conclusions

Our study shows that serum BDNF concentrations decrease in groups of patients with INS, compared with healthy controls. Such outcomes might be related to the loss of the BDNF contribution in podocyte structure maintenance. Moreover, according to our study outcome, we describe the possible use of BDNF as a predictor of urine protein concentration increase. These observations encourage further clinical studies on BDNF as an INS early diagnosis marker, as well as a potential remedy for damaged podocytes.

Author Contributions

Conceptualization, A.B., A.M.-K. and M.S.; Data curation, A.B., M.B., E.Ś. and A.D.; Formal analysis, E.Ś. and A.D.; Investigation, A.B. and A.D.; Methodology, A.B. and E.Ś.; Project administration, A.B.; Resources, M.S.; Supervision, A.M.-K. and M.S.; Validation, A.M.-K. and M.S.; Visualization, A.B. and M.S.; Writing—original draft, A.B. and M.B.; Writing—review & editing, M.B. and M.S. All authors have read and agreed to the published version of the manuscript.

Funding

This research was funded by Medical University of Silesia, grant number PCN-1-193/N/9/K. The APC was funded by Medical University of Silesia as well.

Institutional Review Board Statement

The study was conducted according to the guidelines of the Declaration of Helsinki, and approved by the Ethics Committee of Medical University of Silesia in Katowice (PCN/0022/KB1/133/19, 03.12.2019r.).

Informed Consent Statement

Informed consent was obtained from all subjects involved in the study.

Data Availability Statement

The data presented in this study are available on request from the corresponding author. The data are not publicly available due to privacy issues.

Conflicts of Interest

The authors declare no conflict of interest. The funders had no role in the design of the study; in the collection, analyses, or interpretation of data; in the writing of the manuscript, or in the decision to publish the results.

References

  1. Noone, D.G.; Iijima, K.; Parekh, R. Idiopathic nephrotic syndrome in children. Lancet 2018, 392, 61–74. [Google Scholar] [CrossRef]
  2. Downie, M.L.; Gallibois, C.; Parekh, R.S.; Noone, D.G. Nephrotic syndrome in infants and children: Pathophysiology and management. Paediatr. Int. Child Health 2017, 37, 248–258. [Google Scholar] [CrossRef] [PubMed]
  3. Szczepańska, M.; Bałasz-Chmielewska, I.; Grenda, R.; Musiał, K.; Ogarek, I.; Pańczyk-Tomaszewska, M.; Zachwieja, J.; Żurowska, A. The Polish Society for Pediatric Nephrology (PTNFD) recommendations on the management of children with nephrotic syndrome. Ren. Dis. Transplant. Forum 2022, 15, 36–57. [Google Scholar]
  4. Koskimies, O.; Vilska, J.; Rapola, J.; Hallman, N. Long-term outcome of primary nephrotic syndrome. Arch. Dis. Child. 1982, 57, 544–548. [Google Scholar] [CrossRef] [PubMed] [Green Version]
  5. Tarshish, P.; Tobin, J.N.; Bernstein, J.; Edelmann, C.M., Jr. Prognostic significance of the early course of minimal change nephrotic syndrome: Report of the International Study of Kidney Disease in Children. J. Am. Soc. Nephrol. 1997, 8, 769–776. [Google Scholar] [CrossRef] [PubMed]
  6. Ruth, E.M.; Kemper, M.J.; Leumann, E.P.; Laube, G.F.; Neuhaus, T.J. Children with steroid-sensitive nephrotic syndrome come of age: Long-term outcome. J. Pediatr. 2005, 147, 202–207. [Google Scholar] [CrossRef]
  7. Lewis, M.A.; Baildom, E.M.; Davis, N.; Houston, I.B.; Postlethwaite, R.J. Nephrotic syndrome: From toddlers to twenties. Lancet 1989, 33, 255–259. [Google Scholar] [CrossRef]
  8. Fakhouri, F.; Bocquet, N.; Taupin, P.; Presne, C.; Gagnadoux, M.-F.; Landais, P.; Lesavre, P.; Chauveau, D.; Knebelmann, B.; Broyer, M.; et al. Steroid-sensitive nephrotic syndrome: From childhood to adulthood. Am. J. Kidney Dis. 2003, 41, 550–557. [Google Scholar] [CrossRef]
  9. Skrzypczyk, P.; Pańczyk-Tomaszewska, M.; Roszkowska-Blaim, M.; Wawer, Z.; Bieniaś, B.; Zajączkowska, M.; Pstrusińska, K.K.; Jakubowska, A.; Szczepaniak, M.; Pawlak-Bratkowska, M.; et al. Long-term outcomes in idiopathic nephrotic syndrome: From childhood to adulthood. Clin. Nephrol. 2014, 81, 166–173. [Google Scholar] [CrossRef] [PubMed]
  10. Mendonca, A.C.; Oliveira, E.A.; Froes, B.P.; Faria, L.D.C.; Pinto, J.S.; Nogueira, M.M.I.; Lima, G.O.; Resende, P.I.; Assis, N.S.; Silva, A.C.S.E.; et al. A predictive model of progressive chronic kidney disease in idiopathic nephrotic syndrome. Pediatr. Nephrol. 2015, 30, 2011–2020. [Google Scholar] [CrossRef]
  11. Gipson, D.S.; Chin, H.; Presler, T.P.; Jennette, C.; de Ferris, M.E.D.-G.; Massengill, S.; Gibson, K.; Thomas, D.B. Differential risk of remission and ESRD in childhood FSGS. Pediatr. Nephrol. 2006, 21, 344–349. [Google Scholar] [CrossRef]
  12. Pavenstädt, H.; Kriz, W.; Kretzler, M. Cell biology of the glomerular podocyte. Physiol. Rev. 2003, 83, 253–307. [Google Scholar] [CrossRef] [PubMed] [Green Version]
  13. Mundel, P.; Kriz, W. Structure and function of podocytes: An update. Anat. Embryol. 1995, 192, 385–397. [Google Scholar] [CrossRef] [PubMed]
  14. Li, M.; Armelloni, S.; Zennaro, C.; Wei, C.; Corbelli, A.; Ikehata, M.; Berra, S.; Giardino, L.; Mattinzoli, D.; Watanabe, S.; et al. BDNF repairs podocyte damage by microRNA-mediated increase of actin polymerization. J. Pathol. 2015, 235, 731–744. [Google Scholar] [CrossRef] [PubMed] [Green Version]
  15. Putaala, H.; Soininen, R.; Kilpeläinen, P.; Wartiovaara, J.; Tryggvason, K. The murine nephrin gene is specifically expressed in kidney, brain and pancreas: Inactivation of the gene leads to massive proteinuria and neonatal death. Hum. Mol. Genet. 2001, 10, 1–8. [Google Scholar] [CrossRef]
  16. Deller, T.; Mundel, P.; Frotscher, M. Potential role of synaptopodin in spine motility by coupling actin to the spine apparatus. Hippocampus 2000, 10, 569–581. [Google Scholar] [CrossRef]
  17. Sala, C.; Segal, M. Dendritic spines: The locus of structural and functional plasticity. Physiol. Rev. 2014, 94, 141–188. [Google Scholar] [CrossRef]
  18. Reiser, J.; Sever, S. Podocyte biology and pathogenesis of kidney disease. Annu. Rev. Med. 2013, 64, 357–366. [Google Scholar] [CrossRef] [Green Version]
  19. Greka, A.; Mundel, P. Cell biology and pathology of podocytes. Annu. Rev. Physiol. 2012, 74, 299–323. [Google Scholar] [CrossRef] [PubMed] [Green Version]
  20. Yamamoto, M.; Sobue, G.; Yamamoto, K.; Terao, S.; Mitsuma, T. Expression of mRNAs for neurotrophic factors (NGF, BDNF, NT-3, and GDNF) and their receptors (p75NGFR, TrkA, TrkB, and TrkC) in the adult human peripheral nervous system and nonneural tissues. Neurochem. Res. 1996, 21, 929–938. [Google Scholar] [CrossRef] [PubMed]
  21. De Girolamo, P.; Arcamone, N.; Lucini, C.; Simeoli, M.P.; Castaldo, L.; Gargiulo, G. TRK neurotrophin receptor-like proteins in the kidney of frog (Rana esculenta) and lizard (Podarcis sicula): An immunohistochemical study. Anat. Embryol. 2004, 207, 481–487. [Google Scholar] [CrossRef] [PubMed]
  22. Shibayama, E.; Koizumi, H. Cellular localization of the Trk neurotrophin receptor family in human non-neuronal tissues. Am. J. Pathol. 1996, 148, 1807–1818. [Google Scholar]
  23. García-Suárez, O.; González-Martínez, T.; Germana, A.; Monjil, D.F.; Torrecilla, J.R.; Laurà, R.; Silos-Santiago, I.; Guate, J.L.; Vega, J.A. Expression of TrkB in the murine kidney. Microsc. Res. Tech. 2006, 69, 1014–1020. [Google Scholar] [CrossRef] [PubMed]
  24. Sawai, H.; Clarke, D.B.; Kittlerova, P.; Bray, G.M.; Aguayo, A.J. Brain-derived neurotrophic factor and neurotrophin-4/5 stimulate growth of axonal branches from regenerating retinal ganglion cells. J. Neurosci. 1996, 16, 3887–3894. [Google Scholar] [CrossRef] [PubMed] [Green Version]
  25. Horch, H.W.; Katz, L.C. BDNF release from single cells elicits local dendritic growth in nearby neurons. Nat. Neurosci. 2002, 5, 1177–1184. [Google Scholar] [CrossRef] [PubMed]
  26. Faul, C.; Asanuma, K.; Yanagida-Asanuma, E.; Kim, K.; Mundel, P. Actin up: Regulation of podocyte structure and function by components of the actin cytoskeleton. Trends Cell Biol. 2007, 17, 428–437. [Google Scholar] [CrossRef] [PubMed]
  27. Theriot, J.A. Regulation of the actin cytoskeleton in living cells. Semin. Cell Dev. Biol. 1994, 5, 193–199. [Google Scholar] [CrossRef] [PubMed]
  28. Mizuno, K. Signaling mechanisms and functional roles of cofilin phosphorylation and dephosphorylation. Cell Signal. 2013, 25, 457–469. [Google Scholar] [CrossRef] [PubMed]
  29. Garg, P.; Verma, R.; Cook, L.; Soofi, A.; Venkatareddy, M.; George, B.; Mizuno, K.; Gurniak, C.; Witke, W.; Holzman, L. Actin-depolymerizing factor cofilin-1 is necessary in maintaining mature podocyte architecture. J. Biol. Chem. 2010, 285, 22676–22688. [Google Scholar] [CrossRef] [PubMed] [Green Version]
  30. Scott, R.W.; Olson, M.F. LIM kinases: Function, regulation and association with human disease. J. Mol. Med. 2007, 85, 555–568. [Google Scholar] [CrossRef] [PubMed]
  31. Hahn, W.H.; Suh, J.S.; Cho, B.S. Linkage and association study of neurotrophins and their receptors as novel susceptibility genes for childhood IgA nephropathy. Pediatr. Res. 2011, 69, 299–305. [Google Scholar] [CrossRef] [PubMed] [Green Version]
  32. Han, B.H.; Holtzman, D.M. BDNF protects the neonatal brain from hypoxic–ischemic injury in vivo via the ERK pathway. J. Neurosci. 2000, 20, 5775–5781. [Google Scholar] [CrossRef] [PubMed]
  33. Arancibia, S.; Silhol, M.; Moulière, F.; Meffre, J.; Höllinger, I.; Maurice, T.; Tapia-Arancibia, L. Protective effect of BDNF against beta-amyloid induced neurotoxicity in vitro and in vivo in rats. Neurobiol. Dis. 2008, 31, 316–326. [Google Scholar] [CrossRef] [PubMed]
  34. Nagahara, A.H.; Merrill, D.A.; Coppola, G.; Tsukada, S.; Schroeder, B.E.; Shaked, G.M.; Wang, L.; Blesch, A.; Kim, A.; Conner, J.M.; et al. Neuroprotective effects of brain-derived neurotrophic factor in rodent and primate models of Alzheimer’s disease. Nat. Med. 2009, 15, 331–337. [Google Scholar] [CrossRef] [PubMed] [Green Version]
  35. Lu, B.; Nagappan, G.; Guan, X.; Nathan, P.J.; Wren, P. BDNF-based synaptic repair as a disease-modifying strategy for neurodegenerative diseases. Nat. Rev. Neurosci. 2013, 14, 401–416. [Google Scholar] [CrossRef]
  36. Thiele, C.J.; Li, Z.; McKee, A.E. On Trk—The TrkB signal transduction pathway is an increasingly important target in cancer biology. Clin. Cancer Res. 2009, 15, 5962–5967. [Google Scholar] [CrossRef] [PubMed]
  37. Ziółkowska, H.; Bałasz-Chmielewska, I.; Grenda, R.; Musiał, K.; Ogarek, I.; Szczepańska, M.; Zachwieja, J.; Żurowska, A. Recommendations of Polish Society Paediatric Nephrology for the management of the child with nephrotic syndrome. Forum Nefrol. 2015, 8, 238–256. Available online: https://journals.viamedica.pl/renal_disease_and_transplant/article/view/44383/34544 (accessed on 11 October 2022).
  38. Kułaga, Z.; Różdżyńska, A.; Palczewska, I.; Grajda, A.; Gurzkowska, B.; Napieralska, E.; Litwin, M. Percentile charts of height, body mass and body mass index in children and adolescents in Poland—Results of the OLAF study. Stand. Med. Pediatr. 2010, 7, 690–700. [Google Scholar]
  39. Kułaga, Z.; Litwin, M.; Grajda, A.; Gurzkowska, B.; Napieralska, E.; Kułaga, K. Distribution of blood pressure in school-aged children and adolescents reference population. Stand. Med. Pediatr. 2010, 7, 100–111. [Google Scholar]
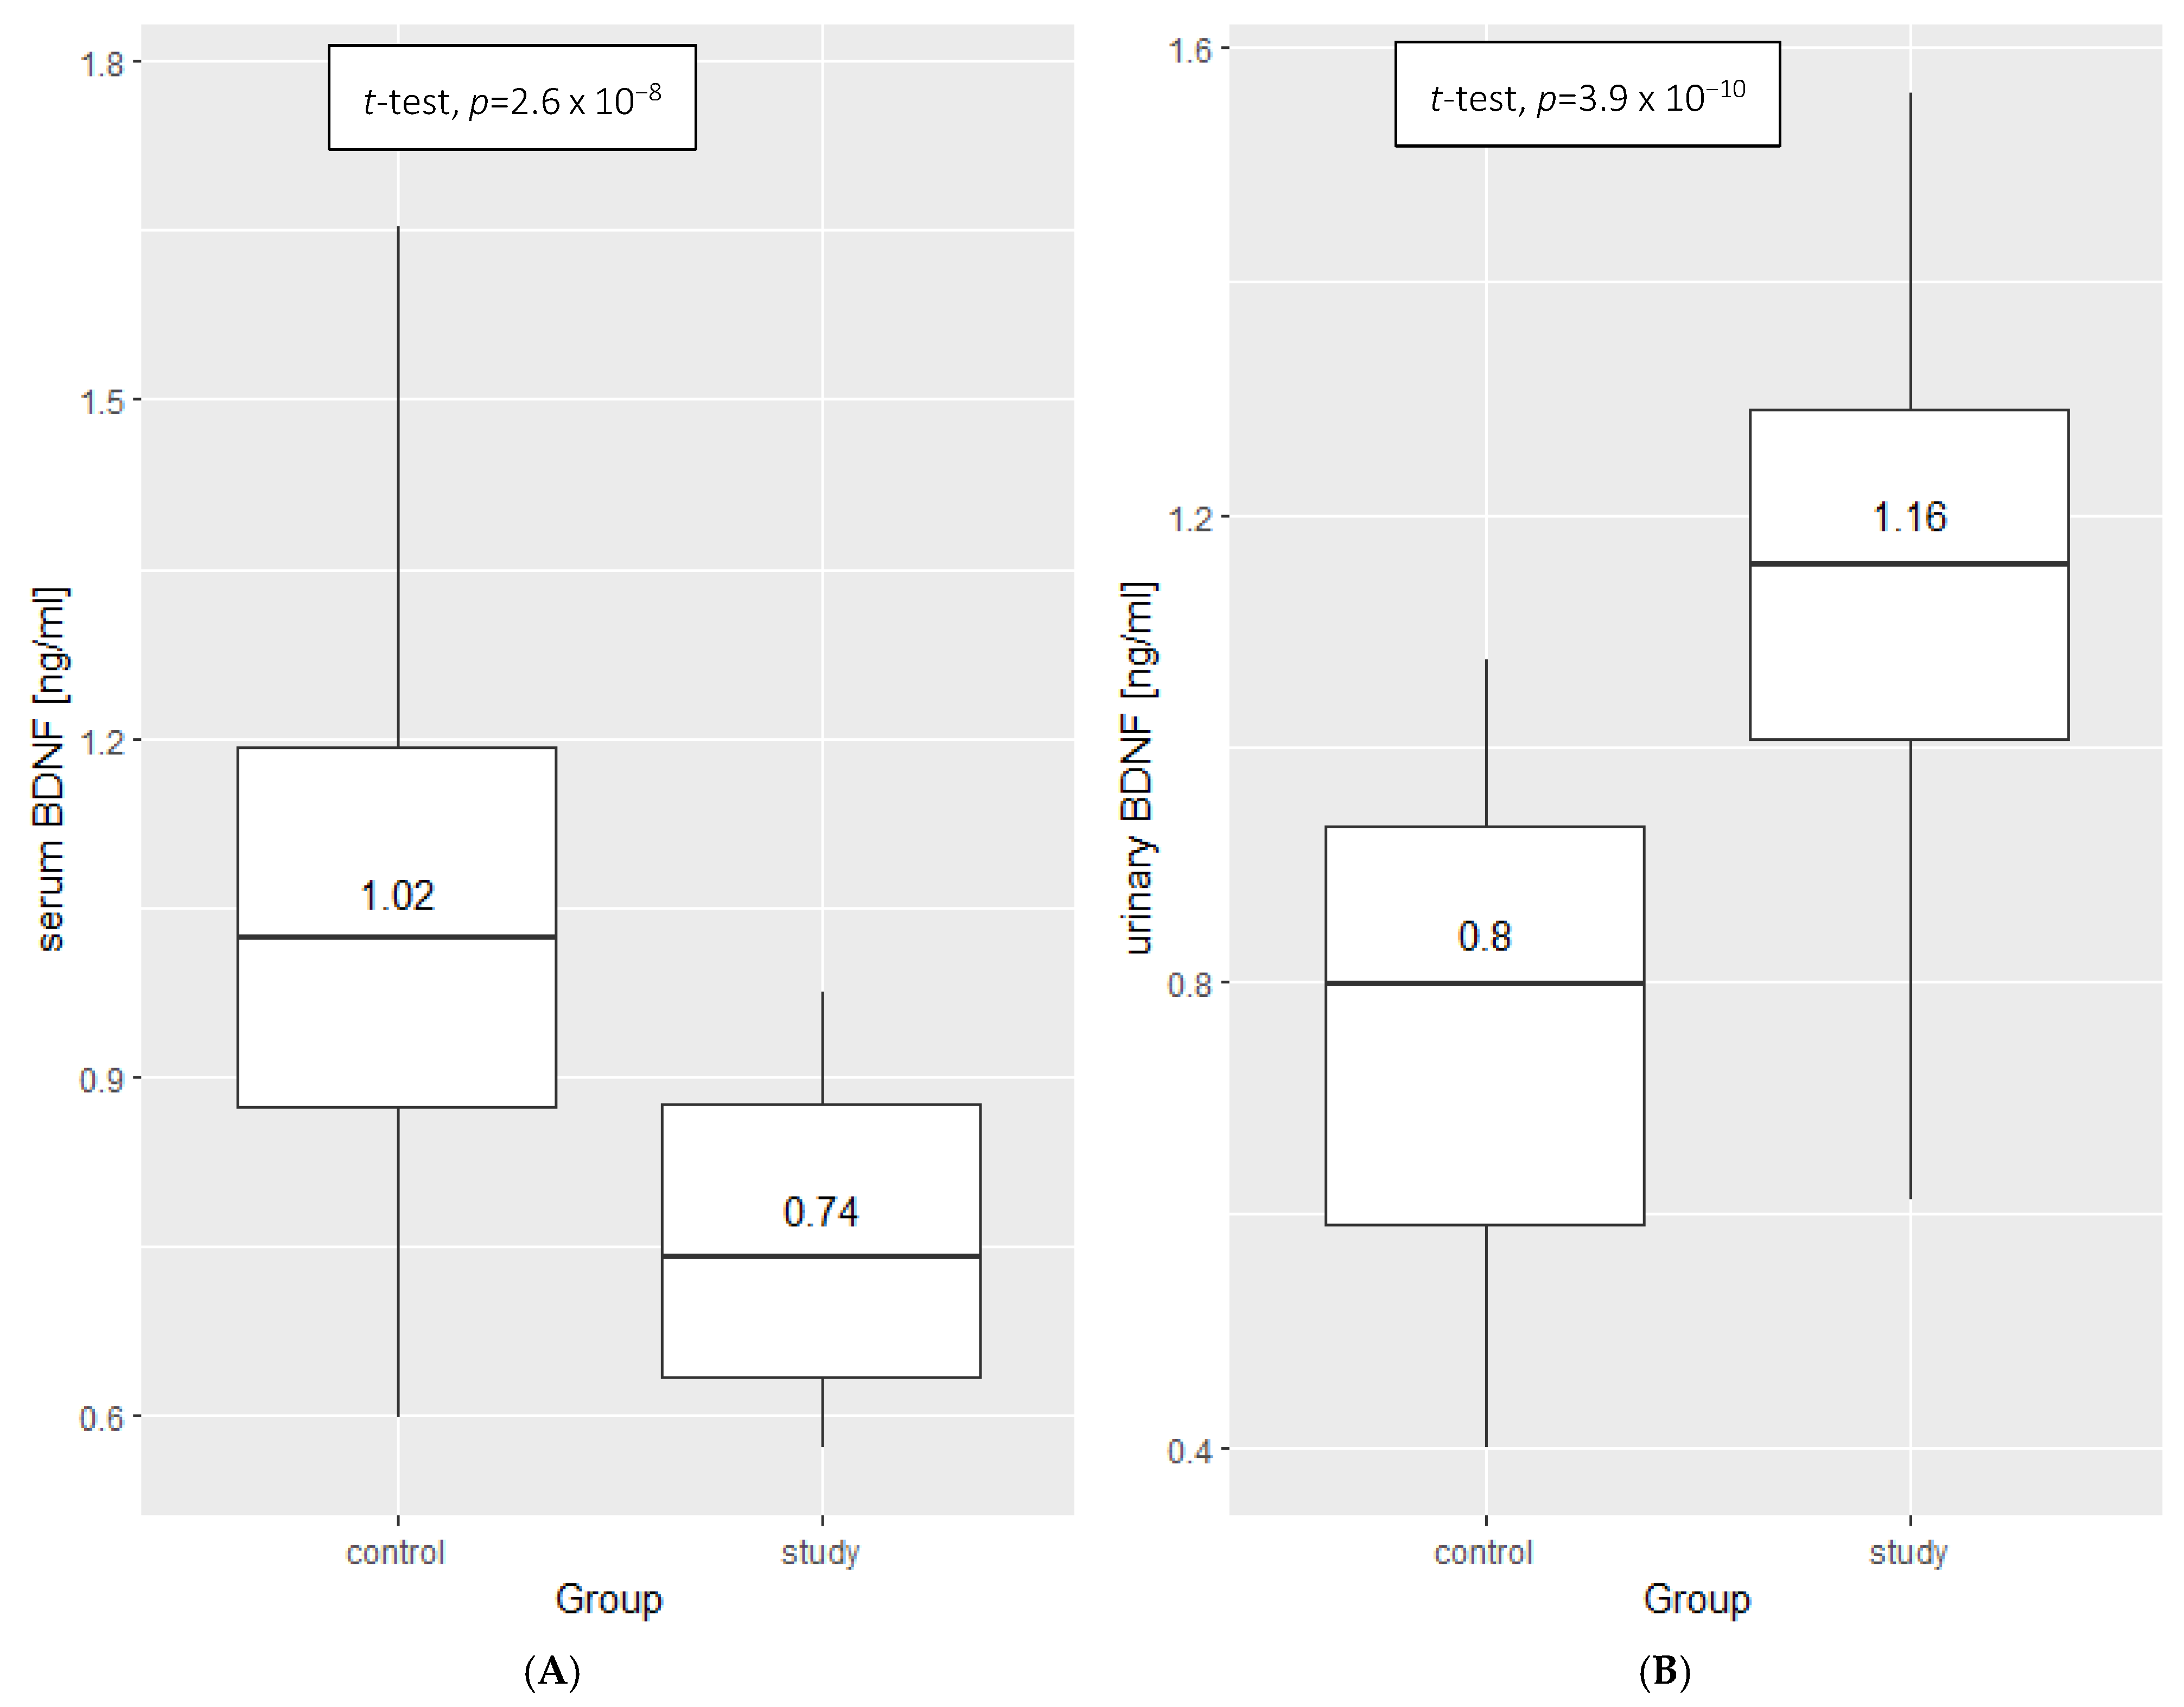
Figure 1. Comparison of BDNF concentration in serum (A) and urine (B) between the control group and the study group (Student’s t-test for independent samples). Additional data: mean ± standard deviation—(A): control: 1.02 ± 1.06, study: 0.74 ± 0.76; (B): control: 0.80 ± 0.77, study: 1.16 ± 1.14.
Ijms 23 12312 g001
Figure 2. Correlations between the concentration of BDNF in the serum and urine, taking into account the division into the study group and the control group (R-Pearson’s correlation coefficient).
Ijms 23 12312 g002
Figure 3. The assessment of usefulness of BDNF as an INS marker in serum (A) and urine (B) (ROC curve)—study group.
Ijms 23 12312 g003aIjms 23 12312 g003b
Figure 4. The comparison of BDNF concentration in the study group in serum (A) and urine (B) between the patients treated with cyclosporine (yes) and treated with other medicine (no), (Student’s t-test for independent samples).
Ijms 23 12312 g004
Figure 5. The role of BDNF in actin polymerization (based on [14,28,29,30]); BDNF—brain-derived neurotrophic factor, TrkB—Tropomyosin receptor kinase B, LIMK1—LIM Domain Kinase 1.
Ijms 23 12312 g005
Table 1. Characteristics of the groups—selected anthropometric and laboratory parameters.
ParameterChildren with Idiopathic Nephrotic Syndrome (n = 30)Control Group (n = 44)
Whole GroupFemaleMaleWhole GroupFemaleMale
Age (year)7.50 ± 4.146.14 ± 3.359.00 ± 4.407.75 ± 4.108.33 ± 3.959.85 ± 4.17
(2.00–17.00)(2.00–13.00)(2.00–17.00)(2.00–17.50)(2.00–17.00)(4.50–17.50)
Height (cm)125 ± 25.00115.46 ± 19.24134.41 ± 26.70127 ± 24.90127.50 ± 21.59142.17 ± 25.60
(92.00–179.00)(92.00–158.00)(92.00–179.00)(82.00–197.00)(82.00–170.00)(109.00–197.00)
SDS for height0.06 ± 1.36−00.7 ± 1.200.08 ± 1.530.09 ± 1.10−0.14 ± 1.080.35 ± 1.08
(−2.80–2.29)(−2.80–2.20)(−2.80–2.29)(1.53–3.00)(−1.53–2.35)(−1.34–3.00)
BW (kg)29.80 ± 21.6026.54 ± 13.5543.26 ± 24.4927.10 ± 18.8030.35 ± 15.0338.38 ± 20.68
(12.10–88.90)(12.10–59.80)(14.50–88.90)(9.70–87.50)(9.70–71.00)(15.00–87.50)
SDS for BW1.15 ± 2.11.12 ± 1.581.75 ± 2.490.07 ± 1.110.08 ± 1.230.04 ± 1.04
(−1.83–9.58)(−1.83–3.80)(−1.63–9.58)(−2.34–2.12)(−1.87–2.11)(−2.34–2.12)
BMI (kg/m2)18.90 ± 4.0718.41 ± 3.2020.92 ± 4.4816.60 ± 3.4517.52 ± 3.1217.52 ± 3.72
(13.50–30.90)(13.82–23.98)(13.50–30.90)(12.40–26.50)(13.90–24.60)(12.40–26.50)
SDS for BMI0.83 ± 2.100.07 ± 1.182.20 ± 2.26−0.06 ± 1.180.25 ± 1.05−0.25 ± 1.25
(−2.18–8.17)(−1.47–2.35)(−2.18–8.17)(−2.97–2.29)(−1.38–2.29)(−2.97–2.02)
SYS (mmHg)115 ± 14.6108.21 ± 14.87117.88 ± 13.17110.00 ± 11.30107.17 ± 8.54113.96 ± 12.25
(81.00–152.00)(81.00–138.00)(102.00–152.00)(85.00–134.00)(89.00–122.00)(85.00–134.00)
DIA (mmHg)67.50 ± 10.9064.71 ± 9.5173.44 ± 10.6670.00 ± 12.0066.83 ± 11.4569.96 ± 12.44
(50.00–90.00)(50.00–88.00)(56.00–90.00)(40.00–107.00)(45.00–96.00)(40.00–107.00)
MAP (mmHg)82.50 ± 11.3079.21 ± 9.9788.25 ± 11.0382.50 ± 10.7080.28 ± 9.5484.63 ± 11.23
(67.00–111.00)(67.00–100)(71.33–111.00)(58.70–116.00)(62.33–102.33)(58.67–115.70)
Urine protein (g/L)4.45 ± 8.786.04 ± 6.1510.28 ± 10.35XXX
(0.67–35.60)(0.88–23.70)(0.67–35.60)
Data are presented as the mean ± standard deviation (minimum–maximum); BW: body weight; SDS: standard deviation score; BMI: body mass index; SYS: systolic arterial pressure; DIA: diastolic arterial pressure; MAP: mean arterial pressure; X: there was no protein in urine.
Table 2. Serum BDNF to serum creatinine ratio assessed in study and control group.
ParameterControl Group (n= 44)Study Group (n = 30)
Serum BDNF/serum creatinine0.02 ± 0.01 (0.01–0.04)0.03 ± 0.01 (0.01–0.06)
Data are presented as the mean ± standard deviation (minimum–maximum).
Table 3. A general linear model of serum BDNF and proteinuria.
βSEtp
(Intercept)−18.869.73−1.940.06
BDNF serum level26.6611.552.310.03
Gender2.983.080.970.34
Age0.690.381.820.08
Intercept = constant term—element of regression, not affected by independent variable; β—regression coefficient; SE—standard error; t-test statistics value for each parameter.
Publisher’s Note: MDPI stays neutral with regard to jurisdictional claims in published maps and institutional affiliations.