
Papaya Leaf Extracts as Potential Dengue Treatment: An In-Silico Study


Abstract
1. Introduction
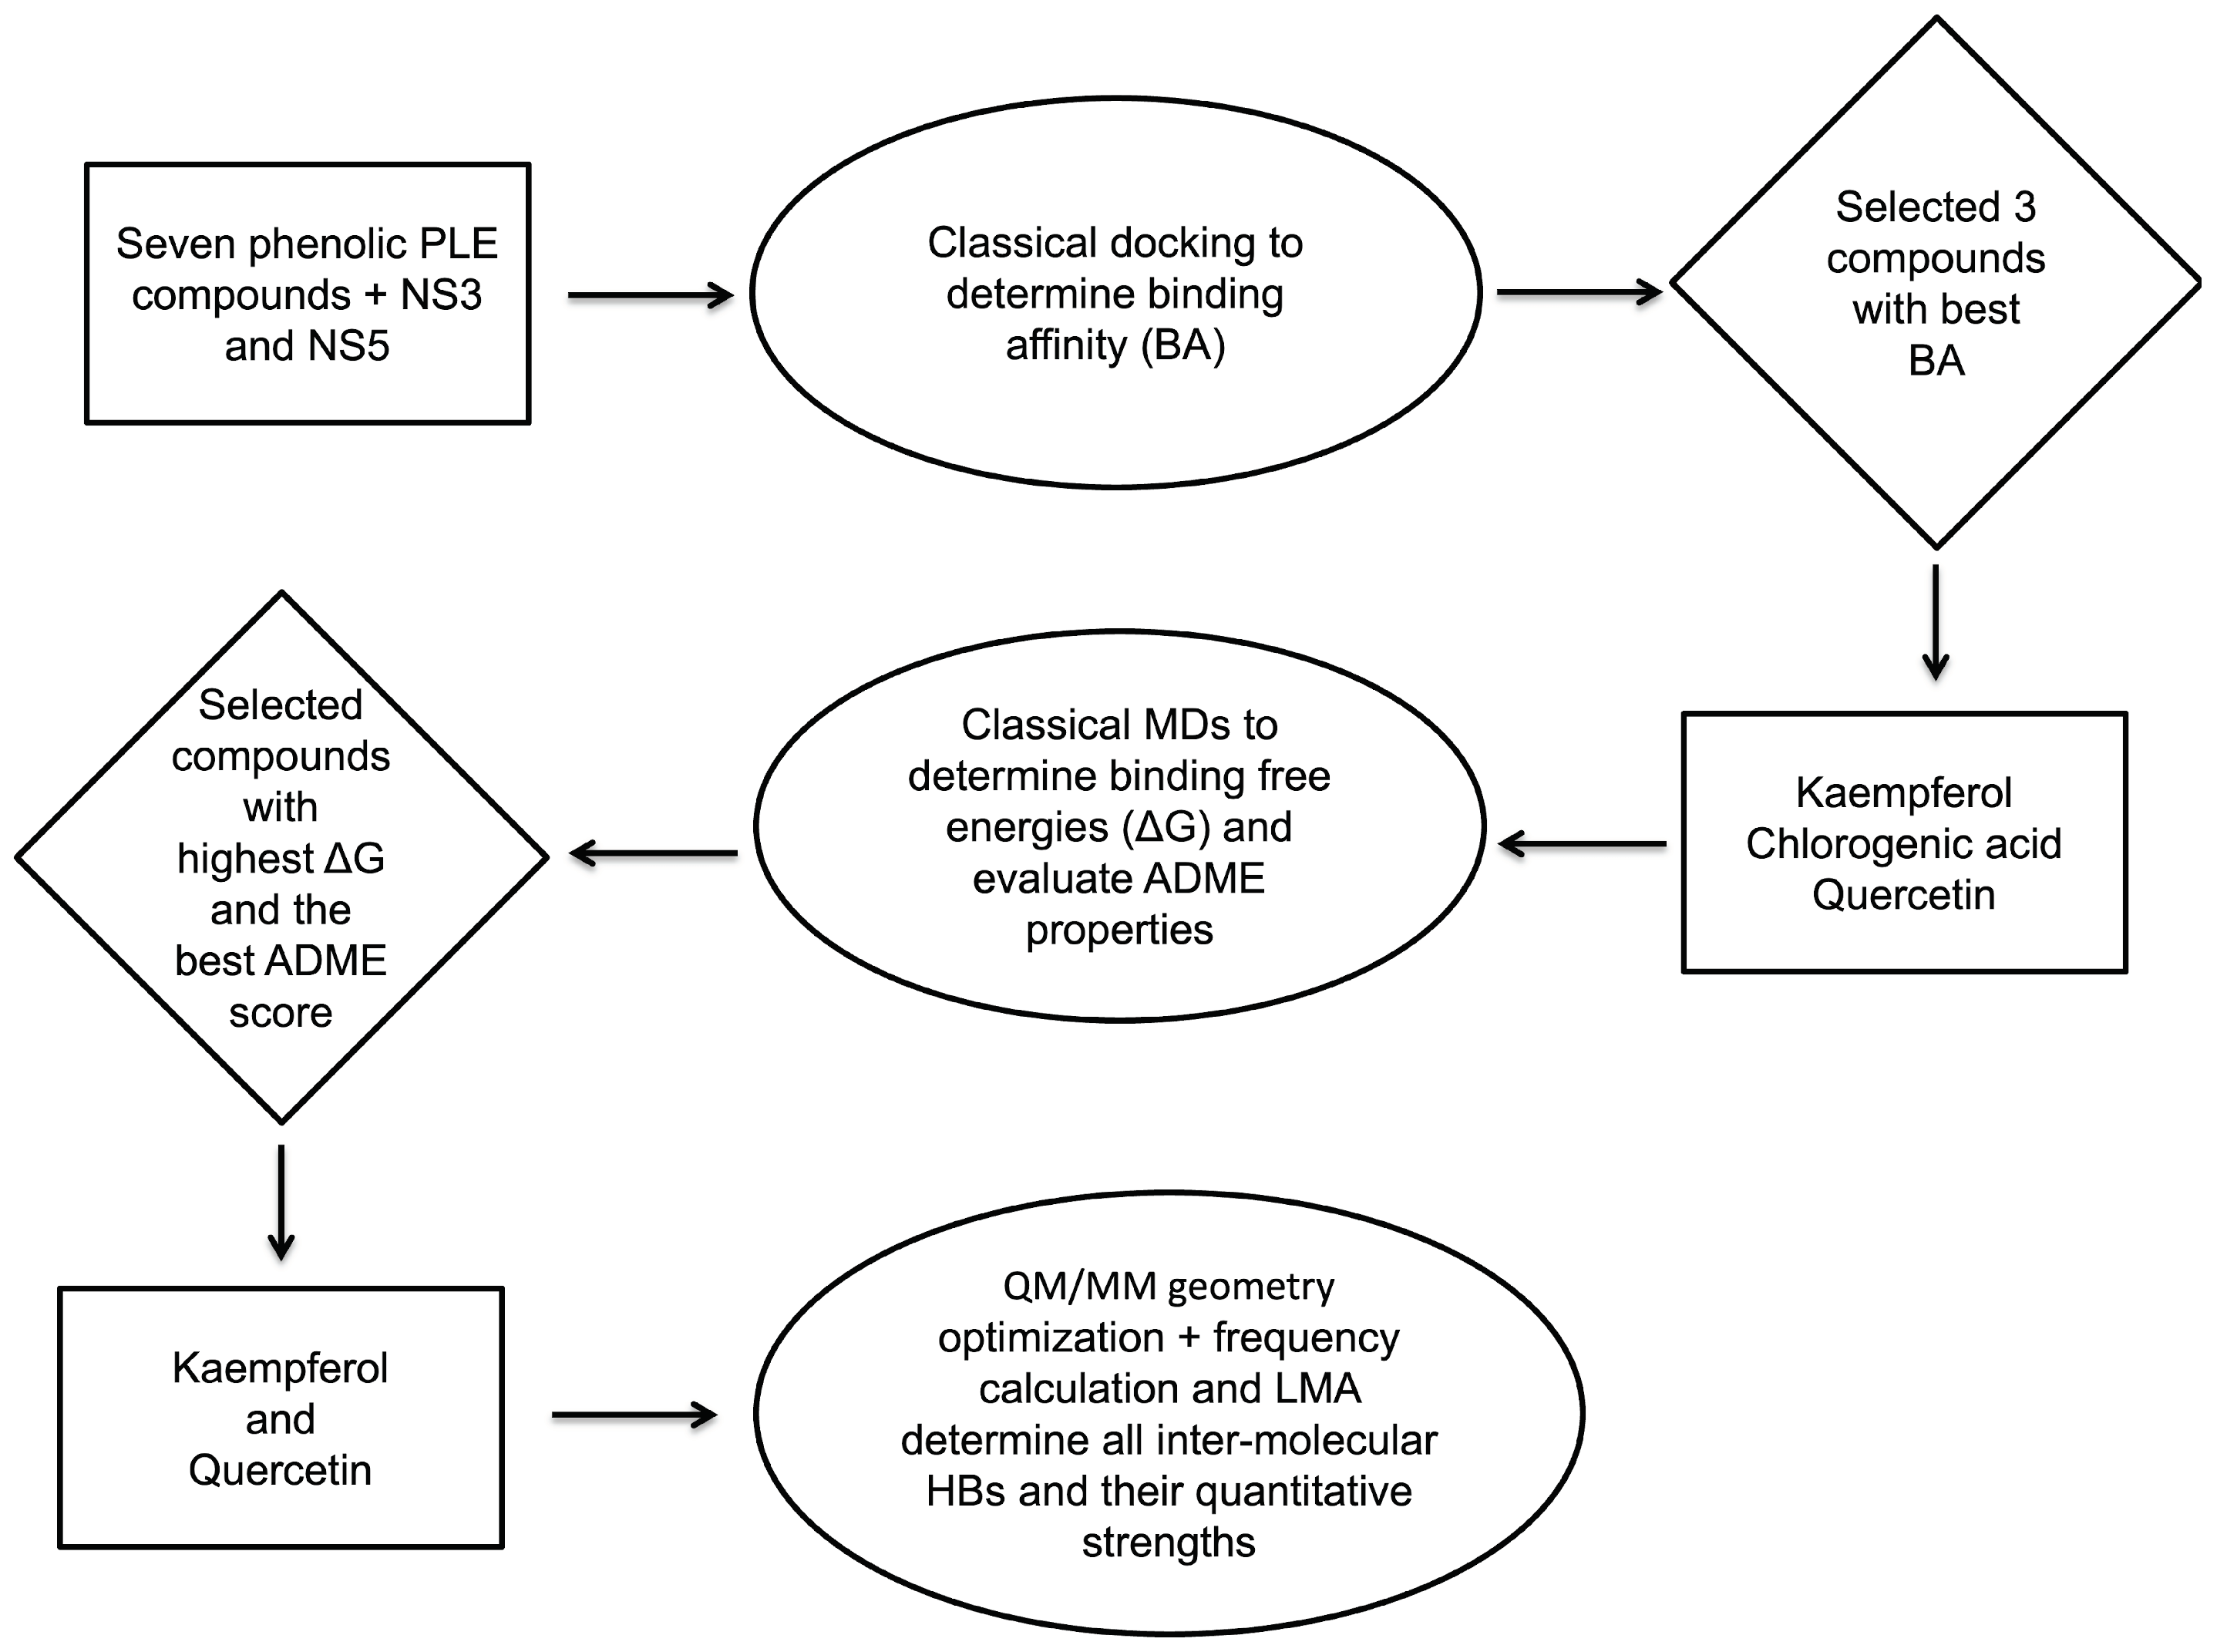
2. Methodology
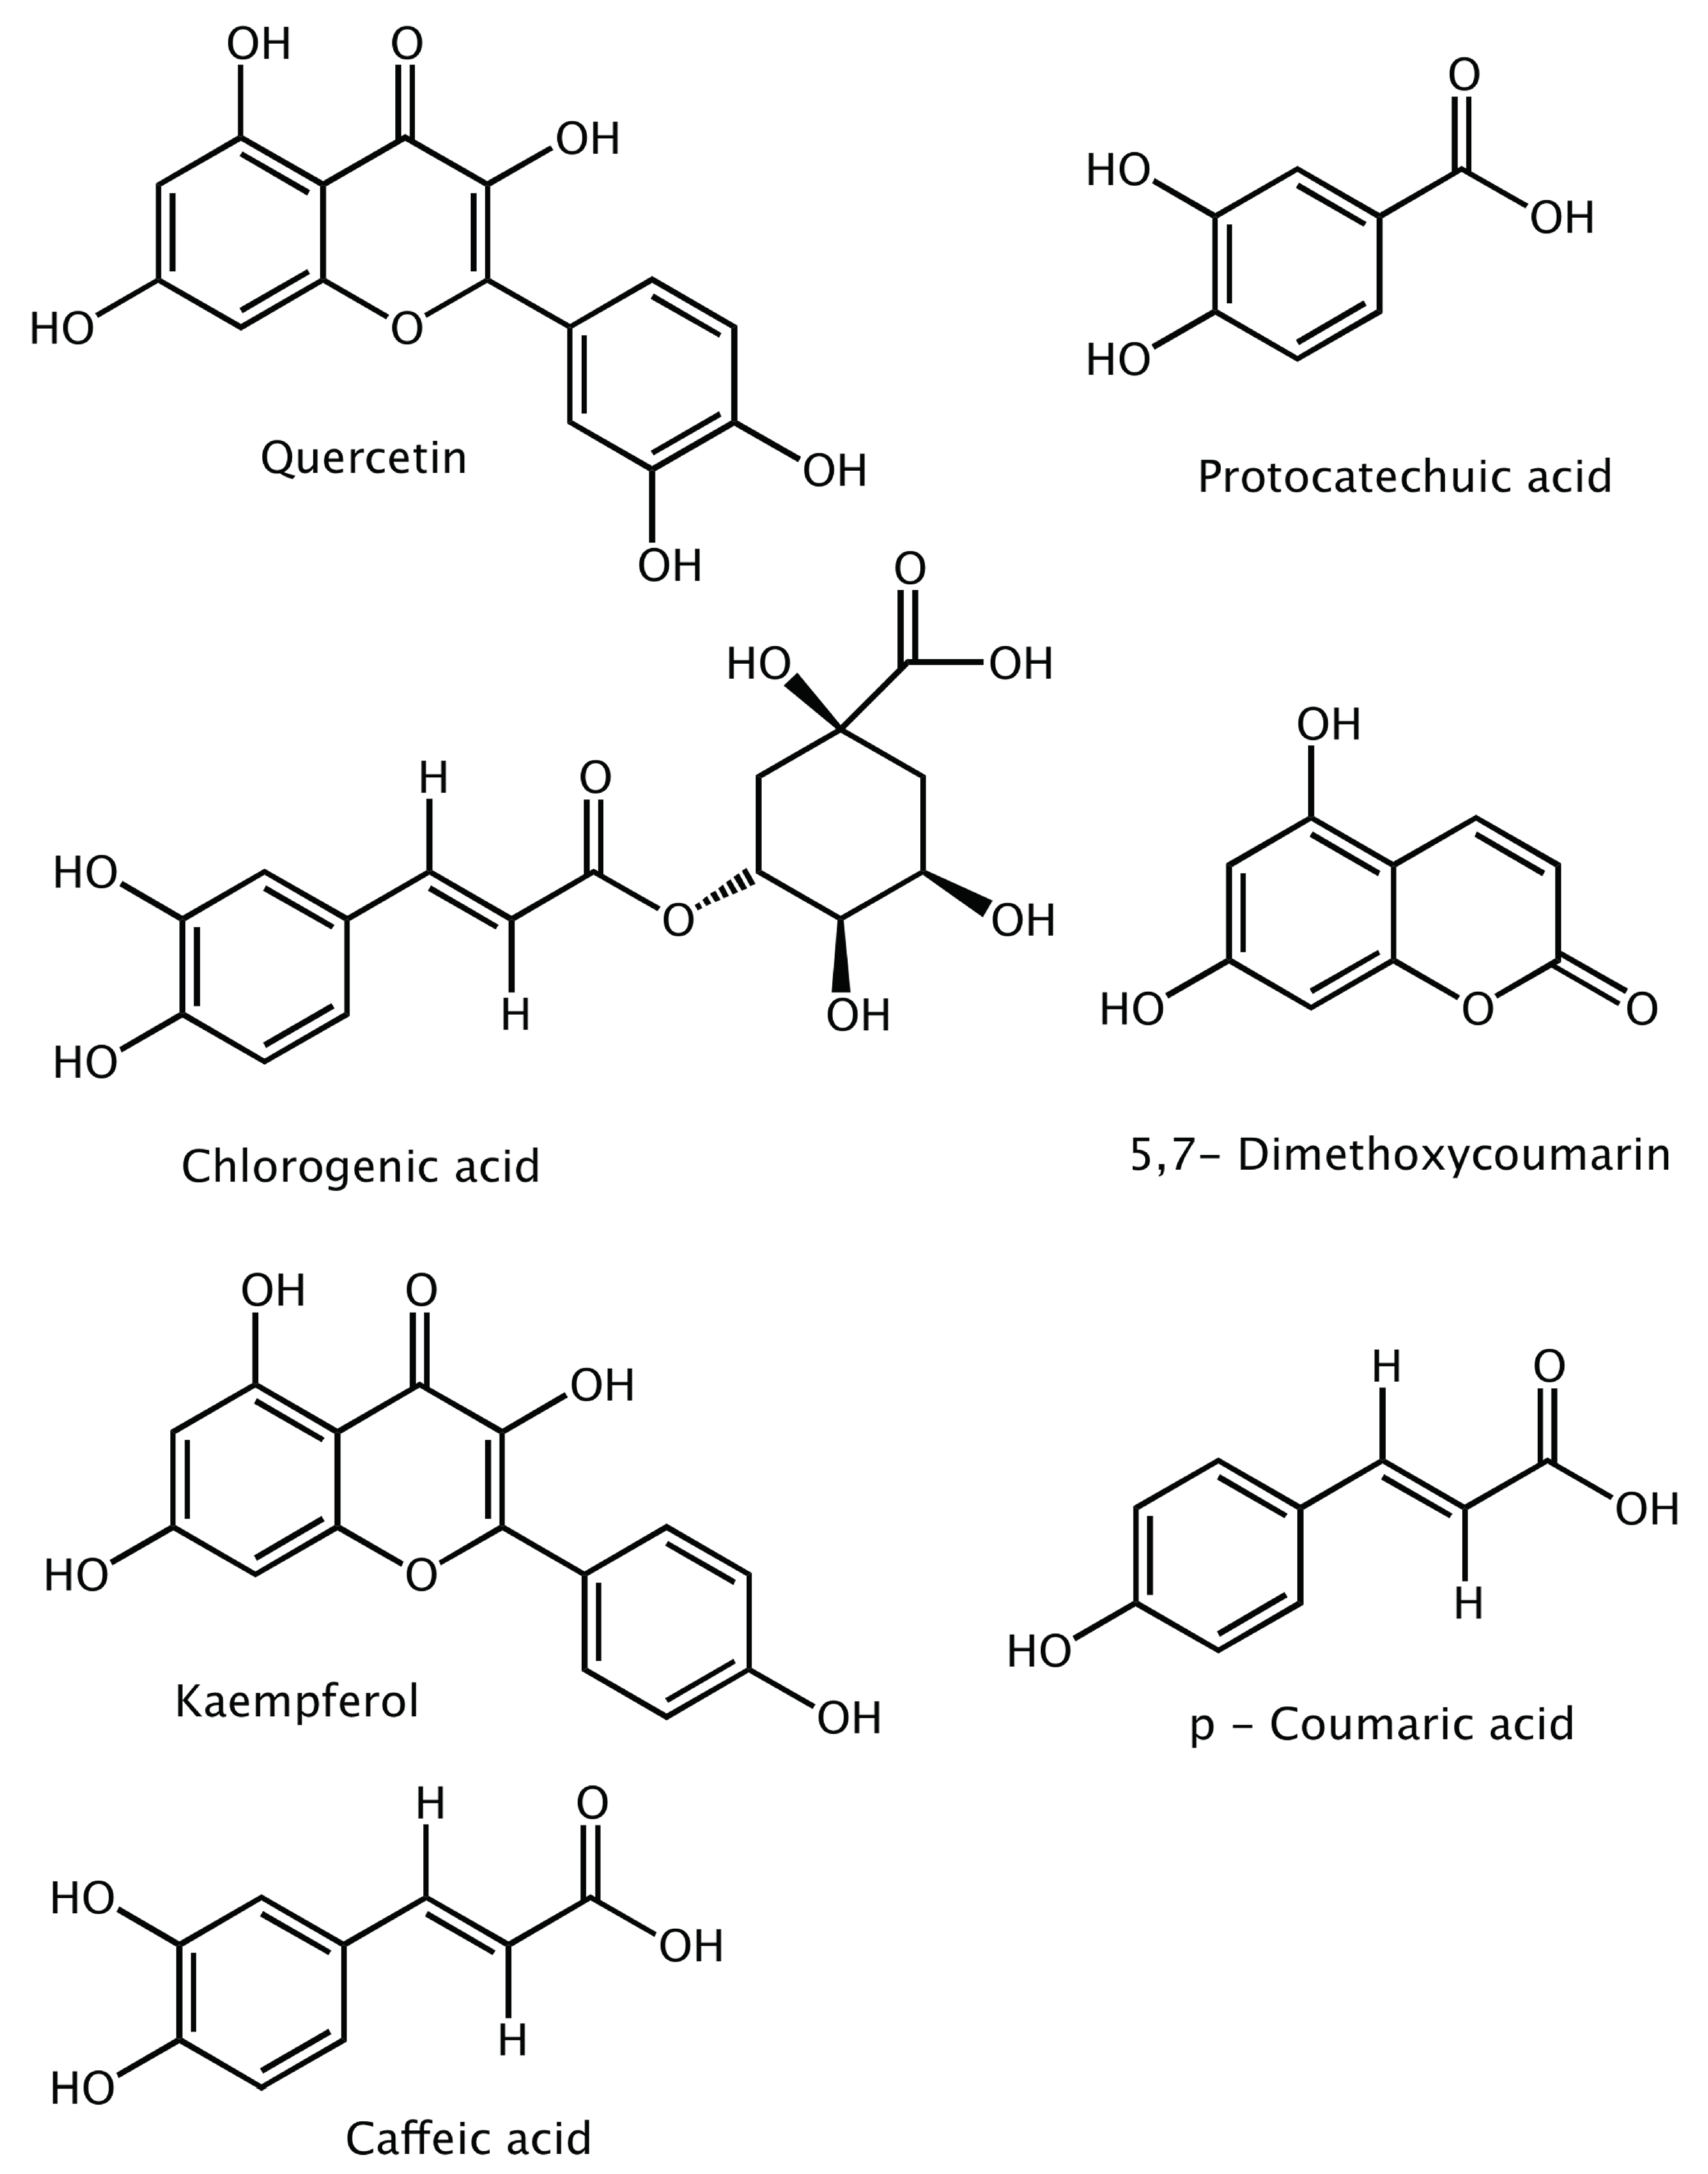
2.1. Ligands and the NS3 and NS5 Protein Preparation
2.2. Classical Docking
2.3. Molecular Dynamics (MD) Simulation
2.4. Post-MD Simulation Trajectory Analysis and Data Analysis
2.5. Binding-Free-Energy Calculation
2.6. Prediction of Protein Targets and Pharmacokinetic Properties
2.7. Local Mode Analysis
3. Results and Discussion
3.1. Classical Docking
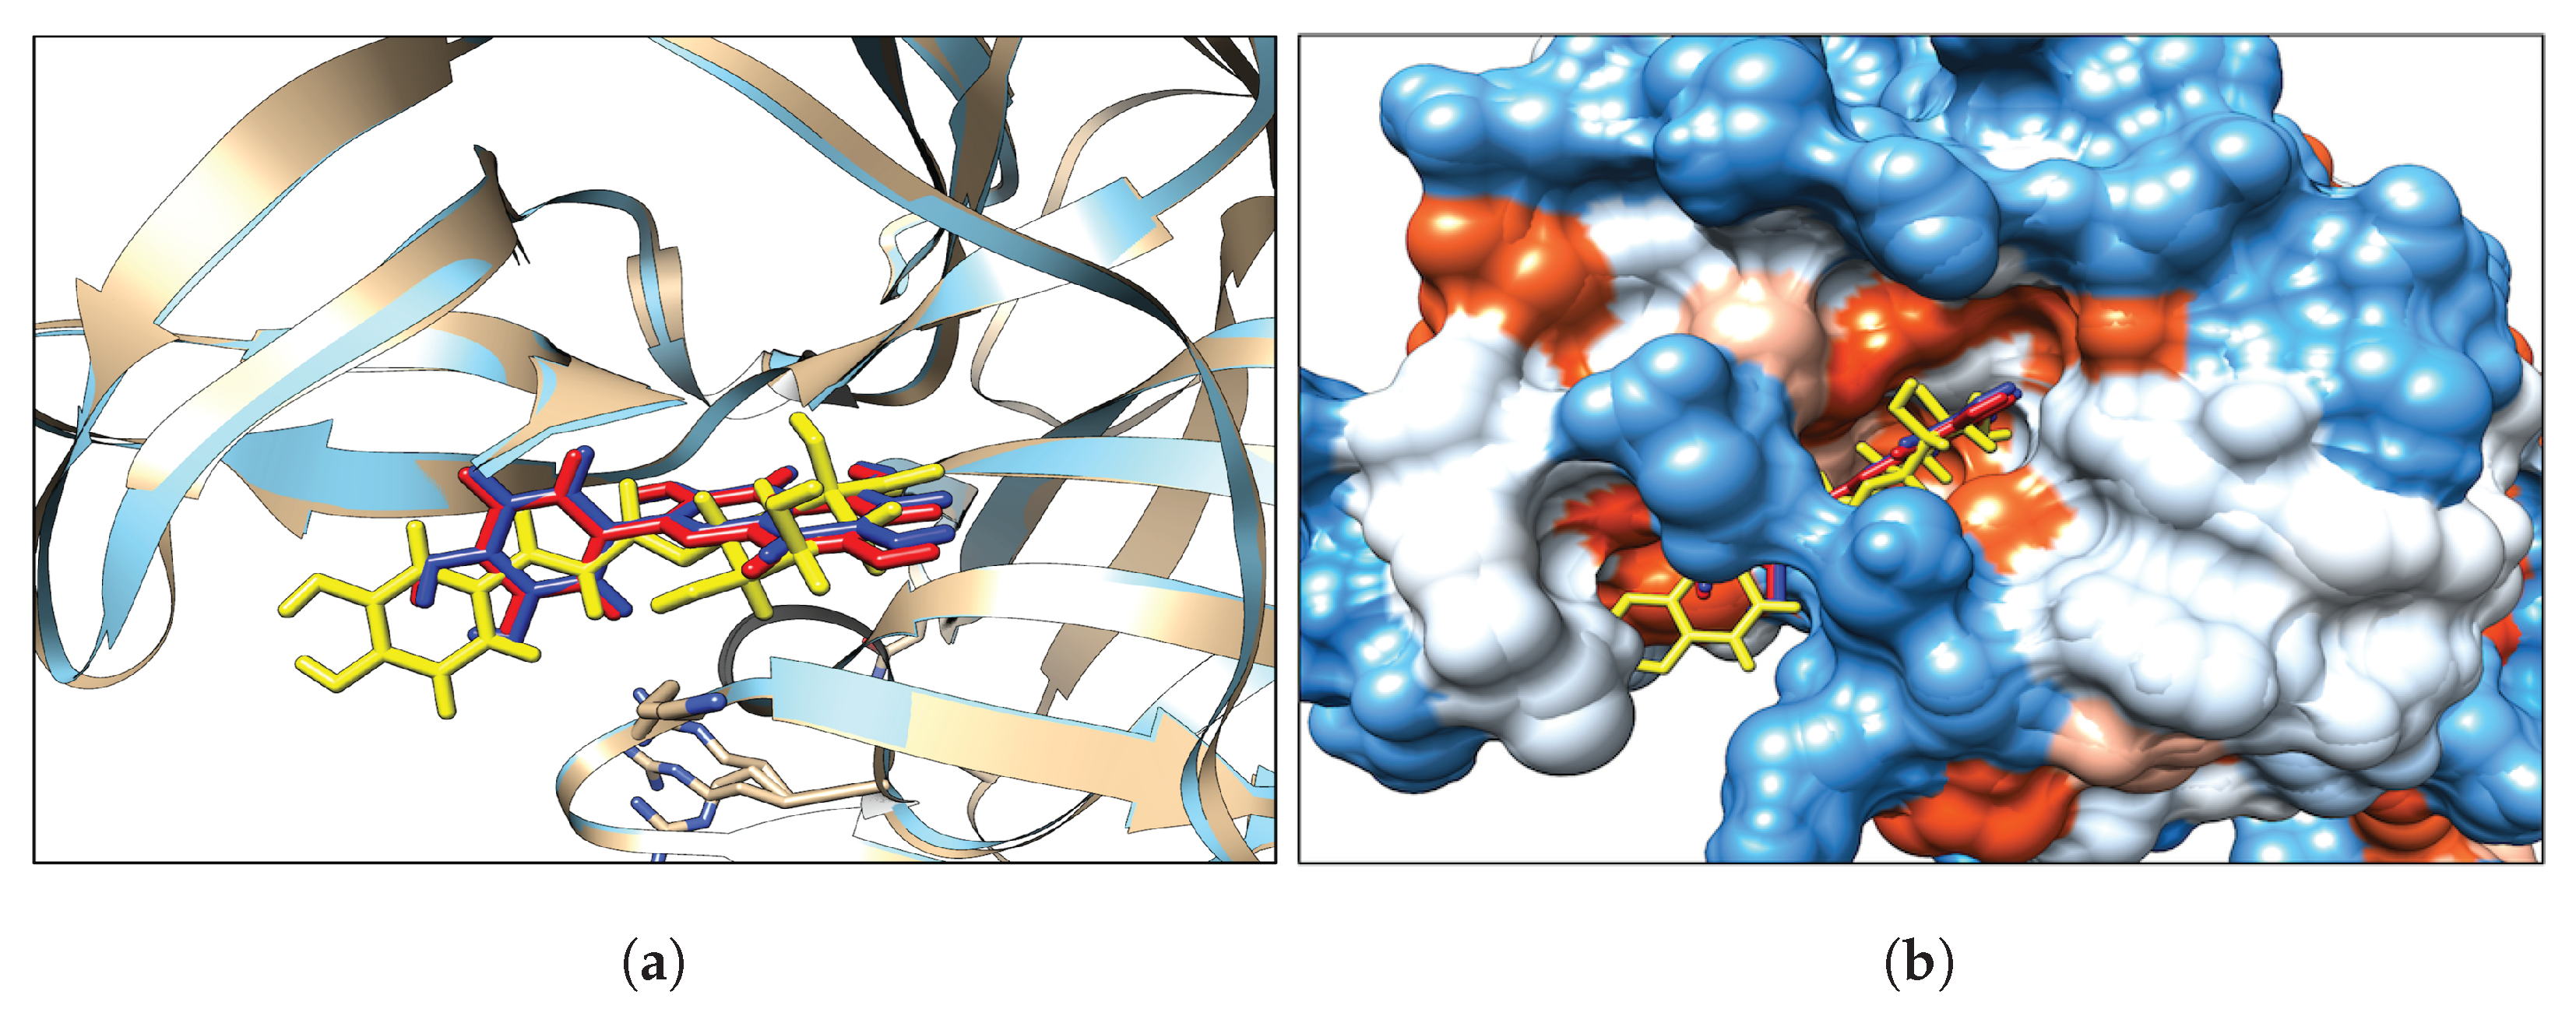
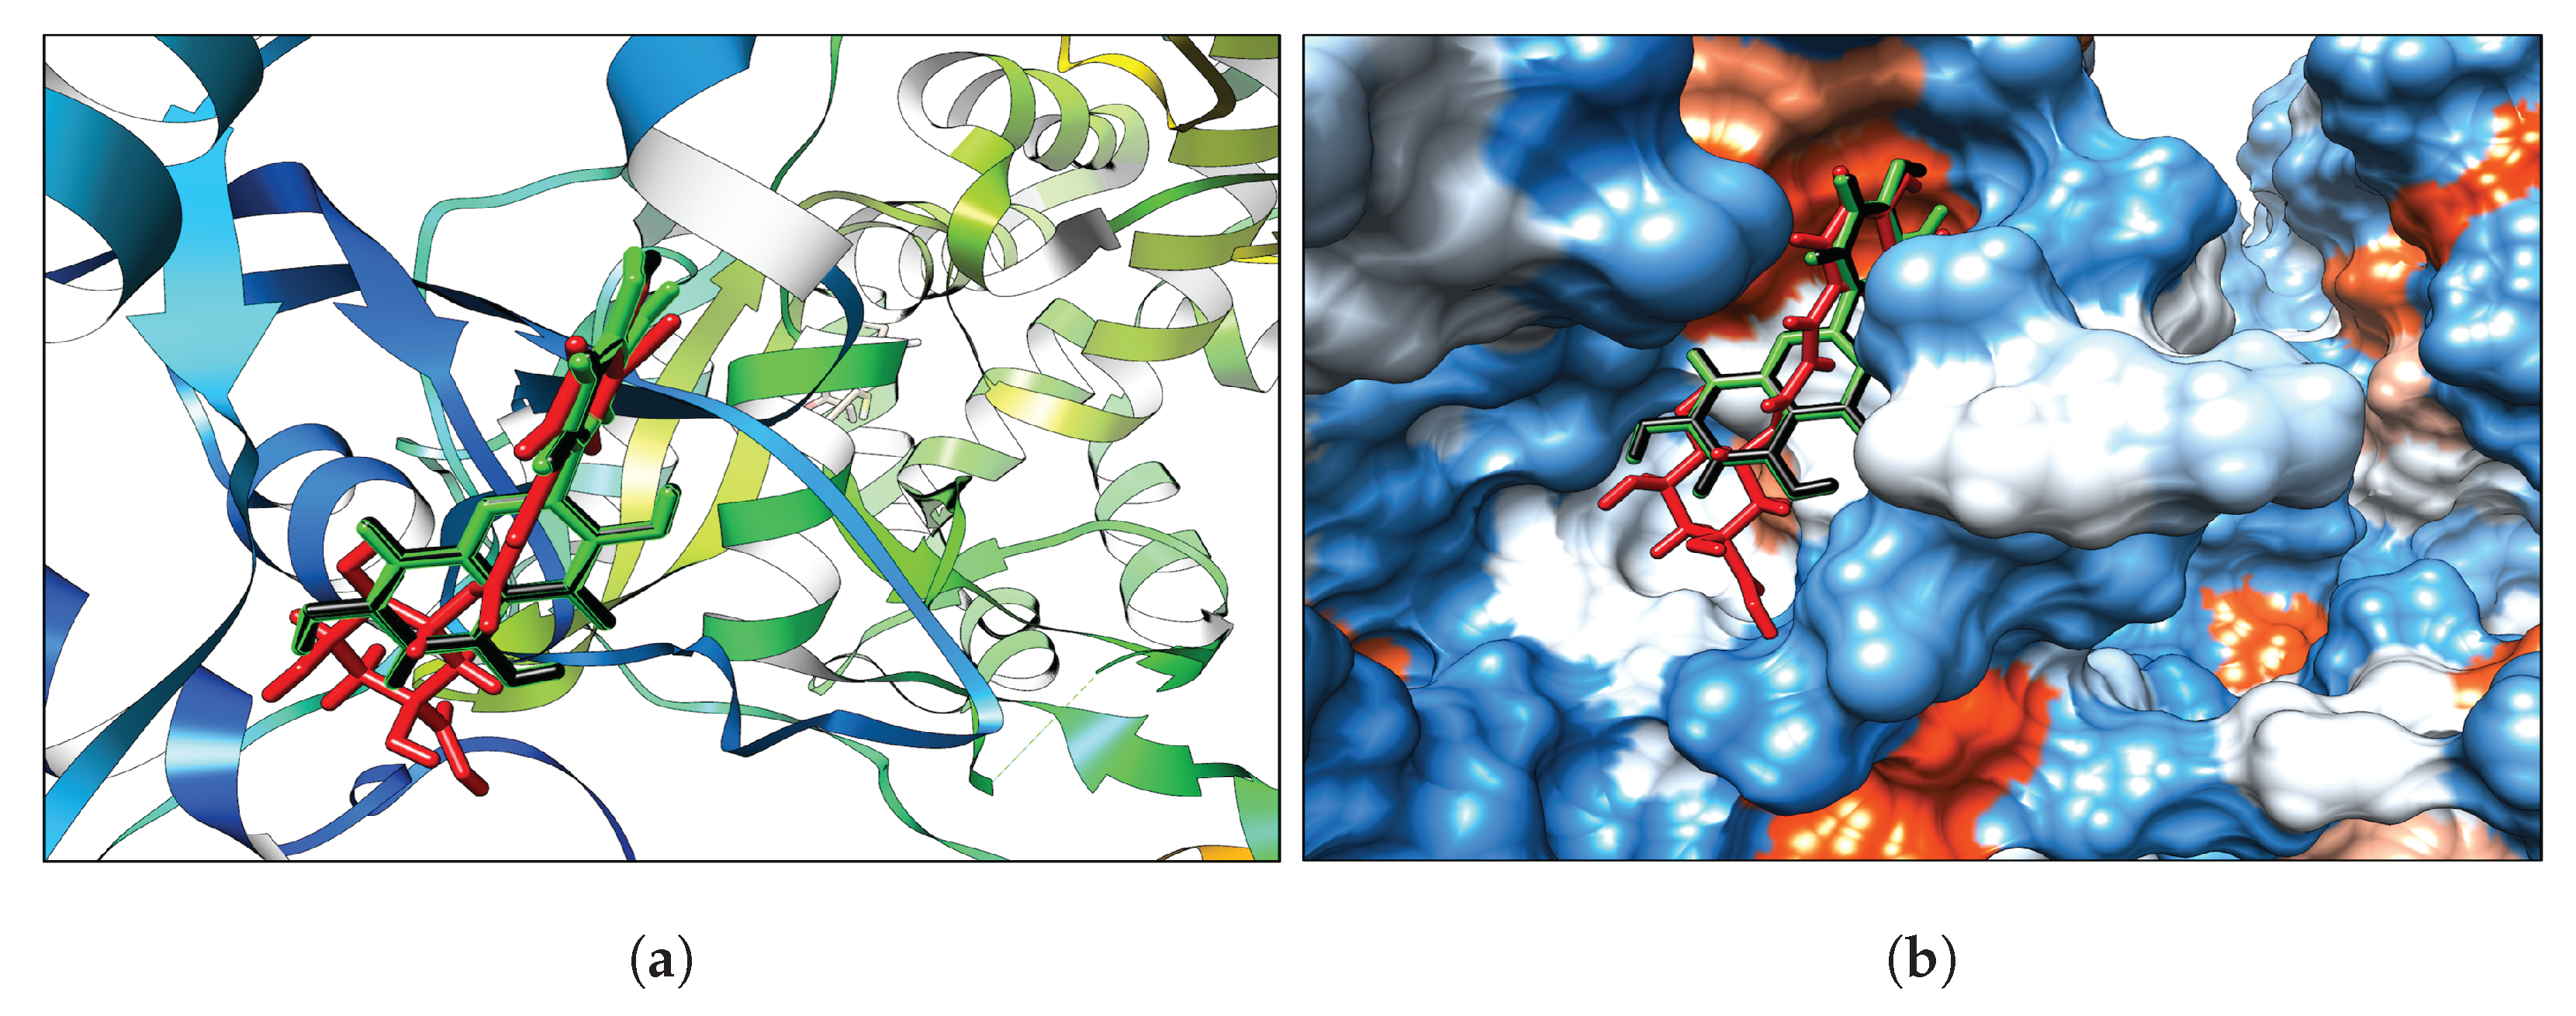
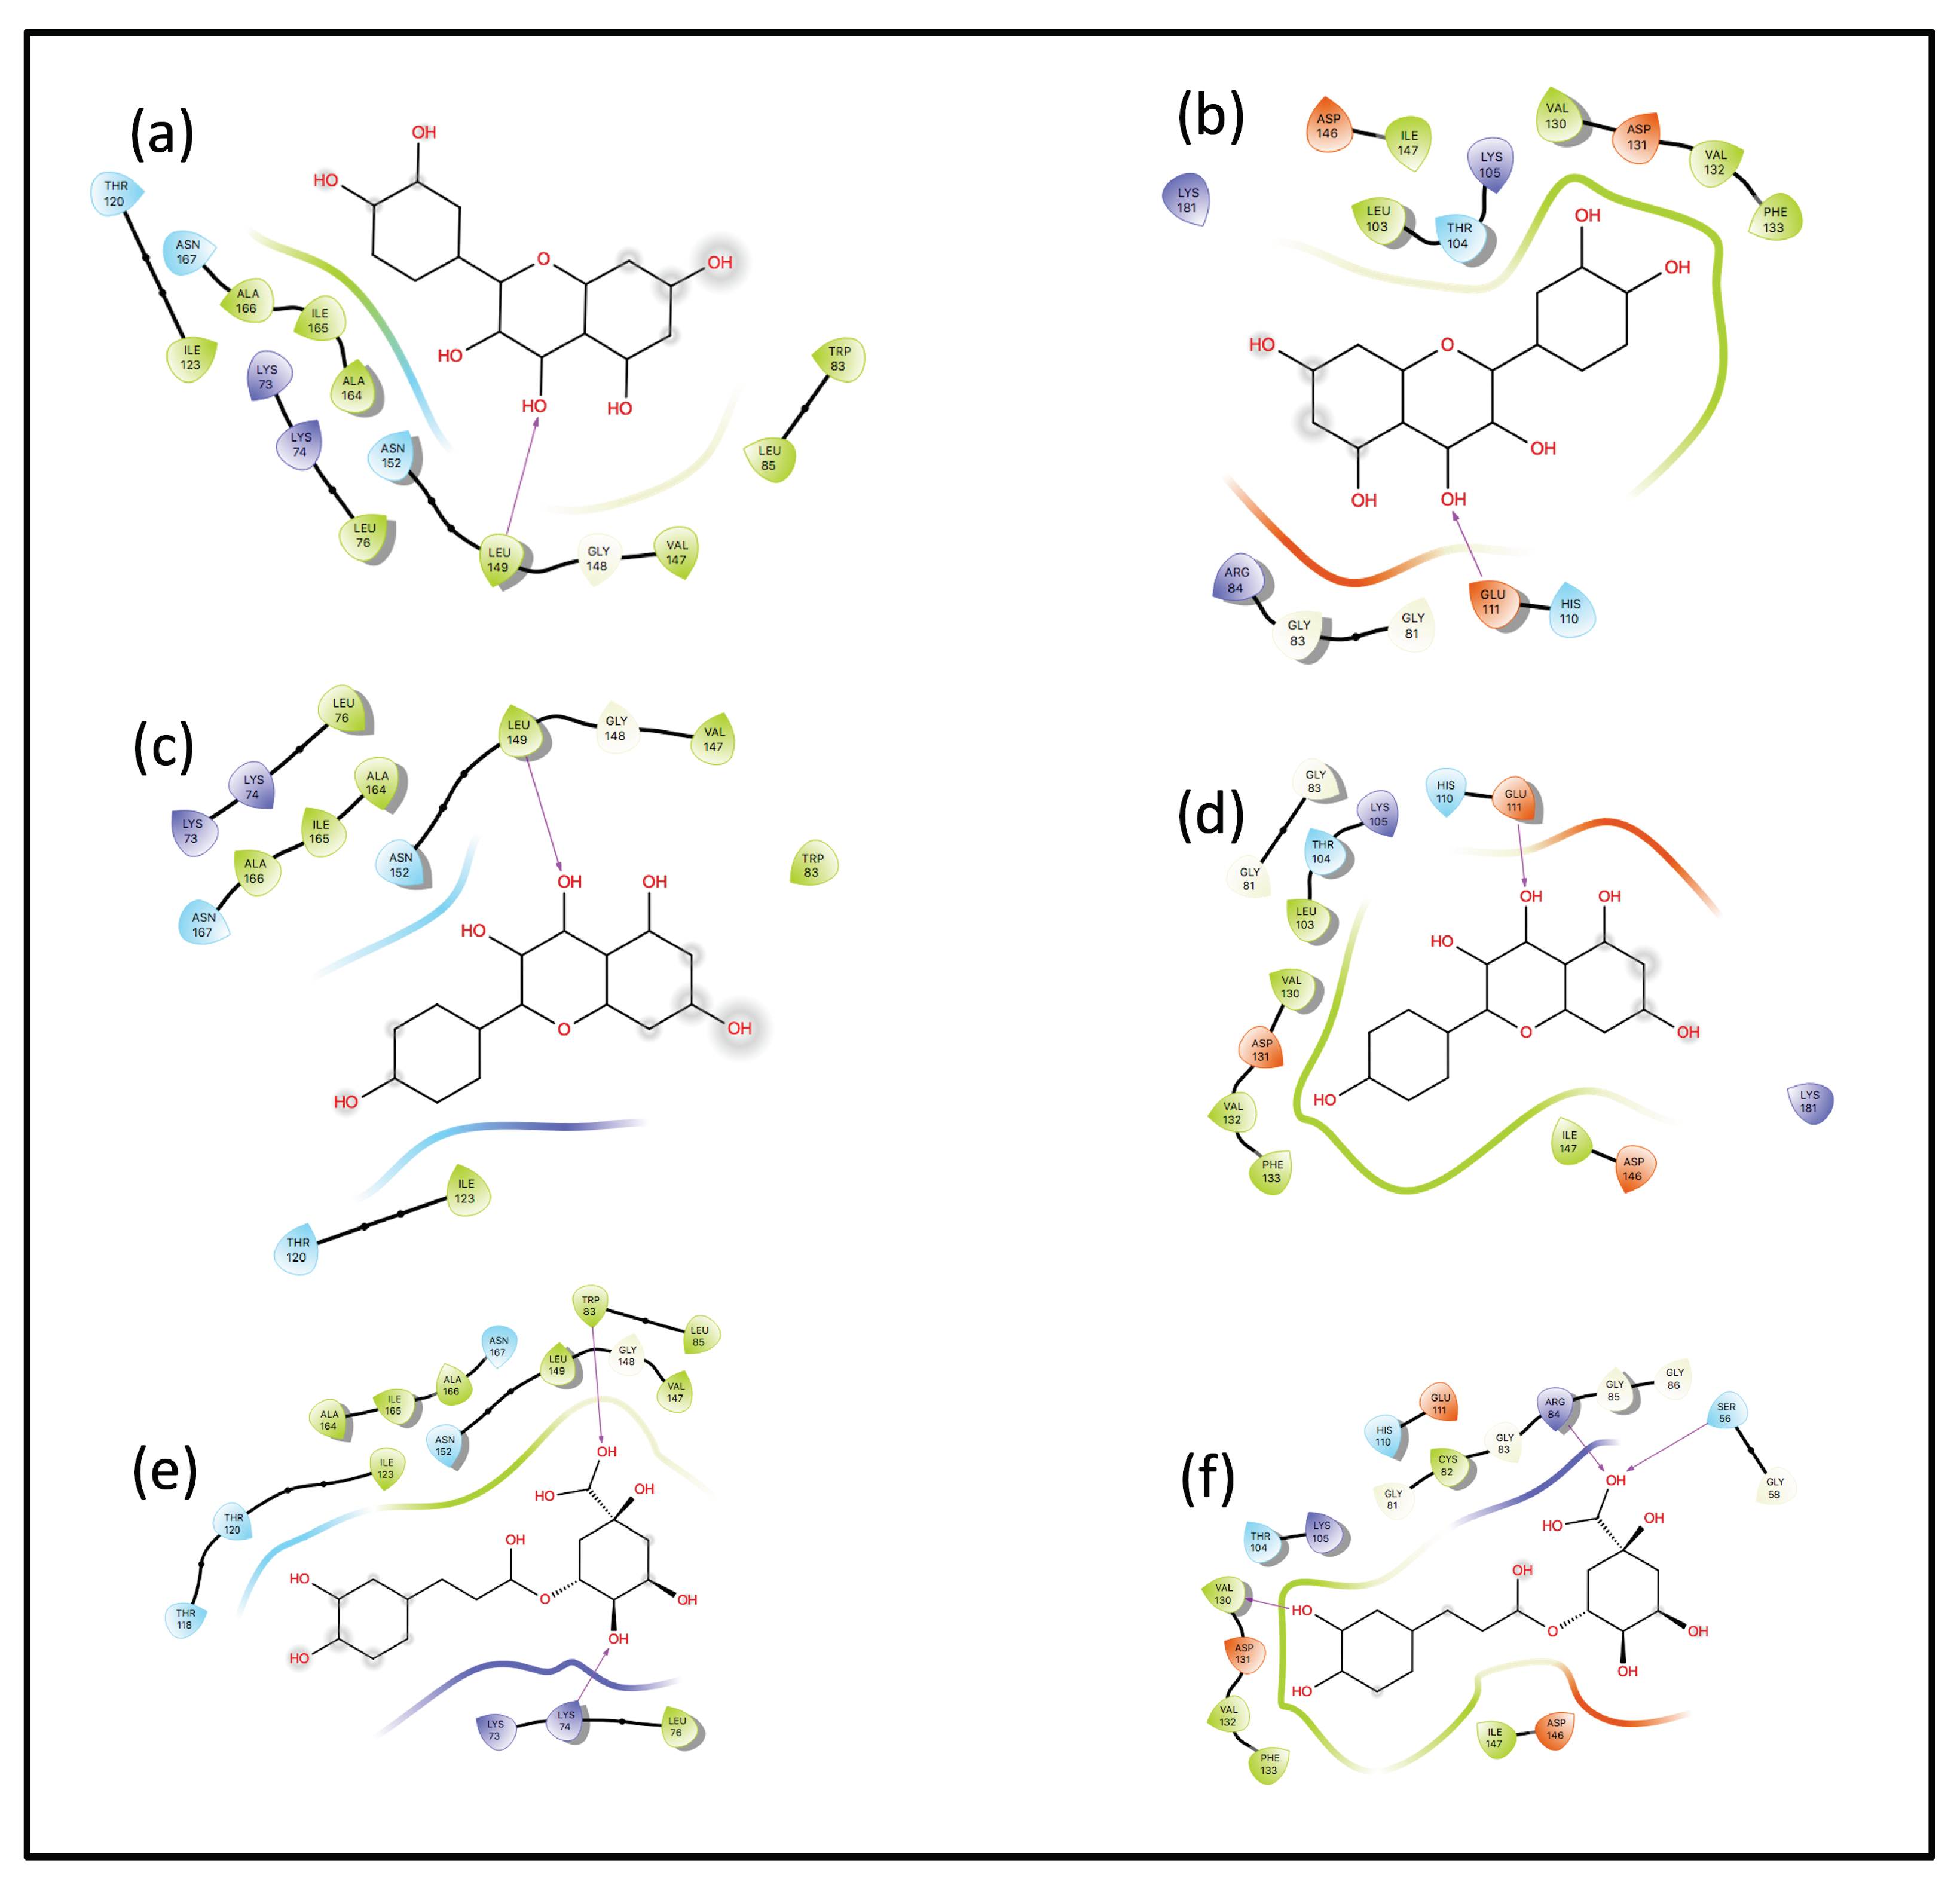
Interaction Analysis
3.2. Binding Free Energy
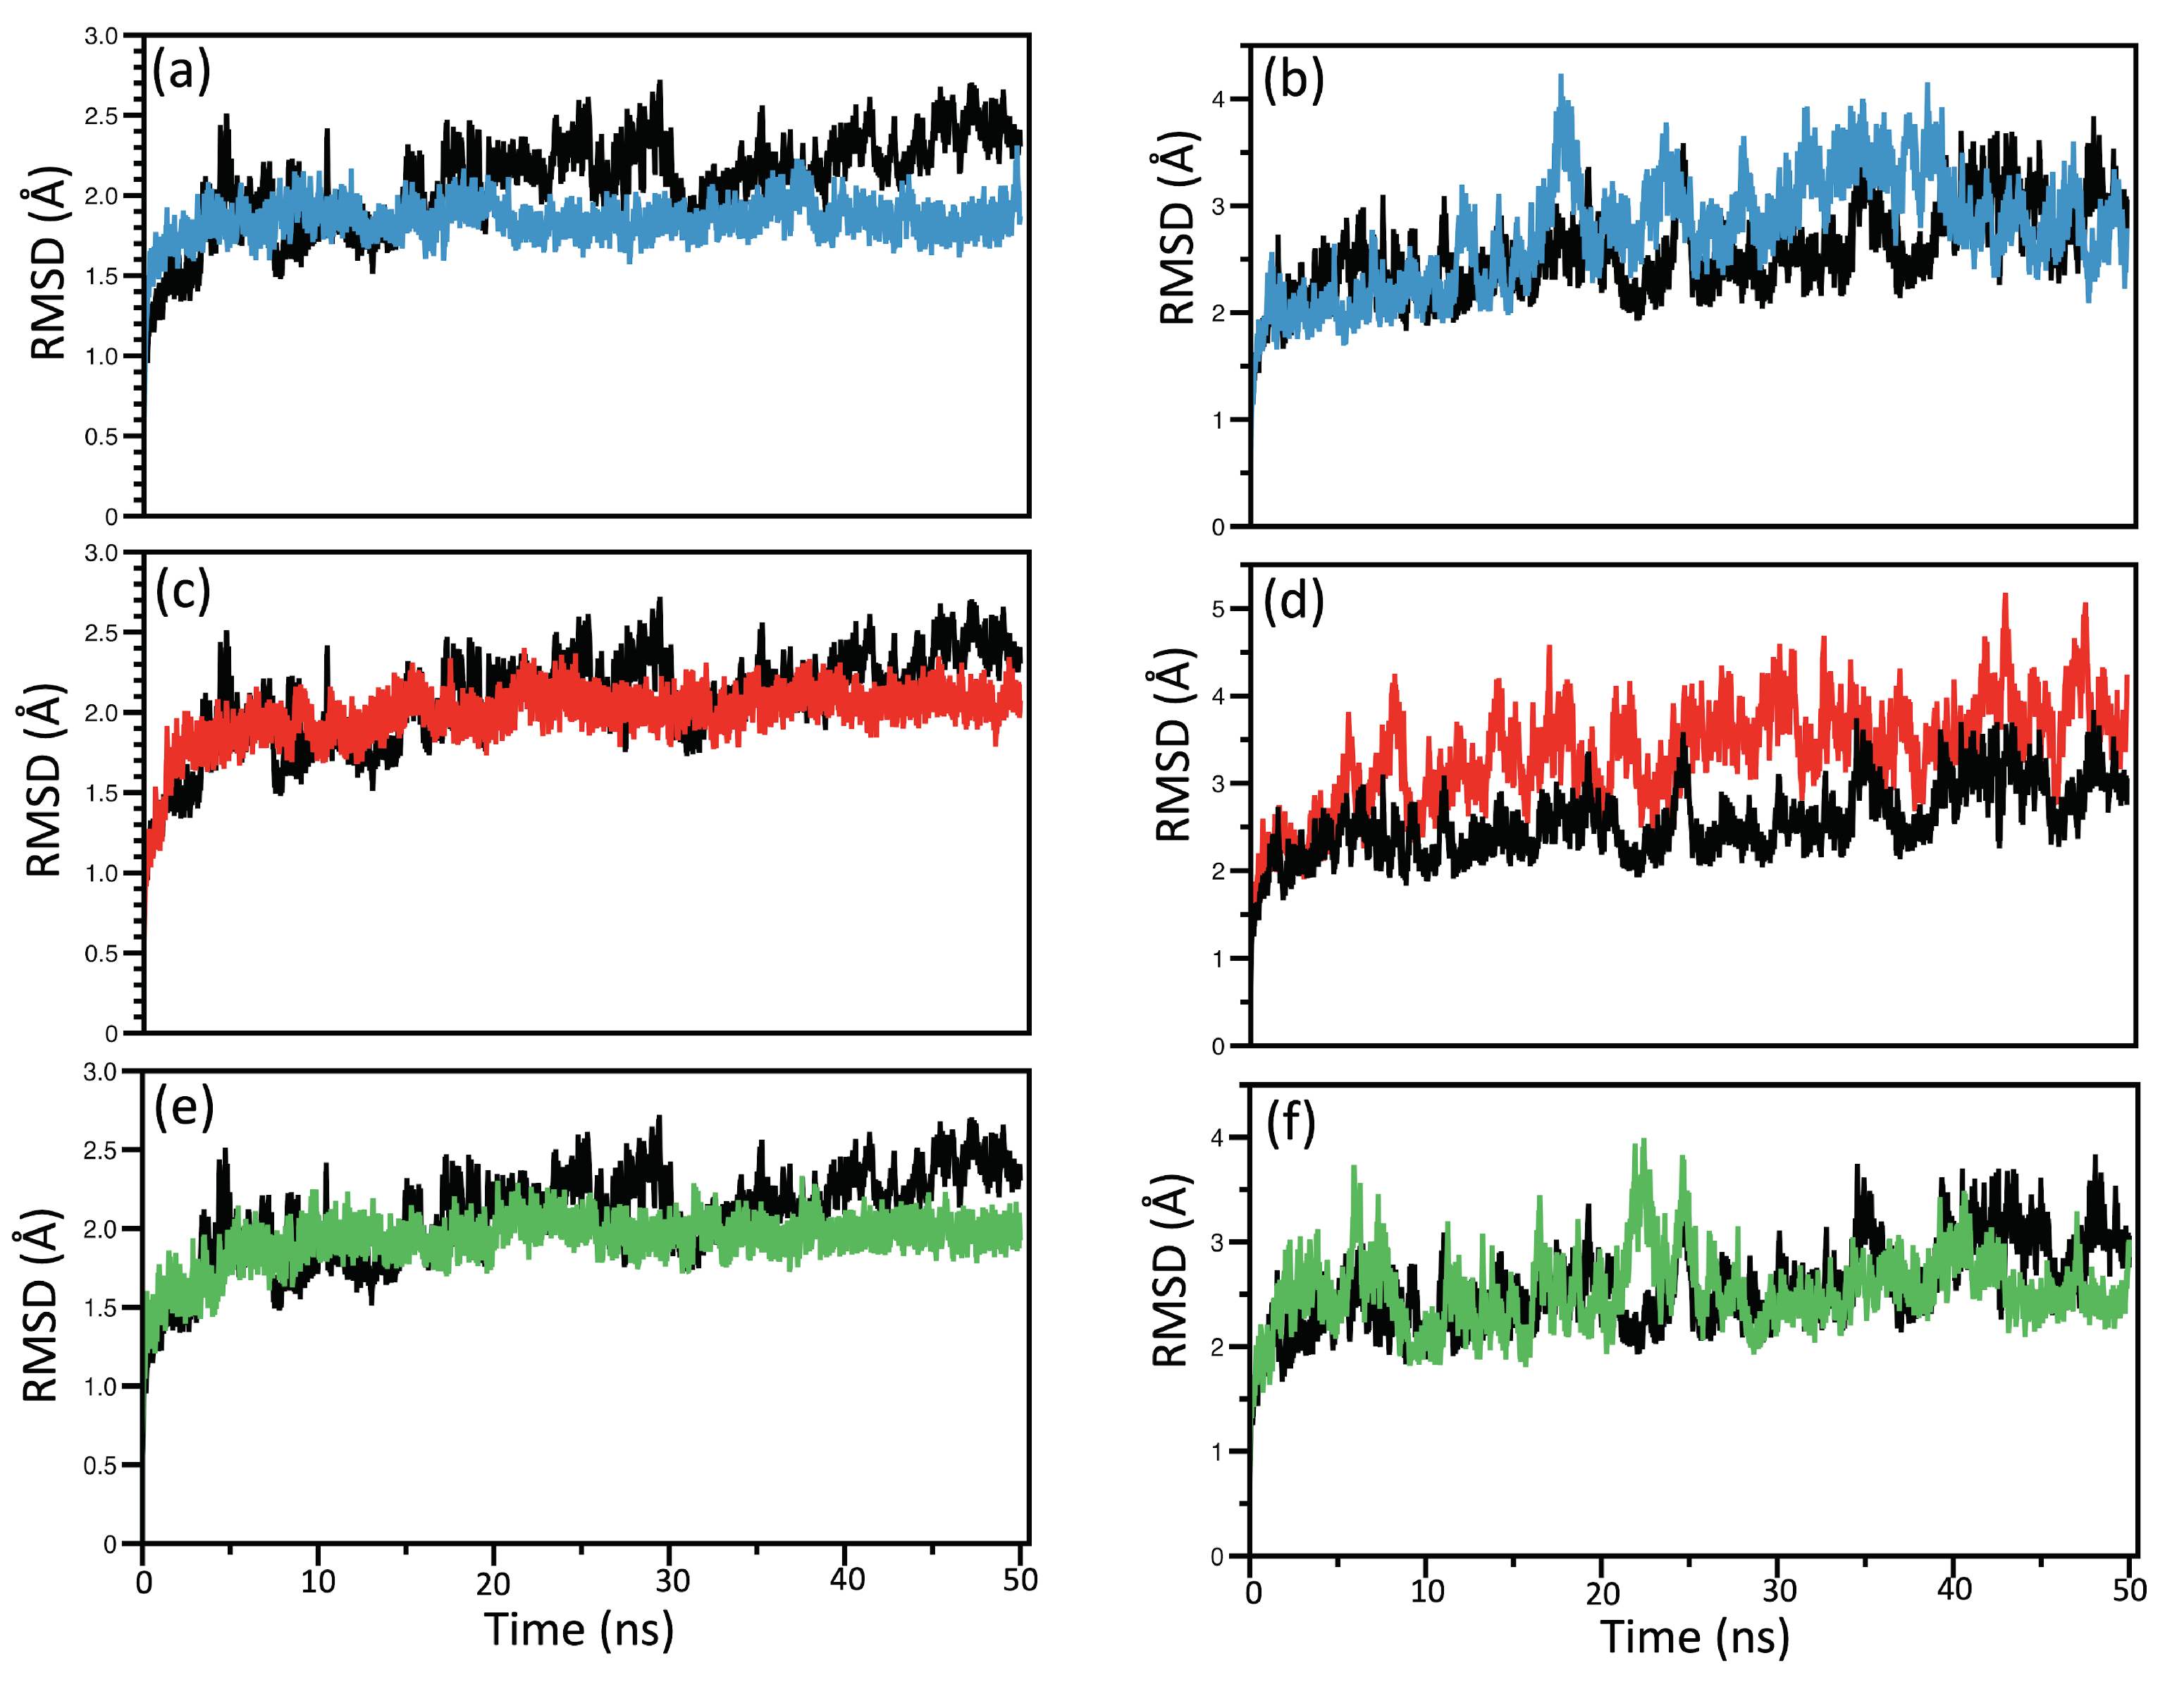
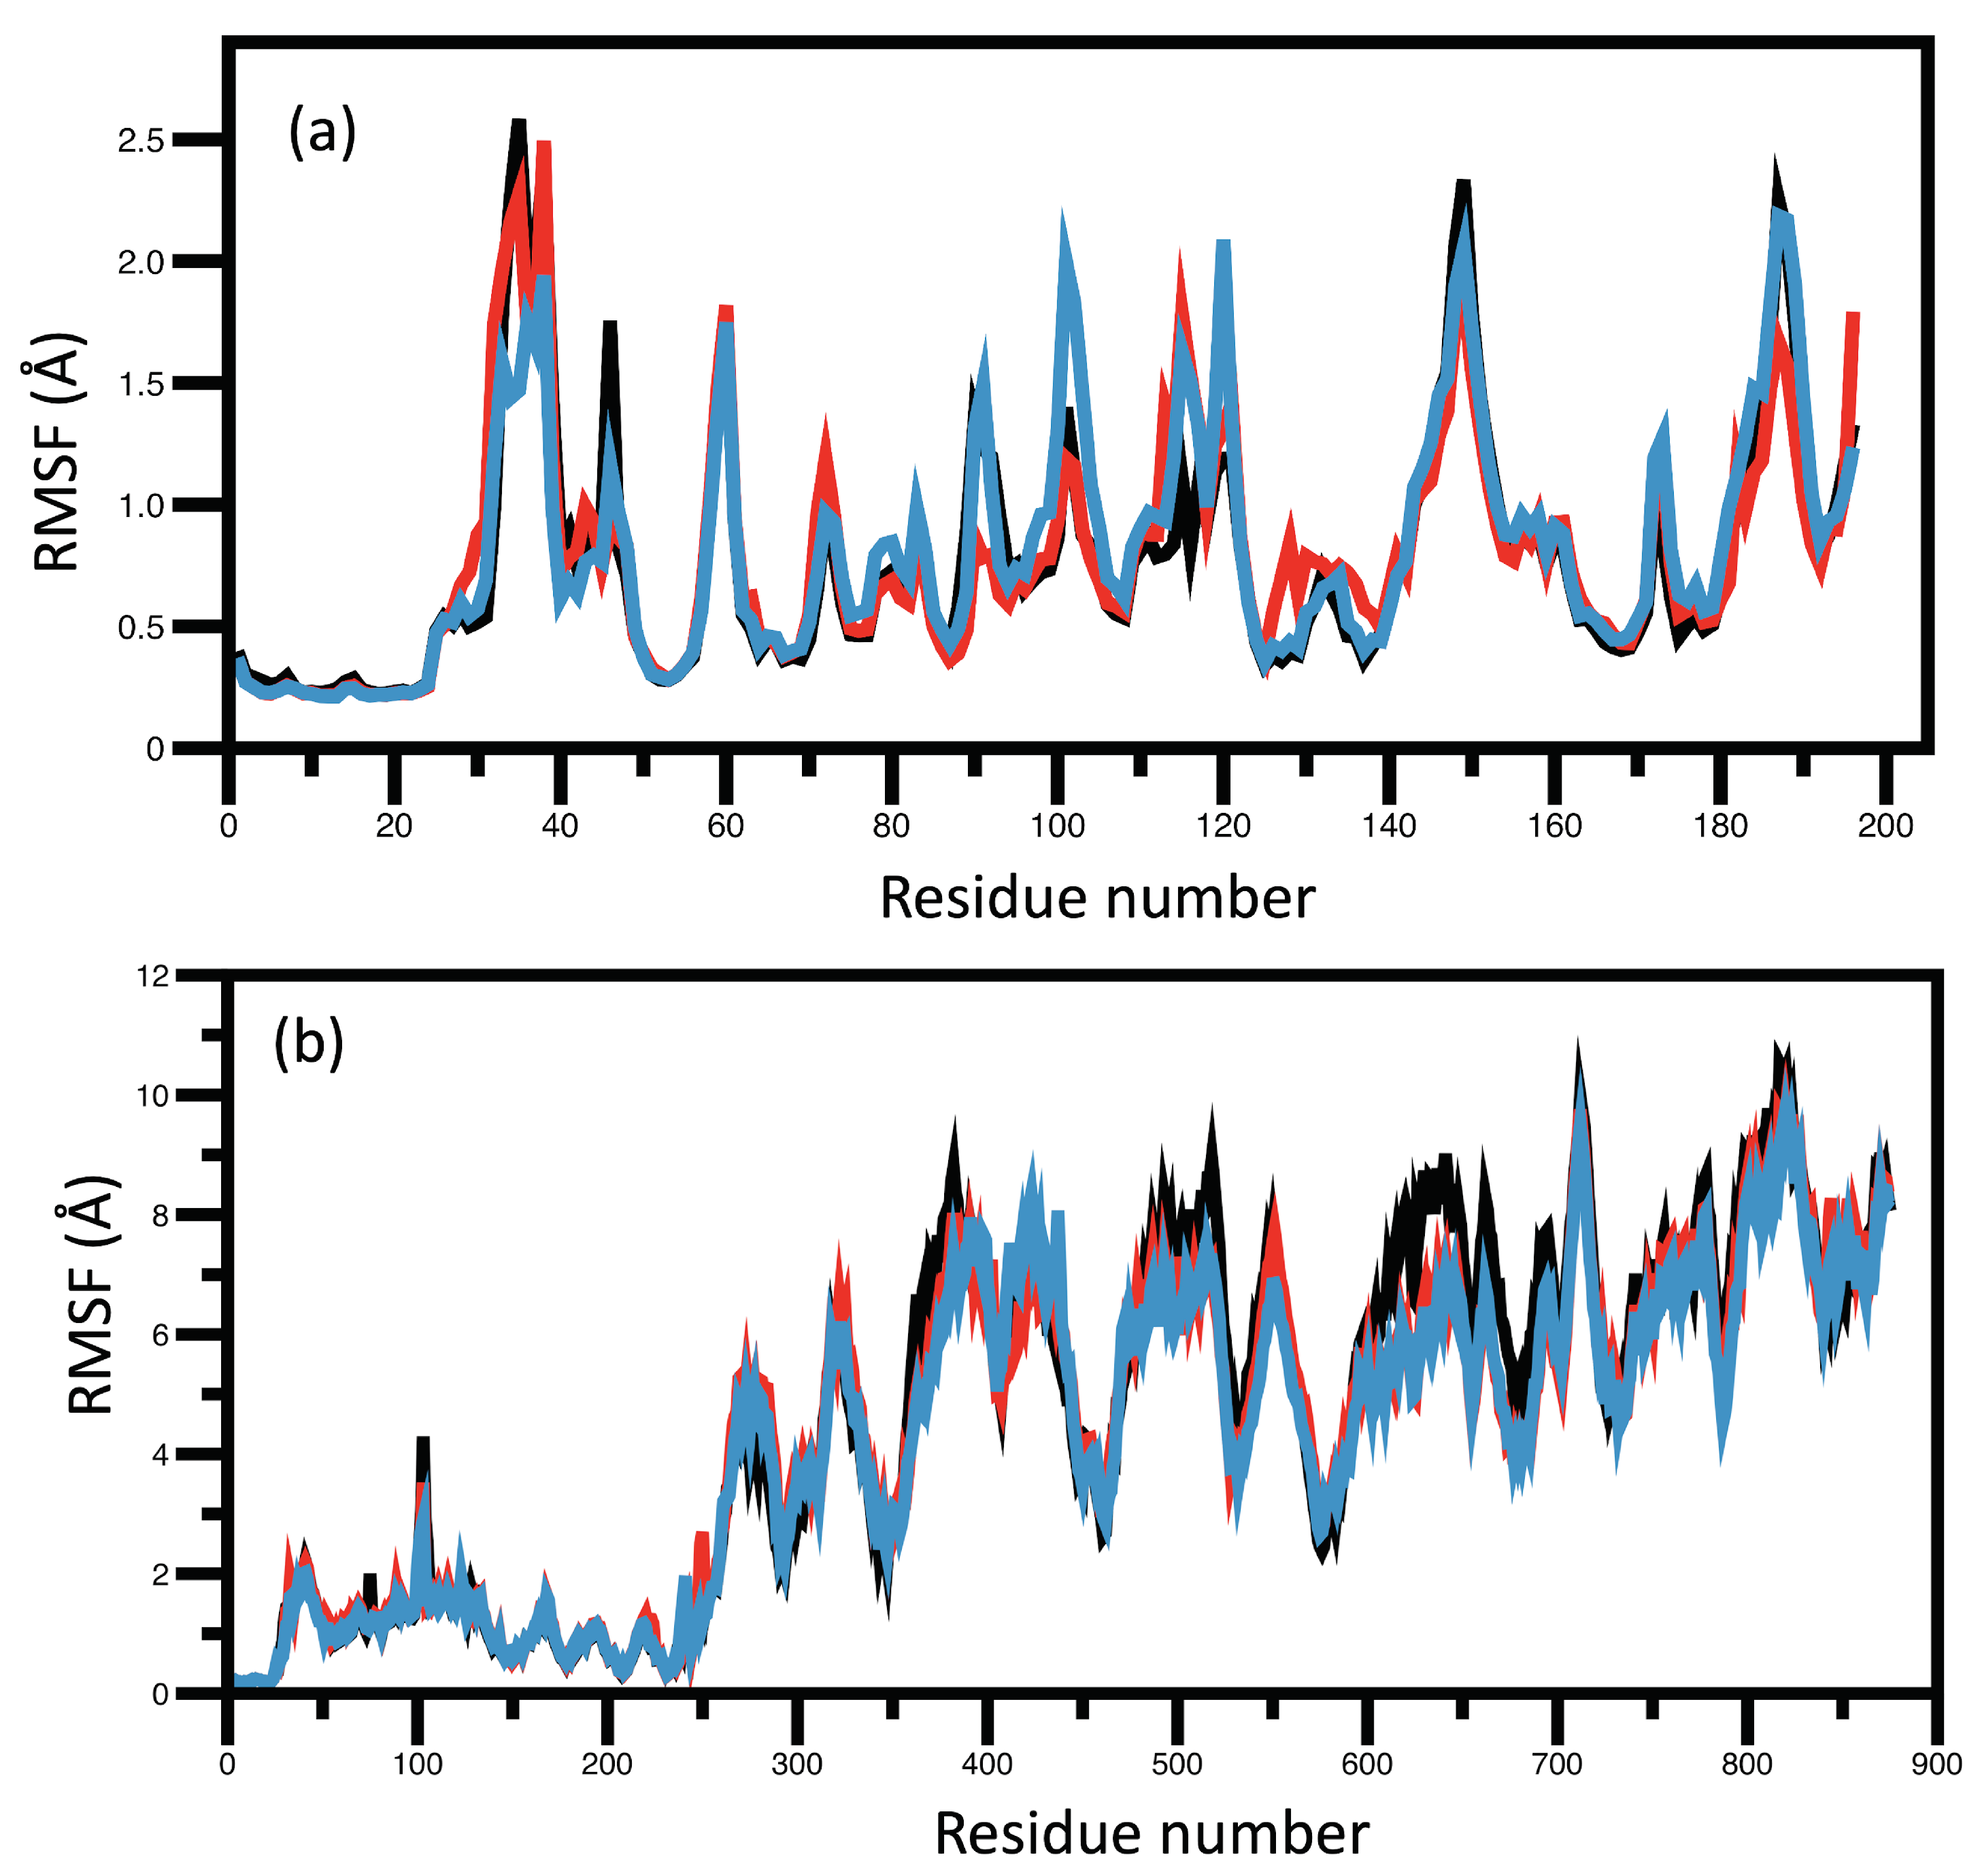
RMSD and RMSF Analysis
3.3. Drug-Likeliness and ADME Properties
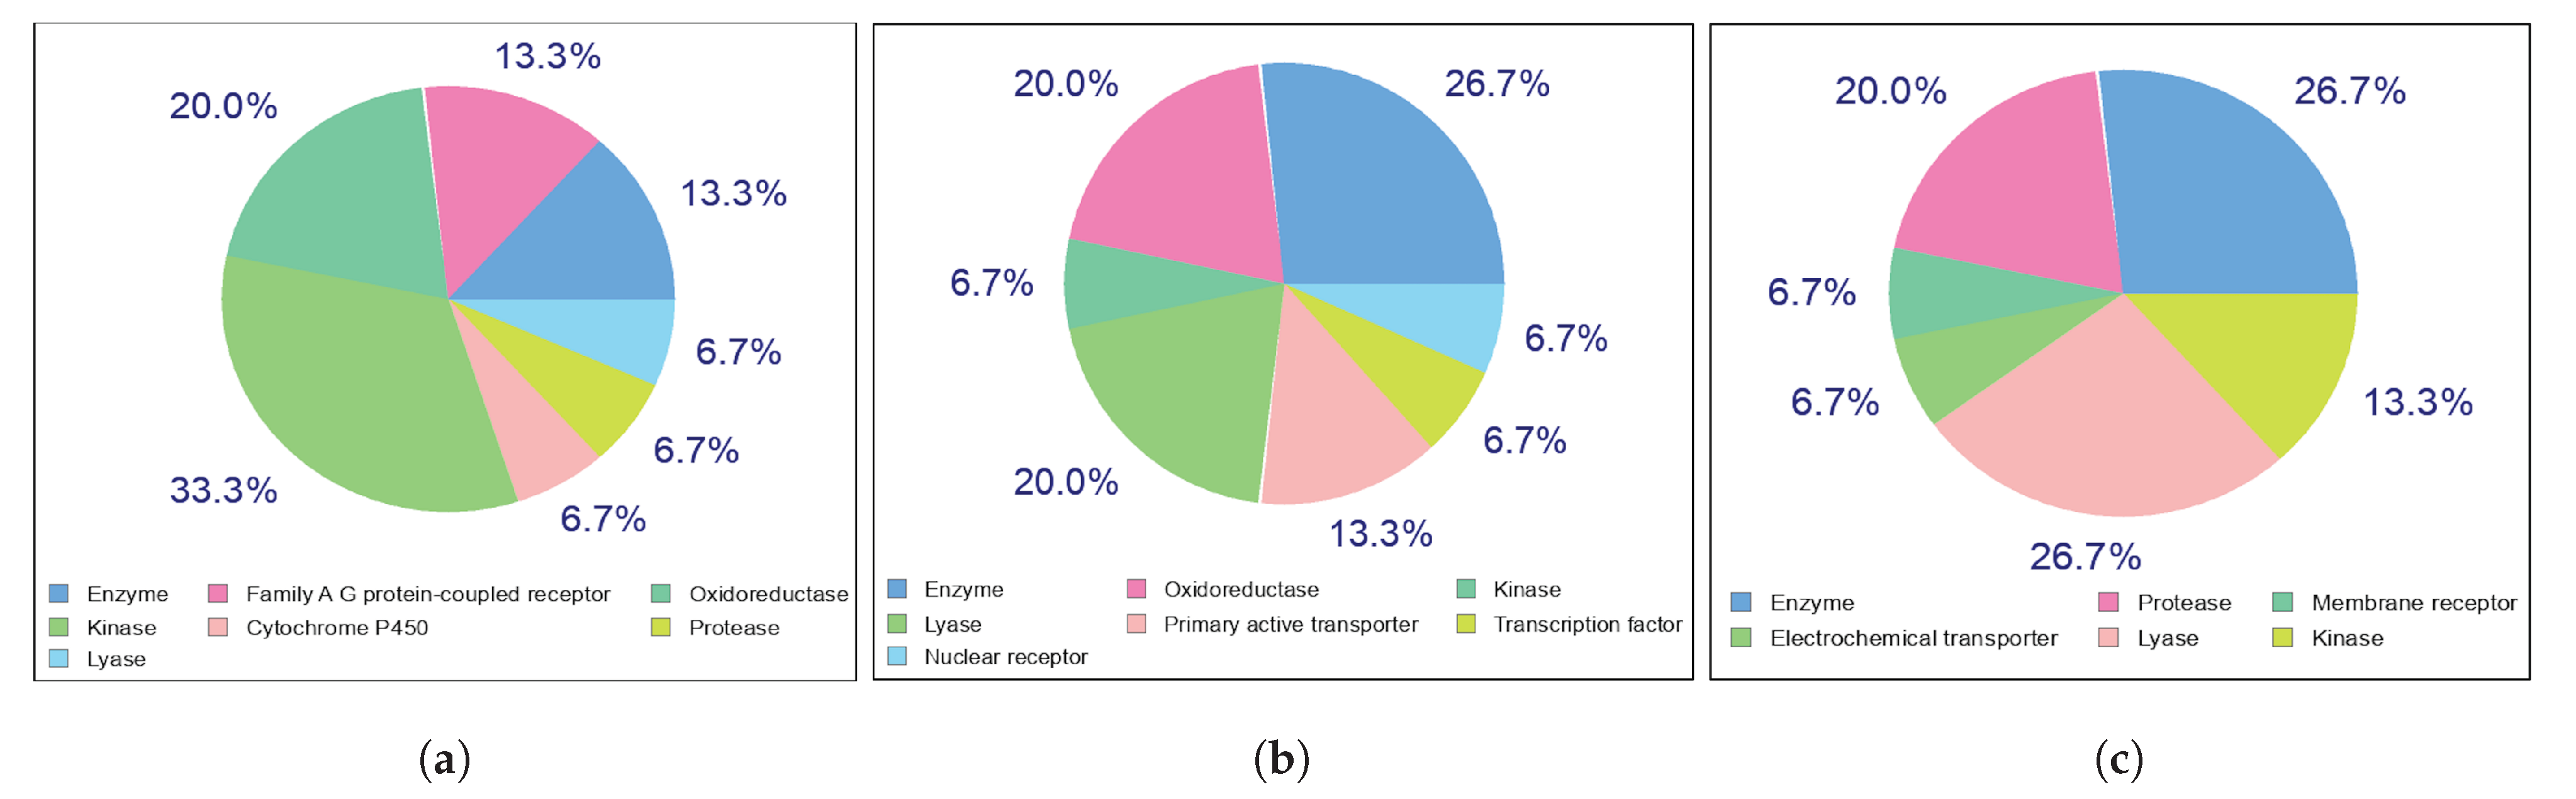
Potential Targets for Kaempferol, Quercetin, and Chlorogenic Acid
3.4. QM/MM and LMA Results
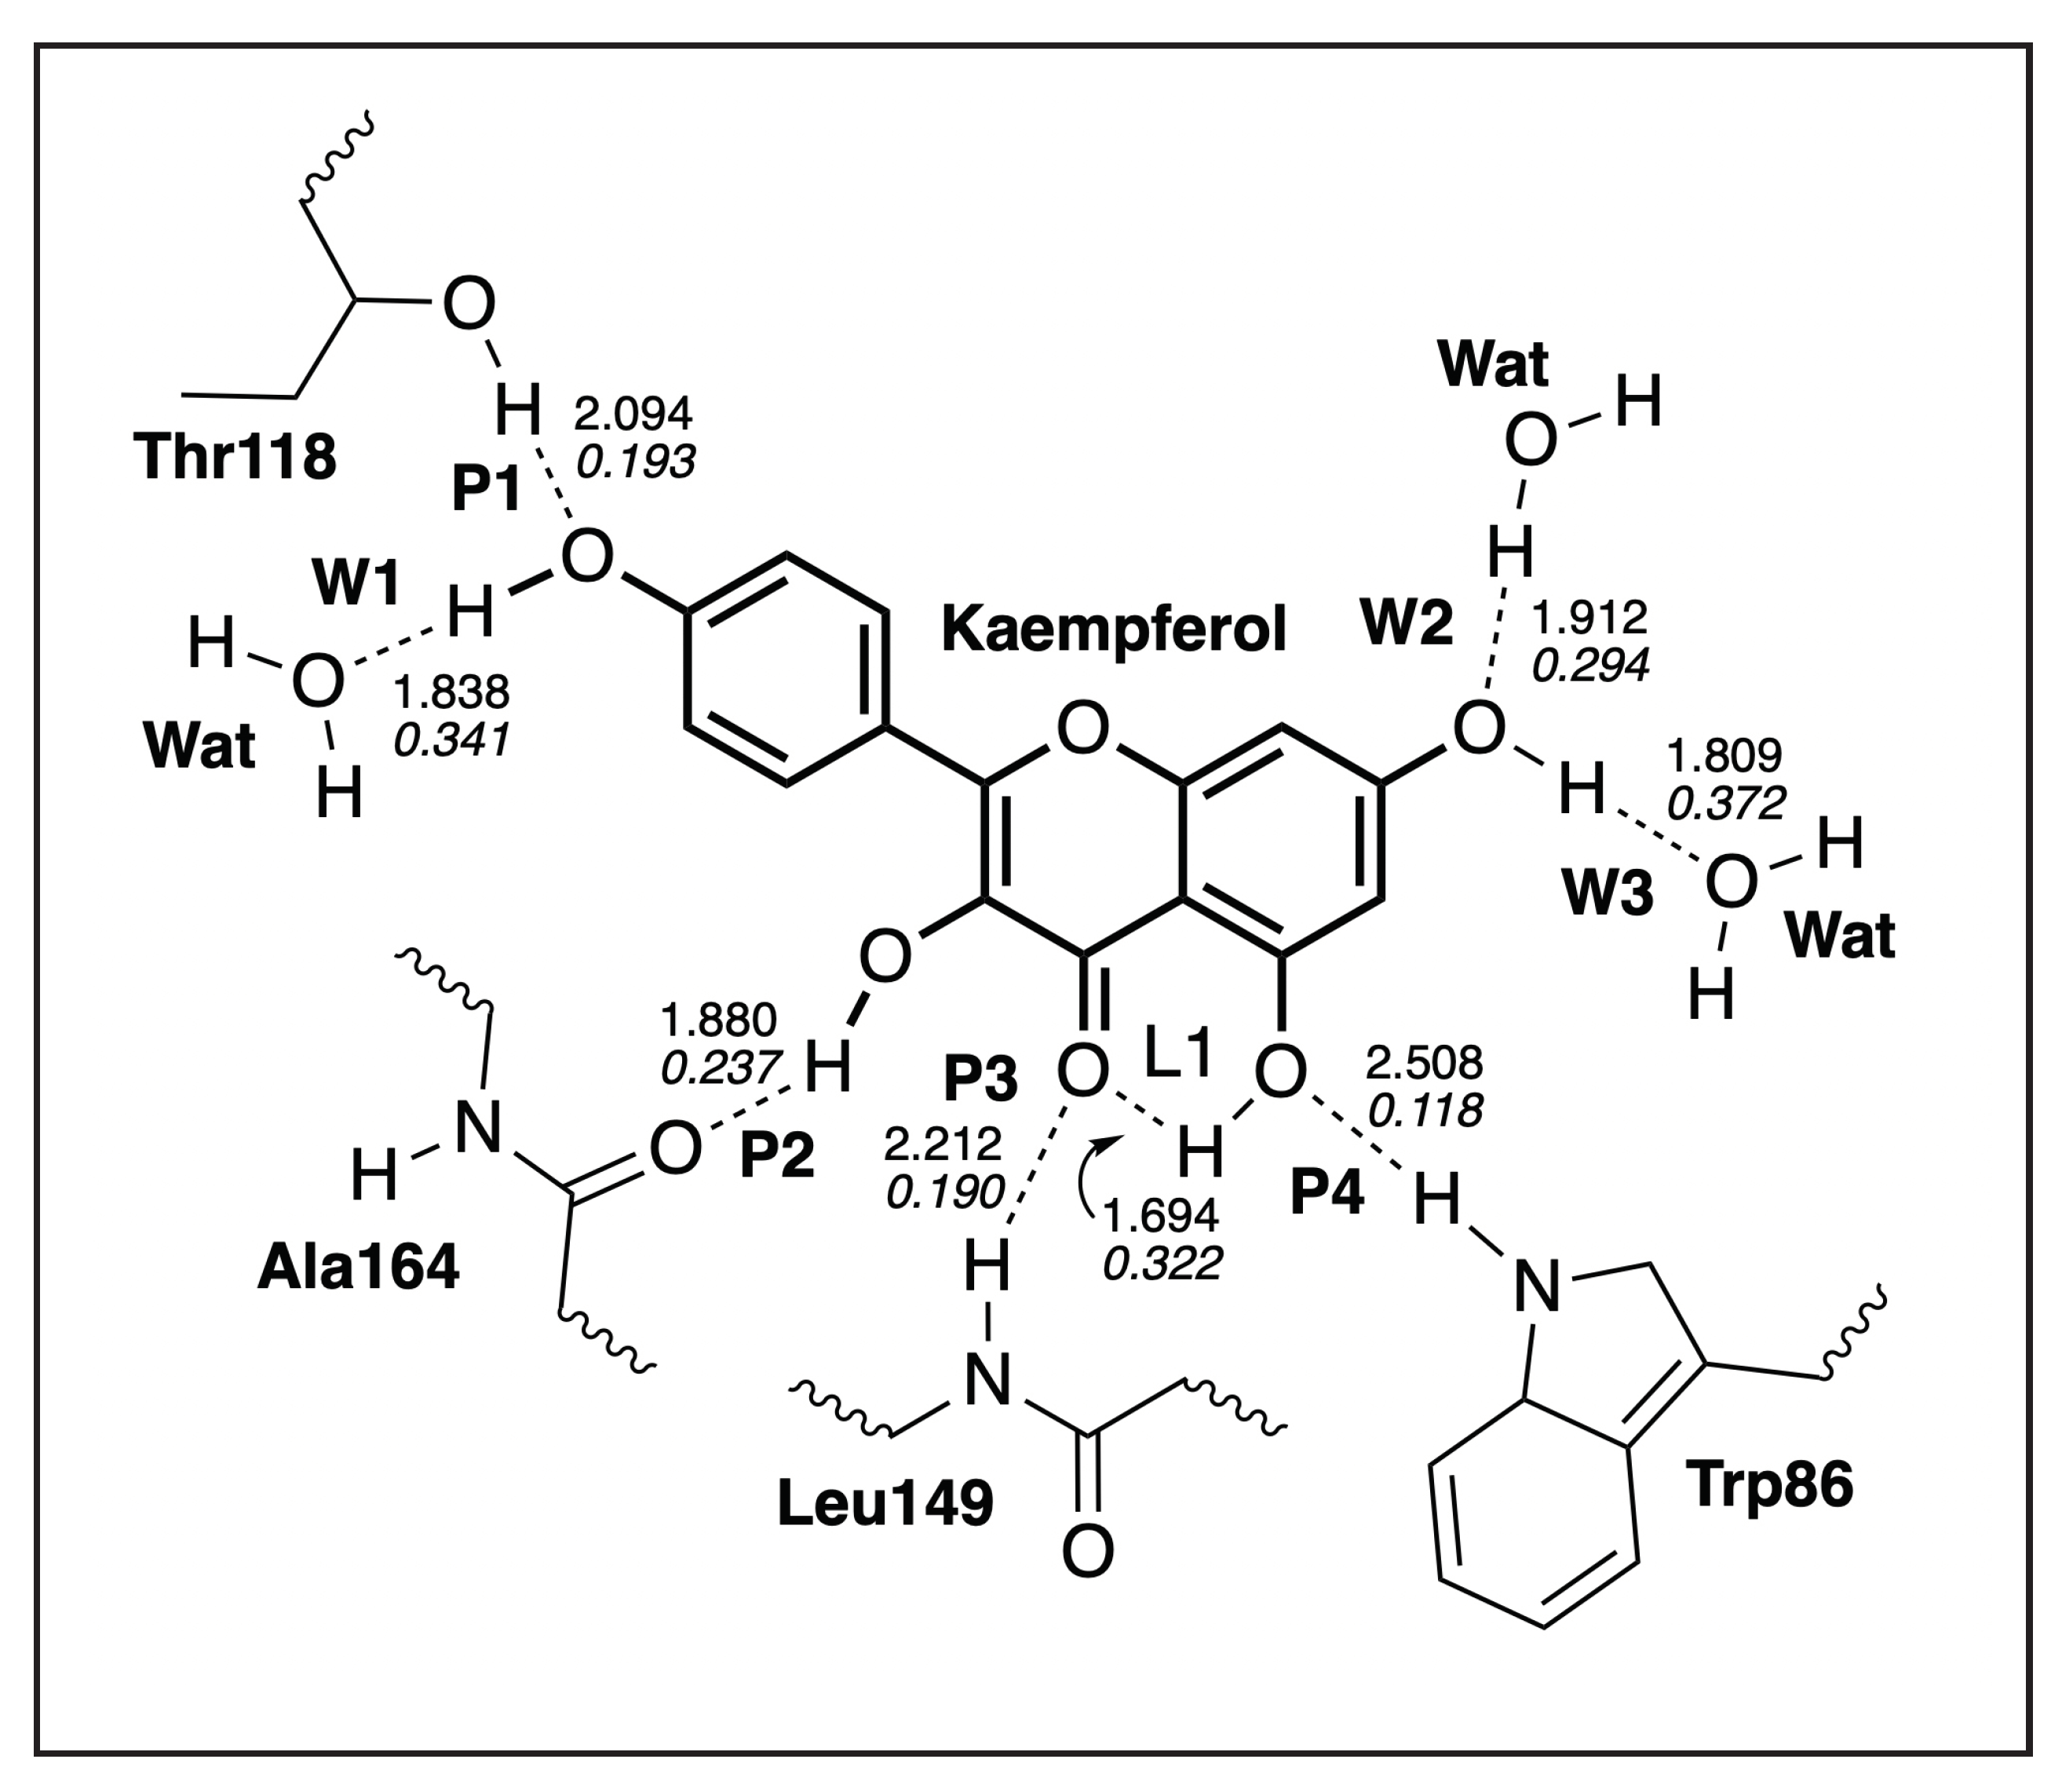
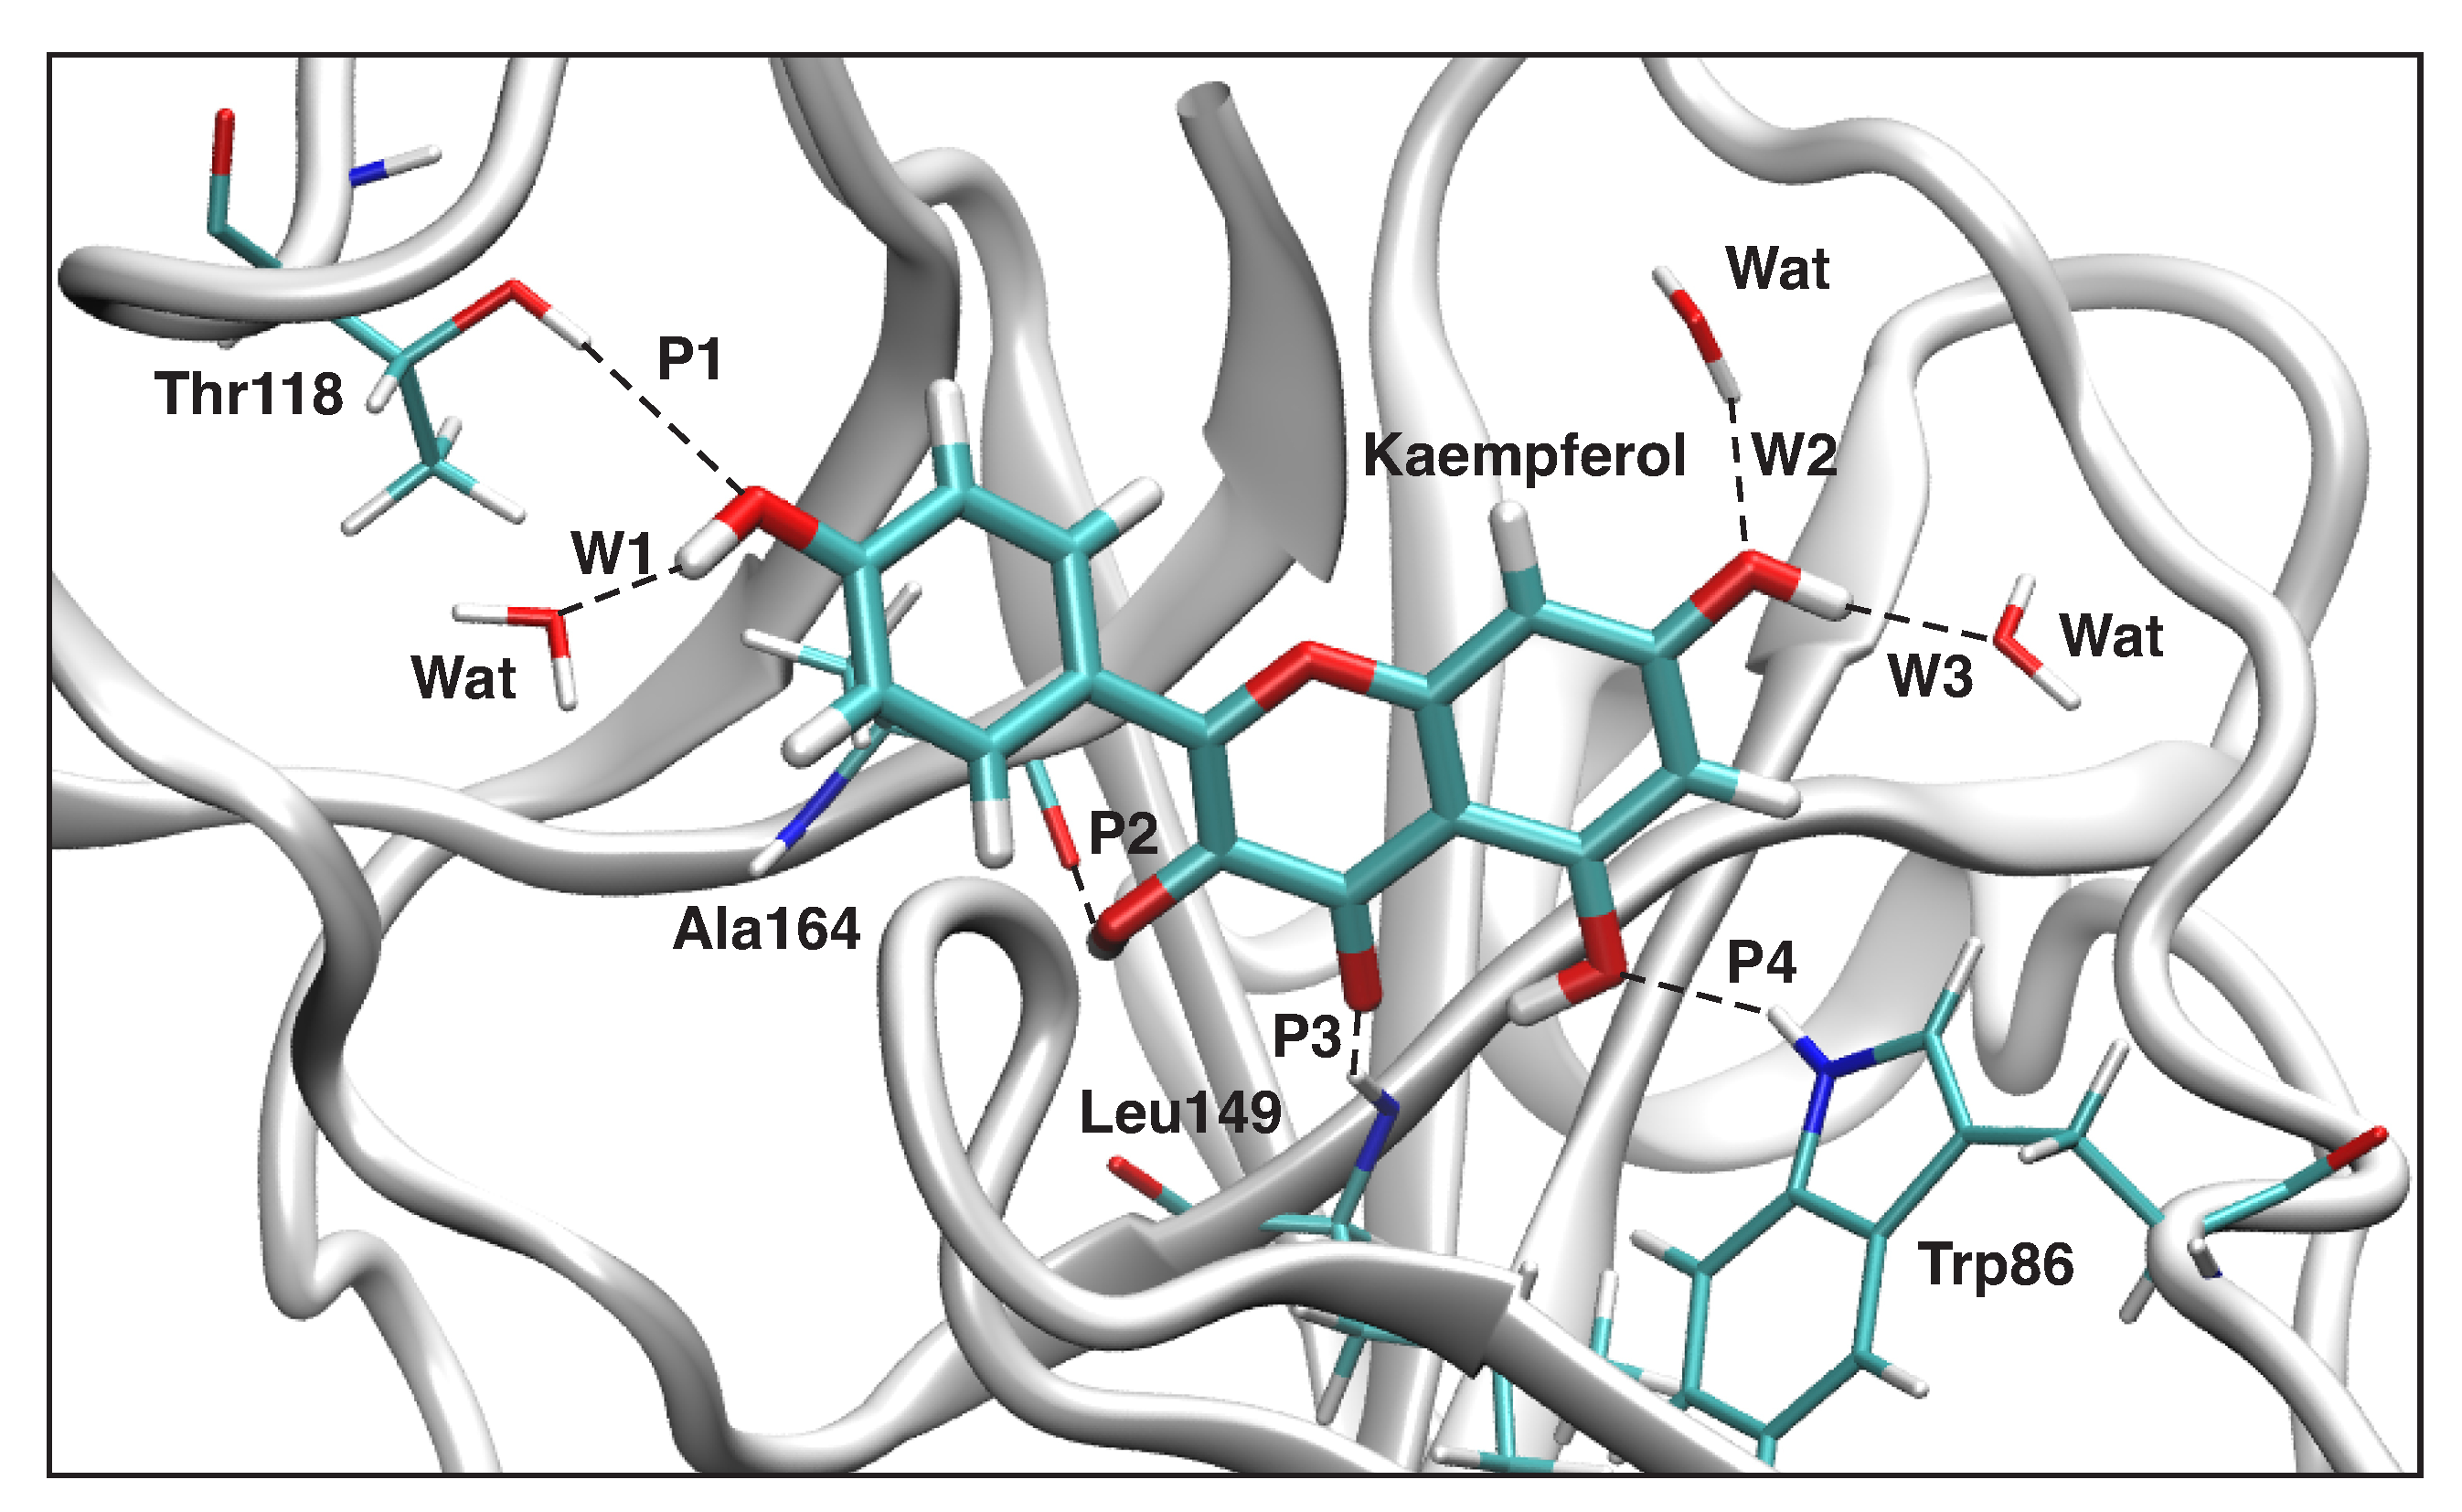
3.4.1. Kaempferol-NS3
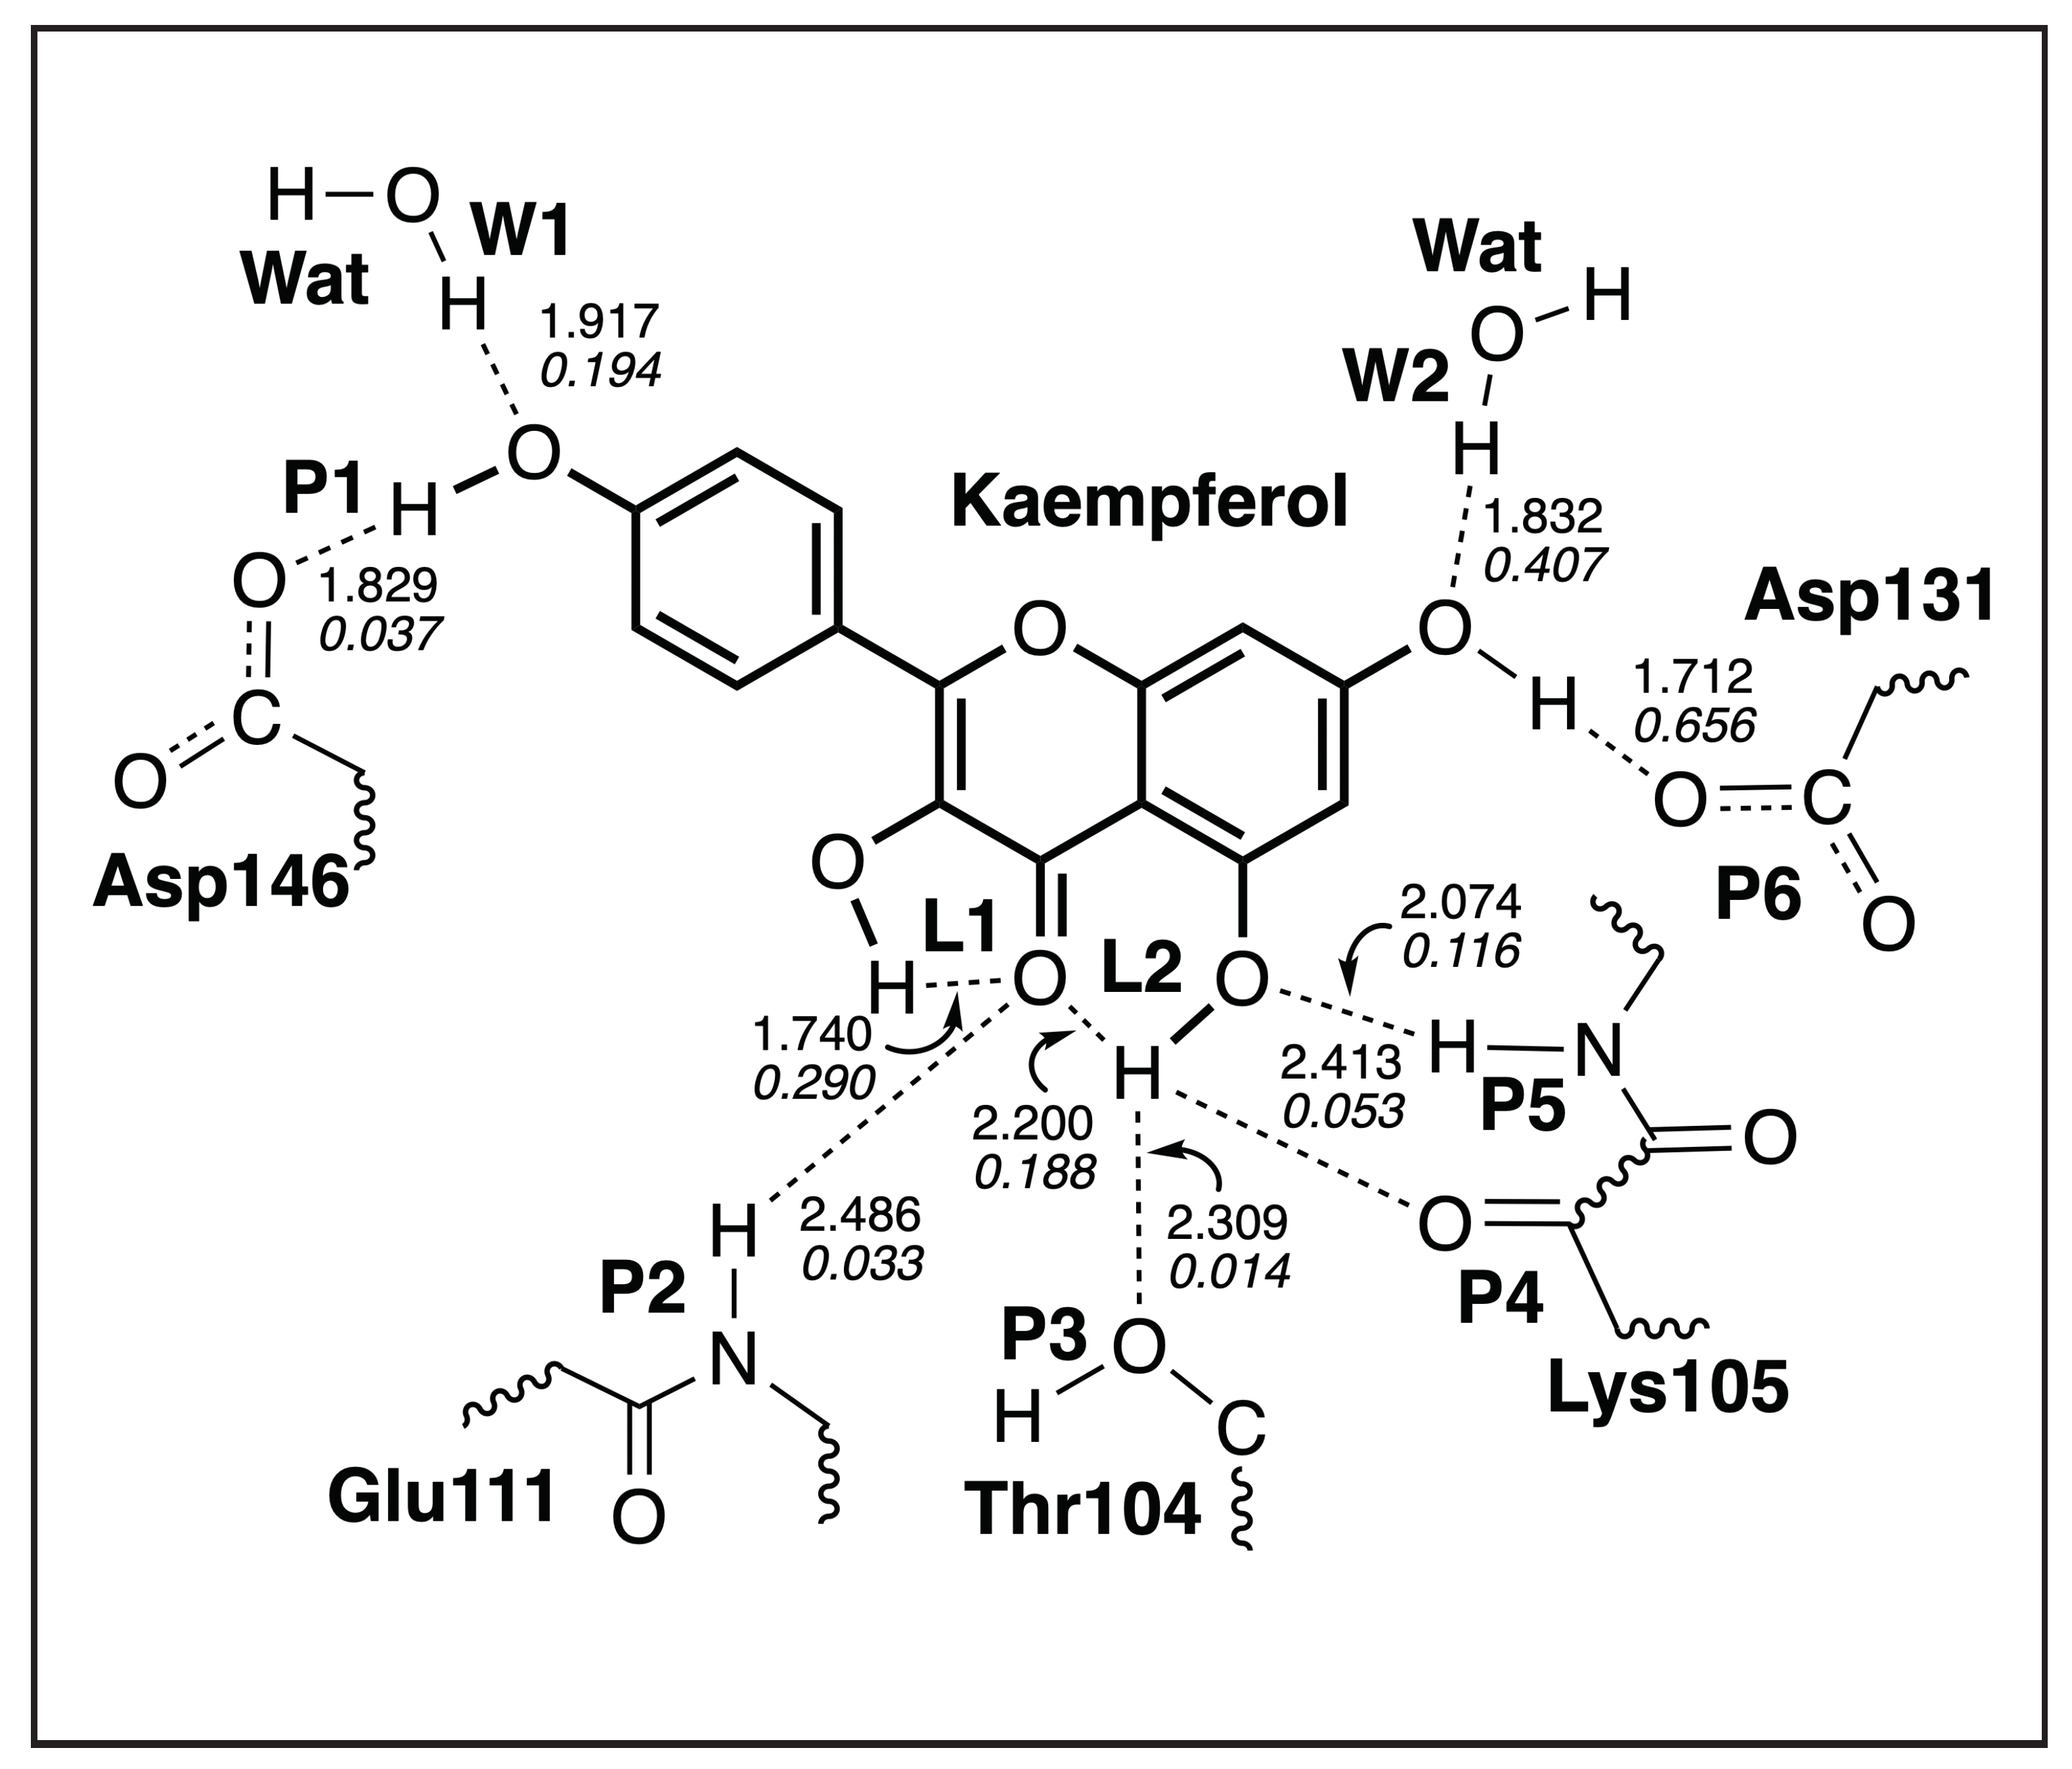
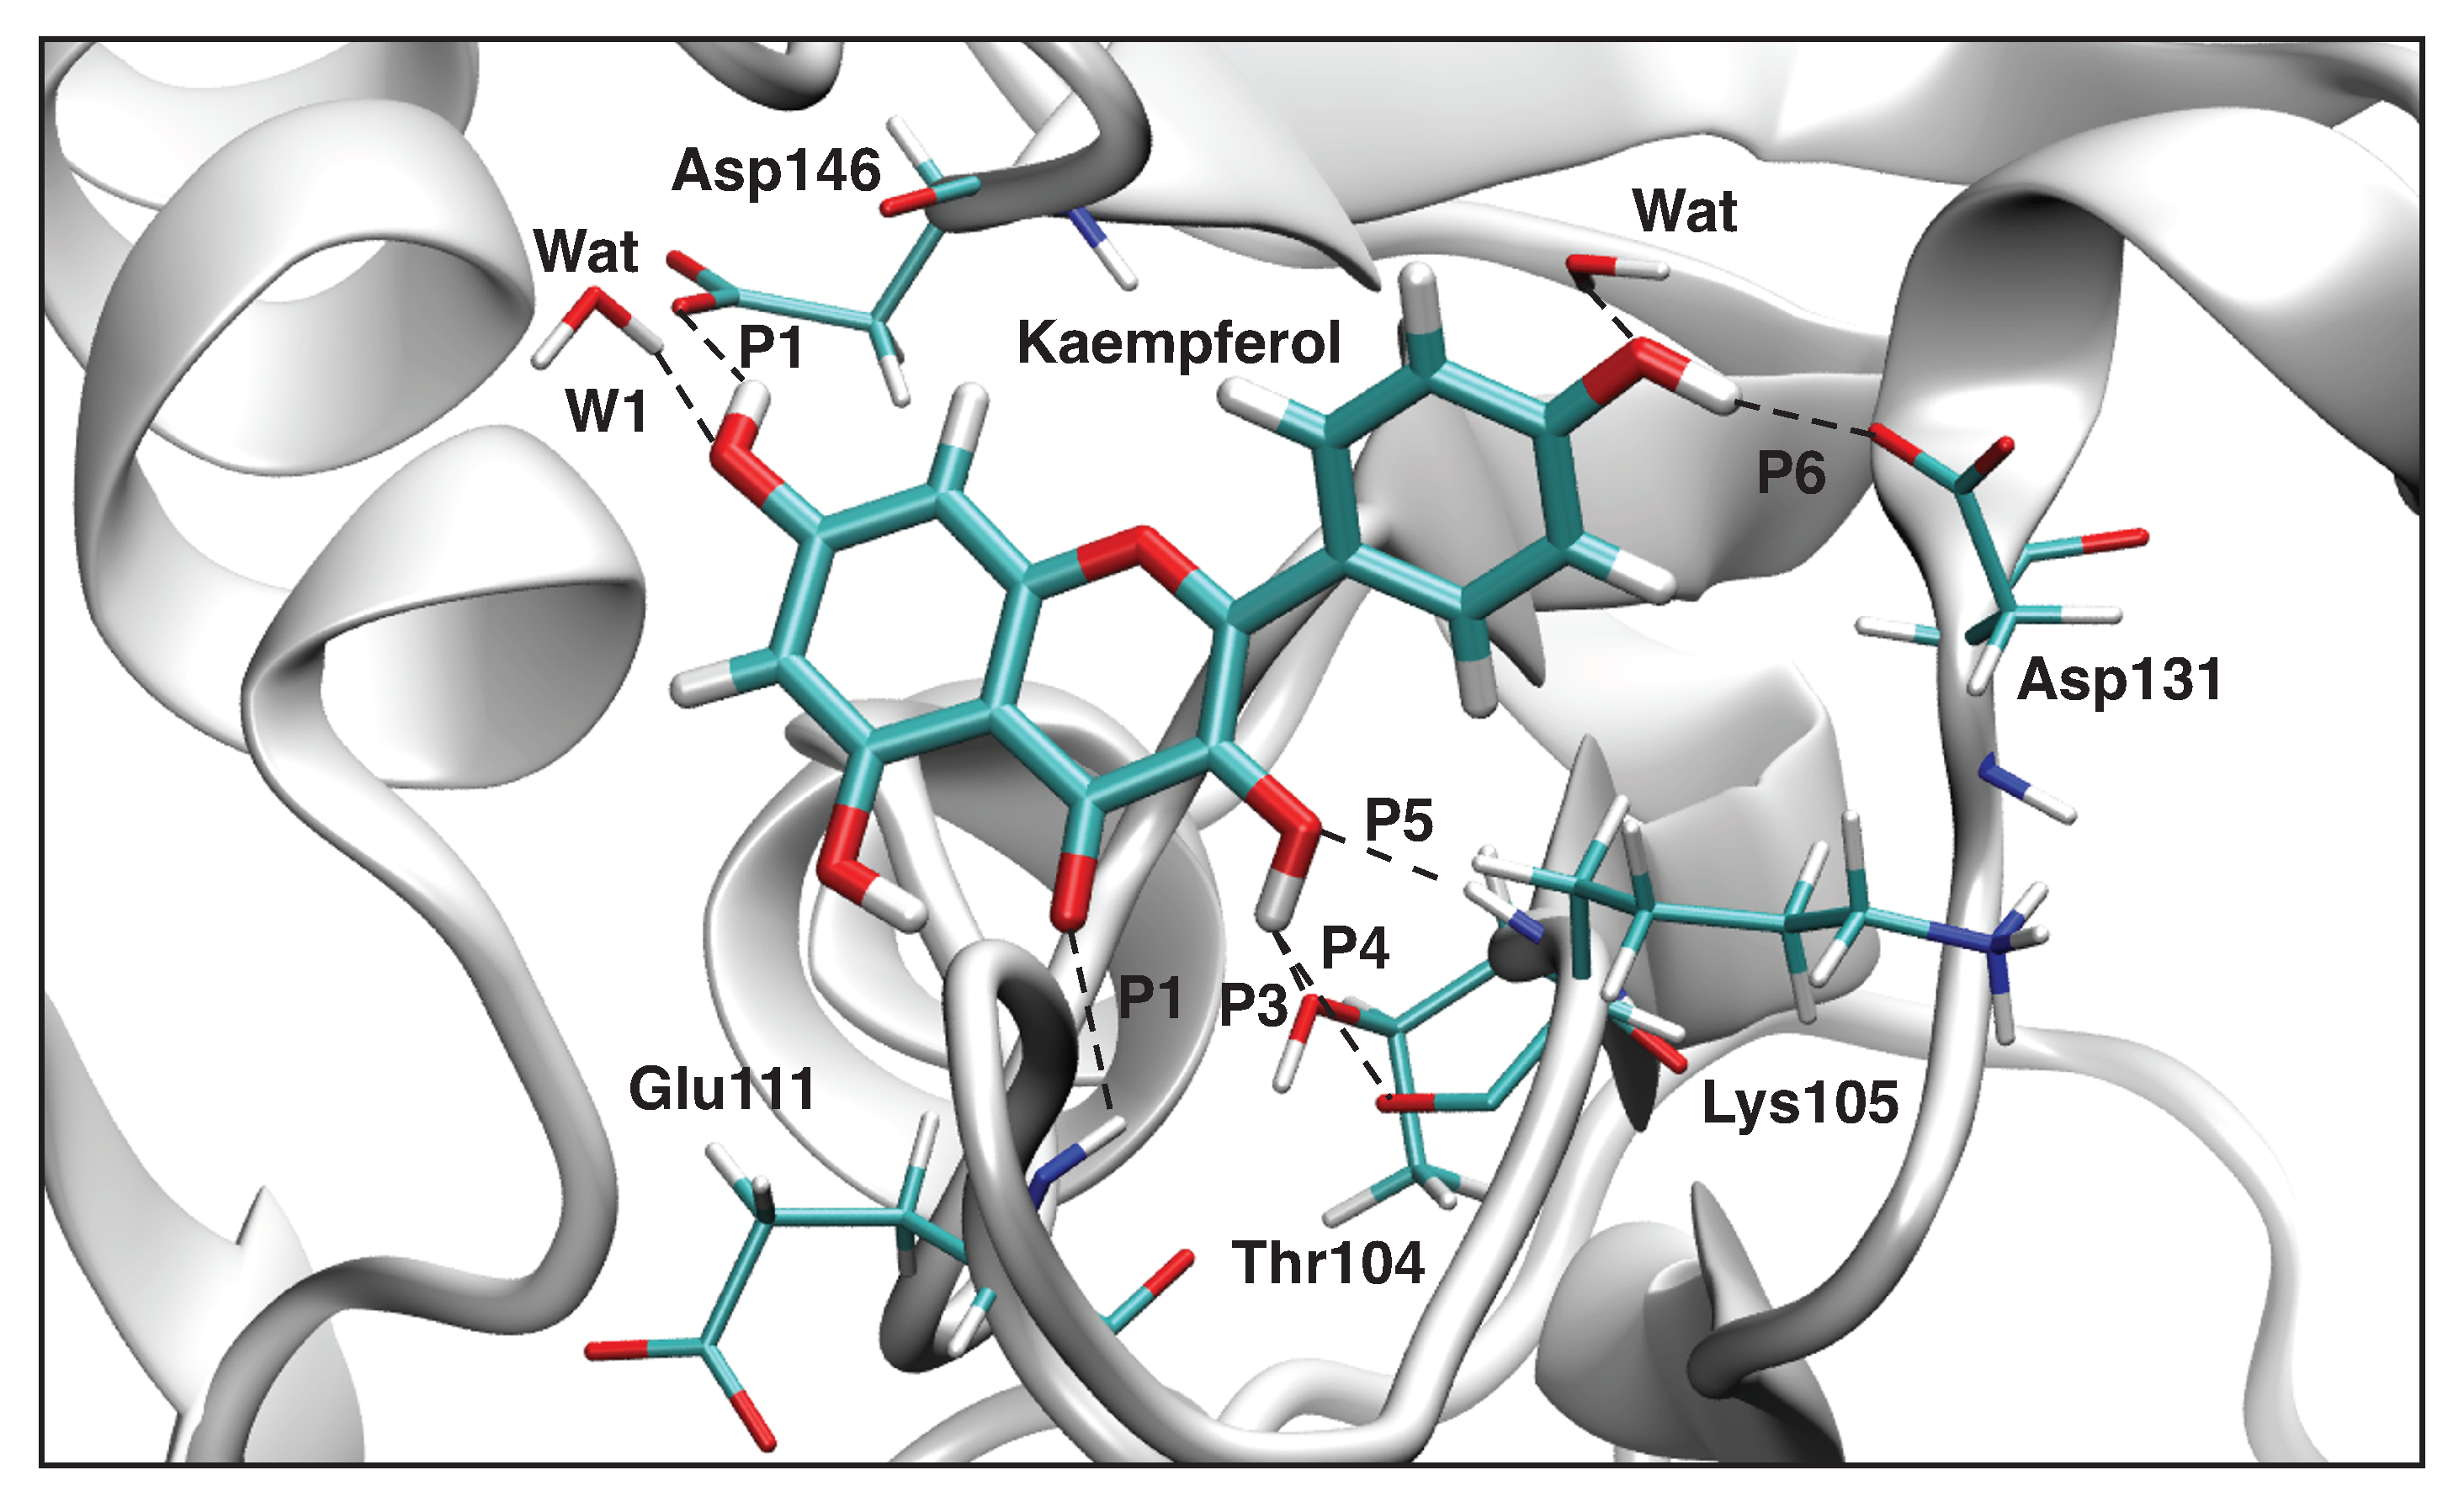
3.4.2. Kaempferol-NS5
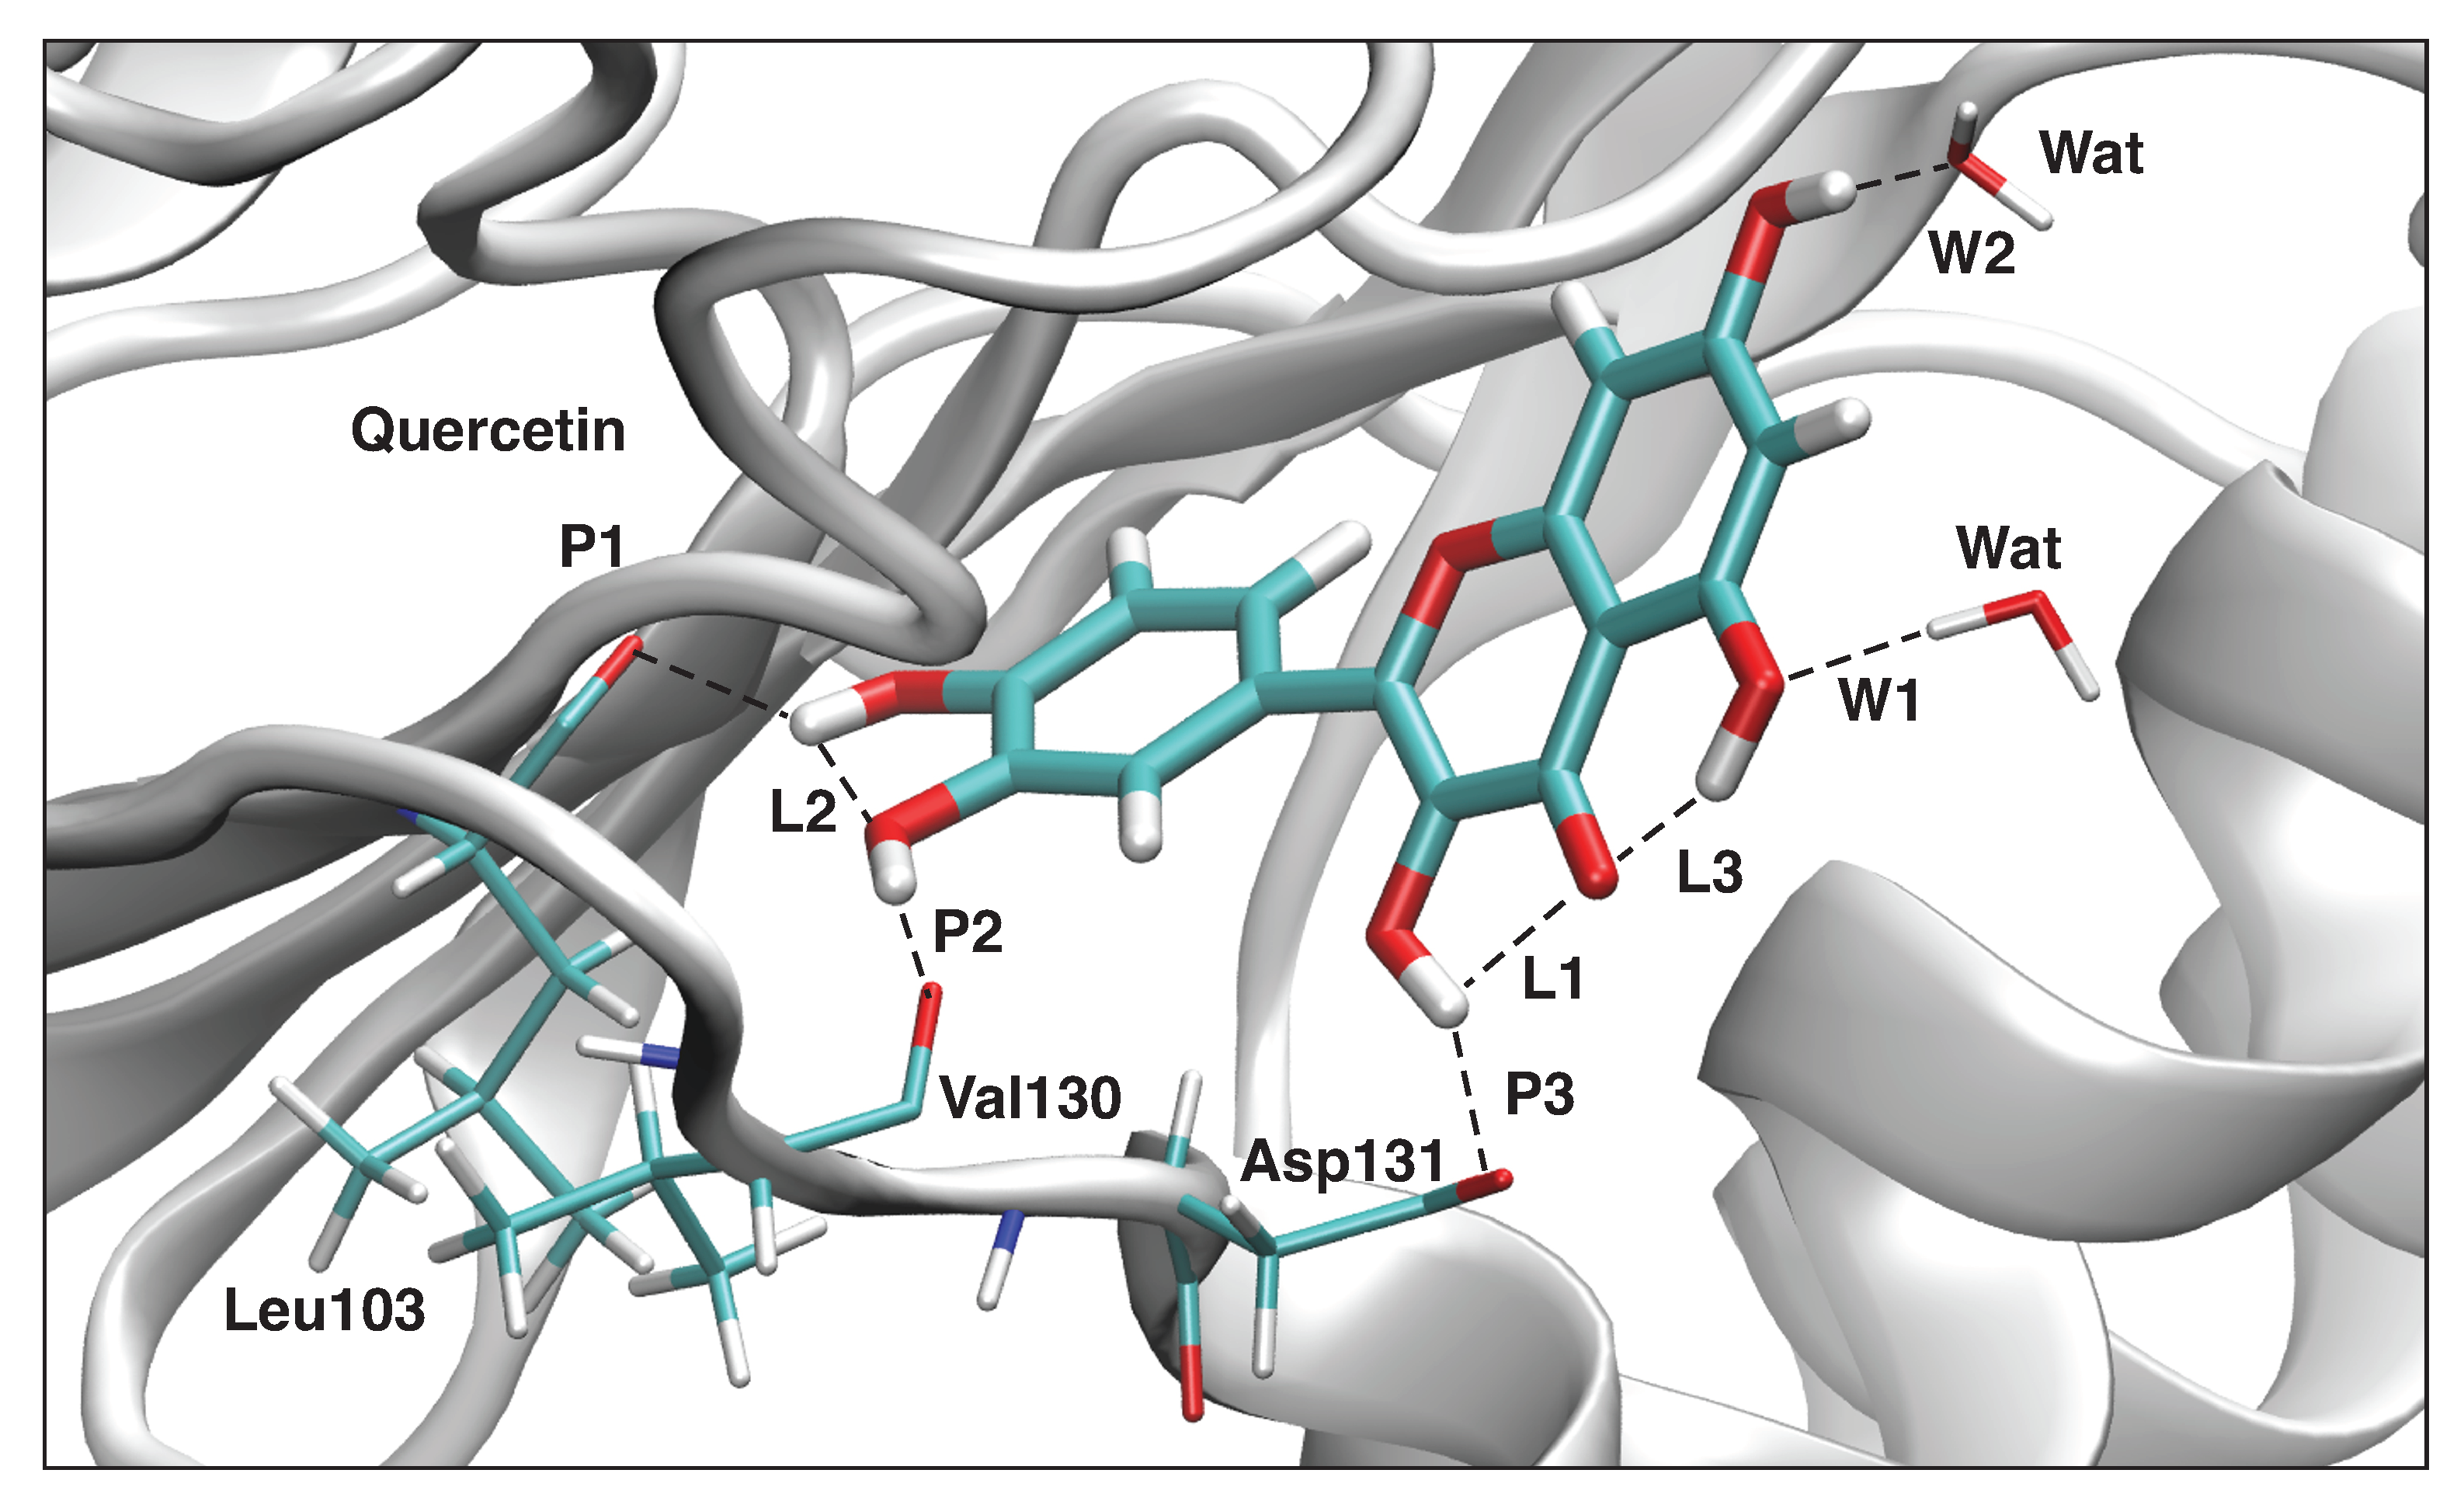
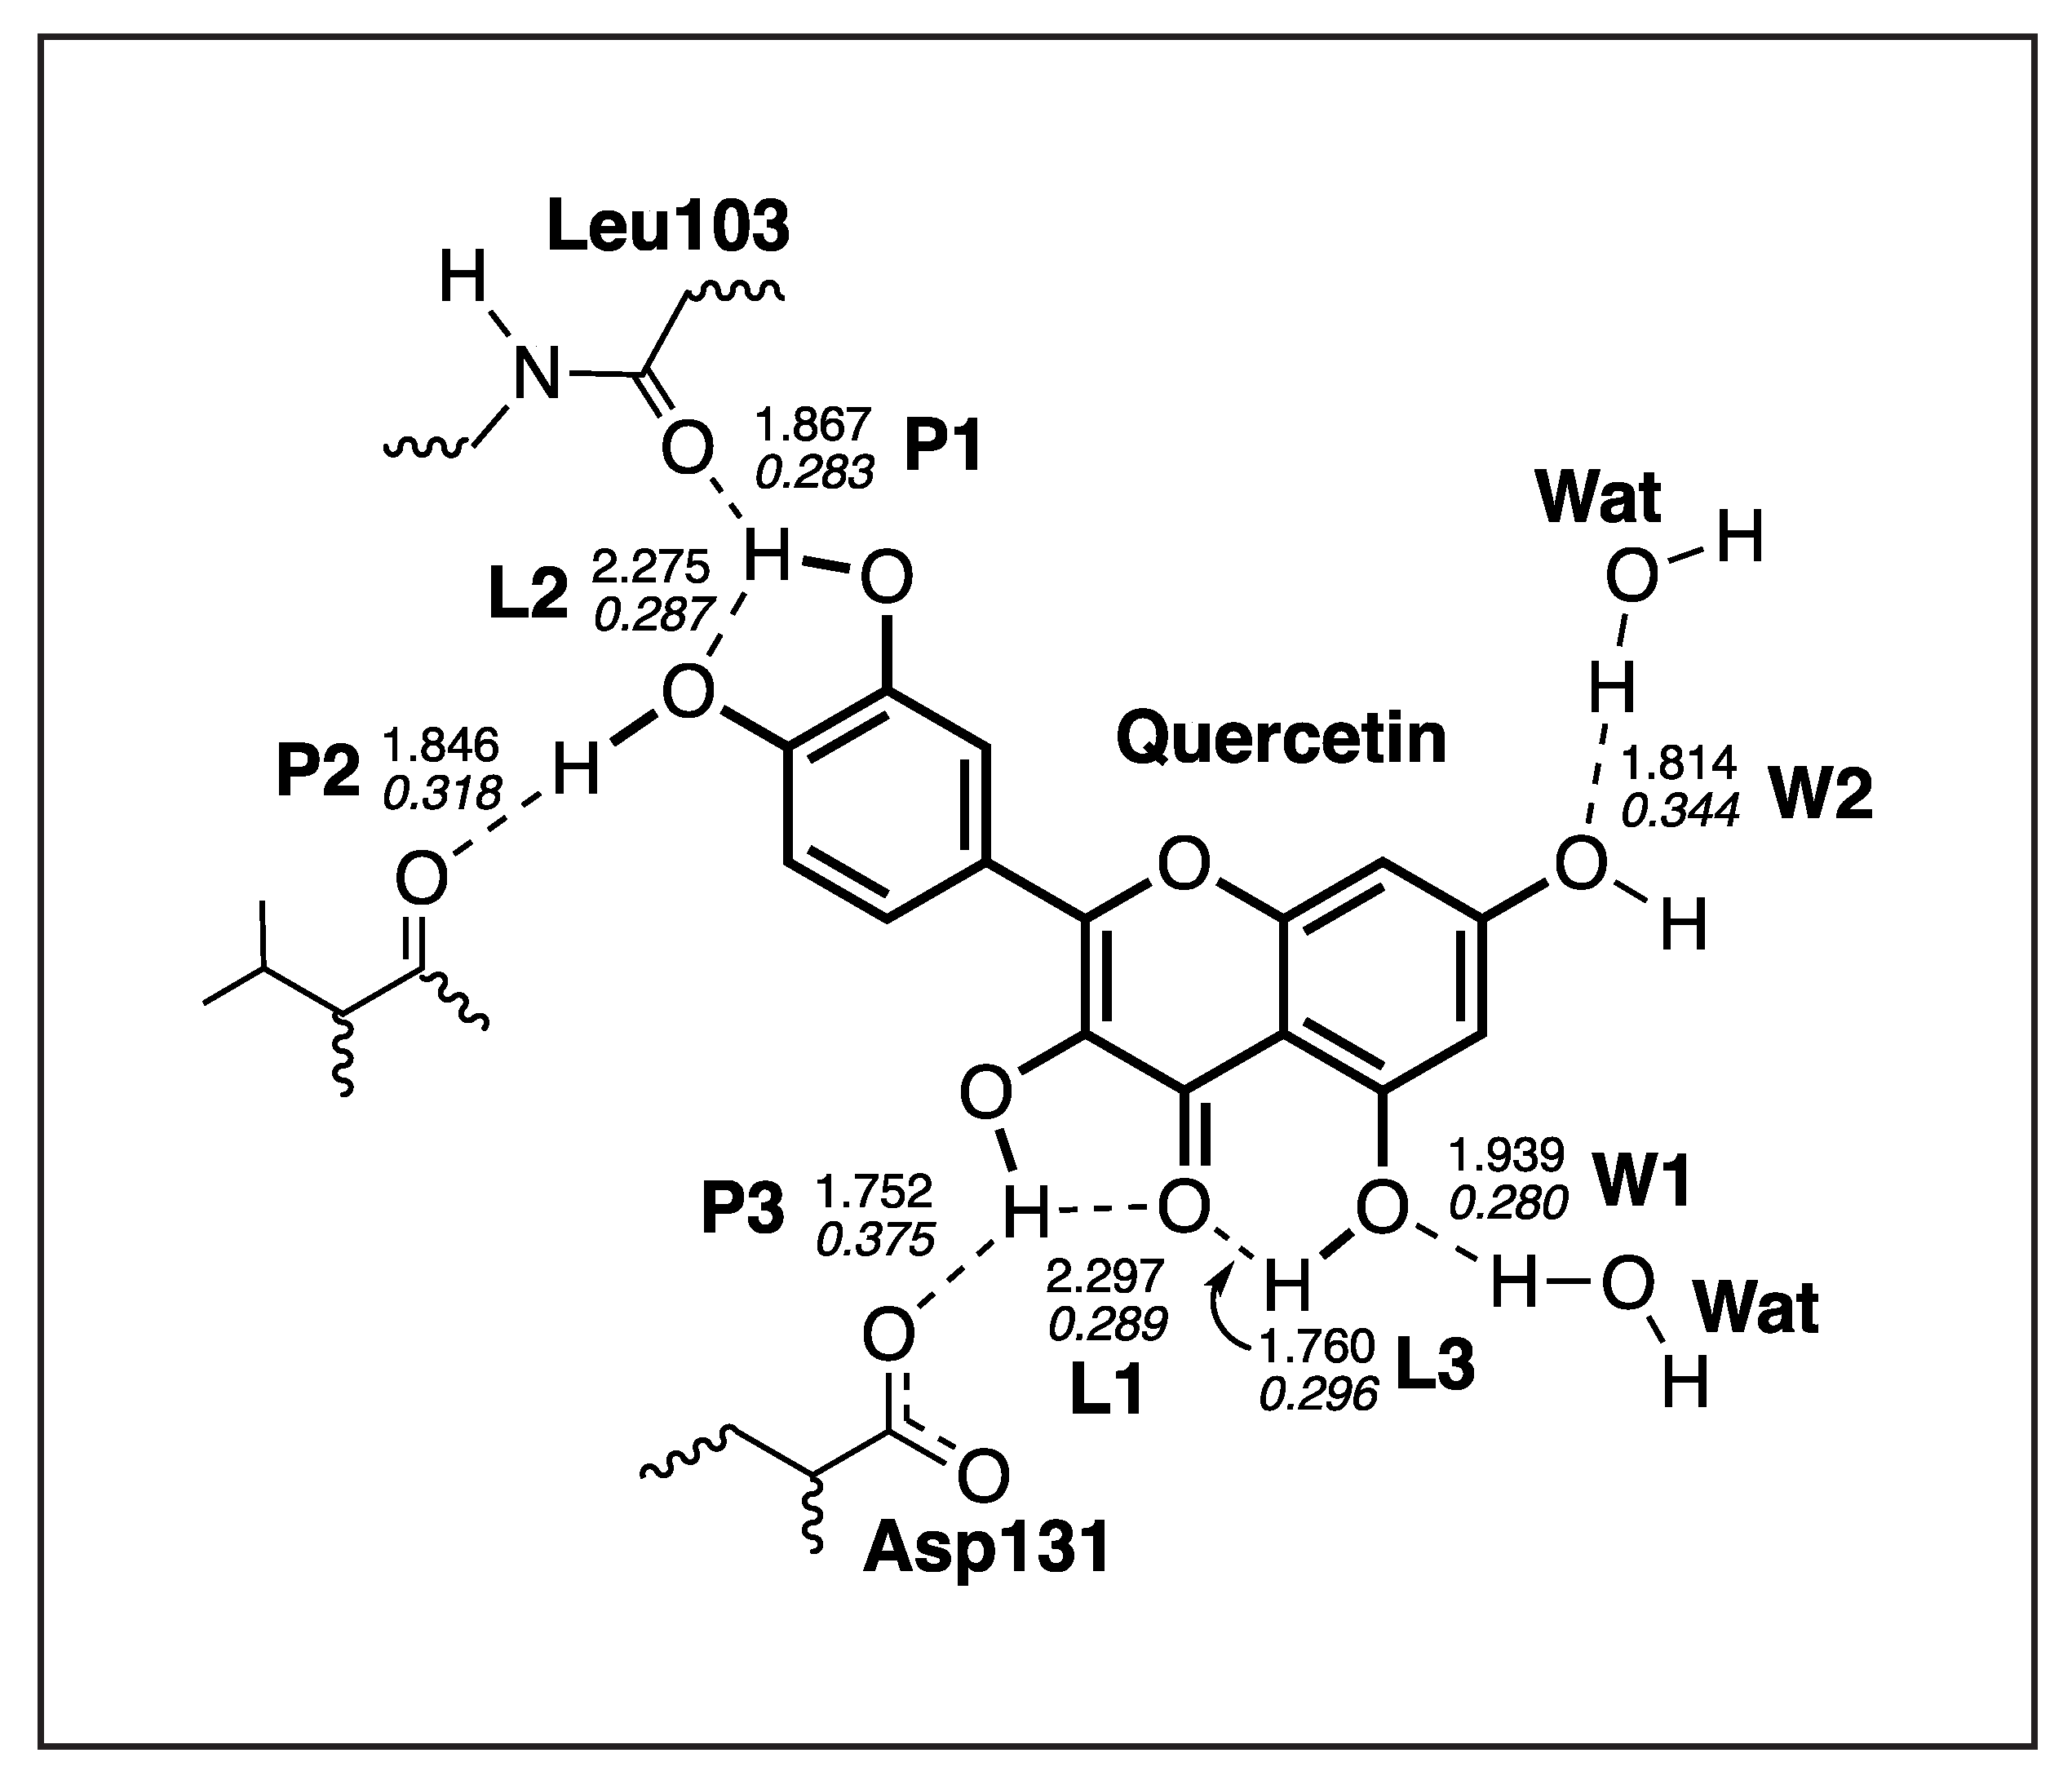
3.4.3. Quercetin-NS3
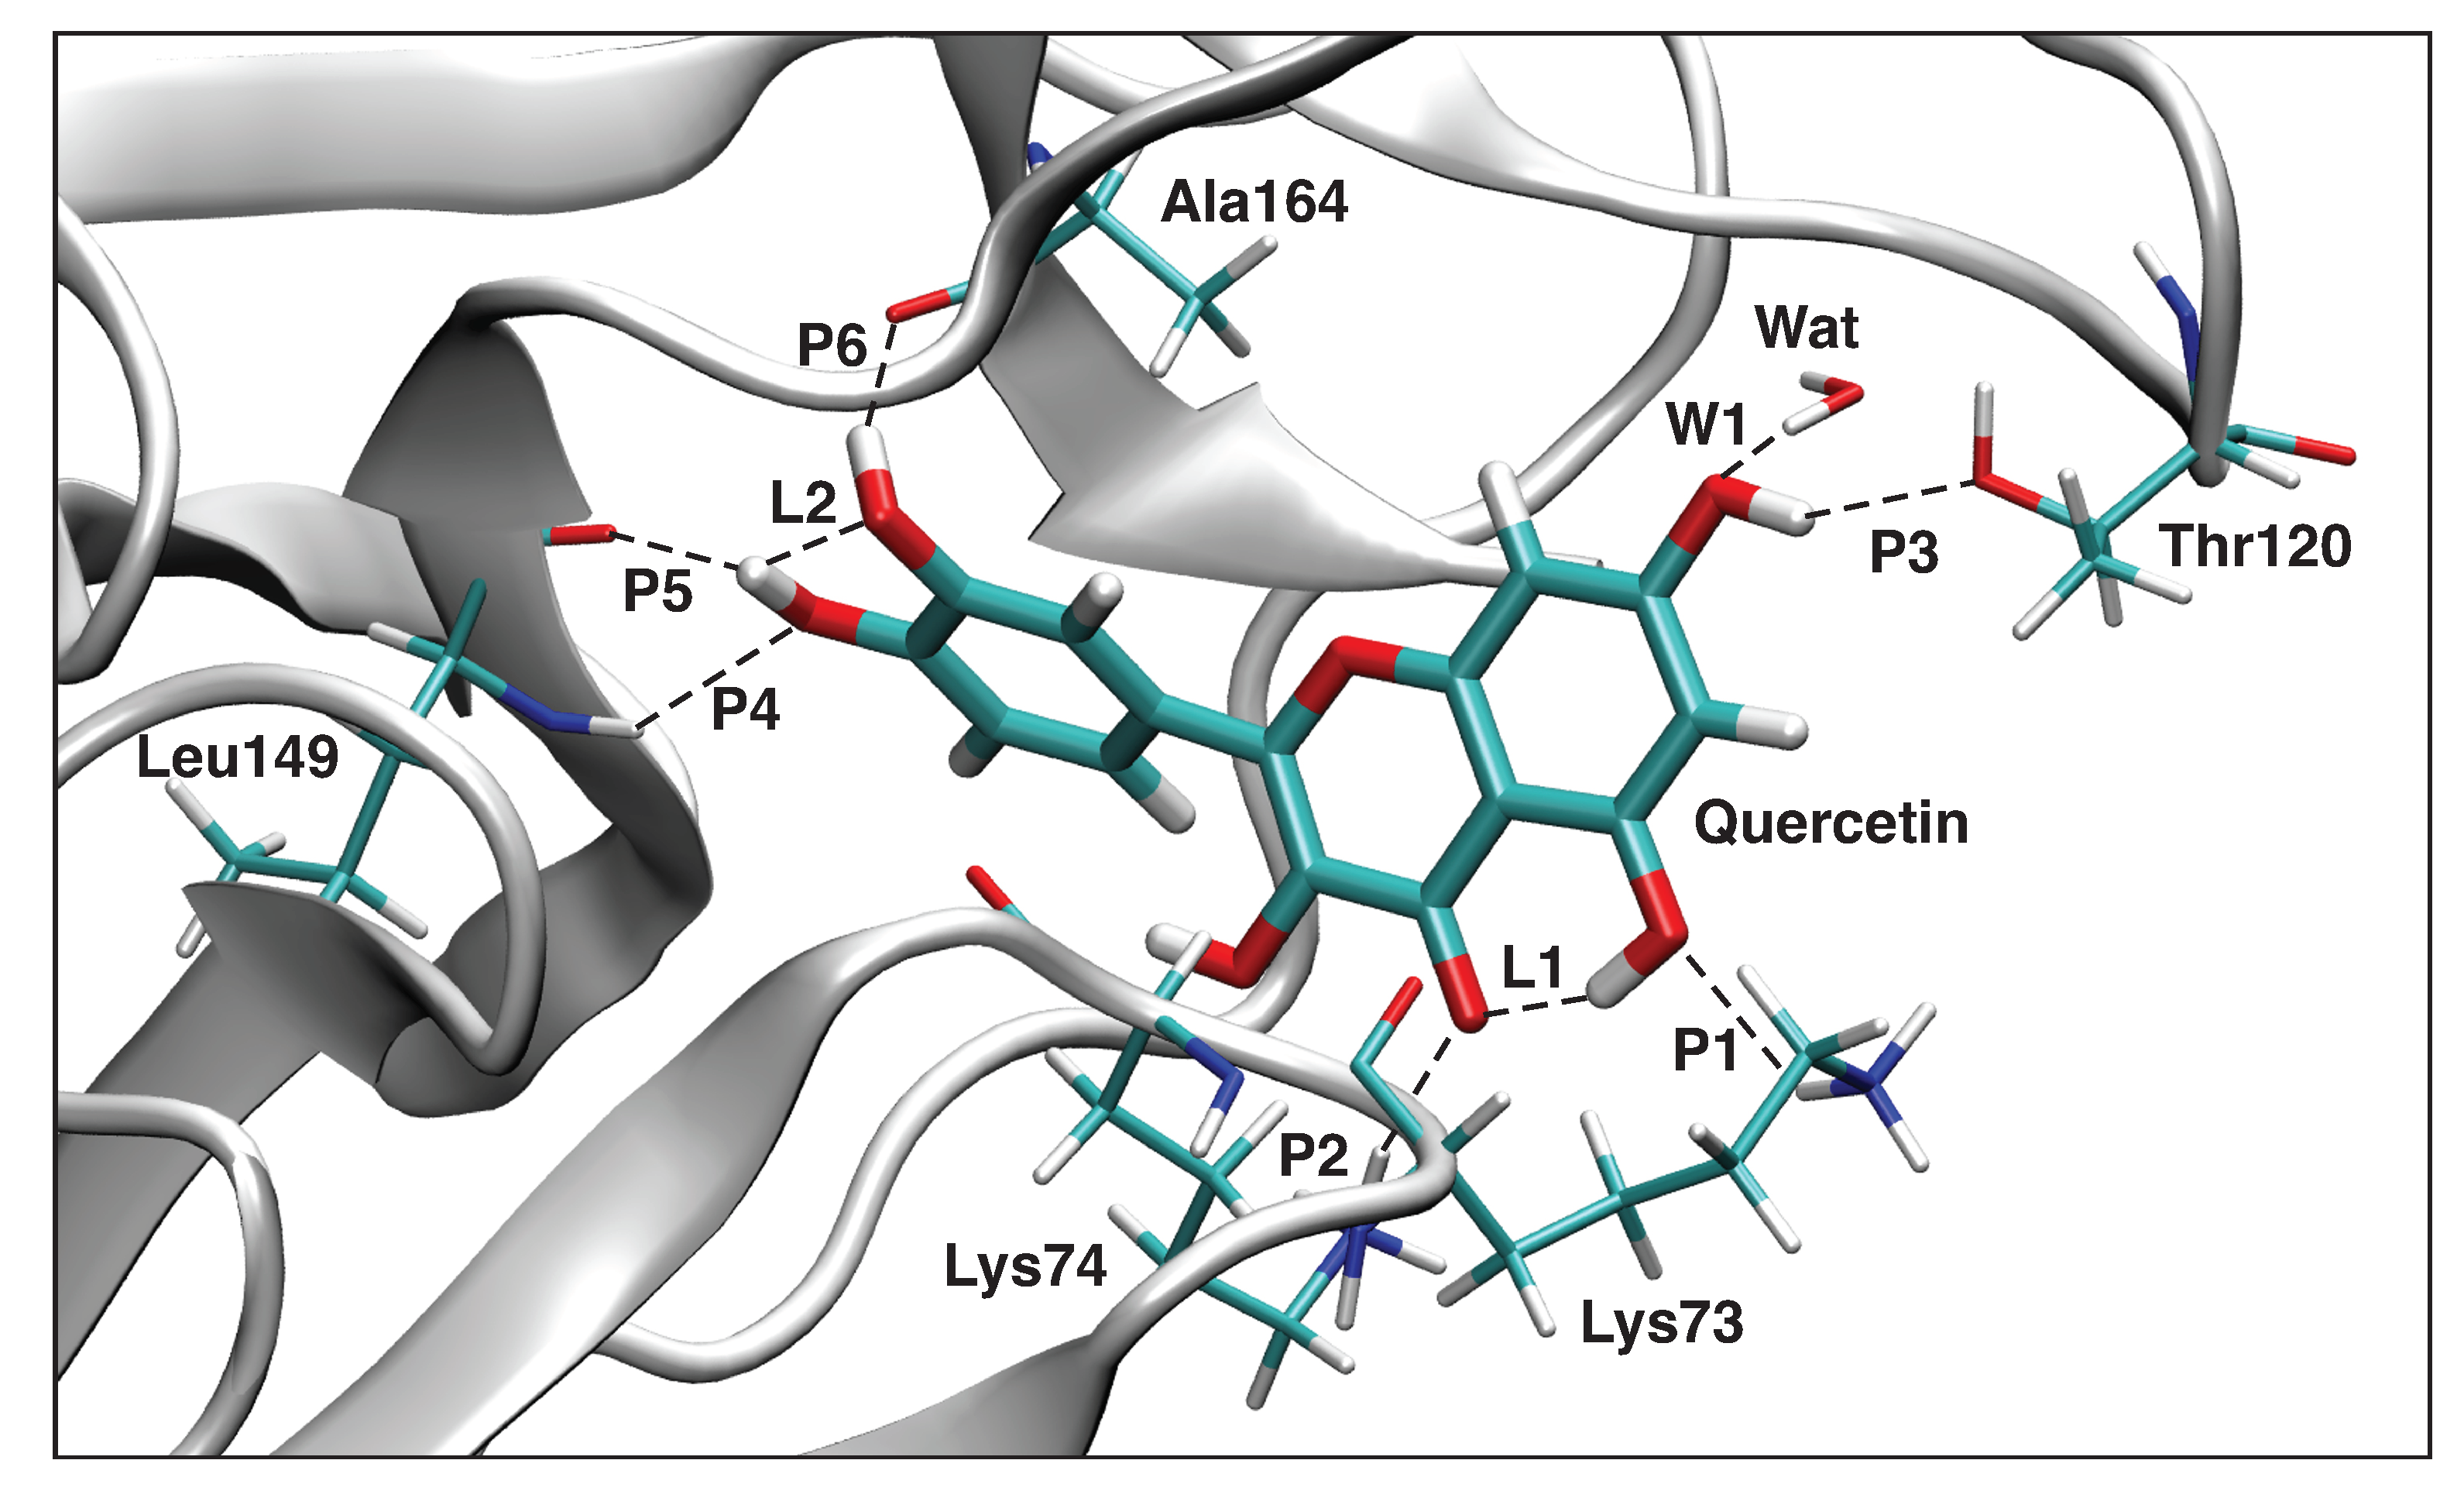
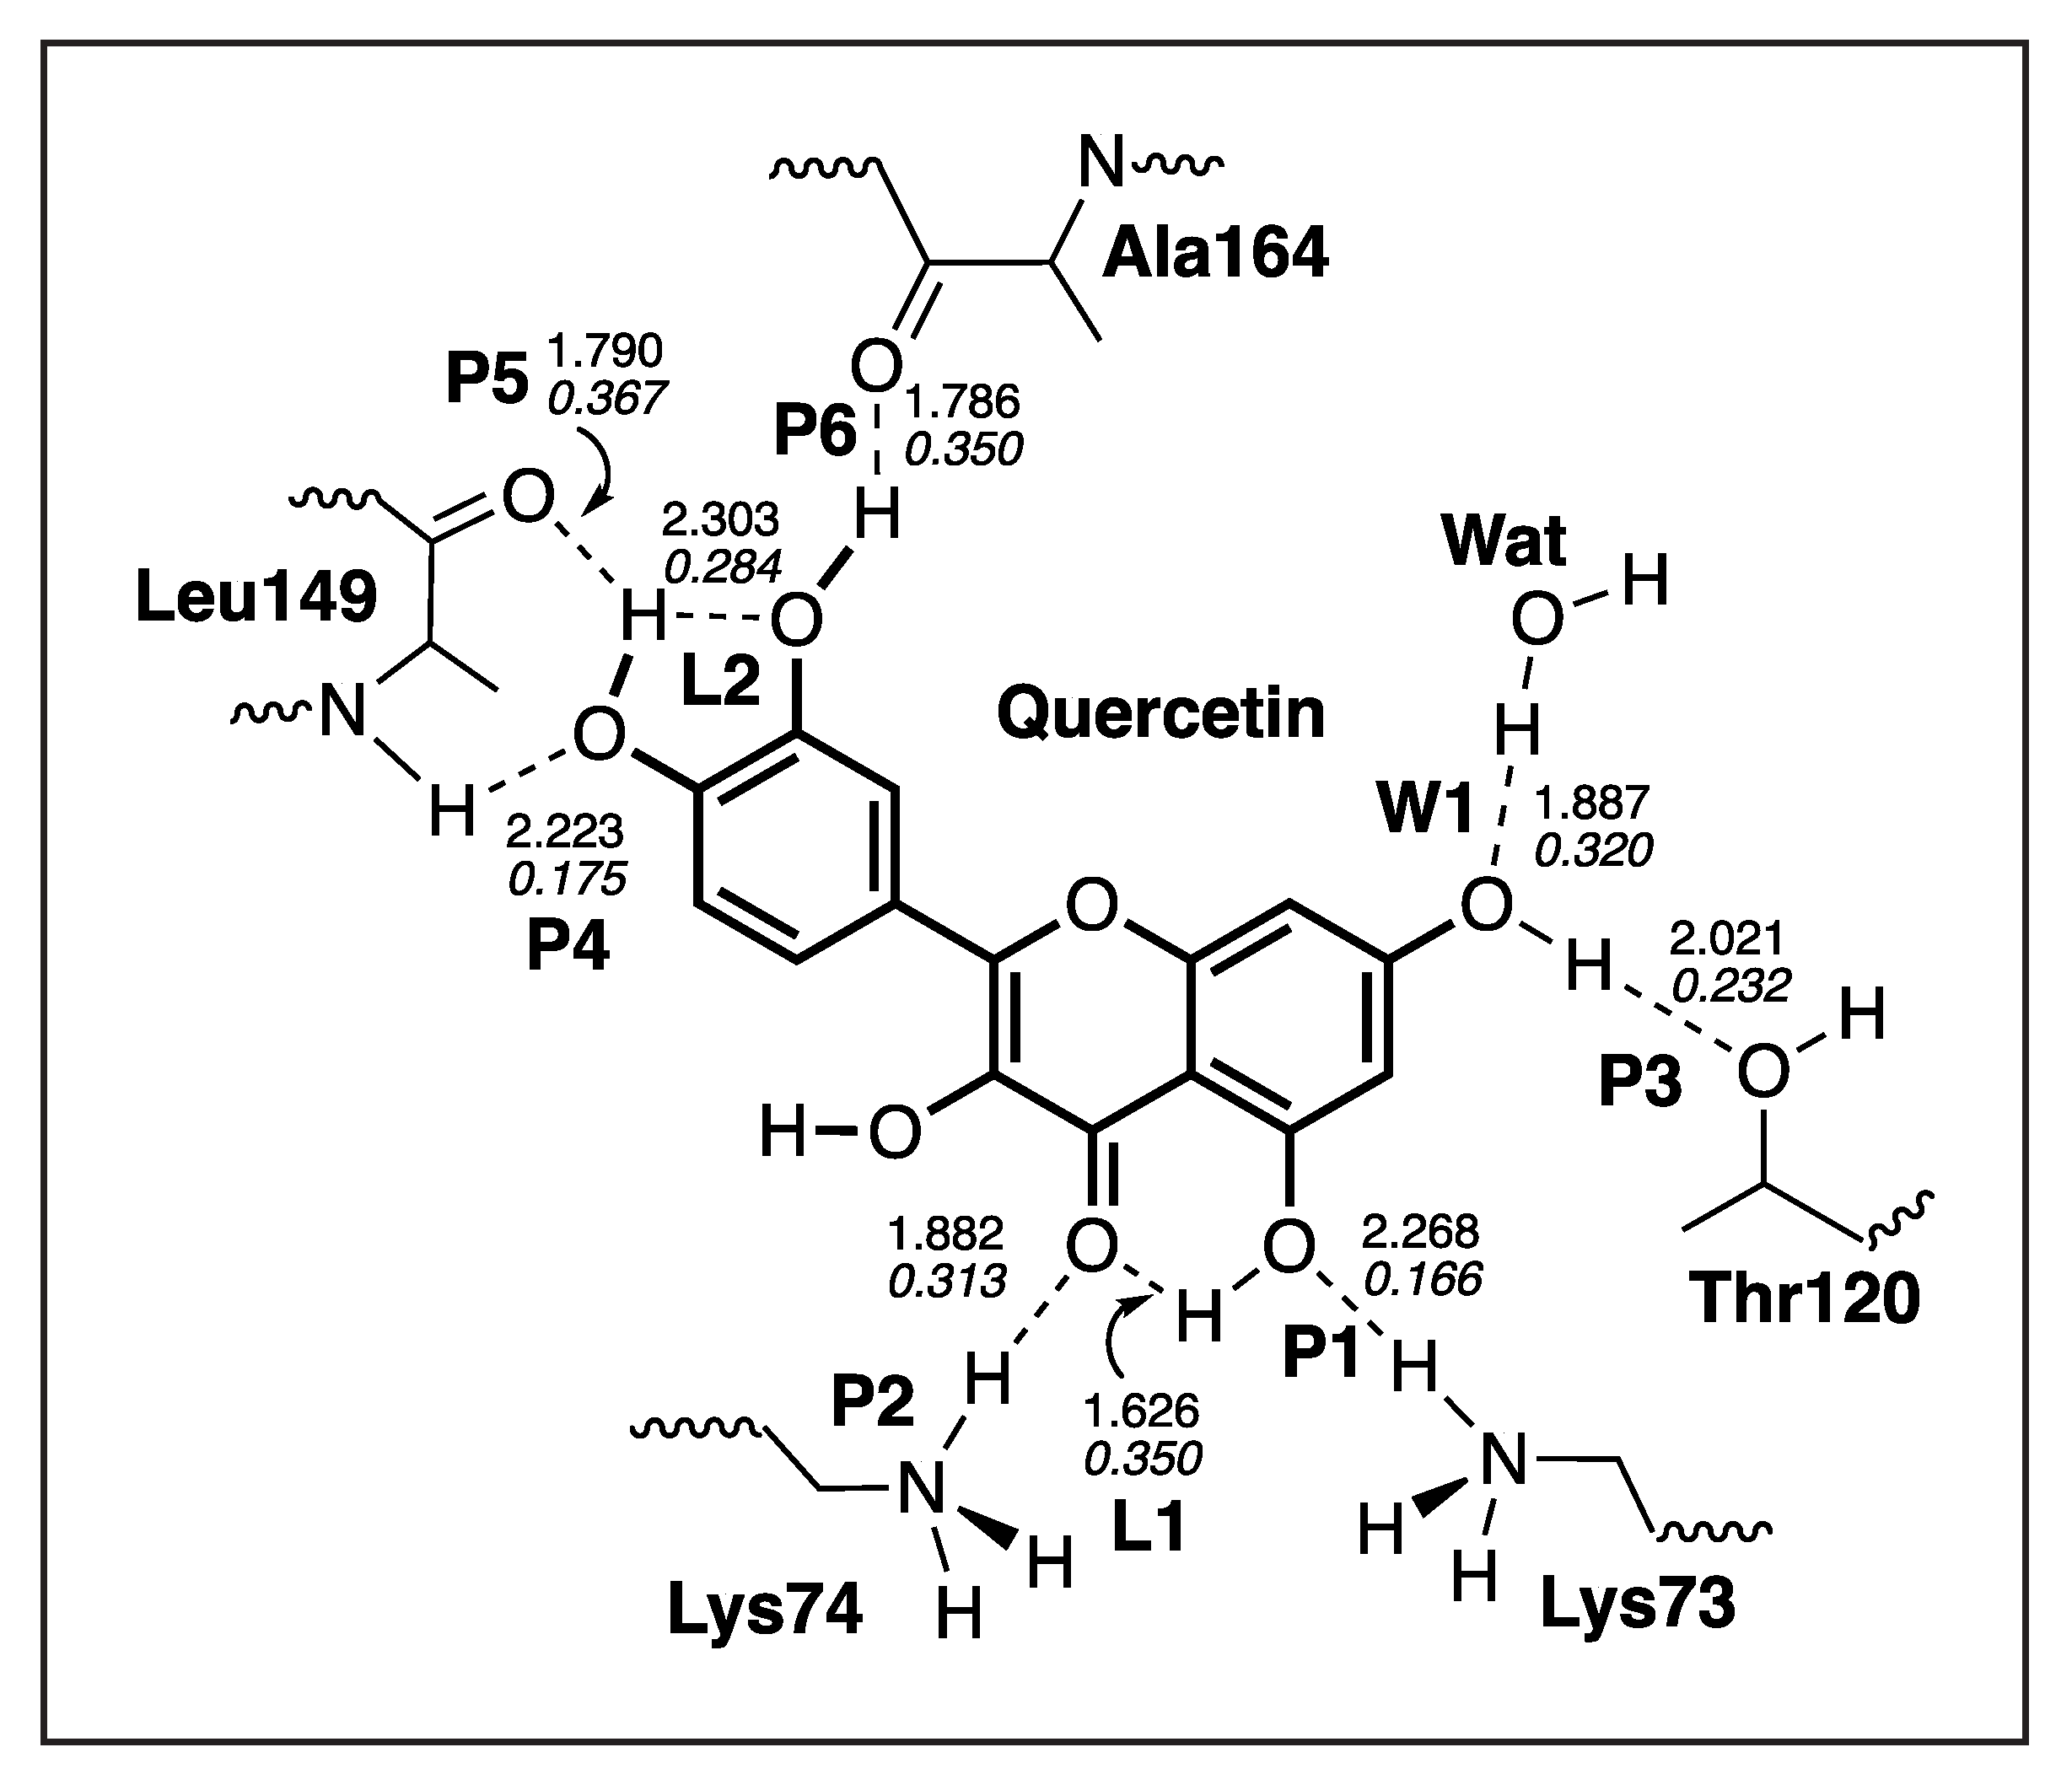
3.4.4. Quercetin-NS5
4. Conclusions and Outlook
Supplementary Materials
Author Contributions
Funding
Institutional Review Board Statement
Informed Consent Statement
Data Availability Statement
Acknowledgments
Conflicts of Interest
References
- Zandi, K.; Teoh, B.T.; Sam, S.S.; Wong, P.F.; Mustafa, M.R.; AbuBakar, S. Novel antiviral activity of baicalein against dengue virus. BMC Complement. Altern. Med. 2012, 12, 1–9. [Google Scholar] [CrossRef]
- Lin, K.; Ali, A.; Rusere, L.; Soumana, D.I.; Yilmaz, N.K.; Schiffer, C.A. Dengue Virus NS2B/NS3 Protease Inhibitors Exploiting the Prime Side. Virol. J. 2017, 91, e00045-17. [Google Scholar] [CrossRef]
- Khan, M.A. Dengue infection modeling and its optimal control analysis in East Java, Indonesia. Heliyon 2021, 7, e06023. [Google Scholar] [CrossRef]
- World Health Organization. Dengue and Severe Dengue; World Health Organization: Geneva, Switzerland, 2022. [Google Scholar]
- El-Araby, M.E.; Omar, A.M.; Soror, S.H.; Arold, S.T.; Khayat, M.T.; Asfour, H.Z.; Bamane, F.; Elfaky, M.A. Synthetic bulky NS4A peptide variants bind to and inhibit HCV NS3 protease. J. Adv. Res. 2020, 24, 251–259. [Google Scholar]
- Sasmono, R.T.; Taurel, A.F.; Prayitno, A.; Sitompul, H.; Yohan, B.; Hayati, R.F.; Bouckenooghe, A.; Hadinegoro, S.R.; Nealon, J. Dengue virus serotype distribution based on serological evidence in pediatric urban population in Indonesia. PLoS Negl. Trop. Dis. 2018, 12, e0006616. [Google Scholar]
- Yung, C.; Lee, K.; Thein, T.; Tan, L.; Gan, V.; Wong, J.; Lye, D.; Ng, L.; Leo, Y. Dengue Serotype-Specific Differences in Clinical Manifestation, Laboratory Parameters and Risk of Severe Disease in Adults, Singapore. Am. J. Trop. Med. 2015, 92, 999–1005. [Google Scholar] [CrossRef]
- Ahmad, N.; Fazal, H.; Ayaz, M.; Abbasi, B.H.; Mohammad, I.; Fazal, L. Dengue fever treatment with Carica papaya leaves extracts. Asian Pac. J. Trop. Biomed. 2011, 1, 330–333. [Google Scholar] [CrossRef]
- World Health Organization. Updated Questions and Answers Related to the Dengue Vaccine Dengvaxia® and Its Use; World Health Organization: Geneva, Switzerland, 2017. [Google Scholar]
- The New York Times. Drug Company under Fire after Revealing Dengue Vaccine May Harm Some. The New York Times, 2017. Available online: https://www.nytimes.com/2017/12/17/health/sanofi-dengue-vaccine-philippines.html/ (accessed on 10 August 2022).
- Low, J.G.; Ooi, E.E.; Vasudevan, S.G. Current status of dengue therapeutics research and development. J. Infect. Dis. 2017, 215, S96–S102. [Google Scholar]
- Naureen, I.; Saleem, A.; Mobeen, A.; Manj, N.W.; Sultani, H.M.I.; Saeed, S.; Raheem, I.; Adnan, M. Therapeutic Potential of Carica papaya Leaves in Dengue Associated Thrombocytopenia. Sch. Bull. 2022, 8, 79–83. [Google Scholar] [CrossRef]
- Quirino-Teixeira, A.C.; Andrade, F.B.; Pinheiro, M.B.M.; Rozini, S.V.; Hottz, E.D. Platelets in dengue infection: More than a numbers game. Platelets 2022, 33, 176–183. [Google Scholar] [CrossRef]
- Richa, S.; Nagar, R.; Ravishankar, G.; Upreti, R.; Chaturvedi, U. Effect of pretreatment with chromium picolinate on haematological parameters during dengue virus infection in mice. Indian J. Med. Sci 2007, 126, 440–446. [Google Scholar]
- Gadhwal, A.K.; Ankit, B.; Chahar, C.; Tantia, P.; Sirohi, P.; Agrawal, R. Effect of Carica papaya leaf extract capsule on platelet count in patients of dengue fever with thrombocytopenia. J. Assoc. Physicians India 2016, 64, 22–26. [Google Scholar]
- Funahara, Y.; Ogawa, K.; Fujita, N.; Okuno, Y. Three possible triggers to induce thrombocytopenia in dengue virus infection. Southeast Asian J. Trop. Med. Public Health 1987, 18, 351–355. [Google Scholar]
- Sarala, N.; Paknikar, S. Papaya extract to treat dengue: A novel therapeutic option? Ann. Med. Health Sci. Res. 2014, 4, 320–324. [Google Scholar]
- Hottz, E.; Tolley, N.D.; Zimmerman, G.A.; Weyrich, A.S.; Bozza, F.A. Platelets in dengue infection. Drug Discov. Today Dis. Mech. 2011, 8, 33–38. [Google Scholar] [CrossRef]
- Srikanth, B.; Reddy, L.; Biradar, S.; Shamanna, M.; Mariguddi, D.D.; Krishnakumar, M. An open-label, randomized prospective study to evaluate the efficacy and safety of Carica papaya leaf extract for thrombocytopenia associated with dengue fever in pediatric subjects. Pediatr. Health Med. Ther. 2019, 10, 5–11. [Google Scholar] [CrossRef]
- Hettige, S.; Pushpakumara, J.; Wanigabadu, L.U.; Hettige, E.M.R.; A Kottege, S.D.J.; Gunathilake, S. Controlled Clinical Trial on Effect of ‘Carica Papaya’ Leaf Extract on Patients with Dengue Fever. J. Clin. Med. Res. 2020, 3, 1–7. [Google Scholar]
- Vijeth, S.B.; Kauser, M.M.; Mangasuli, V.; Kumar, S.R.V.; Sree, S.; Varghese, S.A. Effect of Carica papaya leaf extract (CPLE) on thrombocytopenia among dengue patients of tertiary care hospital, Chitradurga, India. Int. J. Adv. Med. 2018, 5, 974–977. [Google Scholar]
- Subenthiran, S.; Choon, T.C.; Cheong, K.C.; Thayan, R.; Teck, M.B.; Muniandy, P.K.; Afzan, A.; Abdullah, N.R.; Ismail, Z. Carica papaya leaves juice significantly accelerates the rate of increase in platelet count among patients with dengue fever and dengue haemorrhagic fever. Evid.-Based Complement. Altern. Med. 2013, 2013, 1–7. [Google Scholar] [CrossRef]
- Spt, L.P.; Jose, J.A. Safety and Efficacy Study of ZyboricaTM Tablet (Carica papaya Leaf Extract) for Thrombocytopenia Associated with Dengue Fever: A Randomized Double Blind Placebo Controlled Trial. Int. J. Pharm. Res. Health Sci. 2019, 7, 2952–2957. [Google Scholar] [CrossRef]
- Ansari, R. Extract of Carica papaya L. leaves: Standardising its use in dengue fever. Indian J. Pharmacol. 2016, 48, 338–339. [Google Scholar] [CrossRef]
- Assir, M.; Mansoor, H.; Waseem, T.; Ahmed, H.; Bukhari, S.; Akram, J. Effect of papaya leaf extract on platelet count in dengue fever: A randomized controlled trial (PLEAD Trial). Int. J. Infect. Dis. 2012, 16, e473. [Google Scholar] [CrossRef][Green Version]
- Kehinde, I.; Ramharack, P.; Nlooto, M.; Gordon, M. The pharmacokinetic properties of HIV-1 protease inhibitors: A computational perspective on herbal phytochemicals. Heliyon 2019, 5, e02565. [Google Scholar] [CrossRef]
- Anuar, N.S.; Zahari, S.S.; Taib, I.A.; Rahman, M.T. Effect of green and ripe Carica papaya epicarp extracts on wound healing and during pregnancy. Food Chem. Toxicol. 2008, 46, 2384–2389. [Google Scholar] [CrossRef]
- Imaga, A. In vivo analyses of the effects of co-administration of Carica papaya leaf extract with ciprofloxacin. Afr. J. Pharm. Pharmacol. 2012, 6, 3268–3273. [Google Scholar] [CrossRef]
- Francis, Y.; Vijayakumar, J.; Raghunath, G.; Vijayalakshmi, S.; Sivanesan, S.; Vijayaraghavan, R.; Sukumar, E. Protective effect of Carica papaya leaf extract against mercuric chloride-induced nephrotoxicity in wistar rats. Pharmacogn. Mag. 2020, 16, 379–384. [Google Scholar] [CrossRef]
- Udoh, F.; Udoh, P.; Umoh, E. Activity of Alkaloid Extract ofCarica papaya. Seeds on Reproductive Functions in Male Wistar Rats. Pharm. Biol. 2005, 43, 563–567. [Google Scholar] [CrossRef]
- Senthilvel, P.; Lavanya, P.; Kumar, K.M.; Swetha, R.; Anitha, P.; Bag, S.; Sarveswari, S.; Vijayakumar, V.; Ramaiah, S.; Anbarasu, A. Flavonoid from Carica papaya inhibits NS2B-NS3 protease and prevents Dengue 2 viral assembly. Bioinformation 2013, 9, 889–895. [Google Scholar] [CrossRef]
- Yap, J.Y.; Hii, C.L.; Ong, S.P.; Lim, K.H.; Abas, F.; Pin, K.Y. Quantification of Carpaine and antioxidant properties of extracts from Carica Papaya plant leaves and stalks. J. Bioresour. Bioprod. 2021, 4, 350–358. [Google Scholar] [CrossRef]
- Teh, B.P.; Ahmad, N.B.; Mohamad, S.B.; Tan, T.Y.C.; Mohd Abd Razak, M.R.B.; Afzan, A.B.; Syed Mohamed, A.F.B. Carica papaya Leaf Juice for Dengue: A Scoping Review. Nutrients 2022, 14, 1584. [Google Scholar] [CrossRef]
- Sharma, N.; Mishra, K.P.; Chanda, S.; Bhardwaj, V.; Tanwar, H.; Ganju, L.; Kumar, B.; Singh, S.B. Evaluation of anti-dengue activity of Carica papaya aqueous leaf extract and its role in platelet augmentation. Arch. Virol. 2019, 164, 1095–1110. [Google Scholar] [CrossRef]
- Chavda, V.P.; Kumar, A.; Banerjee, R.; Das, N. Ayurvedic and Other Herbal Remedies For Dengue: An Update. Clin. Complement. Med. Pharmacol. 2022, 2, 100024. [Google Scholar] [CrossRef]
- Canini, A.; Alesiani, D.; D’Arcangelo, G.; Tagliatesta, P. Gas chromatography–mass spectrometry analysis of phenolic compounds from Carica papaya L. leaf. J. Food Compos. Anal. 2007, 20, 584–590. [Google Scholar] [CrossRef]
- Aguiar, M.; Anam, V.; Blyuss, K.B.; Estadilla, C.D.S.; Guerrero, B.V.; Knopoff, D.; Kooi, B.W.; Srivastav, A.K.; Steindorf, V.; Stollenwerk, N. Mathematical models for dengue fever epidemiology: A 10-year systematic review. Phys. Life Rev. 2022, 40, 65–92. [Google Scholar] [CrossRef]
- Sahili, A.E.; Lescar, J. Dengue Virus Non-Structural Protein 5. Viruses 2017, 9, 91. [Google Scholar] [CrossRef]
- Yildiz, M.; Ghosh, S.; Bell, J.A.; Sherman, W.; Hardy, J.A. Allosteric Inhibition of the NS2B-NS3 Protease from Dengue Virus. ACS Chem. Biol. 2013, 8, 2744–2752. [Google Scholar] [CrossRef]
- Yusof, R.; Clum, S.; Wetzel, M.; Krishna, K.; Padmanabhan, R. Purified NS2B/NS3 Serine Protease of Dengue Virus Type 2 Exhibits Cofactor NS2B Dependence for Cleavage of Substrates with Dibasic Amino Acids in vitro. Int. J. Biol. Chem. 2000, 275, 9963–9969. [Google Scholar] [CrossRef]
- Luo, D.; Xu, T.; Hunke, C.; Gruber, G.; Vasudevan, S.G.; Lescar, J. Crystal structure of the NS3 protease-helicase from dengue virus. J. Virol. 2008, 82, 173–183. [Google Scholar] [CrossRef]
- Caillet-Saguy, C.; Lim, S.P.; Shi, P.Y.; Lescar, J.; Bressanelli, S. Polymerases of hepatitis C viruses and flaviviruses: Structural and mechanistic insights and drug development. Antivir. Res. 2014, 105, 8–16. [Google Scholar] [CrossRef]
- Lim, S.P.; Noble, C.G.; Shi, P.Y. The dengue virus NS5 protein as a target for drug discovery. Antivir. Res. 2015, 119, 57–67. [Google Scholar] [CrossRef]
- Maio, F.A.D.; Risso, G.; Iglesias, N.G.; Shah, P.; Pozzi, B.; Gebhard, L.G.; Mammi, P.; Mancini, E.; Yanovsky, M.J.; Andino, R.; et al. The Dengue Virus NS5 Protein Intrudes in the Cellular Spliceosome and Modulates Splicing. PLoS Pathog. 2016, 12, e1005841. [Google Scholar]
- Ashour, J.; Laurent-Rolle, M.; Shi, P.Y.; Garcia-Sastre, A. NS5 of Dengue Virus Mediates STAT2 Binding and Degradation. Virol. J. 2009, 83, 5408–5418. [Google Scholar] [CrossRef]
- Erbel, P.; Schiering, N.; D’Arcy, A.; Renatus, M.; Kroemer, M.; Lim, S.P.; Yin, Z.; Keller, T.H.; Vasudevan, S.G.; Hommel, U. Structural basis for the activation of flaviviral NS3 proteases from dengue and West Nile virus. Nat. Struct. Mol. Biol 2006, 13, 372–373. [Google Scholar] [CrossRef]
- Sahili, A.E.; Soh, T.S.; Schiltz, J.; Ayachi, A.G.; Seh, C.C.; Shi, P.Y.; Lim, S.P.; Lescar, J. NS5 from dengue virus serotype 2 can adopt a conformation analogous to that of its Zika virus and Japanese encephalitis virus homologues. J. Virol. 2019, 94, e01294-19. [Google Scholar] [CrossRef]
- Berman, H.M.; Westbrook, J.; Feng, Z.; Gilliland, G.; Bhat, T.N.; Weissig, H.; Shindyalov, I.N.; Bourne, P.E. The protein data bank. Nucleic Acids Res. 2000, 28, 235–242. [Google Scholar] [CrossRef]
- Pettersen, E.F.; Goddard, T.D.; Huang, C.C.; Couch, G.S.; Greenblatt, D.M.; Meng, E.C.; Ferrin, T.E. UCSF Chimera—A visualization system for exploratory research and analysis. J. Comput. Chem. 2004, 25, 1605–1612. [Google Scholar] [CrossRef]
- Kim, S.; Chen, J.; Cheng, T.; Gindulyte, A.; He, J.; He, S.; Li, Q.; Shoemaker, B.A.; Thiessen, P.A.; Yu, B.; et al. PubChem in 2021: New data content and improved web interfaces. Nucleic Acids Res. 2021, 49, D1388–D1395. [Google Scholar] [CrossRef]
- Senn, H.M.; Thiel, W. QM/MM methods for biomolecular systems. Angew. Chem. Int. Ed. 2009, 48, 1198–1229. [Google Scholar] [CrossRef]
- Cui, Q.; Pal, T.; Xie, L. Biomolecular QM/MM Simulations: What Are Some of the “Burning Issues”? J. Phys. Chem. B 2021, 125, 689–702. [Google Scholar] [CrossRef]
- Poudyal, B. Molecular Docking Technique. Nat. J. Pharm. Sci. 2021, 1, 8–14. [Google Scholar]
- Koes, D.R.; Baumgartner, M.P.; Camacho, C.J. Lessons learned in empirical scoring with smina from the CSAR 2011 benchmarking exercise. J. Chem. Inf. Model. 2013, 53, 1893–1904. [Google Scholar] [CrossRef] [PubMed]
- O’Boyle, N.M.; Banck, M.; James, C.A.; Morley, C.; Vandermeersch, T.; Hutchison, G.R. Open Babel: An open chemical toolbox. J. Cheminform. 2011, 3, 1–14. [Google Scholar] [CrossRef]
- Schrödinger, L. SchröDinger Release 2022-3: Maestro, Schrödinger, LLC, New York, NY, USA. Available online: https://www.schrodinger.com/products/maestro/ (accessed on 1 September 2022).
- Case, D.A.; Ben-Shalom, I.Y.; Brozell, S.R.; Cerutti, D.S.; Cheatham, T.E.; Cruzeiro, V.W.D.; Darden, T.A.; Duke, R.E.; Ghoreishi, D.; Gilson, M.K.; et al. AMBER; University of California: San Francisco, CA, USA, 2018. [Google Scholar]
- Maier, J.A.; Martinez, C.; Kasavajhala, K.; Wickstrom, L.; Hauser, K.E.; Simmerling, C. ff14SB: Improving the accuracy of protein side chain and backbone parameters from ff99SB. J. Chem. Theory Comput. 2015, 11, 3696–3713. [Google Scholar] [CrossRef] [PubMed]
- Wang, J.; Wang, W.; Kollman, P.A.; Case, D.A. Antechamber: An accessory software package for molecular mechanical calculations. J. Am. Chem. Soc. 2001, 222, U403. [Google Scholar]
- Case, D.A.; Ben-Shalom, I.Y.; Brozell, S.R.; Cerutti, D.S.; Cheatham, T.E.; Cruzeiro, V.W.D.; Darden, T.A.; Duke, R.E.; Ghoreishi, D.; Gilson, M.K.; et al. AMBER16; University of California: San Francisco, CA, USA, 2016. [Google Scholar]
- Neria, E.; Fischer, S.; Karplus, M. Simulation of activation free energies in molecular systems. J. Chem. Phys. 1996, 105, 1902–1921. [Google Scholar] [CrossRef]
- Kräutler, V.; Van Gunsteren, W.F.; Hünenberger, P.H. A fast SHAKE algorithm to solve distance constraint equations for small molecules in molecular dynamics simulations. J. Comput. Chem. 2001, 22, 501–508. [Google Scholar] [CrossRef]
- Berendsen, H.J.; Postma, J.v.; van Gunsteren, W.F.; DiNola, A.; Haak, J.R. Molecular dynamics with coupling to an external bath. J. Chem. Phys. 1984, 81, 3684–3690. [Google Scholar] [CrossRef]
- Roe, D.R.; Cheatham III, T.E. PTRAJ and CPPTRAJ: Software for processing and analysis of molecular dynamics trajectory data. J. Chem. Theory Comput. 2013, 9, 3084–3095. [Google Scholar] [CrossRef]
- Visual DataTools. Data Graph, 2020, Version 4.6; Copyright 2020 Visual Data Tools, Inc.: Chapel Hill, NC, USA. Available online: https://www.visualdatatools.com/ (accessed on 1 September 2022).
- Genheden, S.; Ryde, U. The MM/PBSA and MM/GBSA methods to estimate ligand-binding affinities. Expert. Opin. Drug Discov. 2015, 10, 449–461. [Google Scholar] [CrossRef]
- Miller III, B.R.; McGee Jr, T.D.; Swails, J.M.; Homeyer, N.; Gohlke, H.; Roitberg, A.E. MMPBSA. py: An efficient program for end-state free energy calculations. J. Chem. Theory Comput. 2012, 8, 3314–3321. [Google Scholar] [CrossRef]
- Daina, A.; Michielin, O.; Zoete, V. SwissTargetPrediction: Updated data and new features for efficient prediction of protein targets of small molecules. Nucleic Acids Res. 2019, 47, W357–W364. [Google Scholar] [CrossRef]
- Daina, A.; Michielin, O.; Zoete, V. SwissADME: A free web tool to evaluate pharmacokinetics, drug-likeness and medicinal chemistry friendliness of small molecules. Sci. Rep. 2017, 7, 1–13. [Google Scholar] [CrossRef] [PubMed]
- Daina, A.; Michielin, O.; Zoete, V. iLOGP: A simple, robust, and efficient description of n-octanol/water partition coefficient for drug design using the GB/SA approach. J. Chem. Inf. Model. 2014, 54, 3284–3301. [Google Scholar] [CrossRef] [PubMed]
- Daina, A.; Zoete, V. A boiled-egg to predict gastrointestinal absorption and brain penetration of small molecules. ChemMedChem 2016, 11, 1117–1121. [Google Scholar] [CrossRef]
- Konkoli, Z.; Larsson, J.A.; Cremer, D. A New Way of Analyzing Vibrational Spectra. II. Comparison of Internal Mode Frequencies. Int. J. Quantum Chem. 1998, 67, 11–27. [Google Scholar] [CrossRef]
- Konkoli, Z.; Cremer, D. A New Way of Analyzing Vibrational Spectra. III. Characterization of Normal Vibrational Modes in terms of Internal Vibrational Modes. Int. J. Quantum Chem. 1998, 67, 29–40. [Google Scholar] [CrossRef]
- Konkoli, Z.; Larsson, J.A.; Cremer, D. A New Way of Analyzing Vibrational Spectra. IV. Application and Testing of Adiabatic Modes within the Concept of the Characterization of Normal Modes. Int. J. Quantum Chem. 1998, 67, 41–55. [Google Scholar] [CrossRef]
- Cremer, D.; Larsson, J.A.; Kraka, E. New Developments in the Analysis of Vibrational Spectra on the Use of Adiabatic Internal Vibrational Modes. In Theoretical and Computational Chemistry; Parkanyi, C., Ed.; Elsevier: Amsterdam, The Netherlands, 1998; pp. 259–327. [Google Scholar]
- Kraka, E.; Zou, W.; Tao, Y. Decoding Chemical Information from Vibrational Spectroscopy Data: Local Vibrational Mode Theory. WIREs: Comput. Mol. Sci. 2020, 10, e1480. [Google Scholar] [CrossRef]
- Wilson, E.B.; Decius, J.C.; Cross, P.C.M. Molecular Vibrations: The Theory of Infrared and Raman Vibrational Spectra; McGraw-Hill: New York, NY, USA, 1955; pp. 59–136. [Google Scholar]
- Califano, S. Vibrational States; Wiley: London, UK, 1976. [Google Scholar]
- Kelley, J.D.; Leventhal, J.J. Problems in Classical and Quantum Mechanics: Normal Modes and Coordinates; Springer: Berlin, Germany, 2017; pp. 95–117. [Google Scholar]
- Wilson, E.B., Jr. A method of obtaining the expanded secular equation for the vibration frequencies of a molecule. J. Chem. Phys. 1939, 7, 1047–1052. [Google Scholar] [CrossRef]
- Orville-Thomas, W. Vibrational states. J. Mol. Struct. 1977, 39, 155. [Google Scholar] [CrossRef]
- Pitzer, K. The nature of the chemical bond and the structure of molecules and crystals: An introduction to modern structural chemistry. J. Am. Chem. Soc. 1960, 82, 4121. [Google Scholar] [CrossRef]
- Delgado, A.A.A.; Humason, A.; Kalescky, R.; Freindorf, M.; Kraka, E. Exceptionally Long Covalent CC Bonds—A Local Vibrational Mode Study. Molecules 2021, 26, 950. [Google Scholar] [CrossRef]
- Kraka, E.; Larsson, J.A.; Cremer, D. Generalization of the Badger Rule Based on the Use of Adiabatic Vibrational Modes. In Computational Spectroscopy; Grunenberg, J., Ed.; Wiley: New York, NY, USA, 2010; pp. 105–149. [Google Scholar]
- Kalescky, R.; Kraka, E.; Cremer, D. Identification of the Strongest Bonds in Chemistry. J. Phys. Chem. A 2013, 117, 8981–8995. [Google Scholar] [CrossRef] [PubMed]
- Kraka, E.; Cremer, D. Characterization of CF Bonds with Multiple-Bond Character: Bond Lengths, Stretching Force Constants, and Bond Dissociation Energies. ChemPhysChem 2009, 10, 686–698. [Google Scholar] [CrossRef] [PubMed]
- Kraka, E.; Setiawan, D.; Cremer, D. Re-Evaluation of the Bond Length-Bond Strength Rule: The Stronger Bond Is not Always the Shorter Bond. J. Comp. Chem. 2015, 37, 130–142. [Google Scholar] [CrossRef] [PubMed]
- Zou, W.; Cremer, D. C2 in a Box: Determining its Intrinsic Bond Strength for the X1Σ+g Ground State. Chem. Eur. J. 2016, 22, 4087–4097. [Google Scholar] [CrossRef]
- Setiawan, D.; Sethio, D.; Cremer, D.; Kraka, E. From Strong to Weak NF Bonds: On the Design of a New Class of Fluorinating Agents. Phys. Chem. Chem. Phys. 2018, 20, 23913–23927. [Google Scholar] [CrossRef]
- Freindorf, M.; Yannacone, S.; Oliveira, V.; Verma, N.; Kraka, E. Halogen Bonding Involving I2 and d8 Transition-Metal Pincer Complexes. Crystals 2021, 11, 373. [Google Scholar] [CrossRef]
- Oliveira, V.; Kraka, E.; Cremer, D. The Intrinsic Strength of the Halogen Bond: Electrostatic and Covalent Contributions Described by Coupled Cluster Theory. Phys. Chem. Chem. Phys. 2016, 18, 33031–33046. [Google Scholar] [CrossRef]
- Oliveira, V.; Kraka, E.; Cremer, D. Quantitative Assessment of Halogen Bonding Utilizing Vibrational Spectroscopy. Inorg. Chem. 2016, 56, 488–502. [Google Scholar] [CrossRef]
- Oliveira, V.; Cremer, D. Transition from Metal-Ligand Bonding to Halogen Bonding Involving a Metal as Halogen Acceptor: A Study of Cu, Ag, Au, Pt, and Hg Complexes. Chem. Phys. Lett. 2017, 681, 56–63. [Google Scholar] [CrossRef]
- Yannacone, S.; Oliveira, V.; Verma, N.; Kraka, E. A Continuum from Halogen Bonds to Covalent Bonds: Where Do λ3 Iodanes Fit? Inorganics 2019, 7, 47. [Google Scholar] [CrossRef]
- Oliveira, V.P.; Marcial, B.L.; Machado, F.B.C.; Kraka, E. Metal-Halogen Bonding Seen through the Eyes of Vibrational Spectroscopy. Materials 2020, 13, 55. [Google Scholar] [CrossRef]
- Oliveira, V.; Cremer, D.; Kraka, E. The Many Facets of Chalcogen Bonding: Described by Vibrational Spectroscopy. J. Phys. Chem. A 2017, 121, 6845–6862. [Google Scholar] [CrossRef]
- Oliveira, V.; Kraka, E. Systematic Coupled Cluster Study of Noncovalent Interactions Involving Halogens, Chalcogens, and Pnicogens. J. Phys. Chem. A 2017, 121, 9544–9556. [Google Scholar] [CrossRef]
- Setiawan, D.; Kraka, E.; Cremer, D. Hidden Bond Anomalies: The Peculiar Case of the Fluorinated Amine Chalcogenides. J. Phys. Chem. A 2015, 119, 9541–9556. [Google Scholar] [CrossRef]
- Setiawan, D.; Kraka, E.; Cremer, D. Strength of the Pnicogen Bond in Complexes Involving Group VA Elements N, P, and As. J. Phys. Chem. A 2014, 119, 1642–1656. [Google Scholar] [CrossRef]
- Setiawan, D.; Kraka, E.; Cremer, D. Description of Pnicogen Bonding with the help of Vibrational Spectroscopy-The Missing Link Between Theory and Experiment. Chem. Phys. Lett. 2014, 614, 136–142. [Google Scholar] [CrossRef]
- Setiawan, D.; Cremer, D. Super-Pnicogen Bonding in the Radical Anion of the Fluorophosphine Dimer. Chem. Phys. Lett. 2016, 662, 182–187. [Google Scholar] [CrossRef]
- Sethio, D.; Oliveira, V.; Kraka, E. Quantitative Assessment of Tetrel Bonding Utilizing Vibrational Spectroscopy. Molecules 2018, 23, 2763. [Google Scholar] [CrossRef]
- Freindorf, M.; Kraka, E.; Cremer, D. A Comprehensive Analysis of Hydrogen Bond Interactions Based on Local Vibrational Modes. Int. J. Quantum Chem. 2012, 112, 3174–3187. [Google Scholar] [CrossRef]
- Kalescky, R.; Zou, W.; Kraka, E.; Cremer, D. Local Vibrational Modes of the Water Dimer—Comparison of Theory and Experiment. Chem. Phys. Lett. 2012, 554, 243–247. [Google Scholar] [CrossRef]
- Kalescky, R.; Kraka, E.; Cremer, D. Local Vibrational Modes of the Formic Acid Dimer—The Strength of the Double H-Bond. Mol. Phys. 2013, 111, 1497–1510. [Google Scholar] [CrossRef]
- Tao, Y.; Zou, W.; Jia, J.; Li, W.; Cremer, D. Different Ways of Hydrogen Bonding in Water—Why Does Warm Water Freeze Faster than Cold Water? J. Chem. Theory Comput. 2017, 13, 55–76. [Google Scholar] [CrossRef]
- Tao, Y.; Zou, W.; Kraka, E. Strengthening of Hydrogen Bonding With the Push-Pull Effect. Chem. Phys. Lett. 2017, 685, 251–258. [Google Scholar] [CrossRef]
- Makoś, M.Z.; Freindorf, M.; Sethio, D.; Kraka, E. New Insights into Fe–H2 and Fe–H- Bonding of a [NiFe] Hydrogenase Mimic—A Local Vibrational Mode Study. Theor. Chem. Acc. 2019, 138, 76. [Google Scholar] [CrossRef]
- Lyu, S.; Beiranvand, N.; Freindorf, M.; Kraka, E. Interplay of Ring Puckering and Hydrogen Bonding in Deoxyribonucleosides. J. Phys. Chem. A 2019, 123, 7087–7103. [Google Scholar] [CrossRef]
- Verma, N.; Tao, Y.; Kraka, E. Systematic Detection and Characterization of Hydrogen Bonding in Proteins via Local Vibrational Modes. J. Phys. Chem. B 2021, 125, 2551–2565. [Google Scholar] [CrossRef]
- Beiranvand, N.; Freindorf, M.; Kraka, E. Hydrogen Bonding in Natural and Unnatural Base Pairs—Explored with Vibrational Spectroscopy. Molecules 2021, 26, 2268. [Google Scholar] [CrossRef]
- Frisch, M.J.; Trucks, G.W.; Schlegel, H.B.; Scuseria, G.E.; Robb, M.A.; Cheeseman, J.R.; Scalmani, G.; Barone, V.; Mennucci, B.; Petersson, G.A.; et al. Gaussian; Gaussian Inc.: Wallingford, CT, USA, 2009. [Google Scholar]
- Zou, W.; Tao, Y.; Freindorf, M.; Makoś, M.Z.; Verma, N.; Cremer, D.; Kraka, E. Local Vibrational Mode Analysis (LModeA); Computational and Theoretical Chemistry Group (CATCO), Southern Methodist University: Dallas, TX, USA, 2021. [Google Scholar]
- Pollastri, M.P. Overview on the Rule of Five. Curr. Protoc. Pharmacol. 2010, 49, 9–12. [Google Scholar] [CrossRef]
- Chagas, C.M.; Moss, S.; Alisaraie, L. Drug metabolites and their effects on the development of adverse reactions: Revisiting Lipinski’s Rule of Five. Int. J. Pharm. 2018, 549, 133–149. [Google Scholar] [CrossRef] [PubMed]
- Ci, Y.; Shi, L. Compartmentalized replication organelle of flavivirus at the ER and the factors involved. Cell. Mol. Life Sci. 2021, 78, 4939–4954. [Google Scholar] [CrossRef] [PubMed]
- Wickramasinghe, G.H.I.M.; Indika, P.P.A.M.S.; Chandrasekharan, N.V.; Weerasinghe, M.S.S.; Wijesundera, R.L.C.; Wijesundera, W.S.S. Trichoderma virens β-glucosidase I (BGL I) gene; expression in Saccharomyces cerevisiae including docking and molecular dynamics studies. BMC Microbiol. 2017, 17, 1–12. [Google Scholar] [CrossRef]
- Rathnayake, S.; Weerasinghe, S. Exploring the binding properties of agonists interacting with glucocorticoid receptor: An in silico approach. J. Mol. Model. 2018, 24, 1–16. [Google Scholar] [CrossRef] [PubMed]
- Bhardwaj, P.; Biswas, G.; Mahata, N.; Ghanta, S.; Bhunia, B. Exploration of binding mechanism of triclosan towards cancer markers using molecular docking and molecular dynamics. Chemosphere 2022, 293, 133550. [Google Scholar] [CrossRef] [PubMed]
- Hidayatullah, A.; Putra, W.E.; Salma, W.O.; Muchtaromah, B.; Permatasari, G.W.; Susanto, H.; Widiastuti, D.; Kismurtono, M. Discovery of drug candidate from various natural products as potential novel dengue virus nonstructural protein 5 (NS5) inhibitor. Chiang Mai Univ. J. Nat. Sci. 2020, 20, 1–17. [Google Scholar] [CrossRef]
- Martínez, L. Automatic identification of mobile and rigid substructures in molecular dynamics simulations and fractional structural fluctuation analysis. PLoS ONE 2015, 10, e0119264. [Google Scholar]
- Barthe, L.; Woodley, J.; Houin, G. Gastrointestinal absorption of drugs: Methods and studies. Fundam. Clin. Pharmacol. 1999, 13, 154–168. [Google Scholar] [CrossRef]
- Care, C.; Sornjai, W.; Jaratsittisin, J.; Hitakarun, A.; Wikan, N.; Triwitayakorn, K.; Smith, D.R. Discordant activity of kaempferol towards dengue virus and Japanese encephalitis virus. Molecules 2020, 25, 1246. [Google Scholar] [CrossRef]
- Lovell, D.P. Screening for possible human carcinogens and mutagens false positives, false negatives: Statistical implications. Mutat. Res. Mol. Mech. Mutagen. 1989, 213, 43–60. [Google Scholar] [CrossRef]
- Lamberth, C. Agrochemical lead optimization by scaffold hopping. Pest Manag. Sci. 2018, 74, 282–292. [Google Scholar] [CrossRef] [PubMed]
- Brown, N. Bioisosteres and scaffold hopping in medicinal chemistry. Mol. Inform. 2014, 33, 458–462. [Google Scholar] [CrossRef] [PubMed]
- Sun, H.; Tawa, G.; Wallqvist, A. Classification of scaffold-hopping approaches. Drug Discov. Today 2012, 17, 310–324. [Google Scholar] [CrossRef]
- Langdon, S.R.; Ertl, P.; Brown, N. Bioisosteric replacement and scaffold hopping in lead generation and optimization. Mol. Inform. 2010, 29, 366–385. [Google Scholar] [CrossRef] [PubMed]
- Flores-Ocelotl, M.R.; Rosas-Murrieta, N.H.; Moreno, D.A.; Vallejo-Ruiz, V.; Reyes-Leyva, J.; Domínguez, F.; Santos-López, G. Taraxacum officinale and Urtica dioica extracts inhibit dengue virus serotype 2 replication in vitro. BMC Complement Altern. Med. 2018, 18, 1–10. [Google Scholar] [CrossRef]
- Angelina, M.; Hanafi, M.; Suyatna, F.D.; Dewi, B.E. Drug of action cassia alata leaves extract as antiviral to dengue virus serotype-2 in vitro. Pharmacogn. J. 2020, 12, 864–871. [Google Scholar] [CrossRef]
- Dwivedi, V.D.; Bharadwaj, S.; Afroz, S.; Khan, N.; Ansari, M.A.; Yadava, U.; Tripathi, R.C.; Tripathi, I.P.; Mishra, S.K.; Kang, S.G. Anti-dengue infectivity evaluation of bioflavonoid from Azadirachta indica by dengue virus serine protease inhibition. J. Biomol. Struct. Dyn. 2021, 39, 1417–1430. [Google Scholar] [CrossRef]
- Zheng, W.; Wu, H.; Wang, T.; Zhan, S.; Liu, X. Quercetin for COVID-19 and DENGUE co-infection: A potential therapeutic strategy of targeting critical host signal pathways triggered by SARS-CoV-2 and DENV. Brief. Bioinform. 2021, 22, bbab199. [Google Scholar] [CrossRef]
- Zandi, K.; Teoh, B.T.; Sam, S.S.; Wong, P.F.; Mustafa, M.R.; AbuBakar, S. Antiviral activity of four types of bioflavonoid against dengue virus type-2. Virol. J. 2011, 8, 1–11. [Google Scholar] [CrossRef]


| Compounds | NS3 (kcal/mol) | NS5 (kcal/mol) |
|---|---|---|
| Quercetin | −9.2 | −10.1 |
| Kaempferol | −8.9 | −9.6 |
| Chlorogenic acid | −8.6 | −9.2 |
| Caffeic acid | −6.8 | −6.5 |
| p-Coumaric acid | −6.2 | −6.2 |
| Protocatechuic acid | −6.4 | −6.1 |
| 5,7-Dimethoxycoumarin | −6.2 | −6.0 |
| Components (kcal/mol) | ||||||
|---|---|---|---|---|---|---|
| Protein | Compounds | EvdW | Eelec | Ggas | Gsolv | Gbind |
| Quercetin | −33.41 ± 0.20 | −29.70 ± 0.45 | −63.15 ± 0.57 | 43.06 ± 0.82 | −20.09 ± 0.18 | |
| NS3 | Kaempferol | −36.04 ± 0.15 | −19.32 ± 0.39 | −55.36 ± 0.38 | 30.33 ± 0.32 | −25.03 ± 0.15 |
| Chlorogenic acid | −22.75 ± 0.25 | −53.05 ± 0.98 | −75.79 ± 0.95 | 63.59 ± 0.86 | −12.19 ± 0.21 | |
| Quercetin | −27.71 ± 0.18 | −23.77 ± 0.49 | −51.49 ± 0.50 | 33.30 ± 0.43 | −18.19 ± 0.16 | |
| NS5 | Kaempferol | −34.37 ± 0.26 | −27.02 ± 0.39 | −45.92 ± 0.47 | 39.70 ± 0.41 | −25.77 ± 0.17 |
| Chlorogenic acid | −27.90 ± 0.22 | −45.97 ± 0.73 | −72.87 ± 0.80 | 53.50 ± 0.65 | −19.37 ± 0.24 | |
| Compounds | Molecular Formula | Molecular Weight (g/mol) | Lipophilicity (iLOGP) | Water Solubility | GIT Absorption | BBB Permeability | Bioavailability Score | Synthetic Accessibility | Drug-Likeness (Lipinski) |
|---|---|---|---|---|---|---|---|---|---|
| Quercetin | C15H10O7 | 302.24 | 1.63 | Soluble | High | No | 0.55 | 3.23 | Yes |
| Kaempferol | C15H10O6 | 286.24 | 1.70 | Soluble | High | No | 0.55 | 3.14 | Yes |
| Chlorogenic acid | C16H18O9 | 354.31 | 0.96 | Soluble | Low | No | 0.11 | 4.16 | Yes(1) |
| H-Bond | d | k | BSO | |
|---|---|---|---|---|
| Å | mDyn/Å | cm | ||
| L1 | 1.694 | 0.316 | 752 | 0.322 |
| P1 | 2.094 | 0.066 | 344 | 0.193 |
| P2 | 1.880 | 0.124 | 471 | 0.237 |
| P3 | 2.212 | 0.063 | 336 | 0.190 |
| P4 | 2.508 | 0.015 | 163 | 0.118 |
| W1 | 1.838 | 0.374 | 818 | 0.341 |
| W2 | 1.912 | 0.240 | 655 | 0.294 |
| W3 | 1.809 | 0.490 | 937 | 0.372 |
| WD 1 | 1.926 | 0.225 | 635 | 0.288 |
| H-Bond | d | k | BSO | |
|---|---|---|---|---|
| Å | mDyn/Å | cm | ||
| L1 | 1.740 | 0.290 | 720 | 0.313 |
| L2 | 2.200 | 0.188 | 579 | 0.272 |
| P1 | 1.829 | 0.037 | 258 | 0.159 |
| P2 | 2.486 | 0.033 | 243 | 0.153 |
| P3 | 2.309 | 0.014 | 158 | 0.116 |
| P4 | 2.413 | 0.053 | 307 | 0.179 |
| P5 | 2.074 | 0.116 | 455 | 0.232 |
| P6 | 1.712 | 0.656 | 1084 | 0.410 |
| W1 | 1.917 | 0.194 | 589 | 0.275 |
| W2 | 1.832 | 0.407 | 853 | 0.350 |
| WD 1 | 1.926 | 0.225 | 635 | 0.288 |
| H-Bond | d | k | BSO | |
|---|---|---|---|---|
| Å | mDyn/Å | cm | ||
| P1 | 2.268 | 0.042 | 276 | 0.166 |
| P2 | 1.882 | 0.289 | 719 | 0.313 |
| P3 | 2.021 | 0.116 | 455 | 0.232 |
| P4 | 2.223 | 0.049 | 297 | 0.175 |
| P5 | 1.790 | 0.470 | 917 | 0.367 |
| P6 | 1.786 | 0.408 | 854 | 0.350 |
| L1 | 1.626 | 0.407 | 854 | 0.350 |
| L2 | 2.303 | 0.216 | 622 | 0.284 |
| W1 | 1.887 | 0.308 | 743 | 0.320 |
| WD 1 | 1.926 | 0.225 | 635 | 0.288 |
| H-Bond | d | k | BSO | |
|---|---|---|---|---|
| Å | mDyn/Å | cm | ||
| P1 | 1.867 | 0.212 | 616 | 0.283 |
| P2 | 1.846 | 0.303 | 737 | 0.318 |
| P3 | 1.752 | 0.500 | 946 | 0.375 |
| L1 | 2.297 | 0.227 | 637 | 0.289 |
| L2 | 2.275 | 0.221 | 629 | 0.287 |
| L3 | 1.760 | 0.245 | 663 | 0.296 |
| W1 | 1.939 | 0.205 | 606 | 0.280 |
| W2 | 1.814 | 0.387 | 832 | 0.344 |
| WD 1 | 1.926 | 0.225 | 635 | 0.288 |
Publisher’s Note: MDPI stays neutral with regard to jurisdictional claims in published maps and institutional affiliations. |
© 2022 by the authors. Licensee MDPI, Basel, Switzerland. This article is an open access article distributed under the terms and conditions of the Creative Commons Attribution (CC BY) license (https://creativecommons.org/licenses/by/4.0/).
Share and Cite
Madushanka, A.; Verma, N.; Freindorf, M.; Kraka, E. Papaya Leaf Extracts as Potential Dengue Treatment: An In-Silico Study. Int. J. Mol. Sci. 2022, 23, 12310. https://doi.org/10.3390/ijms232012310
Madushanka A, Verma N, Freindorf M, Kraka E. Papaya Leaf Extracts as Potential Dengue Treatment: An In-Silico Study. International Journal of Molecular Sciences. 2022; 23(20):12310. https://doi.org/10.3390/ijms232012310
Chicago/Turabian StyleMadushanka, Ayesh, Niraj Verma, Marek Freindorf, and Elfi Kraka. 2022. "Papaya Leaf Extracts as Potential Dengue Treatment: An In-Silico Study" International Journal of Molecular Sciences 23, no. 20: 12310. https://doi.org/10.3390/ijms232012310
APA StyleMadushanka, A., Verma, N., Freindorf, M., & Kraka, E. (2022). Papaya Leaf Extracts as Potential Dengue Treatment: An In-Silico Study. International Journal of Molecular Sciences, 23(20), 12310. https://doi.org/10.3390/ijms232012310