Abstract
Sugarcane smut is a major fungal disease caused by Sporisorium scitamineum, which seriously reduces the yield and quality of sugarcane. In this study, 36 transcriptome data were collected from two sugarcane genotypes, YT93-159 (resistant) and ROC22 (susceptible) upon S. scitamineum infection. Data analysis revealed 20,273 (12,659 up-regulated and 7614 down-regulated) and 11,897 (7806 up-regulated and 4091 down-regulated) differentially expressed genes (DEGs) in YT93-159 and ROC22, respectively. A co-expression network was then constructed by weighted gene co-expression network analysis (WGCNA), which identified 5010 DEGs in 15 co-expressed gene modules. Four of the 15 modules, namely, Skyblue, Salmon, Darkorange, and Grey60, were significantly associated with smut resistance. The GO and KEGG enrichment analyses indicated that the DEGs involving in these four modules could be enriched in stress-related metabolic pathways, such as MAPK and hormone signal transduction, plant-pathogen interaction, amino acid metabolism, glutathione metabolism, and flavonoid, and phenylpropanoid biosynthesis. In total, 38 hub genes, including six from the Skyblue module, four from the Salmon module, 12 from the Darkorange module, and 16 from the Grey60 module, were screened as candidate hub genes by calculating gene connectivity in the corresponding network. Only 30 hub genes were amplifiable with RT-qPCR, of which 27 were up-regulated upon S. scitamineum infection. The results were consistent with the trend of gene expression in RNA-Seq, suggesting their positive roles in smut resistance. Interestingly, the expression levels of AOX, Cyb5, and LAC were higher in ROC22 than in YT93-159, indicating these three genes may act as negative regulators in response to S. scitamineum infection. This study revealed the transcriptome dynamics in sugarcane challenged by S. scitamineum infection and provided gene targets for smut resistance breeding in sugarcane.
1. Introduction
Sugarcane (Saccharum spp. hybrids) is planted in more than 120 countries [1] and accounts for approximately 80% of the total sugar in the world and more than 90% in China [2]. Sugarcane smut caused by Sporisorium scitamineum is a worldwide fungal disease [3]. Cultivating smut-resistant varieties is the most economical and effective measure to prevent and control this disease [3,4,5]. However, sugarcane is an allopolyploid plant with a complex genetic background and an extremely low (about 1/300,000) recombination rate of excellent genes. It takes about 12 years to breed a new sugarcane variety for commercial production by traditional cross-breeding methods [6]. In addition, the smut resistance trait is determined by multiple genes [7]. It is thus of great significance to mine and identify molecular markers and key genes associated with smut resistance in sugarcane.
Compared with traditional molecular biology techniques, high-throughput bioinformatics methods can be used to locate genes of interest more quickly and easily [8,9]. The genome of a wild sugarcane species Saccharum spontaneum (sspon_v201901030) [10] has been sequenced, which provides a reference dataset for mining useful genetic information from massive biological data. Besides, the emergence of new network analysis methods has also resolved some problems of the traditional analysis methods to compare two samples with massive biological data. Weighted gene co-expression network analysis (WGCNA) is an approach that designates modules based on the expression data of gene chips or RNA sequencing (RNA-Seq). It utilizes systems biology to understand the co-expression networks and explore the associations between genes and target traits [9].
At present, WGCNA has been widely used in investigating the causes of a disease [11]. Shang and Gao [12] used WGCNA to analyze the gene expression of Arabidopsis thaliana plants infected with powdery mildew (Erysiphe cichoracearum; UCSC1). They constructed a co-expressed gene network and identified a total of 35 gene modules. Fu et al. [13] constructed a gene co-expression network based on the root tip transcriptome data from Gossypium barbadense seedlings infected with Verticillium dahliae at different time points. A total of 18 modules were identified, of which five were specifically related to resistance to Verticillium wilt. Four resistance genes (GbWRKY1, GbRVd, GhCYP-3, and GhWRKY70) were screened and validated. Li et al. [14] used the WGCNA method to analyze the gene expression of rice in response to the Magnaporthe oryzae infection. Several hub genes, including WRKY transcription factor, α-dioxygenase 1, peroxisomal membrane protein PEX14, and retrotransposon protein, were screened from the co-expression network. Besides, WGCNA is also a common and useful strategy for exploring the molecular mechanism of plants responding to abiotic stresses. Examples included the responses to cold, drought, and salt in rice (Oryza sativa) [15], drought in potato (Solanum tuberosum) roots [16], flood in maize (Zea mays) [17], and drought in rape (Brassica rapa) [18]. In sugarcane, WGCNA was used to analyze the effects of arbuscular mycorrhizal (AM) fungi on growth and nutrient-related gene co-expression network [19] and the drought on responsive regulatory networks [20,21]. To date, WGCNA study has not yet been reported on sugarcane response to S. scitamineum infection.
The present study aimed to explore gene co-expression networks associated with smut resistance in sugarcane. Firstly, the expression of differentially expressed genes (DEGs) between two sugarcane genotypes, YT93-159 (smut-resistant) and ROC22 (smut-susceptible) was analyzed at the transcriptional level. Secondly, a co-expression network of DEGs was constructed by WGCNA, and target gene modules associated with smut resistance were screened. Thirdly, the Kyoto Encyclopedia of Genes and Genomes (KEGG) and Gene ontology (GO) analyses were conducted to reveal the main metabolic pathways involved in the target gene modules and the potential functions of these genes. The hub genes in the modules were then identified according to the connectivity of genes in the corresponding network. Lastly, the expression patterns of these selected hub genes upon S. scitamineum infection were verified using real-time quantitative PCR (RT-qPCR). This study is expected to construct a comprehensive and dynamic gene co-expression network that associates with smut resistance in sugarcane, which should help to set up a theoretical basis for exploring the molecular mechanism of sugarcane resistance to S. scitamineum and provide new genetic resources for molecular breeding of smut resistance in sugarcane.
2. Results
2.1. Genome-Wide Transcriptome Analysis
High-throughput RNA-Seq generated a total of 402.19 GB clean reads from 36 bud samples of YT93-159 and ROC22 at six time points post S. scitamineum-infection (0 d, 1 d, 2 d, 3 d, 4 d, and 5 d) with three biological replicates. The data from each sample were greater than 9.71 GB with GC content ranging from 53.22% to 57.79% and Q30 base percentage more than 91.18% (Table S1). Compared with the designated S. spontaneum reference genome [10], the reads from each sample had an alignment efficiency between 78.55% and 86.98% (Table S1). These results indicated that the quality of the sequencing data was high and met with the requirements of the subsequent analysis.
Based on the expression at different time points post S. scitamineum inoculation, the DEGs were identified by comparing to the control (0 d). A total of 11,897 (7806 up-regulated and 4091 down-regulated) and 20,273 (12,659 up-regulated and 7614 down-regulated) DEGs were identified in ROC22 and YT93-159, respectively (Figure 1). Among these DEGs, 979 and 1401 genes were up-regulated in ROC22 and YT93-159 at 1 d to 5 d, respectively (Figure 1A,B). In comparison with the control (0 d), 99 down-regulated genes were observed in ROC22 at all the five time points, which was not significantly different from 68 genes in YT93-159 (Figure 1C,D). The results indicated that more genes were induced to express upon S. scitamineum in YT93-159 than in ROC22.
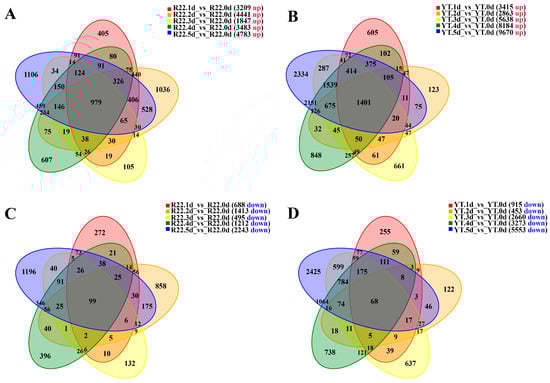
Figure 1.
Venn plots of DEGs in ROC22 and YT93-159 post-S. scitamineum infection: Up-regulated DEGs in ROC22 (A) and YT93-159 (B), and down-regulated DEGs in ROC22 (C) and YT93-159 (D), respectively.
2.2. Weighted Gene Co-Expression Network Construction and Module Identification
All 36 samples were clustered to calculate the correlation coefficients of expression level for each sample (Figure 2A). After removing the six outlier samples (R22.0d.rep1, R22.3d.rep3, R22.4d.rep1, YT.4d.rep3, YT.5d.rep1, and YT.5d.rep3), the clustering tree of the remaining 30 samples was shown in Figure 2B. The weight value was calculated using the function pick Soft Threshold in the WGCNA package [9], and the soft threshold β = 13 was determined when the fitting curve was close to 0.9 for the first time (Figure 3A). Then the modules with similar expression were merged by dynamic cutting tree method, and a total of 5010 DEGs in 15 co-expressed gene modules were obtained (Figure 3B). Among them, the Blue module had the largest number of DEGs (1291), of which 935 genes could be annotated. While the number of DEGs in the Paleturquoise and Steelblue modules was the least, both containing 39 genes, and among them, 28 and 34 genes can be annotated, respectively. The Grey module was a set of genes not allocated to other modules (Table S2).
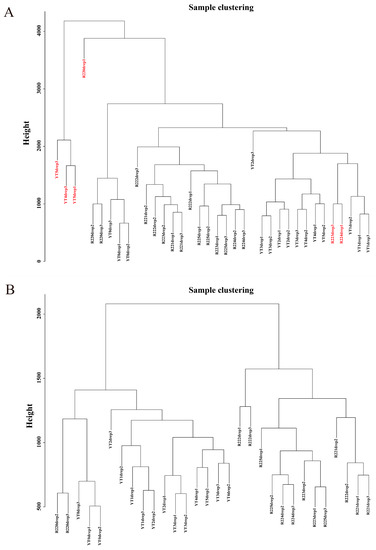
Figure 2.
Dendrograms of samples. (A) A dendrogram of all 36 samples. The six outlier samples are written in red fonts. (B) A dendrogram of 30 samples after removing the six outliers.
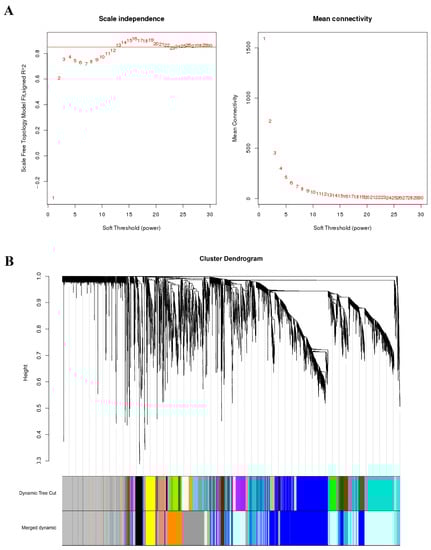
Figure 3.
Soft threshold determination of gene co-expression network and module detection by gene cluster dendrograms. (A) Soft threshold determination. (B) Module detection by gene cluster dendrograms.
Correlation coefficient between modules eigengenes and traits was tested to explore the relationship between identified modules and the smut resistance. Among 15 modules, only four modules showed a significant correlation with smut resistance. The Skyblue module had a significant correlation with the smut resistance at 5 days after ROC22 inoculation with S. scitamineum (r2 = 0.72, p = 9 × 10⁻⁶). Similarly, the Grey60 modules was strongly correlated with the smut resistance at 5 days after YT93-159 inoculation with S. scitamineum (r2 = 0.69, p = 2 × 10⁻⁵). Besides, the Salmon and Darkorange modules demonstrated a significant correlation with the smut resistance at 2 days and 4 days after YT93-159 inoculation with S. scitamineum, respectively (r2 = 0.75, p = 2 × 10⁻⁶; r2 = 0.73, p = 4 × 10⁻⁶) (Figure 4). Therefore, the Skyblue, Salmon, Darkorange and Grey60 modules were selected as target gene modules.
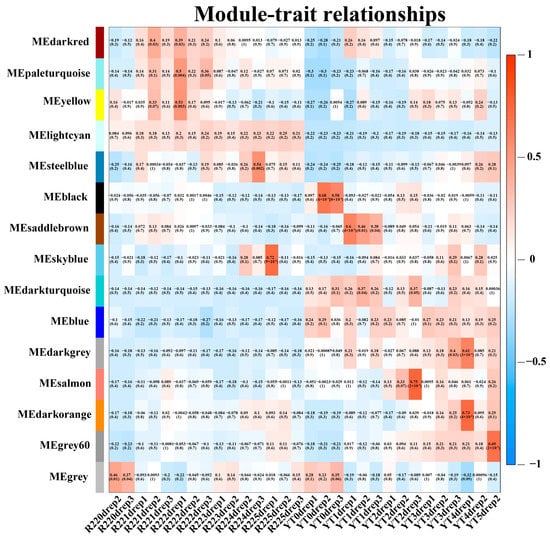
Figure 4.
Module-trait associations revealed by Pearson correlation coefficient. The leftmost color column indicates different co-expression modules. The numbers in the figure indicate the correlation between the modules and traits, and the numbers in the parentheses are the correlation p value.
2.3. GO and KEGG Enrichment Analysis of Four Target Gene Modules
For the four target gene modules, the three most significantly enriched GO terms in the biological process (BP), cellular component (CC), and molecular function (MF) groups were metabolic process, cellular process, and single-organism process in the BP category, cell, cell part and organelles in the CC category, and binding, catalytic activity, and transporter activity in the MF category (Figure 5A, Figure 6A, Figure 7A and Figure 8A). The Skyblue module could be enriched in cellular response to external stimulus (GO: 0071496), glutathione transferase activity (GO: 0004364), and asparagine synthase activity (GO: 0004066). The Salmon module was enriched into glutathione transferase activity (GO: 0004364), chitinase activity (GO: 0004568), oxidoreductase activity (GO: 0016491) and lignin catabolic process (GO: 0046274). The Darkorange module was enriched into chitinase activity (GO: 0004568), transmembrane transporter activity (GO: 0022875), defense response (GO: 0006952), and transmembrane receptor protein serine/threonine kinase activity (GO: 0004675). The Grey60 module was enriched in glutathione transferase activity (GO: 0004364), lignin catabolic process (GO: 0046274), defense response (GO: 0006952), cellular response to external stimulus (GO: 0071496), abscisic acid-activated signaling pathway (GO: 0009738), and aromatic compound biosynthetic process (GO: 0019438) (Table S3). Overall, the DEGs in the four target gene modules could be enriched in the metabolic pathways related to stress resistance, such as cellular response to stress, response to external stimulus, oxidoreductase activity, glutathione transferase activity, and chitinase activity.
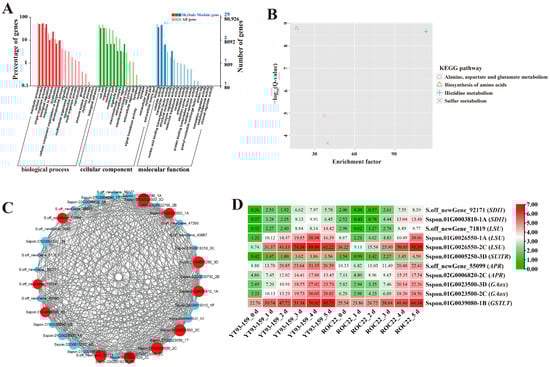
Figure 5.
GO enrichment, KEGG enrichment, gene co-expression network, and expression patterns of hub genes in the Skyblue module. (A) GO functional enrichment analysis. (B) KEGG functional enrichment analysis. (C) A gene co-expression network and hub genes. The red represents hub gene, and genes with a higher connectivity in the corresponding network are shown in larger circles. (D) The expression patterns of hub genes. YT93-159_0 d to _5 d and ROC22_0 d to _5 d represent YT93-159 and ROC22 at 0 d to 5 d post-S. scitamineum inoculation, respectively.
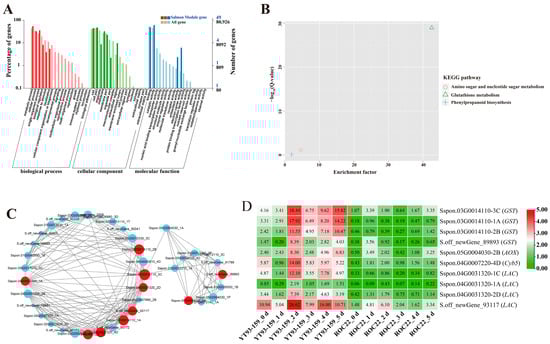
Figure 6.
GO enrichment, KEGG enrichment, gene co-expression network, and expression patterns of hub genes in the Salmon module. (A) GO functional enrichment analysis. (B) KEGG functional enrichment analysis. (C) A gene co-expression network and hub genes. The red represents hub gene, and genes with a higher connectivity in the corresponding network are shown in larger circles. (D) Expression patterns of hub genes. YT93-159_0 d to _5 d and ROC22_0 d to _5 d represent YT93-159 and ROC22 at 0 d to 5 d post-S. scitamineum inoculation, respectively.
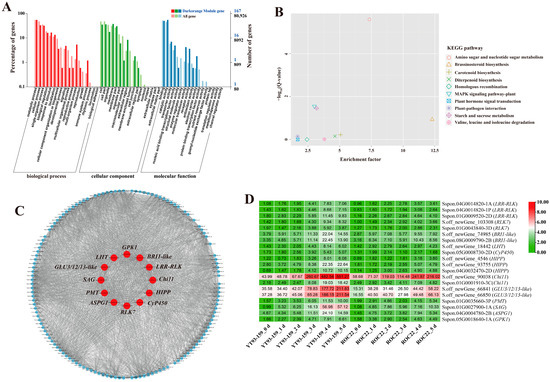
Figure 7.
GO enrichment, KEGG enrichment, gene co-expression network and expression patterns of hub genes in the Darkorange module. (A) GO functional enrichment analysis. (B) KEGG functional enrichment analysis. (C) A gene co-expression network and hub genes. The red represents hub gene. Genes with a higher connectivity in the corresponding network are shown in larger circles. (D) Expression patterns of hub genes. YT93-159_0 d to _5 d and ROC22_0 d to _5 d represent YT93-159 and ROC22 at 0 d to 5 d post-S. scitamineum inoculation, respectively.
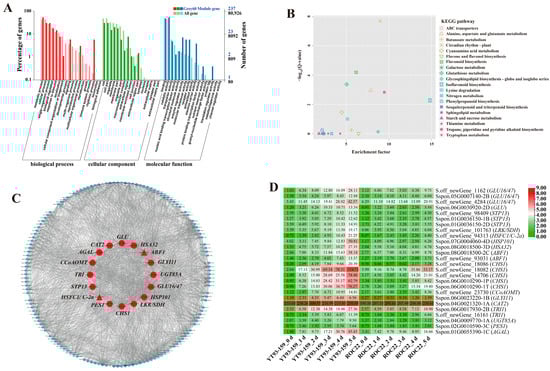
Figure 8.
GO enrichment, KEGG enrichment, gene co-expression network and expression patterns of hub genes in the Grey60 module. (A) GO functional enrichment analysis. (B) KEGG functional enrichment analysis. (C) A gene co-expression network and hub genes. The red represents hub gene, the triangle represents transcription factor, and genes with a higher connectivity in the corresponding network are shown in larger circles. (D) Expression patterns of hub genes by transcription measured. YT93-159_0 d to _5 d and ROC22_0 d to _5 d represent YT93-159 and ROC22 at 0 d to 5 d post-S. scitamineum inoculation, respectively.
The KEGG enrichment analysis of DEGs in the four target gene modules identified 4, 3, 10, and 34 enriched KEGG pathways, respectively (Figure 5B, Figure 6B, Figure 7B and Figure 8B). The Skyblue module was mainly enriched in three amino acid metabolic pathways, including amino acid biosynthesis (ko01230), histidine metabolism (ko00340), and alanine, aspartic acid, and glutamate metabolism (ko00250). The Salmon module was enriched in glutathione metabolism (ko00480), amino sugar and nucleotide sugar metabolism (ko00520), and phenylpropanoid biosynthesis (ko00940). The Darkorange and Grey60 modules were mainly enriched in amino sugar and nucleotide sugar metabolism (ko00520), MAPK signaling pathway-plant (ko04016), starch and sucrose metabolism (ko00500), plant-pathogen interaction (ko04626), and plant hormone signal transduction (ko04075). In addition, the Grey60 module was also enriched in circadian rhythm-plant (ko04712), flavonoid biosynthesis (ko00941), glutathione metabolism (ko00480), phenylpropanoid biosynthesis (ko00940), and other metabolic pathways (Table S4). In general, the DEGs in the four target gene modules were enriched in stress-related metabolic pathways such as MAPK and hormone signal transduction, starch and sucrose metabolism, plant-pathogen interaction, amino acid metabolic, glutathione metabolism, flavonoid and phenylpropanoid biosynthesis.
2.4. Screening and Functional Annotation of Candidate Hub Genes
A total of 38 genes with high connectivity in four target gene modules were selected as candidate hub genes, including six genes in the Skyblue module, four genes in the Salmon module, 12 genes in the Darkorange module and 16 genes in the Grey60 module (Figure 5C, Figure 6C, Figure 7C and Figure 8C). The NCBI and TAIR databases were used to annotate the homologous functions of the 38 hub genes in Arabidopsis, most of which were related to plant stress resistance. They included chitinase 11 (Chi11) [22,23,24,25,26], beta-1, 3-glucosidase (GLU) [27,28,29,30,31,32,33], glutathione S-transferase (GST) [34,35,36,37,38], chalcone synthase 1 (CHS1) [39], caffeoyl coenzyme A O-methyltransferase (CCoAOMT) [40], heavy metal-associated isoprenylated plant protein (HIPP) [41,42], leucine-rich repeat receptor-like protein kinase (LRR-RLK) [43,44,45], laccase (LAC) [46,47,48,49,50,51,52], ABA responsive element binding factor 1 (ABF1) [53], and so on (Table S6).
2.5. Validation of Hub Genes by RT-qPCR
Only 30 hub genes had successful RT-qPCR amplification. Twenty-seven hub genes can be induced and up-regulated by S. scitamineum infection. The gene expression levels of these genes were significantly higher in YT93-159 than ROC22 (Figure 9 and Table S8), which was consistent with the results from RNA-Seq (Figure 5D, Figure 6D, Figure 7D and Figure 8D and Table S7) suggesting the positive roles of these genes in smut resistance. However, the expression levels of AOX, Cyb5 and LAC genes were inconsistent with the trend of gene expression in RNA-Seq (Figure 6D) and were higher in ROC22 than YT93-159, suggesting that these genes may act as negative regulators in response to S. scitamineum infection (Figure 9B).
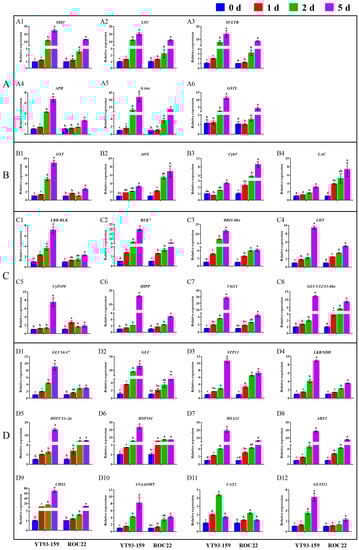
Figure 9.
Relative expression of 30 hub genes in sugarcane after inoculation with S. scitamineum by RT-qPCR. (A) Skyblue module. (B) Salmon module. (C) Darkorange module. (D) Grey60 module. 0 d (blue), 1 d (red), 2 d (green), and 5 d (purple) for YT93-159 and ROC22 at 0 d, 1 d, 2 d, and 5 d post-S. scitamineum inoculation, respectively. All data points are mean ± standard error (n = 3). Bars superscripted by different lowercase letters indicate significant differences at 5% level (p ≤ 0.05). A1, SDI1 (sulfur deficiency-induced 1); A2, LSU (LOW SULPHUR UPREGULATED); A3, SULTR (sulfate transporter); A4, APR (adenosine 5’-phosphate sulfate reductase); A5, GAox (gibberellin oxidase); A6, GSTL (glutathione S-transferase lambda); B1, GST (glutathione S-transferase); B2, AOX (alternative oxidase); B3, Gyb5 (cytochrome b5); B4, LAC (laccase); C1, LRR-RLK (leucine-rich repeat receptor-like protein kinase); C2, RLK7 (receptor-like kinase 7); C3, BRI1-like (brassinosteroid insensitive 1-like); C4, LHT (lysine histidine transporter); C5, CyP450 (cytochrome P450); C6, HIPP (heavy metal-associated isoprenylated plant protein); C7, Chi11 (chitinase 11); C8, GLU 3/12/13-like (beta-glucosidase 3/12/13-like); D1, GLU16/47 (beta-glucosidase 16/47); D2, GLU (beta-glucosidase); D3, STP13 (sugar transport protein 13); D4, LKR/SDH (lysine-ketoglutarate reductase/saccharopine dehydrogenase); D5, HSFC1/C-2a (heat shock transcription factor C1/C-2a); D6, HSP101 (heat shock protein 101); D7, HSA32 (heat-stress-associated 32); D8, ABF1 (ABA responsive element binding factor 1); D9, CHS1 (chalcone synthase 1); D10, CCoAOMT (caffeoyl coenzyme A O-methyltransferase); D11, CAT2 (catalase 2); D12, GLYI11 (glyoxalase I 11).
3. Discussion
Cultivating smut-resistant varieties is the most economical and effective measure to prevent and control this disease in sugarcane industry [3,4,5]. Mining key candidate genes associated with smut resistance can provide target gene resources for molecular breeding for smut resistance in sugarcane. Previous studies in transcriptome [54,55,56,57,58,59,60] and proteome [61,62,63,64,65] on sugarcane infected by S. scitamineum offered new insights as to how S. scitamineum infection might influence the differential expression of genes and proteins. These studies also revealed that the mechanism of smut resistance was extremely complex and involved in almost all aspects of biological activities [5]. In this study, WGCNA was applied to construct a co-expression network of weighted genes associated with smut-resistant traits based on multivariate transcriptome dataset from plants of two sugarcane genotypes, YT93-159 (resistant) and ROC22 (susceptible) that were infected by S. scitamineum. A total of 15 gene modules were identified, of which four were significantly associated with smut resistance. Interestingly, 38 candidate hub genes with high connectivity were successfully mined (Figure 5C, Figure 6C, Figure 7C and Figure 8C), of which 30 were induced and expressed upon S. scitamineum infection (Figure 9). These hub genes may play an important role in sugarcane’s response to S. scitamineum infection through sulfur metabolism, reactive oxygen species (ROS) scavenging mechanism, plant immune response, phenylpropanoid metabolism, brassinosteroid signaling, and other resistance-associated metabolic pathways. Sulfur, as an essential macronutrient, plays a crucial role in plant growth and development [66]. Sulfur deficiency can lead to amino acid imbalance and impaired protein synthesis [67]. Aarabi et al. [68] reported that under sulfur deficiency condition, sulfur deficiency induced 1 (SDI1) and SDI2 acted as major repressors controlling glucosinolate (GSL) biosynthesis in Arabidopsis at both transcript and metabolite levels. Garcia-Molina et al. [69] showed that the expression of LOW SULPHUR UPREGULATED (LSU) in Arabidopsis was up-regulated under nutrient depletion or salt stress. Adenosine 5’-phosphate sulfate reductase (APR) was the key rate-limiting enzyme in the sulfur assimilation process and was mainly regulated by transcription factors in response to sulfur availability and environmental stimuli [70]. Sulfate transporter (SULTR) was a carrier protein required for active sulfate transport, and an essential protein for absorption and transportation of sulfur in plants [71]. Ding et al. [71] identified 28 GmSULTR genes from soybean genome and confirmed that GmSULTR1;2b played an important role in sulfur absorption to improve plant tolerance to sulfur deficiency. In this study, SDI1, LSU, SULTR and APR genes in the Skyblue module responded to S. scitamineum infection by gradually increased levels of gene expression that reached the peak at 5 d. The expression levels were higher in YT93-159 than ROC22 (Figure 9A), indicating that these four genes may involve in the sulfur metabolism pathway in response to S. scitamineum infection.
Catalase (E.C.1.11.1.6; CAT), a heme-containing tetramer enzyme mostly localized in peroxisomes, is an efficient scavenger of ROS [72]. The main function of CAT is to scavenge H2O2, maintain the stability of ROS levels in plants to avoid oxidative damage caused by various biotic and abiotic stresses [73,74]. Su et al. [75] found a sugarcane catalase gene ScCAT1 that was up-regulated by varying degrees under S. scitamineum infection and abiotic stresses such as SA, ABA, MeJA, H2O2, drought, salt, and heavy metals. Similarly, Sun et al. [76] reported that ScCAT2 played a positive role in immune responses during sugarcane-S. scitamineum interactions, as well as in salt, drought, and cold stresses. Glutathione S-transferases (GSTs) are a group of isozymes widely existing in plants with multiple physiological functions [77]. GST catalyzes the conjugation of tripeptide (γ-Glu-Cys-Gly) glutathione (GSH) to various electrophiles [78] and plays a crucial role in the detoxification of xenobiotics and stress metabolism [35]. In cotton, the expression of GaGSTF9 gene can enhance the resistance of Gossypium arboreum to Verticillium wilt [36]. Overexpression of GhGST3 gene could effectively improve the resistance of Arabidopsis plants to Verticillium wilt [37]. In this study, the CAT2 gene in the Grey60 module was up-regulated by S. scitamineum infection and reached the peak at 2 d (Figure 9D12). The GSTL gene in the Skyblue module and the GST gene in the Salmon module were positively up-regulated by the stress of sugarcane smut pathogen (Figure 9A6,B1), confirming that CAT and GST may play a role in sugarcane response to S. scitamineum infection through the enzymatic ROS scavenging mechanism.
Pathogenesis-related (PR) proteins are specific proteins induced under pathological conditions that play an important role in plant disease resistance reaction [79]. Chitinases (E.C. 3.2.2.14; Chi) are one category of PR proteins, which can play an important role in plant defense mechanisms by catalyzing poly-chitin in the main components of the pathogen cell wall [24]. Su et al. [25,26] demonstrated that the chitinase gene was involved in sugarcane response to S. scitamineum infection, and its expression level was higher in smut-resistant varieties than susceptible varieties. β-1,3-glucanase (E.C. 3.2.1.39; GLU) is another typical PR protein that catalyzes the hydrolysis of β-1,3-glucans in the cell wall of most fungi [27,28]. Su et al. [32,33] revealed that three sugarcane β-1,3-glucanase genes (ScGluA1, ScGluD1, and ScGluD2) were involved in sugarcane response to S. scitamineum infection and their expression levels were higher in smut-resistant varieties than susceptible varieties. Besides, previous study showed that the co-expression of tobacco β-1,3-glucanase and chitinase gene effectively inhibited the growth of smut pathogen in sugarcane [29]. In this study, Chi11, GLU3/12/13-like, GLU16/47, and GLU genes were induced and up-regulated upon S. scitamineum infection (Figure 9C7,C8,D1,D2), suggesting that these genes may play a role in the interaction between sugarcane and S. scitamineum.
Phenylpropanoid metabolism is one of the most important metabolisms in plants with many intermediate compounds, including lignin, flavonoids, lignans, phenylpropanoid esters, and hydroxycinnamic acid amides, that are closely related to plant resistance [80]. Chalcone synthase (CHS) is a key enzyme in the synthesis of multifunctional flavonoids involving in plant resistance to biotic/abiotic stress [39]. After S. scitamineum inoculation, Wang et al. [81] found an up-regulated expression of ScCHS1 gene in NCo376, a smut-resistant variety, while there was no significant change in susceptible cultivar ROC22. Caffeoyl-coenzyme A O-methyltransferase (CCoAOMT) acts as the main regulator determining the efficiency of synthesis and composition of lignin [82]. Yang et al. [40] showed that CCoAOMT the expression could improve wheat resistance to Fusarium head blight (FHB). We found in this study that the expression levels of CHS1 and CCoAOMT genes increased gradually from 0 d to 5 d upon S. scitamineum inoculation and peaked at 5 d (Figure 9D9,9D10). The results suggest that these two genes may involve in the synthesis of flavonoids and lignin and hence enhance the resistance to sugarcane smut. Laccase (LAC), also known as a polyphenol oxidase, has a typical copper oxidase domain and belongs to an enzyme of the cuprous oxidase family [46]. The LAC is mainly involved in the metabolism of lignin, phenols and other substances, the formation of cell wall [47], and the regulation of plant growth and development [48], stress response [49], insect and disease resistance [50,51] in higher plants. Hu et al. [52] showed that cotton laccase gene GhLac1 accelerated the reconstruction of protoplast cell wall and participated in the regulation of cotton resistance to Verticillium dahliae, cotton bollworm (Helicoverpa armigera) and cotton aphid (Aphis gosypii). Interestingly, in our study, the expression level of LAC gene in smut-susceptible variety ROC22 was higher than that in -resistant variety YT93-159 (Figure 9B4), which indicated that LAC gene may be involved in the metabolism of lignin and phenols as a negative regulatory gene to improve sugarcane resistance to S. scitamineum.
The brassinosteroid (BR) signaling pathway not only plays an important role in plant growth and development, but also involves in plant immune defense [83]. In this study, leucine-rich repeat receptor-like protein kinase gene (LRR-RLK) (Figure 9C1), receptor-like kinase 7 gene (RLK7) (Figure 9C2) and brassinosteroid insensitive 1-like gene (BRI1-like) (Figure 9C3) were screened out from the Darkorange module and were up-regulated by the S. scitamineum infection. These genes may involve in plant BR signaling pathway and play an important role in sugarcane response to S. scitamineum infection, as was suggested by previous studies [43,84,85]. For example, Chen et al. [84] demonstrated that overexpression of TaRLK1 or TaRLK2 in a moderately susceptible wheat cultivar “Yangmai 158” could significantly enhance the resistance to powdery mildew (Blumeria graminearum f. sp. tritici). Guo et al. [43] confirmed that by silencing the cysteine-rich receptor-like kinase (CRK)-encoding gene (TaCRK3) significantly reduced wheat resistance to Sharp eyespot (Rhizoctonia cerealis) and inhibited the expression of the ethylene biosynthesis ACO2 and other genes related to defense. Marcos et al. [85] found that 9-lipoxygenase-derived oxylipins in A. thaliana induced BR synthesis and signaling to activate cell wall-based responses, while a BR receptor BRI1 deletion mutant bri1 gene conferred resistance to Pseudomonas syringae.
4. Materials and Methods
4.1. Plant Materials and Pathogen Stress Treatment
Two sugarcane genotypes, YT93-159 and ROC22, were planted at the Experimental Station of Fujian Agriculture and Forestry University (FAFU), Fuzhou, Fujian (longitude 119°23′ E/latitude 26°11′ N), during a natural growth season in 2018 to 2019. Cultivation and field management followed normal production protocols. Mixed spores of S. scitamineum were collected from a sugarcane field plot in Baise, Guangxi (longitude 106°53′–107°26′ E/latitude 23°16′–24°01′ N) and the Experimental Station of FAFU, then stored at 4 °C refrigerator after drying.
Mature sugarcane stems of YT93-159 and ROC22 with the same growth vigor were selected and inoculated with S. scitamineum according to Su et al. [75]. The sugarcane stems were cut into single-bud setts, soaked in water for 24 h, and then germinated for 2–3 d in a greenhouse at 32 °C, 65% relative humidity (RH). When the sugarcane buds germinated and grew to 1–2 cm long, they were syringe-inoculated with 0.5 μL suspension containing 5 × 10⁶ spores mL−1 in 0.01 % (v/v) Tween-20. The inoculated buds were cultured at 28 °C, 65% RH under conditions for 12 h light/12 h dark alternately. At least six buds from each genotype were excised with three biological replicates at the time point of 0 d (control), 1 d, 2 d, 3 d, 4 d and 5 d, then frozen in liquid nitrogen and stored at −80 °C until extraction of total RNA.
4.2. RNA Extraction, Illumina Sequencing and Data Analysis
Total RNA of 36 samples was extracted using Trizol reagent (Invitrogen, Carlsbad, CA, USA) following the manufacturer’s protocol. The total RNA samples were sent to Baimaike Biotechnology Co., Ltd. (Beijing, China) for cDNA library construction after qualitative and quantitative assessments on NanoDrop One (Thermo Fisher Scientific, Waltham, MA, USA). The RNA integrity (RIN) was also confirmed using an Agilent 2100 Bioanalyzer (Agilent Technologies, Palo Alto, CA, USA). The requirements for cDNA library construction and subsequent sequencing were met when the RIN was ≥7. Libraries for Illumina RNA-Seq (150 bp paired-end) were generated using the TruSeq RNA sample preparation kit (Illumina RS-122–2101, Illumina, CA, USA) and sequenced on an Illumina HiSeq2000 instrument. The raw sequencing data were deposited in National Genomics Data Center (NGDC), Beijing Institute of Genomics, Chinese Academy of Sciences, under Project PRJCA011580 with Genome Sequence Archive (GSA) number CRA008043 (https://ngdc.cncb.ac.cn/gsub/submit/gsa/subCRA012317/finishedOverview; accessed on 31 August 2022 and released on 5 September 2022).
The quality of sequencing was assessed using FastQC and Trimmomatic software [86]. Clean data were obtained by removing reads containing adapter, poly-N and low-quality reads from raw data, then mapped to the S. spontaneum reference genome [10] using HISAT2 [87]. The S. spontaneum reference genome was downloaded from EnsemblPlants (http://plants.ensembl.org/species.html; accessed on 8 March 2021). The FPKM (fragments per KB of transcript per million fragments mapped) in StringTie [88] was used to measure the level of transcript or gene expression. The DESeq R [89] package was then used to conduct differential expression analysis of samples. In this study, DEGs were identified if fold change was >1.5 and the false discovery rate (FDR) was <0.05.
4.3. Weighted Gene Co-Expression Network Analysis
The co-expression gene network was constructed using the WGCNA package of the R software in reference to the tutorial on WGCNA official website [9]. Firstly, clustering analysis was carried out after removing samples with low correlation, or those that cannot be clustered on the dendrogram [16]. Secondly, to meet the prerequisite of scale-free network distribution, the pick Soft Threshold function within WGCNA package was used to calculate the Soft Threshold [9], and the Threshold parameter β was selected when the fitting curve approached 0.9 for the first time. Then, according to the β value, the correlation-based association between phenotype and gene-modules was conducted to create an adjacency matrix. The adjacency matrix was further converted to a topological overlap matrix (TOM), and the gene connection network was constructed. Finally, the gene modules were identified and clustered by dynamic tree cut method based on the eigengenes (ME) of each module, and the modules with closer distances were merged into new ones. In this study, the module similarity threshold = 0.25, the expression threshold = 2, and the minimum number of genes in the module = 30 were set to divide modules.
4.4. Selection and Enrichment Analysis of Target Gene Modules
To further study the gene modules associated with sugarcane smut resistance, the correlation coefficients between module eigengenes and different samples were calculated. Modules with correlation coefficients close to 0.7 (r ≈ 0.7) were selected as target gene modules. Annotation of DEGs in target modules was carried out by using Blast2Go [90,91] with default parameters at each step of the pipeline. Blast2Go retrieves gene ontology (GO) terms that include biological processes, molecular functions, and cellular components. Pathway enrichment analysis of DEGs within the target modules was performed using KEGG database [92].
4.5. Screening and Functional Annotation of Hub Genes
All the DEGs from these four target modules were selected based on intramodular gene significance, edges, and nodes calculated with the WGCNA R package [9,93] (Table S5). The information was exported to Cytoscape 3.8.2 software [94] for gene-networks visualizations. The DEGs with high connectivity in the target gene modules were screened as candidate hub genes. The NCBI database was used to query related reports of these hub genes. Homologous gene functions in Arabidopsis were annotated with the TAIR database (https://www.arabidopsis.org; accessed on 15 September 2021).
4.6. Validation of Hub Genes by Real-Time Quantitative PCR Analysis
A total of 38 candidate hub genes were selected for RT-qPCR analysis to examine their expression profiles. Primer pairs of candidate hub genes were designed by Beacon Designer 8.0 (Table S9). The buds of YT93-159 and ROC22 at 0 d, 1 d, 2 d, and 5 d time points post-S. spontaneum inoculation were selected as materials. GAPDH was used as the internal reference gene [95]. The gene expression analysis of candidate hub genes was carried out with three independent biological replicates for each sample [96]. RT-qPCR was performed on ABI QuantStudioTM 3 system (Thermo Fisher Scientific, Waltham, MA, USA) using the SYBR-green dye method following a thermal cycling program of “50 °C, 2 min; 95 °C, 10 min; 40 cycles of (95 °C, 15 s; 60 °C, 1 min)”. The total reaction volume was 25 µL, including 12.5 µL FastStart Universal SYBR Green PCR Master (Roche, Shanghai, China), 0.5 µL of each primer (10 µM), 1.0 µL template (10× diluted cDNA liquid), and 10.5 µL ddH2O. Expression levels of selected hub genes were calculated using the 2−∆∆CT method [97]. Histograms were graphed by GraphPad Prism 6. Significance (p < 0.05) and standard error (SE) were determined by the Duncan’s new multiple range test.
5. Conclusions
In this study, a co-expression network of weighted genes associated with sugarcane smut-resistant traits was constructed to identify 15 target modules. Four target gene modules were significantly associated with S. scitamineum infection. The GO and KEGG enrichment analyses revealed that the DEGs in these four target gene modules were enriched in several metabolic pathways related to stress resistance, such as MAPK and hormone signal transduction, plant-pathogen interaction, amino acid metabolism, glutathione metabolism, and flavonoid and phenylpropanoid biosynthesis. A total of 38 genes, including six from the Skyblue module, four from the Salmon module, 12 from the Darkorange module and 16 from the Grey60 module, with high connectivity in four target gene modules were screened as candidate hub genes. The RT-qPCR analysis showed that 30 genes was induced to express upon S. scitamineum infection. Twenty-seven genes had up-regulated expression and played a positive role in smut resistance. Interestingly, the expression levels of AOX, Cyb5 and LAC were higher in susceptible genotype ROC22 than the resistant genotype YT93-159, indicating that these three genes may be negative regulators in sugarcane response to S. scitamineum infection. In addition, a potential molecular mechanism of sugarcane response to S. scitamineum infection was drawn (Figure 10) to illustrate what roles these hub genes may play in smut resistance in sugarcane. The results from this study benefit further understanding of the molecular mechanisms of smut resistance and provide a new gene resource for future smut resistance breeding in sugarcane.
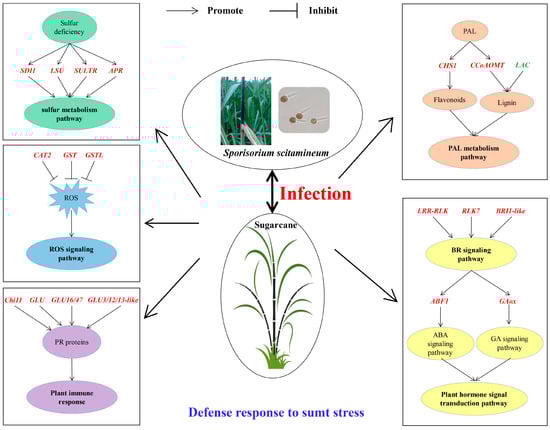
Figure 10.
A model of molecular mechanism of sugarcane response to S. scitamineum infection. Positive gene regulators are written in red fonts. Negative gene regulators are written in green fonts. SDI1, sulfur deficiency-induced 1; LSU, LOW SULPHUR UPREGULATED; SULTR, sulfate transporter; APR, adenosine 5’-phosphate sulfate reductase; CAT2, catalase 2; GST, glutathione S-transferase; GSTL, glutathione S-transferase lambda; Chi11, chitinase 11; GLU, beta-glucosidase; GLU16/47, beta-glucosidase 16/47; GLU3/12/13-like, beta-glucosidase 3/12/13-like; CHS1, chalcone synthase 1; CCoAOMT, caffeoyl coenzyme A O-methyltransferase; LAC, laccase; LRR-RLK, leucine-rich repeat receptor-like protein kinase; RLK7, receptor-like kinase 7; BRI1-like, brassinosteroid insensitive 1-like; ABF1, ABA responsive element binding factor 1; GAox, gibberellin oxidase.
Supplementary Materials
The following supporting information can be downloaded at https://www.mdpi.com/article/10.3390/ijms231810770/s1.
Author Contributions
Conceptualization, Q.W., Y.-B.P., M.P.G., L.X. and Y.Q.; methodology, Q.W., Y.S., L.X. and Y.Q.; software, Q.W., T.S. and F.X.; validation, Q.W., W.Z., F.X., T.S. and Y.S.; writing-original draft preparation, Q.W., Y.-B.P. and Y.S; writing-review and editing, Q.W., Y.-B.P., S.Y., Y.S. and Y.Q.; supervision, L.X. and Y.Q.; project administration, Y.-B.P., M.P.G., L.X. and Y.Q. All authors have read and agreed to the published version of the manuscript.
Funding
This research was funded by the National Key R&D Program of China (2019YFD1000500), National Natural Science Foundation of China (31971992 and 31871688), Natural Science Foundation of Fujian Province, China (2020J01591 and 2015J06006), China Agriculture Research System of MOF and MARA (CARS-17), and a Non-Funded Cooperative Agreement between the USDA-ARS and NRDCSIT on Sugarcane Breeding, Varietal Development, and Disease Diagnosis, China (Accession Number: 428234).
Institutional Review Board Statement
Not applicable.
Informed Consent Statement
Not applicable.
Data Availability Statement
Not applicable.
Acknowledgments
The authors are thankful to Yuling Jia and Perng-Kuang Chang for reviewing the manuscript with excellent comments. USDA is an equal opportunity provider and employer.
Conflicts of Interest
The authors declare no conflict of interest.
References
- Rajput, M.A.; Rajput, N.A.; Syed, R.N.; Lodhi, A.M.; Que, Y. Sugarcane smut: Current knowledge and the way forward for management. J. Fungi 2021, 7, 1095. [Google Scholar] [CrossRef] [PubMed]
- Lam, E.; Shine, J.; Silva, J.D.; Lawton, M.; Bonos, S.; Calvino, M.; Carrer, H.; Silva-filho, M.C.; Glynn, N.; Helsel, Z.; et al. Improving sugarcane for biofuel: Engineering for an even better feedstock. GCB Bioenergy 2009, 1, 251–255. [Google Scholar] [CrossRef]
- Padmanaban, P.; Alexander, K.C.; Shanmugan, N. Effect of smut on growth and yield parameters of sugarcane. Indian Phytopathol. 1988, 41, 367–369. [Google Scholar]
- Que, Y.; Xu, L.; Wu, Q.; Liu, Y.; Ling, H.; Liu, Y.; Zhang, Y.; Guo, J.; Su, Y.; Chen, J.; et al. Genome sequencing of Sporisorium scitamineum provides insights into the pathogenic mechanisms of sugarcane smut. BMC Genom. 2014, 15, 996. [Google Scholar] [CrossRef]
- Bhuiyan, S.A.; Magarey, R.C.; McNeil, M.D.; Aitken, K.S. Sugarcane smut, caused by Sporisorium scitamineum, a major disease of sugarcane: A contemporary review. Phytopathology 2021, 111, 1905–1917. [Google Scholar] [CrossRef] [PubMed]
- Solas, M.T.; Pinon, D.; Vicente, C.; Legaz, M.E. Ultrastructural Aspects of Sugarcane Bud Infection by Ustilago scitaminea Teliospores. Sugar Cane 1999, 2, 14–18. [Google Scholar]
- Héctor, E.; Prada, F.D.; Rodriguez, R. Experimental evidence for the presence of different smut resistance mechanisms in sugarcane. In Proceedings of the XXI Congress of ISSCT, Bangkok, Thailand, 5–14 March 1992. [Google Scholar]
- Zhang, B.; Horvath, S. A general framework for weighted gene co-expression network analysis. Stat. Appl. Genet. Mol. 2005, 4, 1–45. [Google Scholar] [CrossRef]
- Langfelder, P.; Horvath, S. WGCNA: An R package for weighted correlation network analysis. BMC Bioinform. 2008, 9, 559. [Google Scholar] [CrossRef]
- Zhang, J.; Zhang, X.; Tang, H.; Zhang, Q.; Hua, X.; Ma, X.; Zhu, F.; Jones, T.; Zhu, X.; Bowers, J.; et al. Allele-defined genome of the autopolyploid sugarcane Saccharum spontaneum L. Nat. Genet. 2018, 50, 1565–1573. [Google Scholar] [CrossRef]
- Zhang, H.; Hu, W.; Hao, J.; Lv, S.; Wang, C.; Tong, W.; Wang, Y.; Wang, Y.; Liu, X.; Ji, W. Genome-wide identification and functional prediction of novel and fungi-responsive lincRNAs in Triticum aestivum. BMC Genom. 2016, 17, 238. [Google Scholar] [CrossRef]
- Shang, H.; Gao, Z. Analysis of differential transcriptional genes in Arabidopsis thaliana after Powdery Mildew infection by WGCNA. Mol. Plant Breed. 2020, 18, 6734–6742. [Google Scholar]
- Fu, M.; Li, H.; Chen, Y.; Liu, Z.; Liu, R.; Wang, L. Identification of co-expressed modules of cotton genes responding to Verticillium dahliae infection by WGCNA. Acta Agron. Sin. 2020, 46, 668–679. [Google Scholar]
- Li, X.; Ma, L.; Guo, L.; Liu, Y.; Yang, M.; Zhu, S.; He, X.; Zhu, Y.; Huang, H. Identification of rice blast resistance-related co-expression modules in near iso-genic lines by WGCNA. Mol. Plant Breed. 2021, 13, 1–13. [Google Scholar]
- Li, X.; Li, R.; Zhang, B. Identification of rice stress-related gene co-expression modules by WGCNA. Acta Agron. Sin. 2019, 45, 1349–1364. [Google Scholar]
- Qin, T.; Sun, C.; Bi, Z.; Li, P.; Zhang, J.; Bai, J. Identification of drought-related co-expression modules and hub genes in potato roots based on WGCNA. Acta Agron. Sin. 2020, 46, 1033–1051. [Google Scholar]
- Thirunavukkarasu, N.; Hossain, F.; Mohan, S.; Shiriga, K.; Mittal, S.; Sharma, R.; Singh, R.K.; Gupta, H.S. Genome-wide expression of transcriptomes and their co-expression pattern in subtropical maize (Zea mays L.) under waterlogging stress. PLoS ONE 2013, 8, e70433. [Google Scholar] [CrossRef] [PubMed]
- Greenham, K.; Guadagno, C.R.; Gehan, M.A.; Mockler, T.C.; Weinig, C.; Ewers, B.E.; McClung, C.R. Temporal network analysis identifies early physiological and transcriptomic indicators of mild drought in Brassica rapa. Elife 2017, 6, e29655. [Google Scholar] [CrossRef]
- Kong, C.; Pang, Z.; Zhang, C.; Liu, Q.; Hu, C.; Xiao, Y.; Yuan, Z. Effects of arbuscular mycorrhizal fungi on sugarcane growth and nutrient related gene co-expression network under different fertilization levels. Acta Agron. Sin. 2022, 48, 860–872. [Google Scholar]
- Li, P.; Zhao, Z.; Huang, C.; Huang, G.; Xu, L.; Deng, Z.; Zhang, Y.; Zhao, X. Analysis of drought responsive regulatory network in sugarcane based on transcriptome and WGCNA. Acta Agron. Sin. 2022, 48, 1583–1600. [Google Scholar]
- Li, P.; Lin, P.; Zhao, Z.; Li, Z.; Liu, Y.; Huang, C.; Huang, G.; Xu, L.; Deng, Z.; Zhang, Y.; et al. Gene co-expression analysis reveals transcriptome divergence between wild and cultivated sugarcane under drought Stress. Int. J. Mol. Sci. 2022, 23, 569. [Google Scholar] [CrossRef]
- Liu, J.J.; Ekramoddoullah, A.K.; Zamani, A. A class IV chitinase is up-regulated by fungal infection and abiotic stresses and associated with slow-canker-growth resistance to Cronartium ribicola in western white pine (Pinus monticola). Phytopathology 2005, 95, 284–291. [Google Scholar] [CrossRef]
- Maximova, S.N.; Marelli, J.P.; Young, A.; Pishak, S.; Verica, J.A.; Guiltinan, M.J. Over-expression of a cacao class I chitinase gene in Theobroma cacao L. enhances resistance against the pathogen, Colletotrichum gloeosporioides. Planta 2006, 224, 740–749. [Google Scholar] [CrossRef] [PubMed]
- Xiao, Y.H.; Li, X.B.; Yang, X.Y.; Luo, M.; Hou, L.; Guo, S.H.; Luo, X.Y.; Pei, Y. Cloning and characterization of a balsam pear class I chitinase gene (Mcchit1) and its ectopic expression enhances fungal resistance in transgenic plants. Biosci. Biotech. Bioch. 2007, 71, 1211–1219. [Google Scholar] [CrossRef] [PubMed]
- Su, Y.; Xu, L.; Fu, Z.; Yang, Y.; Guo, J.; Wang, S.; Que, Y. ScChi, encoding an acidic class III chitinase of sugarcane, confers positive responses to biotic and abiotic stresses in sugarcane. Int. J. Mol. Sci. 2014, 15, 2738–2760. [Google Scholar] [CrossRef]
- Su, Y.; Xu, L.; Wang, S.; Wang, Z.; Yang, Y.; Chen, Y.; Que, Y. Identification, phylogeny and transcript of chitinase family genes in sugarcane. Sci. Rep. 2015, 5, 10708. [Google Scholar] [CrossRef] [PubMed]
- Leubner-Metzger, G.; Meins, F. Functions and regulation of plant β-1, 3-glucanases (PR-2). In Pathogenesis-Related Proteins in Plants; CRC Press: Boca Raton, FL, USA, 1999; pp. 49–76. [Google Scholar]
- Singh, D.; Ambroise, A.; Haicour, R.; Sihachakr, D.; Rajam, M.V. Increased resistance to fungal wilts in transgenic eggplant expressing alfalfa glucanase gene. Physiol. Mol. Biol. Plants 2014, 20, 143–150. [Google Scholar] [CrossRef]
- Gu, L.; Zhang, S.; Yang, B.; Cai, W.; Huang, D.; Wang, W.; Li, J. Introduction of chitin and β-1,3-glucan into sugarcane. Mol. Plant Breed. 2008, 6, 277–280. [Google Scholar]
- Wu, C.T.; Bradford, K.J. Class I chitinase and β-1,3-glucanase are differentially regulated by wounding, methyl jasmonate, ethylene, and gibberellin in tomato seeds and leaves. Plant Physiol. 2003, 133, 263–273. [Google Scholar] [CrossRef]
- Roy Choudhury, S.; Roy, S.; Singh, S.K.; Sengupta, D.N. Molecular characterization and differential expression of β-1,3-glucanase during ripening in banana fruit in response to ethylene, auxin, ABA, wounding, cold and light–dark cycles. Plant Cell Rep. 2010, 29, 813–828. [Google Scholar] [CrossRef]
- Su, Y.; Xu, L.; Xue, B.; Wu, Q.; Guo, J.; Wu, L.; Que, Y. Molecular cloning and characterization of two pathogenesis-related β-1, 3-glucanase genes ScGluA1 and ScGluD1 from sugarcane infected by Sporisorium scitamineum. Plant Cell Rep. 2013, 32, 1503–1519. [Google Scholar] [CrossRef]
- Su, Y.; Wang, Z.; Liu, F.; Li, Z.; Peng, Q.; Guo, J.; Xu, L.; Que, Y. Isolation and characterization of ScGluD2, a new sugarcane beta-1,3-glucanase D family gene induced by Sporisorium scitamineum, ABA, H2O2, NaCl, and CdCl2 stresses. Front. Plant Sci. 2016, 7, 1348. [Google Scholar] [CrossRef]
- Chi, Y.; Cheng, Y.; Vanitha, J.; Kumar, N.; Ramamoorthy, R.; Ramachandran, S.; Jiang, S.Y. Expansion mechanisms and functional divergence of the glutathione S-transferase family in sorghum and other higher plants. DNA Res. 2011, 18, 1–16. [Google Scholar] [CrossRef] [PubMed]
- Mohsenzadeh, S.; Esmaeili, M.; Moosavi, F.; Shahrtash, M.; Saffari, B.; Mohabatkar, H. Plant glutathione S-transferase classification, structure and evolution. Afr. J. Biotechnol. 2011, 10, 8160–8165. [Google Scholar]
- Gong, Q.; Yang, Z.; Chen, E.; Sun, G.; He, S.; Butt, H.I.; Zhang, C.; Yang, Z.; Du, X.; Li, F. A phi-class glutathione S-transferase gene for Verticillium wilt resistance in Gossypium arboreum identified in a genome-wide association study. Plant Cell Physiol. 2018, 59, 275–289. [Google Scholar] [CrossRef]
- Li, Y.; Ma, L.; Chen, Y.; Weng, H.; Li, Z. The Verticillium wilt resistance research of glutathione S-transferase subunit encoding gene GhGST3 in Gossypium hirsutum. J. Hebei Agri. Univ. 2020, 43, 35–43. [Google Scholar]
- Chen, J.H.; Jiang, H.W.; Hsieh, E.J.; Chen, H.Y.; Chien, C.T.; Hsieh, H.L.; Lin, T.P. Drought and salt stress tolerance of an Arabidopsis glutathione S-transferase U17 knockout mutant are attributed to the combined effect of glutathione and abscisic acid. Plant Physiol. 2012, 158, 340–351. [Google Scholar] [CrossRef]
- Dao, T.T.H.; Linthorst, H.J.M.; Verpoorte, R. Chalcone synthase and its functions in plant resistance. Phytochem. Rev. 2011, 10, 397–412. [Google Scholar] [CrossRef]
- Yang, G.; Pan, W.; Zhang, R.; Pan, Y.; Guo, Q.; Song, W.; Zheng, W.; Nie, X. Genome-wide identification and characterization of caffeoyl-coenzyme A O-methyltransferase genes related to the Fusarium head blight response in wheat. BMC Genom. 2021, 22, 504. [Google Scholar] [CrossRef]
- Zhang, X.; Feng, H.; Feng, C.; Xu, H.; Huang, X.; Wang, Q.; Duan, X.; Wang, X.; Wei, G.; Huang, L.; et al. Isolation and characterisation of cDNA encoding a wheat heavy metal-associated isoprenylated protein involved in stress responses. Plant Biol. 2015, 17, 1176–1186. [Google Scholar] [CrossRef]
- Cowan, G.H.; Roberts, A.G.; Jones, S.; Kumar, P.; Kalyandurg, P.B.; Gil, J.F.; Savenkov, E.I.; Hemsley, P.A.; Torrance, L. Potato mop-top virus co-opts the stress sensor HIPP26 for long-distance movement. Plant Physiol. 2018, 176, 2052–2070. [Google Scholar] [CrossRef]
- Guo, F.; Wu, T.; Shen, F.; Xu, G.; Qi, H.; Zhang, Z. The cysteine-rich receptor-like kinase TaCRK3 contributes to defense against Rhizoctonia cerealis in wheat. J. Exp. Bot. 2021, 72, 6904–6919. [Google Scholar] [CrossRef]
- Sun, Z.; Zang, Y.; Zhou, L.; Song, Y.; Chen, D.; Zhang, Q.; Liu, C.; Yi, Y.; Zhu, B.; Fu, D.; et al. A tomato receptor-like cytoplasmic kinase, SlZRK1, acts as a negative regulator in wound-induced jasmonic acid accumulation and insect resistance. J. Exp. Bot. 2021, 72, 7285–7300. [Google Scholar] [CrossRef] [PubMed]
- Li, H.; Yang, Y.; Wang, H.; Liu, S.; Jia, F.; Su, Y.; He, F.; Feng, C.; Niu, M.; Wang, J.; et al. The receptor-like kinase ERECTA confers improved water use efficiency and drought tolerance to poplar via modulating stomatal density. Int. J. Mol. Sci. 2021, 22, 7245. [Google Scholar] [CrossRef] [PubMed]
- Mayer, A.M.; Staples, R.C. Laccase: New functions for an old enzyme. Phytochemistry 2002, 60, 551–565. [Google Scholar] [CrossRef]
- Ranocha, P.; Chabannes, M.; Chamayou, S.; Danoun, S.; Jauneau, A.; Boudet, A.M.; Goffner, D. Laccase down-regulation causes alterations in phenolic metabolism and cell wall structure in poplar. Plant Physiol. 2002, 129, 145–155. [Google Scholar] [CrossRef]
- Zhang, S.; Ju, C.; Wang, X. Arabidopsis laccase gene AtLAC4 regulates plant growth and responses to abiotic stress. Chin. Bull. Bot. 2012, 47, 357–365. [Google Scholar]
- McCaig, B.C.; Meagher, R.B.; Dean, J.F. Gene structure and molecular analysis of the laccase-like multicopper oxidase (LMCO) gene family in Arabidopsis thaliana. Planta 2005, 221, 619–636. [Google Scholar] [CrossRef]
- Liang, M.; Haroldsen, V.; Cai, X.; Wu, Y. Expression of a putative laccase gene, ZmLAC1, in maize primary roots under stress. Plant Cell Environ. 2006, 29, 746–753. [Google Scholar] [CrossRef]
- Hu, Q.; Min, L.; Yang, X.; Jin, S.; Zhang, L.; Li, Y.; Ma, Y.; Qi, X.; Li, D.; Liu, H.; et al. Laccase GhLac1 modulates broad-spectrum biotic stress tolerance via manipulating phenylpropanoid pathway and jasmonic acid synthesis. Plant Physiol. 2018, 176, 1808–1823. [Google Scholar] [CrossRef]
- Liu, Q.; Luo, L.; Wang, X.; Shen, Z.; Zheng, L. Comprehensive analysis of rice laccase gene (OsLAC) family and ectopic expression of OsLAC10 enhances tolerance to copper stress in Arabidopsis. Int. J. Mol. Sci. 2017, 18, 209. [Google Scholar] [CrossRef]
- Hossain, A.; Lee, Y.; Cho, J.I.; Ahn, C.H.; Lee, S.K.; Jeon, J.S.; Kang, K.; Lee, C.H.; An, G.; Park, P.B. The bZIP transcription factor OsABF1 is an ABA responsive element binding factor that enhances abiotic stress signaling in rice. Plant Mol. Biol. 2010, 72, 557–566. [Google Scholar] [CrossRef]
- Ling, H.; Fu, X.; Huang, N.; Zhong, Z.; Su, W.; Lin, W.; Cui, H.; Que, Y. A sugarcane smut fungus effector simulates the host endogenous elicitor peptide to suppress plant immunity. New Phytol. 2022, 233, 919–933. [Google Scholar] [CrossRef] [PubMed]
- Bedre, R.; Irigoyen, S.; Schaker, P.D.; Monteiro-Vitorello, C.B.; Da Silva, J.A.; Mandadi, K.K. Genome-wide alternative splicing landscapes modulated by biotrophic sugarcane smut pathogen. Sci. Rep. 2019, 9, 8876. [Google Scholar] [CrossRef] [PubMed]
- Huang, N.; Ling, H.; Su, Y.; Liu, F.; Xu, L.; Su, W.; Wu, Q.; Guo, J.; Gao, S.; Que, Y. Transcriptional analysis identifies major pathways as response components to Sporisorium scitamineum stress in sugarcane. Gene 2018, 678, 207–218. [Google Scholar] [CrossRef]
- McNeil, M.D.; Bhuiyan, S.A.; Berkman, P.J.; Croft, B.J.; Aitken, K.S. Analysis of the resistance mechanisms in sugarcane during Sporisorium scitamineum infection using RNA-seq and microscopy. PLoS ONE 2018, 13, e0197840. [Google Scholar] [CrossRef] [PubMed]
- Que, Y.; Su, Y.; Guo, J.; Wu, Q.; Xu, L. A global view of transcriptome dynamics during Sporisorium scitamineum challenge in sugarcane by RNA-Seq. PLoS ONE 2014, 9, e106476. [Google Scholar] [CrossRef]
- Schaker, P.D.; Palhares, A.C.; Taniguti, L.M.; Peters, L.P.; Creste, S.; Aitken, K.S.; Sluys, M.A.V.; Kitajima, J.P.K.; Vieira, M.L.C.; Monteiro-Vitorello, C.B. RNAseq transcriptional profiling following whip development in sugarcane smut disease. PLoS ONE 2016, 11, e0162237. [Google Scholar] [CrossRef]
- Wu, Q.; Xu, L.; Guo, J.; Su, Y.; Que, Y. Transcriptome profile analysis of sugarcane responses to Sporisorium scitaminea infection using Solexa sequencing technology. BioMed Res. Int. 2013, 2013, 298920. [Google Scholar]
- Peters, L.P.; Carvalho, G.; Vilhena, M.B.; Creste, S.; Azevedo, R.A.; Monteiro-Vitorello, C.B. Functional analysis of oxidative burst in sugarcane smut-resistant and-susceptible genotypes. Planta 2017, 245, 749–764. [Google Scholar] [CrossRef]
- Peters, L.P.; Teixeira-Silva, N.S.; Bini, A.P.; Silva, M.M.L.; Moraes, N.; Crestana, G.S.; Creste, S.; Azevedo, R.A.; Carvalho, G.; Monteiro-Vitorello, C.B. Differential responses of genes and enzymes associated with ROS protective responses in the sugarcane smut fungus. Fungal Biol. 2020, 124, 1039–1051. [Google Scholar] [CrossRef]
- Que, Y.; Xu, L.; Lin, J.; Ruan, M.; Zhang, M.; Chen, R. Differential protein expression in sugarcane during sugarcane-Sporisorium scitamineum interaction revealed by 2-DE and MALDI-TOF-TOF/MS. Comp. Funct. Genom. 2011, 2021, 989016. [Google Scholar]
- Song, X.; Huang, X.; Tian, D.; Yang, L.; Li, Y. Proteomic analysis of sugarcane seedling in response to Ustilago scitaminea infection. Life Sci. J. 2013, 10, 3026–3035. [Google Scholar]
- Su, Y.; Xu, L.; Wang, Z.; Peng, Q.; Yang, Y.; Chen, Y.; Que, Y. Comparative proteomics reveals that central metabolism changes are associated with resistance against Sporisorium scitamineum in sugarcane. BMC Genom. 2016, 17, 800. [Google Scholar] [CrossRef] [PubMed]
- Droux, M. Sulfur assimilation and the role of sulfur in plant metabolism: A survey. Photosynth. Res. 2004, 79, 331–348. [Google Scholar] [CrossRef] [PubMed]
- Howarth, J.R.; Parmar, S.; Barraclough, P.B.; Hawkesford, M.J. A sulphur deficiency-induced gene, sdi1, involved in the utilization of stored sulphate pools under sulphur-limiting conditions has potential as a diagnostic indicator of sulphur nutritional status. Plant Biotechnol. J. 2009, 7, 200–209. [Google Scholar] [CrossRef]
- Aarabi, F.; Kusajima, M.; Tohge, T.; Konishi, T.; Gigolashvili, T.; Takamune, M.; Sasazaki, Y.; Watanabe, M.; Nakashita, B.; Fernie, A.R.; et al. Sulfur deficiency–induced repressor proteins optimize glucosinolate biosynthesis in plants. Sci. Adv. 2016, 2, e1601087. [Google Scholar] [CrossRef] [PubMed]
- Garcia-Molina, A.; Altmann, M.; Alkofer, A.; Epple, P.M.; Dangl, J.L.; Falter-Braun, P. LSU network hubs integrate abiotic and biotic stress responses via interaction with the superoxide dismutase FSD2. J. Exp. Bot. 2017, 68, 1185–1197. [Google Scholar] [CrossRef]
- Fu, Y.; Tang, J.; Yao, G.F.; Huang, Z.Q.; Li, Y.H.; Han, Z.; Chen, X.Y.; Hu, L.Y.; Hu, K.D.; Zhang, H. Central role of adenosine 5′-phosphosulfate reductase in the control of plant hydrogen sulfide metabolism. Front. Plant Sci. 2018, 9, 1404. [Google Scholar] [CrossRef]
- Ding, Y.; Zhou, X.; Zuo, L.; Wang, H.; Yu, D. Identification and functional characterization of the sulfate transporter gene GmSULTR1; 2b in soybean. BMC Genom. 2016, 17, 1–19. [Google Scholar] [CrossRef]
- Purev, M.; Kim, Y.J.; Kim, M.K.; Pulla, R.K.; Yang, D.C. Isolation of a novel catalase (Cat1) gene from Panax ginseng and analysis of the response of this gene to various stresses. Plant Physiol. Bioch. 2010, 48, 451–460. [Google Scholar] [CrossRef] [PubMed]
- Mhamdi, A.; Queval, G.; Chaouch, S.; Vanderauwera, S.; Van Breusegem, F.; Noctor, G. Catalase function in plants: A focus on Arabidopsis mutants as stress-mimic models. J. Exp. Bot. 2010, 61, 4197–4220. [Google Scholar] [CrossRef]
- Sofo, A.; Scopa, A.; Nuzzaci, M.; Vitti, A. Ascorbate peroxidase and catalase activities and their genetic regulation in plants subjected to drought and salinity stresses. Int. J. Mol. Sci. 2015, 16, 13561–13578. [Google Scholar] [CrossRef] [PubMed]
- Su, Y.; Guo, J.; Ling, H.; Chen, S.; Wang, S.; Xu, L.; Allen, A.C.; Que, Y. Isolation of a novel peroxisomal catalase gene from sugarcane, which is responsive to biotic and abiotic stresses. PLoS ONE 2014, 9, e84426. [Google Scholar] [CrossRef] [PubMed]
- Sun, T.; Liu, F.; Wang, W.; Wang, L.; Wang, Z.; Li, J.; Que, Y.; Xu, L.; Su, Y. The role of sugarcane catalase gene ScCAT2 in the defense response to pathogen challenge and adversity stress. Int. J. Mol. Sci. 2018, 19, 2686. [Google Scholar] [CrossRef] [PubMed]
- Basantani, M.; Srivastava, A.; Sen, S. Elevated antioxidant response and induction of tau-class glutathione S-transferase after glyphosate treatment in Vigna radiata (L.) Wilczek. Pestic. Biochem. Phys. 2011, 99, 111–117. [Google Scholar] [CrossRef]
- Hayes, J.D.; Flanagan, J.U.; Jowsey, I.R. Glutathione transferases. Annu. Rev. Pharmacol. 2005, 45, 51–88. [Google Scholar] [CrossRef]
- Walters, D.; Walsh, D.; Newton, A.; Lyon, G. Induced resistance for plant disease control: Maximizing the efficacy of resistance elicitors. Phytopathology 2005, 95, 1368–1373. [Google Scholar] [CrossRef]
- Dong, N.Q.; Lin, H.X. Contribution of phenylpropanoid metabolism to plant development and plant–environment interactions. J. Integr. Plant Biol. 2021, 63, 180–209. [Google Scholar] [CrossRef]
- Wang, W.; Yu, S.; Cen, G.; Sun, T.; You, C.; Lou, W.; Chen, Y.; Yang, Y.; Su, Y. Mining, sequence analysis and expression of chalcone synthase genes in sugarcane. Mol. Plant Breed. 2020, 18, 7364–7375. [Google Scholar]
- Fellenberg, C.; van Ohlen, M.; Handrick, V.; Vogt, T. The role of CCoAOMT1 and COMT1 in Arabidopsis anthers. Planta 2012, 236, 51–61. [Google Scholar] [CrossRef]
- Yan, H.; Zhao, Y.; Shi, H.; Li, J.; Wang, Y.; Tang, D. BRASSINOSTEROID-SIGNALING KINASE1 phosphorylates MAPKKK5 to regulate immunity in Arabidopsis. Plant Physiol. 2018, 176, 2991–3002. [Google Scholar] [CrossRef]
- Chen, T.; Xiao, J.; Xu, J.; Wan, W.; Qin, B.; Cao, A.; Chen, W.; Xing, L.; Du, C.; Gao, X.; et al. Two members of TaRLK family confer powdery mildew resistance in common wheat. BMC Plant Biol. 2016, 16, 27. [Google Scholar] [CrossRef] [PubMed]
- Marcos, R.; Izquierdo, Y.; Vellosillo, T.; Kulasekaran, S.; Cascón, T.; Hamberg, M.; Castresana, C. 9-Lipoxygenase-derived oxylipins activate brassinosteroid signaling to promote cell wall-based defense and limit pathogen infection. Plant Physiol. 2015, 169, 2324–2334. [Google Scholar] [CrossRef] [PubMed]
- Bolger, A.M.; Lohse, M.; Usadel, B. Trimmomatic: A flexible trimmer for Illumina sequence data. Bioinformatics 2014, 30, 2114–2120. [Google Scholar] [CrossRef] [PubMed]
- Kim, D.; Langmead, B.; Salzberg, S.L. HISAT: A fast spliced aligner with low memory requirements. Nat. Methods 2015, 12, 357–360. [Google Scholar] [CrossRef] [PubMed]
- Pertea, M.; Pertea, G.M.; Antonescu, C.M.; Chang, T.C.; Mendell, J.T.; Salzberg, S.L. StringTie enables improved reconstruction of a transcriptome from RNA-seq reads. Nat. Biotechnol. 2015, 33, 290–295. [Google Scholar] [CrossRef]
- Love, M.I.; Huber, W.; Anders, S. Moderated estimation of fold change and dispersion for RNA-seq data with DESeq2. Genome Biol. 2014, 15, 550. [Google Scholar] [CrossRef]
- Young, M.D.; Wakefield, M.J.; Smyth, G.K.; Oshlack, A. Gene ontology analysis for RNAseq: Accounting for selection bias. Genome Biol. 2010, 11, R14. [Google Scholar] [CrossRef]
- Conesa, A.; Götz, S.; García-Gómez, J.M.; Terol, J.; Talón, M.; Robles, M. Blast2GO: A universal tool for annotation, visualization and analysis in functional genomics research. Bioinformatics 2005, 21, 3674–3676. [Google Scholar] [CrossRef]
- Kanehisa, M.; Araki, M.; Goto, S.; Masahiro, H.; Hirakawa, M.; Itoh, M.; Katayama, T.; Kawashima, S.; Okuda, S.; Tokimatsu, T.; et al. KEGG for linking genomes to life and the environment. Nucleic Acids Res. 2008, 36, D480–D484. [Google Scholar] [CrossRef]
- Anees, M.; Gao, L.; Umer, M.J.; Yuan, P.; Zhu, H.; Lu, X.; He, N.; Gong, C.; Kaseb, M.O.; Zhao, S.; et al. Identification of key gene networks associated with cell wall components leading to flesh firmness in watermelon. Front. Plant Sci. 2021, 12, 1164. [Google Scholar] [CrossRef]
- Shannon, P.; Markiel, A.; Ozier, O.; Baliga, N.S.; Wang, J.T.; Ramage, D.; Amin, N.; Schwikowski, B.; Ideker, T. Cytoscape: A software environment for integrated models of biomolecular interaction networks. Genome Res. 2003, 13, 2498–2504. [Google Scholar] [CrossRef] [PubMed]
- Iskandar, H.M.; Simpson, R.S.; Casu, R.E.; Bonnett, G.D.; Maclean, D.J.; Manners, J.M. Comparison of reference genes for quantitative real-time polymerase chain reaction analysis of gene expression in sugarcane. Plant Mol. Biol. Rep. 2004, 22, 325–337. [Google Scholar] [CrossRef]
- Kariyanna, B.; Prabhuraj, A.; Asokan, R.; Babu, P.; Jalali, S.K.; Venkatesan, T.; Gracy, R.G.; Mohan, M. Identification of suitable reference genes for normalization of RT-qPCR data in eggplant fruit and shoot borer (Leucinodes orbonalis Guenée). Biologia 2020, 75, 289–297. [Google Scholar] [CrossRef]
- Livak, K.J.; Schmittgen, T.D. Analysis of relative gene expression data using real-time quantitative PCR and the 2−ΔΔCT method. Methods 2001, 25, 402–408. [Google Scholar] [CrossRef]
Publisher’s Note: MDPI stays neutral with regard to jurisdictional claims in published maps and institutional affiliations. |
© 2022 by the authors. Licensee MDPI, Basel, Switzerland. This article is an open access article distributed under the terms and conditions of the Creative Commons Attribution (CC BY) license (https://creativecommons.org/licenses/by/4.0/).