Article

Genome-Wide Analysis of Calmodulin Binding Transcription Activator (CAMTA) Gene Family in Peach (Prunus persica L. Batsch) and Ectopic Expression of PpCAMTA1 in Arabidopsis camta2,3 Mutant Restore Plant Development

1
Laboratory of Fruit Quality Biology/Zhejiang Provincial Key Laboratory of Horticultural Plant Integrative Biology, Zhejiang University, Hangzhou 310058, China
2
Institute of Crop Breeding & Cultivation Research, Shanghai Academy of Agricultural Sciences, Shanghai 201403, China
3
Shandong (Linyi) Institute of Modern Agriculture, Zhejiang University, Linyi 276000, China
*
Authors to whom correspondence should be addressed.
Int. J. Mol. Sci. 2022, 23(18), 10500; https://doi.org/10.3390/ijms231810500
Submission received: 10 June 2022 / Revised: 22 August 2022 / Accepted: 7 September 2022 / Published: 10 September 2022

Abstract

:
Calmodulin-binding transcription activator (CAMTA) is a transcription factor family containing calmodulin (CaM) binding sites and is involved in plant development. Although CAMTAs in Arabidopsis have been extensively investigated, the functions of CAMTAs remain largely unclear in peaches. In this study, we identified five peach CAMTAs which contained conserved CG-1 box, ANK repeats, CaM binding domain (CaMBD) and IQ motifs. Overexpression in tobacco showed that PpCAMTA1/2/3 were located in the nucleus, while PpCAMTA4 and PpCAMTA5 were located in the plasma membrane. Increased expression levels were observed for PpCAMTA1 and PpCAMTA3 during peach fruit ripening. Expression of PpCAMTA1 was induced by cold treatment and was inhibited by ultraviolet B irradiation (UV-B). Driven by AtCAMTA3 promoter, PpCAMTA1/2/3 were overexpressed in Arabidopsis mutant. Here, we characterized peach PpCAMTA1, representing an ortholog of AtCAMTA3. PpCAMTA1 expression in Arabidopsis complements the developmental deficiencies of the camta2,3 mutant, and restored the plant size to the wild type level. Moreover, overexpressing PpCAMTA1 in camta2,3 mutant inhibited salicylic acid (SA) biosynthesis and expression of SA-related genes, resulting in a susceptibility phenotype to Pst DC3000. Taken together, our results provide new insights for CAMTAs in peach fruit and indicate that PpCAMTA1 is associated with response to stresses during development.

1. Introduction

Calcium ion (Ca2+), as a best characterized second messenger, is involved in diverse physiological processes in plants [1]. For fruit, the complex relationship between calcium, water, cell walls and signaling pathways make calcium an essential player in fruit physiology and development [2]. Calmodulin (CaM) is the important Ca2+ receptor [3], the expression of CaMs in papaya fruit showed responses to temperature stresses and during fruit development [4]. CaM-binding transcription activator (CAMTA), also named as signal responsive (SR), receives the unambiguous alerts of calcium influxes by CaMs, which is considered to be the largest and best characterized CaM-binding TF family for Ca2+ signaling in plants [5]. Tobacco ethylene response gene (NtER1) is the earliest CAMTA gene identified in plants [6]. Later, at least 465 CAMTA genes were identified from 112 plants [7]. Plant CAMTA proteins have several conserved functional domains, including a DNA-binding domain (CG-1), a transcription-associated immunoglobulin domain (TIG), ankyrin repeat domain (ANK), a calmodulin-binding domain (CaMBD) and several IQ motifs [8]. The CaMBD is a characteristic of plant CAMTAs, required for CaM binding and formed amphipathic α-helix structure [9,10]. Approximately one-quarter of plant CAMTA genes belonged to non-TIG type based on the absence of the TIG domain [7,11].
Arabidopsis thaliana has six CAMTA proteins [9], whose biological roles have been determined using loss-of-function mutants. AtCAMTA3 loss-of-function (camta3) mutants exhibit stunted growth and constitutive activation of immune responses [12,13]. These autoimmune phenotypes are more obvious in camta2,3 double mutants and extreme in camta1,2,3 triple mutants [14,15], suggesting AtCAMTA1, AtCAMTA2 and AtCAMTA3 are redundant negative regulators of plant immunity. In plants grown at warm temperature, AtCAMTA1, AtCAMTA2 and AtCAMTA3 repress the expression level of salicylic acid (SA) immunity pathway genes in an additive manner [14]. These genes include ICS1 (isochorismate synthase 1, encoding the primary rate-limiting enzyme in SA biosynthesis in Arabidopsis) [16], and four genes encoding positive regulators of ICS1: CBP60g (calmodulin binding protein 60-like.g), SARD1 (SAR deficient 1), EDS1 (enhanced disease susceptibility 1) and PAD4 (phytoalexin deficient 4) [17]. The transcript levels of these genes are much higher in camta3, camta2,3 and camta1,2,3 mutants, resulting in higher SA content and the induction of PR1 (pathogenesis related 1, a marker gene for SA-mediated immune response) [12,14]. AtCAMTA1/2/3 also repress the biosynthesis of pipecolic acid (Pip) and N-hydroxypipecolic acid (NHP) in healthy plants, coordinated with SA pathway to optimize plant immune response [17,18]. In terms of abiotic stress response, CAMTA1 and CAMTA2 work in concert with CAMTA3 at low temperatures to induce the transcript levels of CBF1, CBF2 and CBF3 [14], CAMTA3 and CAMTA5 respond to a rapid decrease in temperature and increase the DREB1s expression [19]. The camta1 mutant showed drought sensitivity [20] and hyper-responsive to auxin [21]. The camta6 mutants displayed reduced sensitivity to salt and ABA during germination [22].
Apart from Arabidopsis, there are growing evidence that CAMTAs are key players in plant development and stimuli responses in other plants [5,23,24]. For example, virus-induced gene silencing (VIGS)-based knockdown of SlSRs in tomato showed that SlSR1 and SlSR3L negatively regulate disease resistance response and SlSR1L positively modulates drought stress tolerance [25]. For horticultural crops, genome-wide analysis of CAMTA genes has been reported in several species, including tomato [10], grape [26], strawberry [27], citrus [28], banana [29] and durian [30]. At present, the functions of CAMTAs in fruit are mainly based on gene expression pattern analysis. For example, the distinct ripening-associated expression pattern of CAMTA genes in tomato and durian indicated their possible roles in fruit ripening [10,30]. Despite great progress being made in the analysis of CAMTAs gene family, our understanding of functions for fruit CAMTAs remains largely incomplete.
The peach (Prunus persica L. Batsch) is not only a popular economic crop in the world, but also a model plant for Rosaceae [31]. Peach fruit are highly susceptible to low temperature [32], pathogenic infection and physiological deterioration during ripening and storage [33]. CAMTA gene family may be a crossover point where calcium signaling intersects the ethylene, salicylic acid, immunity and cold signal transduction pathways, all of these signaling pathways have a major impact on fruit ripening and quality [2]. To date, studies investigating the CAMTA gene family in peaches are still lacking. Here, the hypothesis is that peaches contain multiple CAMTA genes and there should be one gene member represents an ortholog of Arabidopsis AtCAMTA3 which is involved in developmental process.
In order to study the expression patterns and to characterize the potential functions of peach CAMTAs, bioinformatics methods were used to analyze the gene structure and chromosomal distribution, RNA-sequencing (RNA-seq) and quantitative reverse-transcription PCR (RT-qPCR) were applied to investigate stress-induced and spatiotemporal expression pattern of CAMTAs. We also demonstrate the plasma membrane localization of two peach CAMTAs instead of in the nucleus. Moreover, we carried out the ectopic expression of the peach CAMTAs under the control of the native AtCAMTA3 promoter in camta2,3 mutant. Our result showed that overexpression of PpCAMTA1 complements the developmental defects of camta2,3 mutant.

2. Results

2.1. Genome-Wide Identification and Protein Properties Analysis of CAMTAs in Peach

Five CAMTA members were identified in the peach genome database using BLASTP program with six Arabidopsis CAMTA protein sequences as queries. Same number of CAMTAs was also identified in various genome assemblies of different peach varieties (Table S1). In this study, the CDS sequences of these five genes were cloned and sequenced, then used for subsequent analysis. The information for the peach CAMTAs gene ID, protein length, molecular weight (MW), isoelectric point (pI) and grand average of hydropathicity (GRAVY values) were listed in Table 1. The peach CAMTA proteins varied in length from 914 to 1131 amino acids (aa), which resulted in variations in MW. The pI values of five CAMTAs range from 5.58 to 6.69, and the instability index (II) varies between 39.54 and 44.84. These proteins were considered as hydrophilic with the negative GRAVY values (Table 1).
Next, we extend the information of CAMTA genes to other Rosaceae species. The results showed that fruit crops from Prunus species (sweet cherry, almond and apricot) have similar CAMTAs number with peaches, which were 5, 5 and 4, respectively (Table 2 and Table S2). The number of CAMTA genes of strawberry from Rosaceae family is 16, which is more than three times than that of peach (Table 2 and Table S2). Here, we identified a total of 53 CAMTAs from Rosaceae family fruit crops, including strawberry, pear, apple, sweet berry, almond, apricot and peach.

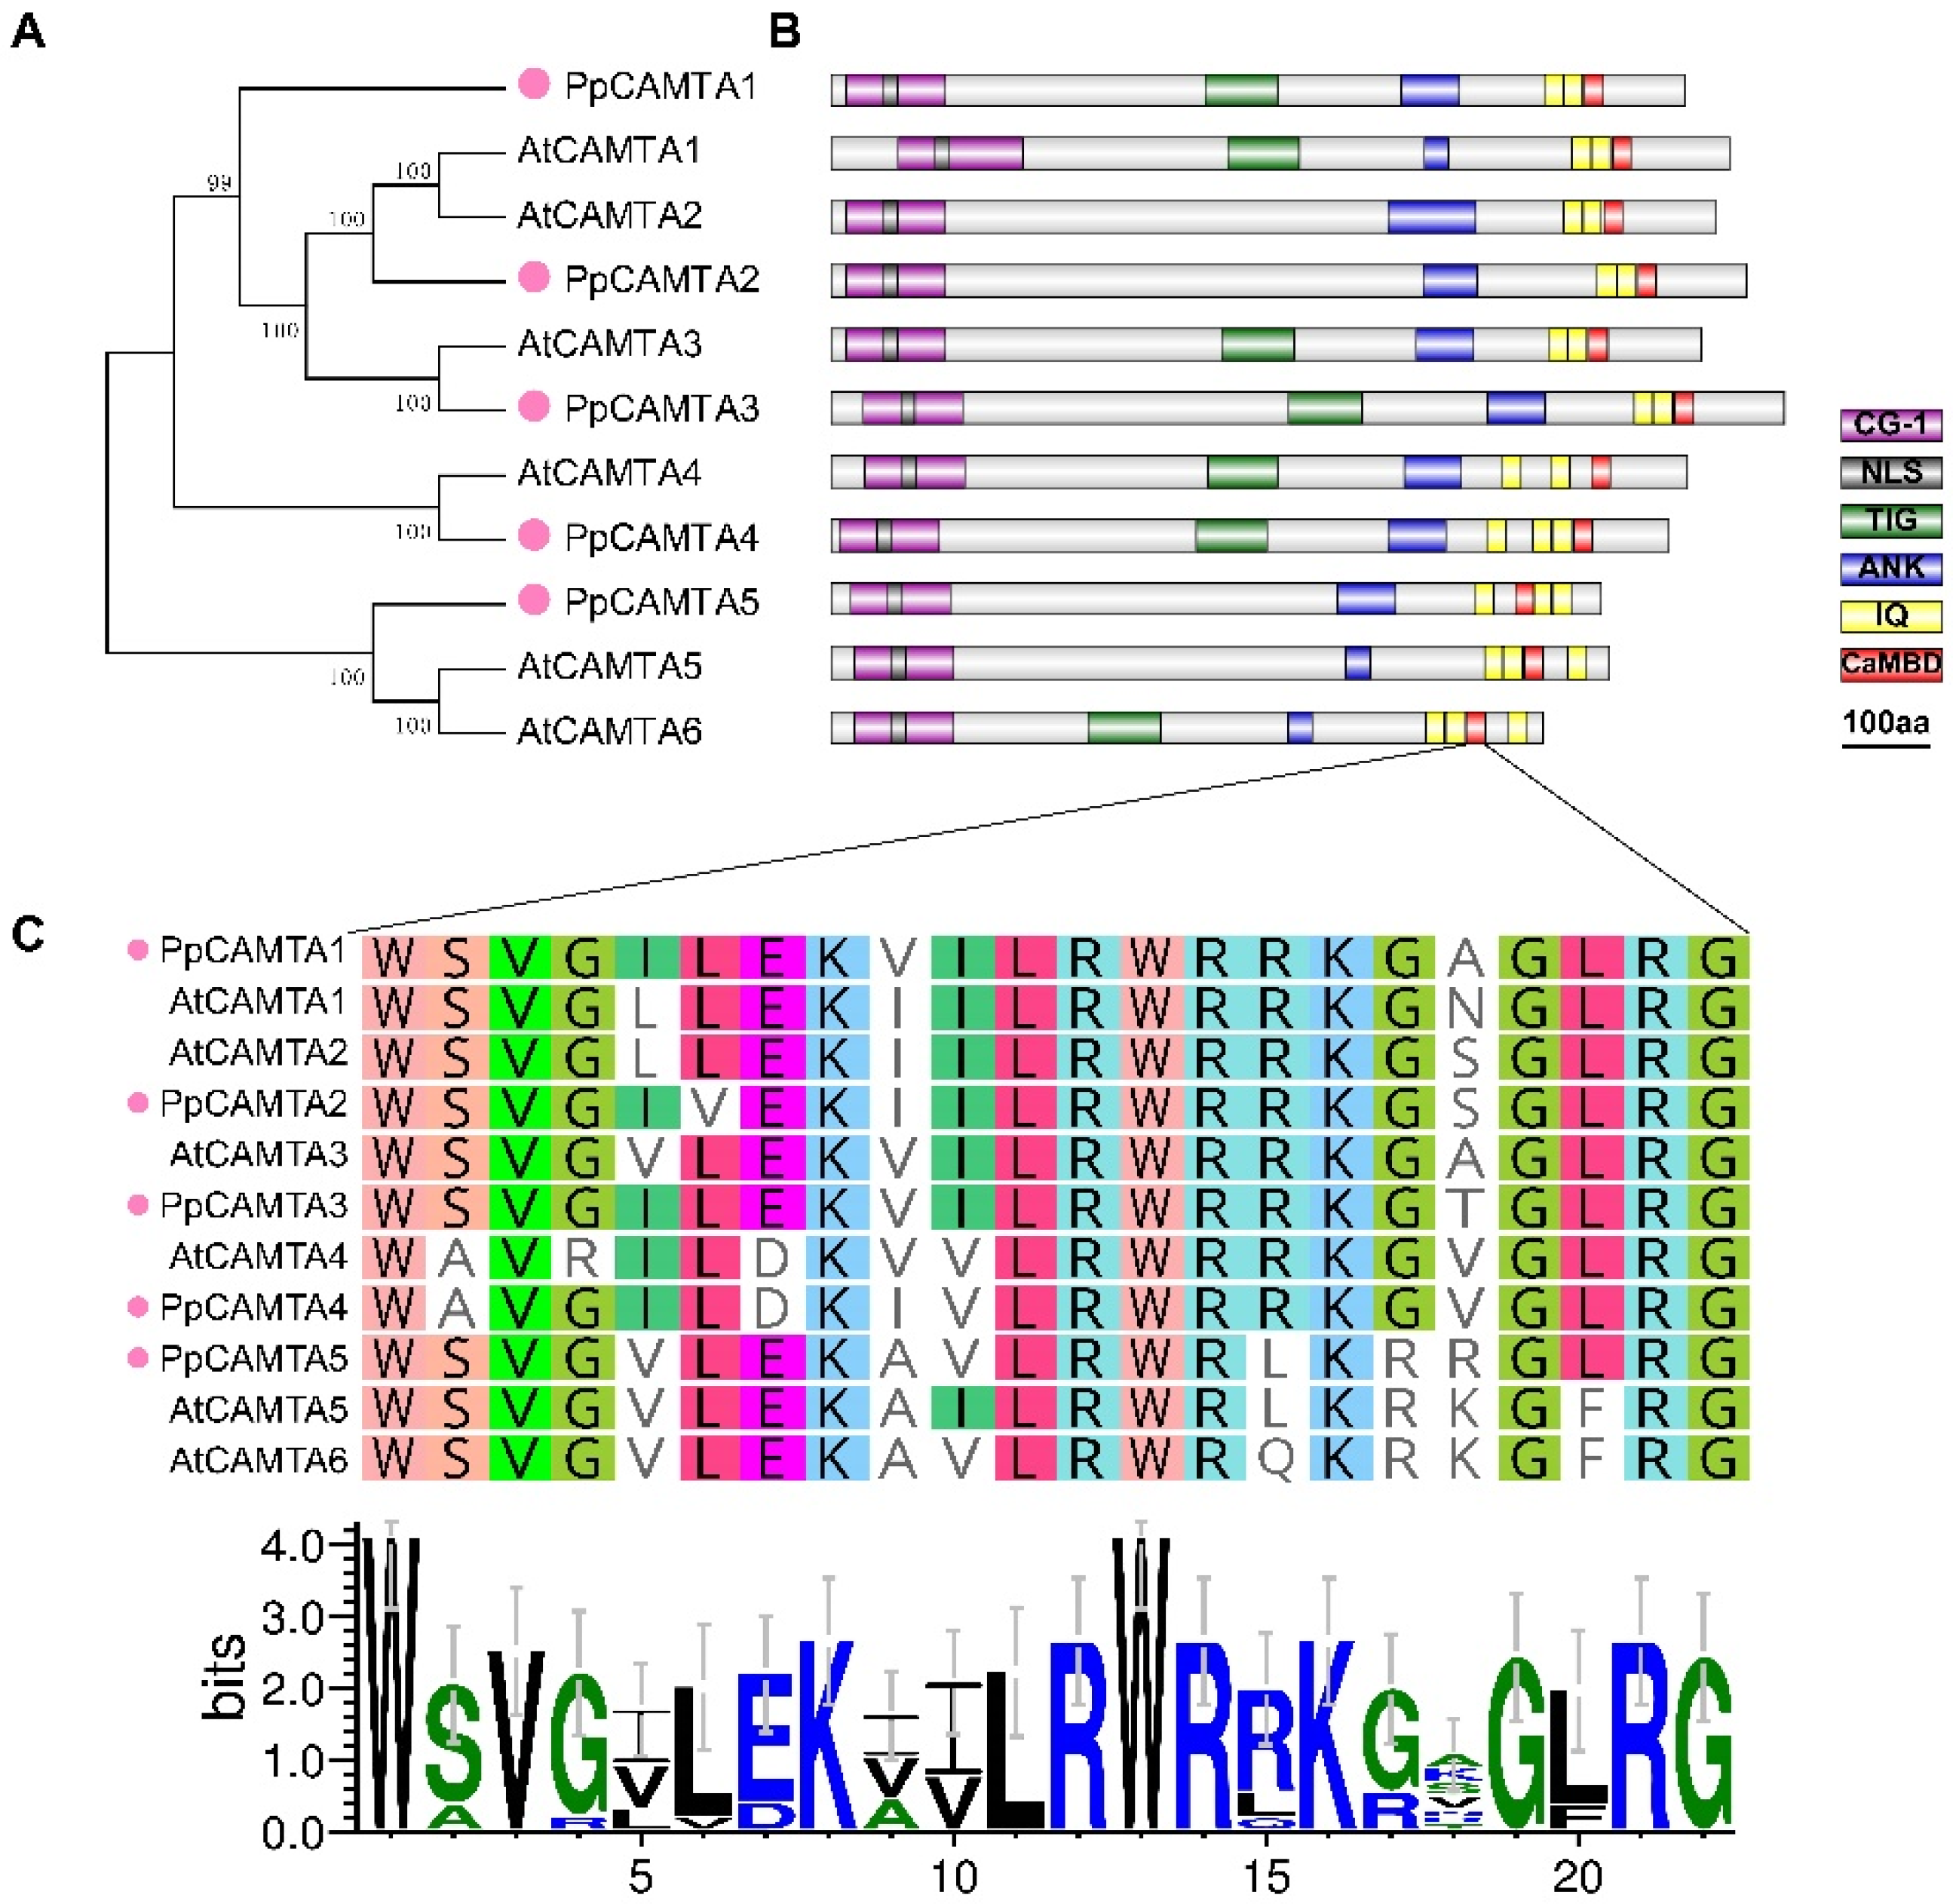
2.2. Phylogenetic, Conserved Domain and Motifs Analysis of CAMTA Genes in Peach

The phylogenetic tree was constructed to investigate the evolutionary relationship among Arabidopsis CAMTAs and peach CAMTAs (Figure 1A). Based on the phylogenetic tree, CAMTAs were divided into three groups. PpCAMTA1, PpCAMTA2 and PpCAMTA3 were distributed in a same clade with AtCAMTA1 to AtCAMTA3. PpCAMTA4 showed high sequence similarity with AtCAMTA4, while PpCAMTA5 was grouped with AtCAMTA5 and AtCAMTA6. Furthermore, the conserved domains of the peach CAMTA proteins were visualized (Figure 1B). Analysis of protein structures showed that they contained the essential conserved domains, including CG-1 box, ANK repeats domain, CaM binding domain (CaMBD) and IQ motifs. PpCAMTA2 and PpCAMTA5 were found to contain no TIG domain and were grouped into non-TIG type. The CaMBD amino acids of peach CAMTAs have high sequence similarity with their homologs in Arabidopsis (Figure 1C). The greatest similarity of the sequences was found between PpCAMTA4 and AtCAMTA4 with only two amino acids difference. The sequence logo for CaMBD in these CAMTAs was shown below the alignment (Figure 1C).
To further examine the structural features of peach CAMTAs, the conserved motifs were analyzed using the online server, MEME Suite. A total of 13 motifs were found in peach CAMTAs (Figure S1). Among them, 11 motifs existed in all peach CAMTAs, and some motifs corresponded to protein conserved domains. For example, motifs 1, 5 and 10 were linked to the conserved CG-1 domain, motif 2 and 13 partly overlapped with IQ domain and CaMBD domain. Conserved domains and motifs indicated the conservatism of these identified peach CAMTA family members.

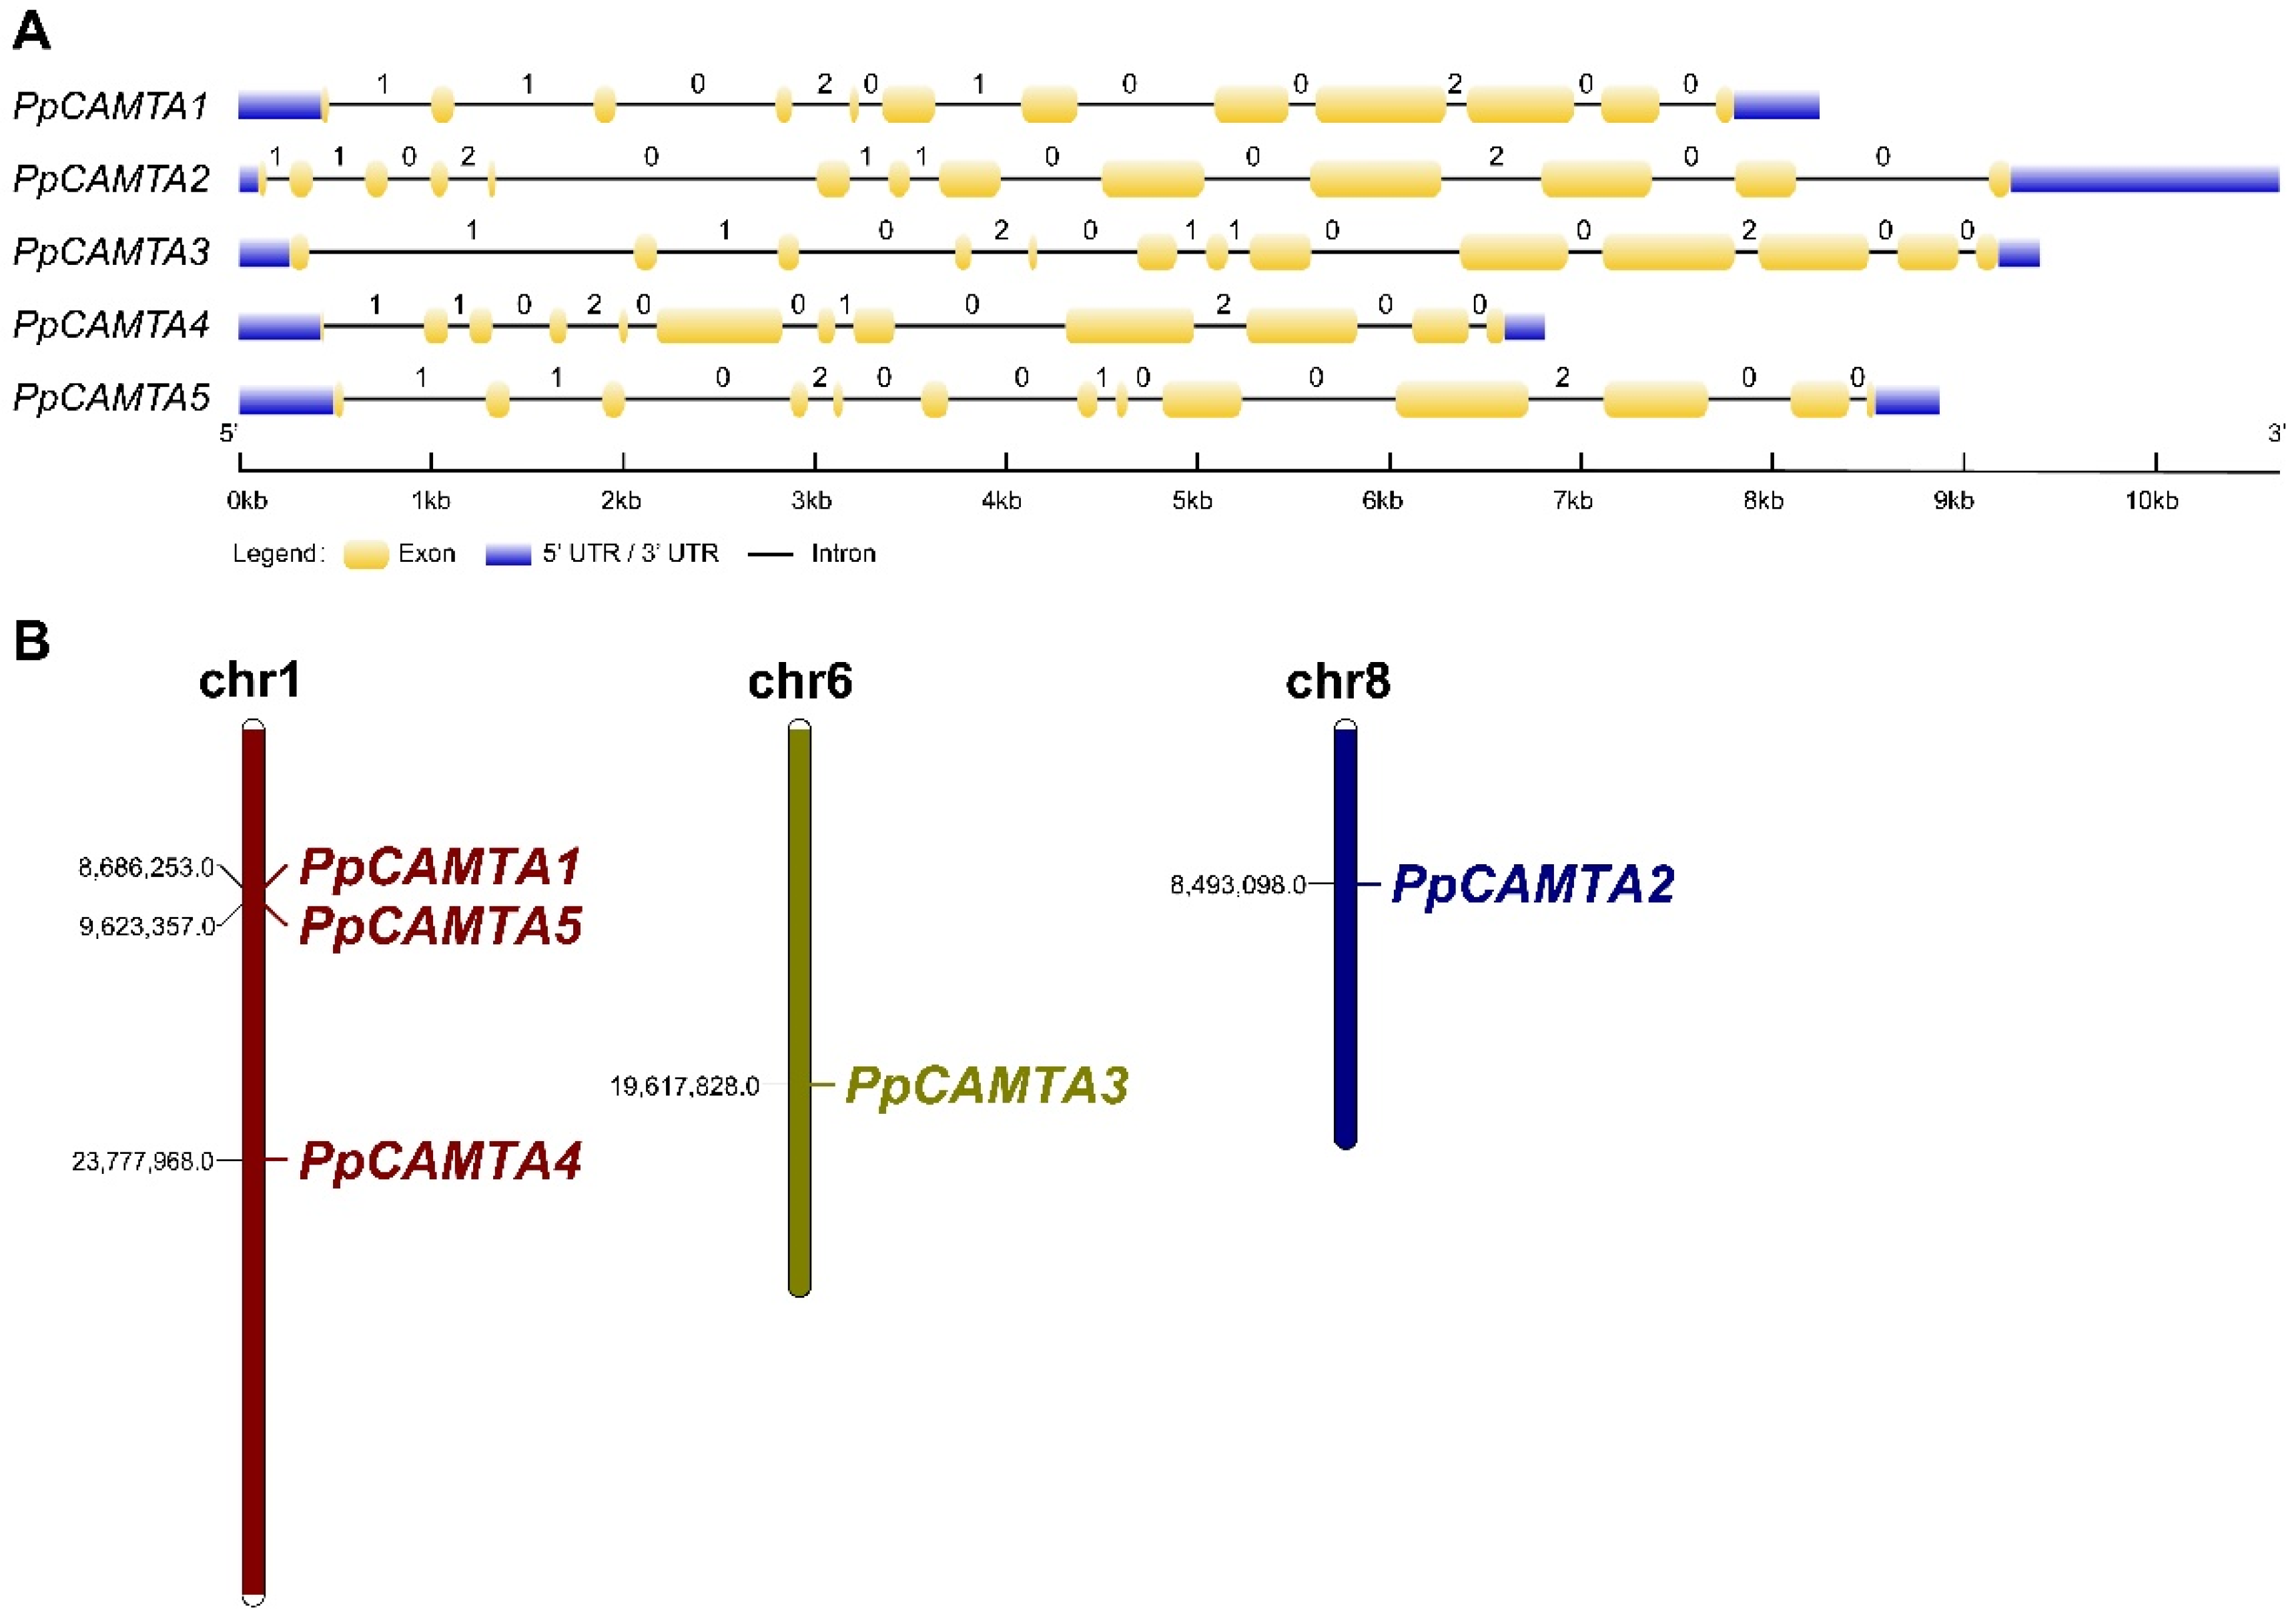
2.3. Exon-Intron Structure Analysis and Chromosomal Locations of Peach CAMTAs

To get gene structure information of peach CAMTAs, the intron-exon structures were analyzed. As shown in Figure 2A, PpCAMTA2, PpCAMTA3 and PpCAMTA5 had 12 introns, while PpCAMTA1 and PpCAMTA4 contained 11 introns. Different numbers of introns were consistent with that of most plant species (10 to 13 introns) [7]. For the intron phases of five peach CAMTA genes, an intron phase pattern of ‘1102-0110-0200′ was observed in PpCAMTA2 and PpCAMTA3, fitting with one of the most common distribution modes across plant CAMTA genes. However, PpCAMTA1, PpCAMTA4 and PpCAMTA5 showed different patterns with ‘1102-010-0200’, ‘1102-001-0200’ and ‘1102-0010-0200’, respectively. Similar to previous studies [7], our results showed that the lengths of the exons corresponding to intron phase pattern ‘0200’ were significantly longer than those corresponding to intron phase pattern ‘1102’. Chromosomal locations of peach CAMTA genes revealed that the genes were unevenly distributed on three chromosomes (Figure 2B). Most CAMTA members (PpCAMTA1, 4 and 5) were located on chromosome 1, PpCAMTA3 on chromosome 6, PpCAMTA2 on chromosome 8.

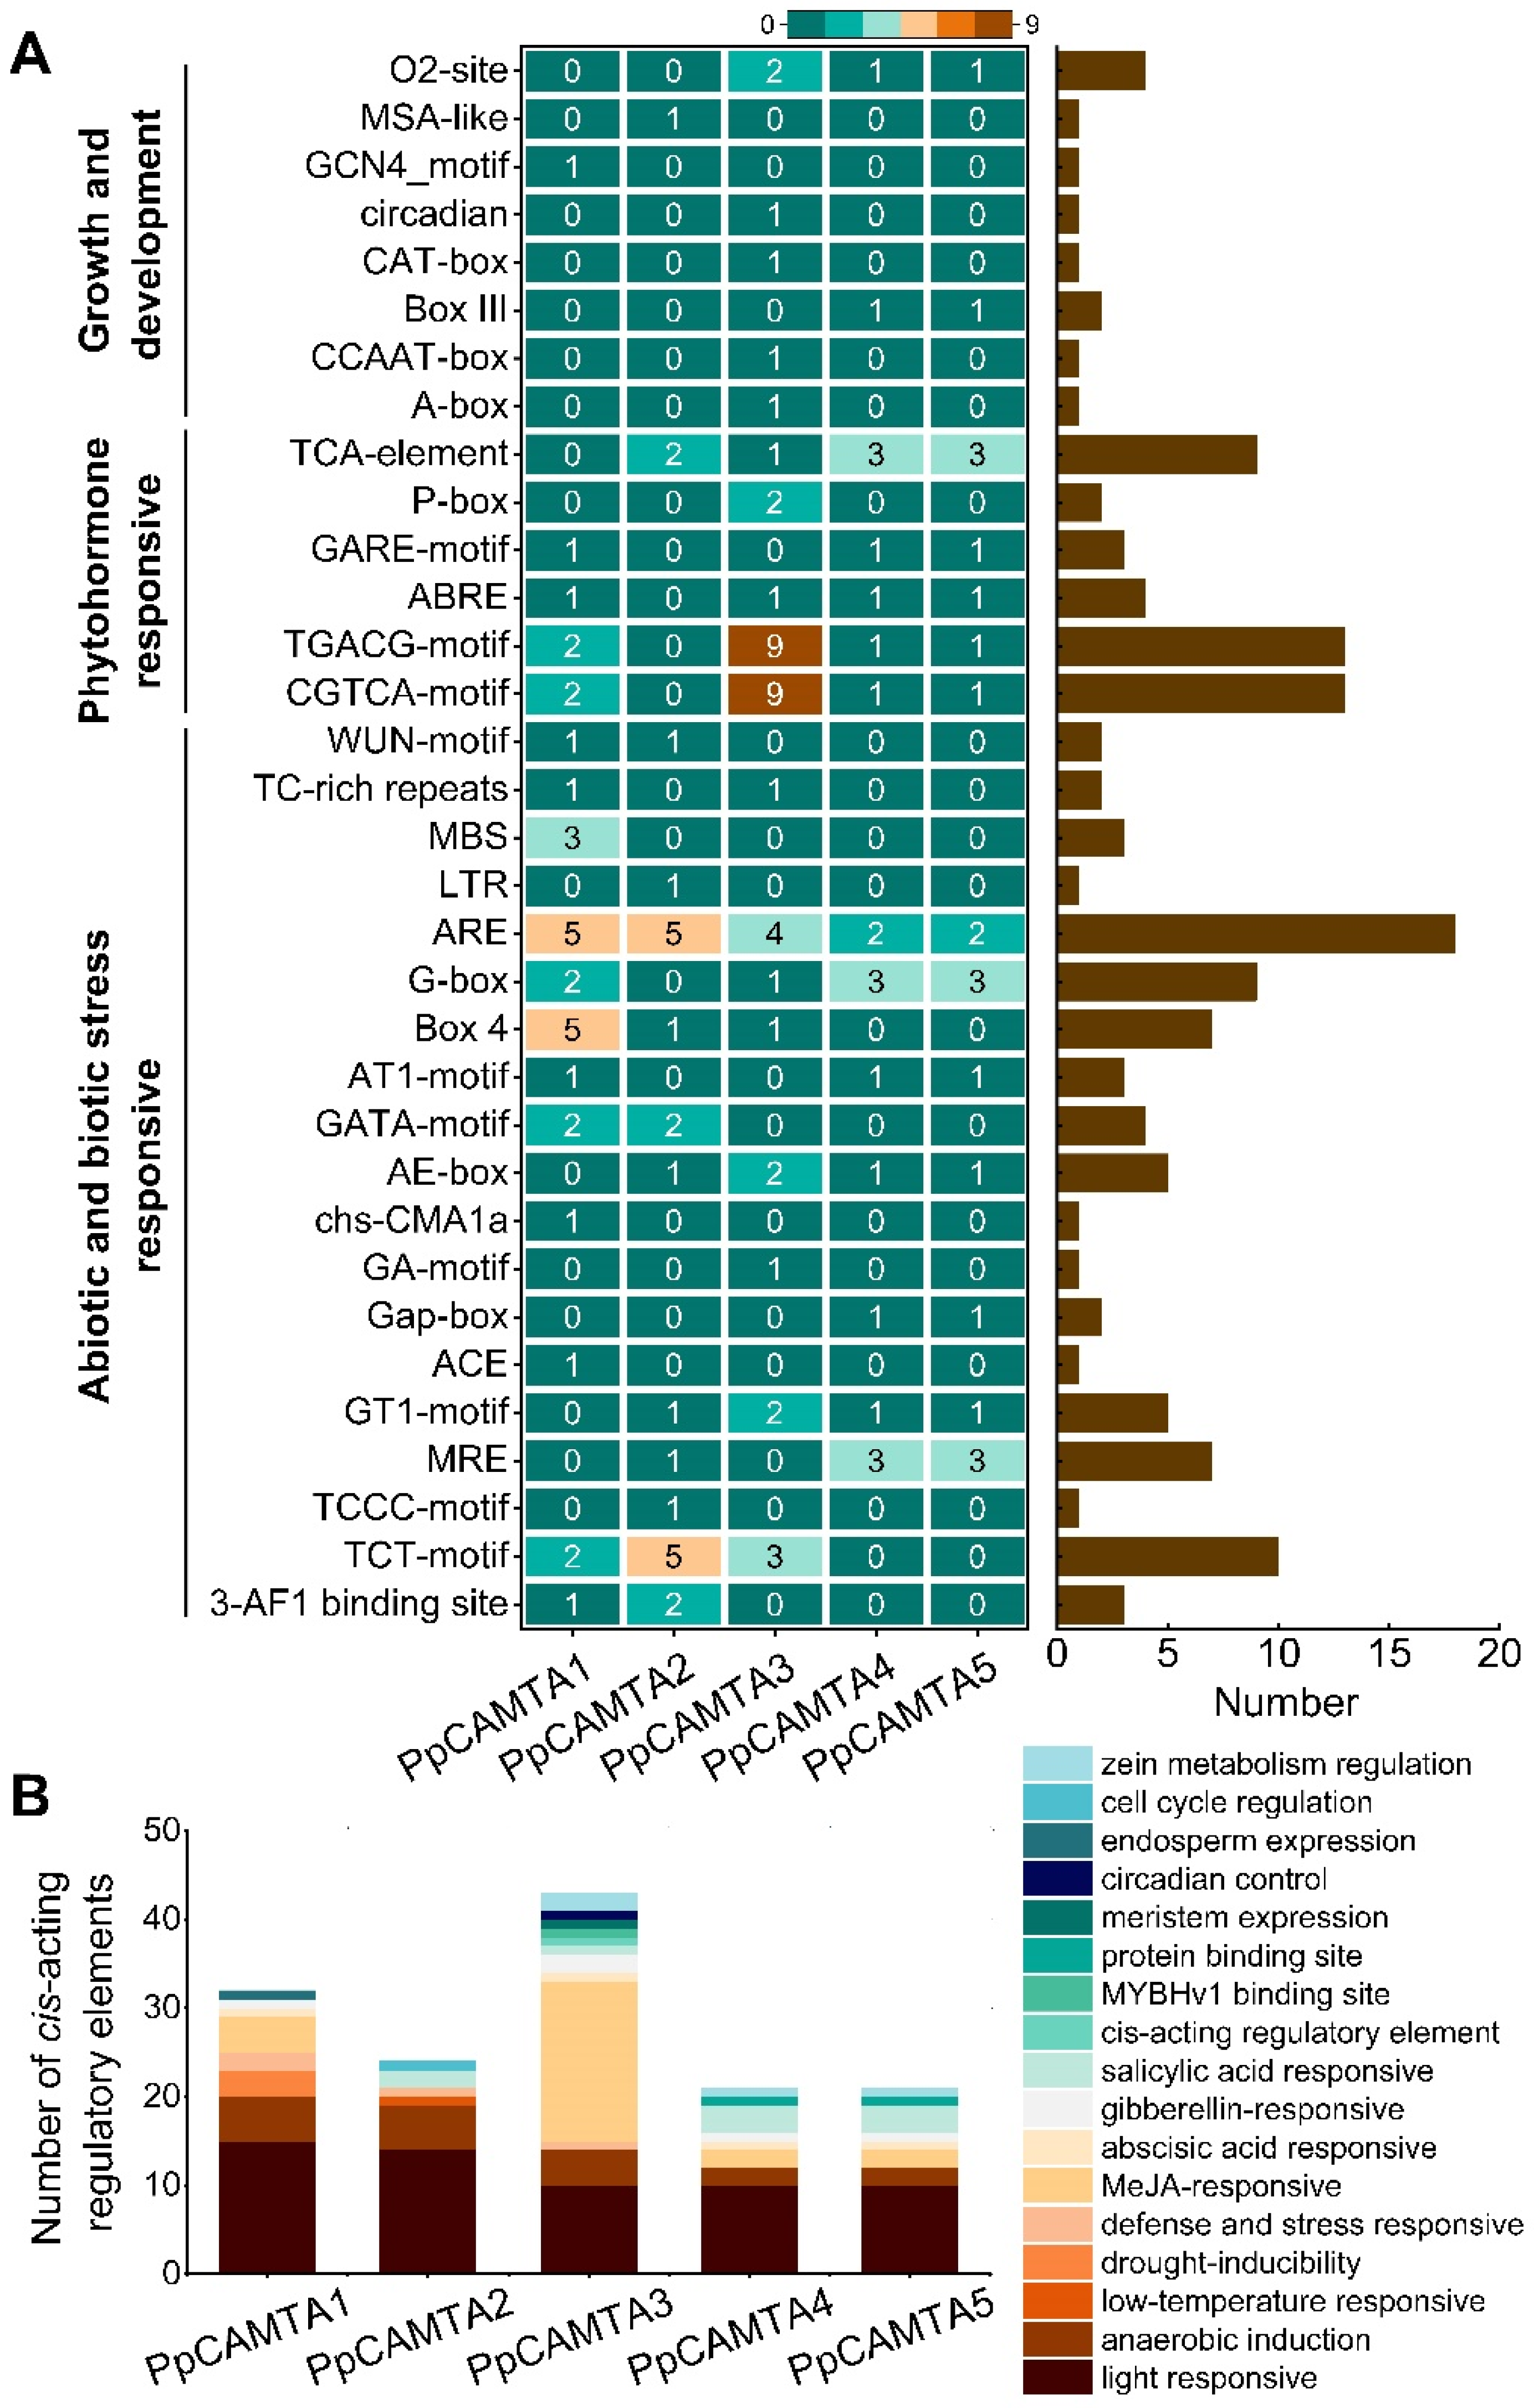
2.4. Promoter Cis-Acting Regulatory Elements of Peach CAMTA Genes

Cis-acting regulatory elements are specific motifs existing in the gene promoter regions, serve as binding sites for TFs to regulate gene transcription [34]. To gain more information about the response of peach CAMTA genes to stress and hormonal signals, cis-acting regulatory elements within 2000 bp upstream promoter region of peach CAMTA genes were predicted using the PlantCARE database. According to the annotations, we divided the predicted regulatory motifs into three categories: “growth and development”, “phytohormone responsive” and “abiotic and biotic responsive”. The promoters of peach CAMTA genes contained abundant stress-related and hormone-related regulatory motifs (Figure 3A). For instance, PpCAMTA1 had TC-rich repeat and WUN-motif which respond to defense and stress.
The promoter regions of all peach CAMTA genes contained a large number of ‘light responsive’ motifs with 59 totally, including G-box, TCT motif, Box4, etc. Except for AtCAMTA3, the other four gene promoters had more than 50% regulatory motifs responding to light. Besides, the motifs involved in phytohormone responses were found in these promoters, including ABRE (abscisic acid-responsive elements), CGTCA-motif and TGACG-motif (methyl jasmonate-responsive elements), TCA-motif (salicylic acid-responsive elements) and P-box (gibberellin-responsive element) (Figure 3A). Especially for the PpCAMTA3 promoter, the maximum number of ‘methyl jasmonate (MeJA) responsive’ motifs was found with 18. In addition, regulatory motifs that were critical for plant growth and development response were discovered in the promoters of peach CAMTA genes. Among these five peach CAMTAs, the promoter of PpCAMTA3 has the largest number of regulatory motifs with 43, followed by PpCAMTA1 and PpCAMTA2 with 32 and 24, respectively (Figure 3B).

2.5. Expression of CAMTAs in Response to Cold, UV-B and MeJA Treatment in Peach Fruit

To explore the functional relevance of peach CAMTA genes, we next examined the expression patterns of CAMTAs under various treatments based on RNA-seq data. PpCAMTA1 was significantly induced by low temperature (Figure 4A), the transcript level started increasing after 1-day cold treatment and kept rising until 28 days, about 2-fold higher than that of the initial point. On the contrary, the transcript levels of PpCAMTA2 and PpCAMTA5 were inhibited by low temperature (inhibited by 29 % and 67 % after 28 days, respectively). The expression of PpCAMTA3 and PpCAMTA4 were induced by low temperature and peaked at 1 d followed by a decline during cold storage.
Transcript levels of PpCAMTA1 in UV-B treated group were reduced by approximately 50% relative to those of the control (Figure 4B). PpCAMTA2 and PpCAMTA5 were suppressed slightly by UV-B. In contrast, transcript level of PpCAMTA4 in UV-B treated peach fruit was approximately 2-fold higher than that of control at 6 h, and decreased to the control level at 48 h. With regard to MeJA treatment, PpCAMTA3 expression was inhibited by 20% at 1 d (Figure 4C). This was consistent with the rich MeJA-responsive motifs in PpCAMTA3 promoter (Figure 3). PpCAMTA4 and PpCAMTA5 were slightly induced after being treated by MeJA for 3 days. Transcript levels of PpCAMTA1 and PpCAMTA2 remained unchanged after MeJA treatment (Figure 4C).
To confirm expression patterns of peach CAMTAs to various treatments, RT-qPCR analysis was performed. In agreement with RNA-seq results (Figure 4B), induced transcript levels of PpCAMTA4 by UV-B were observed at 6 h as well (Figure S2A). UV-B treatment significantly reduced transcript levels of PpCAMTA1 at both 6 h and 48 h (Figure 4B and Figure S2A). Regarding to MeJA treatment, transcript level of PpCAMTA3 was reduced significantly at 1 d (Figure S2B), in agreement with RNA-seq results (Figure 4C). Significant induction of PpCAMTA4 expression was detected at 3 d after MeJA treatment for both RNA-seq and RT-qPCR (Figure 4C and Figure S2B). Overall, similar gene expression patterns were observed between RT-qPCR and RNA-seq. Our results indicated that peach fruit CAMTAs responded to various stimuli in a different manner.

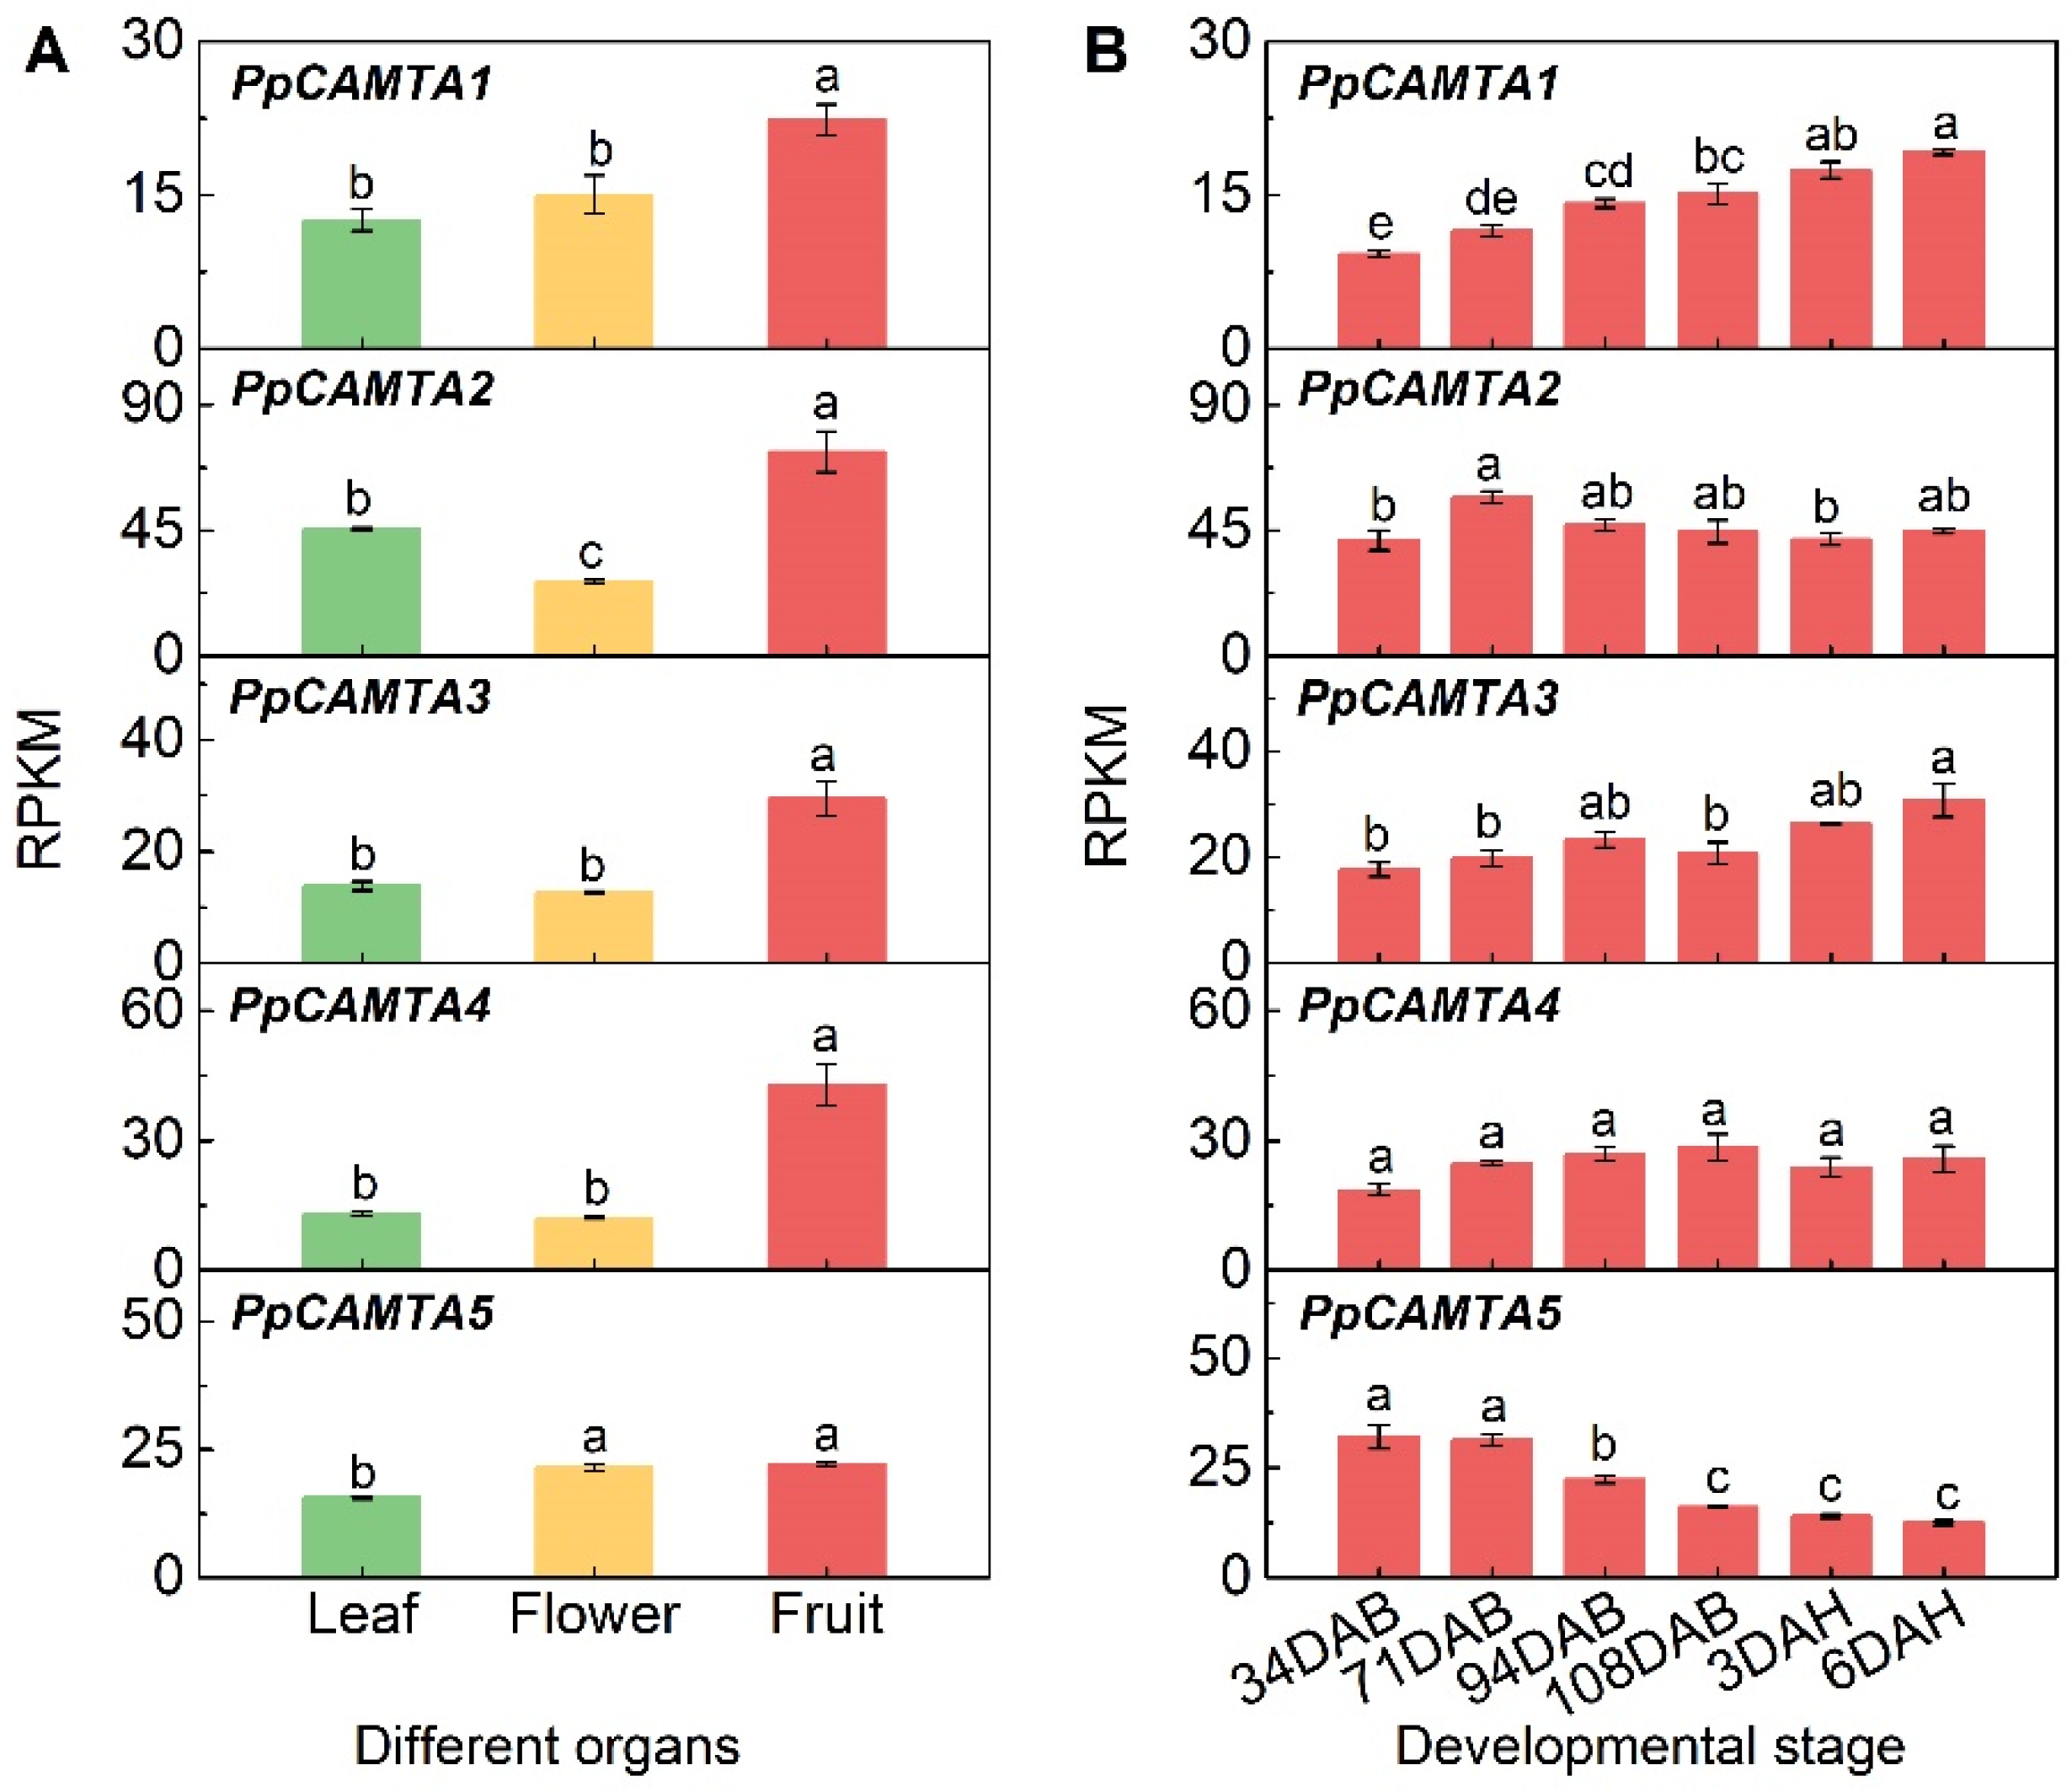
2.6. Expression of CAMTAs in Different Organs and During Fruit Development

To investigate the spatial and temporal expression patterns of peach CAMTA genes, their transcript levels in leaf, flower and fruit at different developmental stages were analyzed using RNA-seq. All peach CAMTA genes showed the highest transcript levels in ripening peach fruit comparing to leaf and flower (Figure 5A). Notably, the transcript level of PpCAMTA4 in ripe fruit was 3.3 and 3.5-fold of that in leaf and flower, respectively. The expression of PpCAMTA5 in flowers remained at the similar level as in ripe fruit. At the fruit development stages, PpCAMTA1 was constantly accumulated with fruit ripening, peaked at 6 DAH when transcript level was about 2-fold higher than that at 34 DAB (Figure 5B). A similar pattern was observed for PpCAMTA3. The transcript level of PpCAMTA2 increased slightly and reached the maximum at 71 DAB. The sustained decline was found in the transcript level of PpCAMTA5, which was inhibited by approximately 60% at 6 DAH compared with that at 34 DAB. Transcript levels of PpCAMTA4 did not appear to be affected by fruit development. Taken together, peach CAMTAs exhibited fruit-specific and ripening-associated expression patterns, PpCAMTA1 and PpCAMTA3 were enriched in ripe fruit, suggesting that they may play important roles in peach fruit ripening.

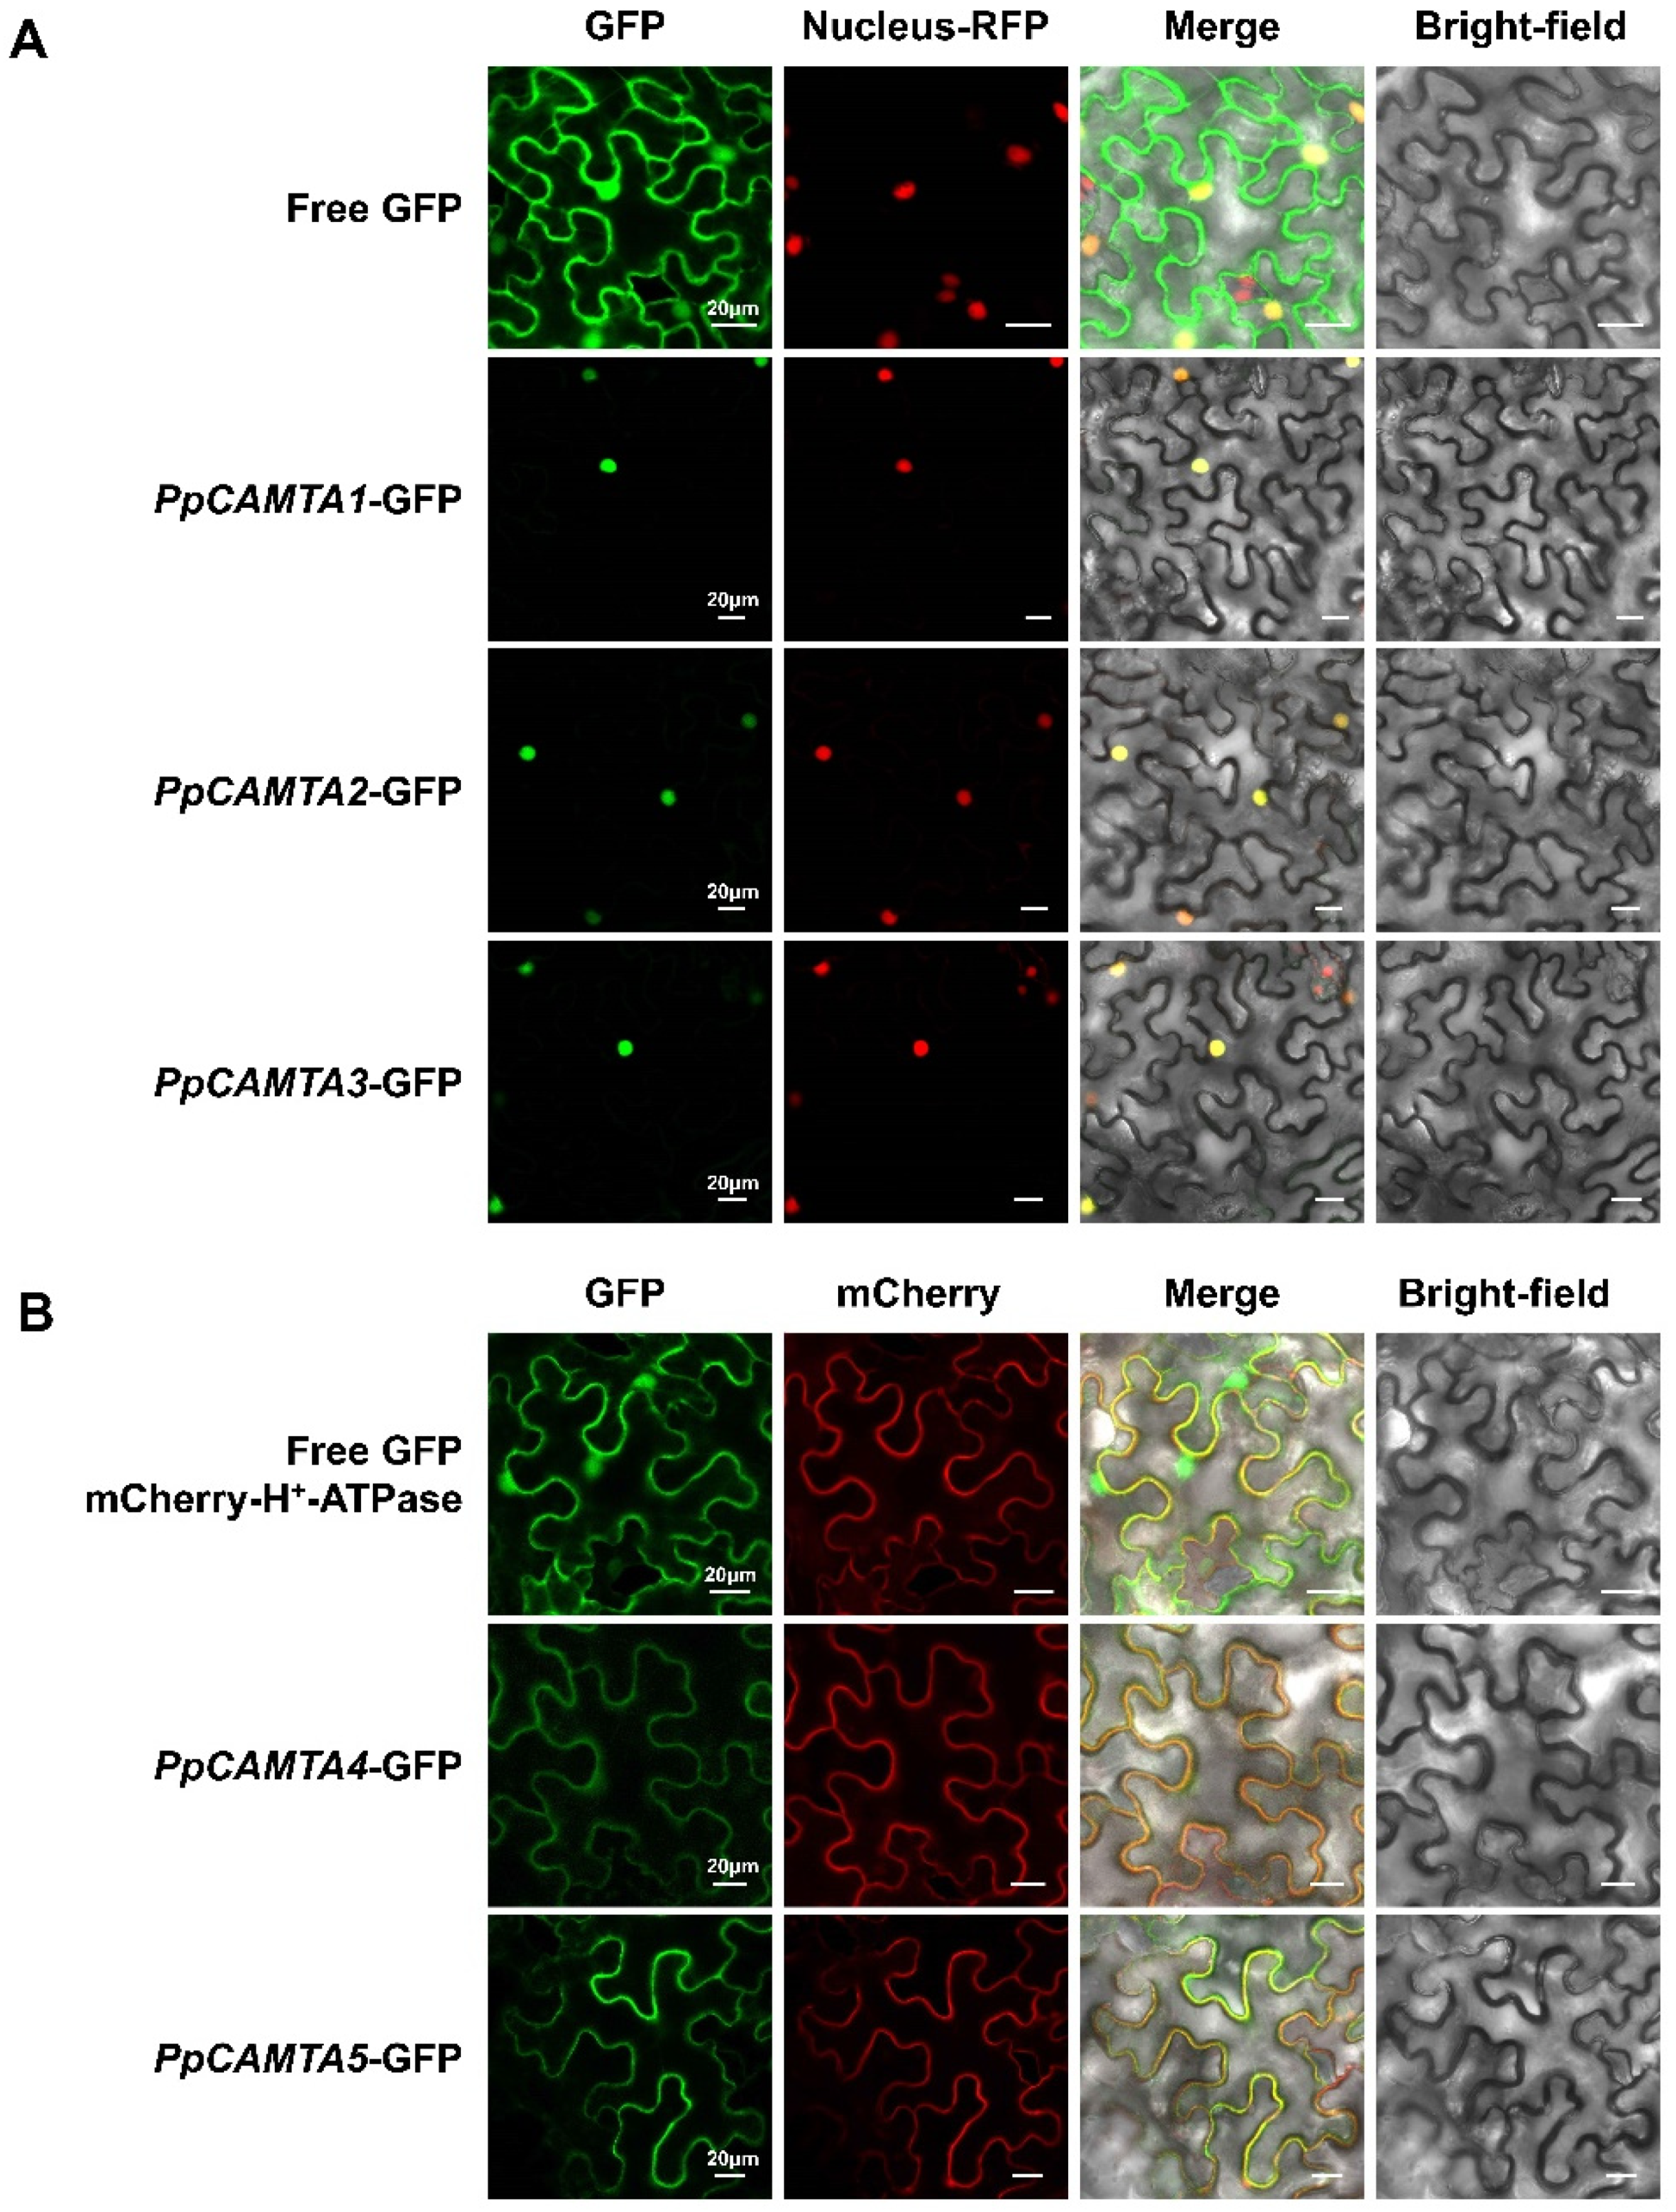
2.7. Subcellular Localization of Peach CAMTA Proteins

As CAMTA family members are transcription factors that contain the nuclear localization signal (NLS) domain, they were considered to be located in cell nucleus [23]. The NLS domains were predicted in peach CAMTA proteins (Figure 1B). In order to further understand the role of peach CAMTAs, subcellular localizations of these proteins were carried out by transiently expressing the PpCAMTAs-GFP constructs in tobacco leaves. For PpCAMTA1, PpCAMTA2 and PpCAMTA3, fluorescence microscopy showed distinct bright spots detected on the cell nucleus (Figure 6A), suggesting their nuclear localization. However, the green fluorescence from PpCAMTA4-GFP and PpCAMTA5-GFP proteins co-localized with the red fluorescence from mCherry-H+-ATPase in the plasma membrane of tobacco leaves (Figure 6B). This extranuclear localization of CAMTA proteins has also been reported in Arabidopsis [19]. Taken together, our results showed that PpCAMTA1, PpCAMTA2 and PpCAMTA3 were in the nucleus, PpCAMTA4 and PpCAMTA5 were located in the plasma membrane of the cell.

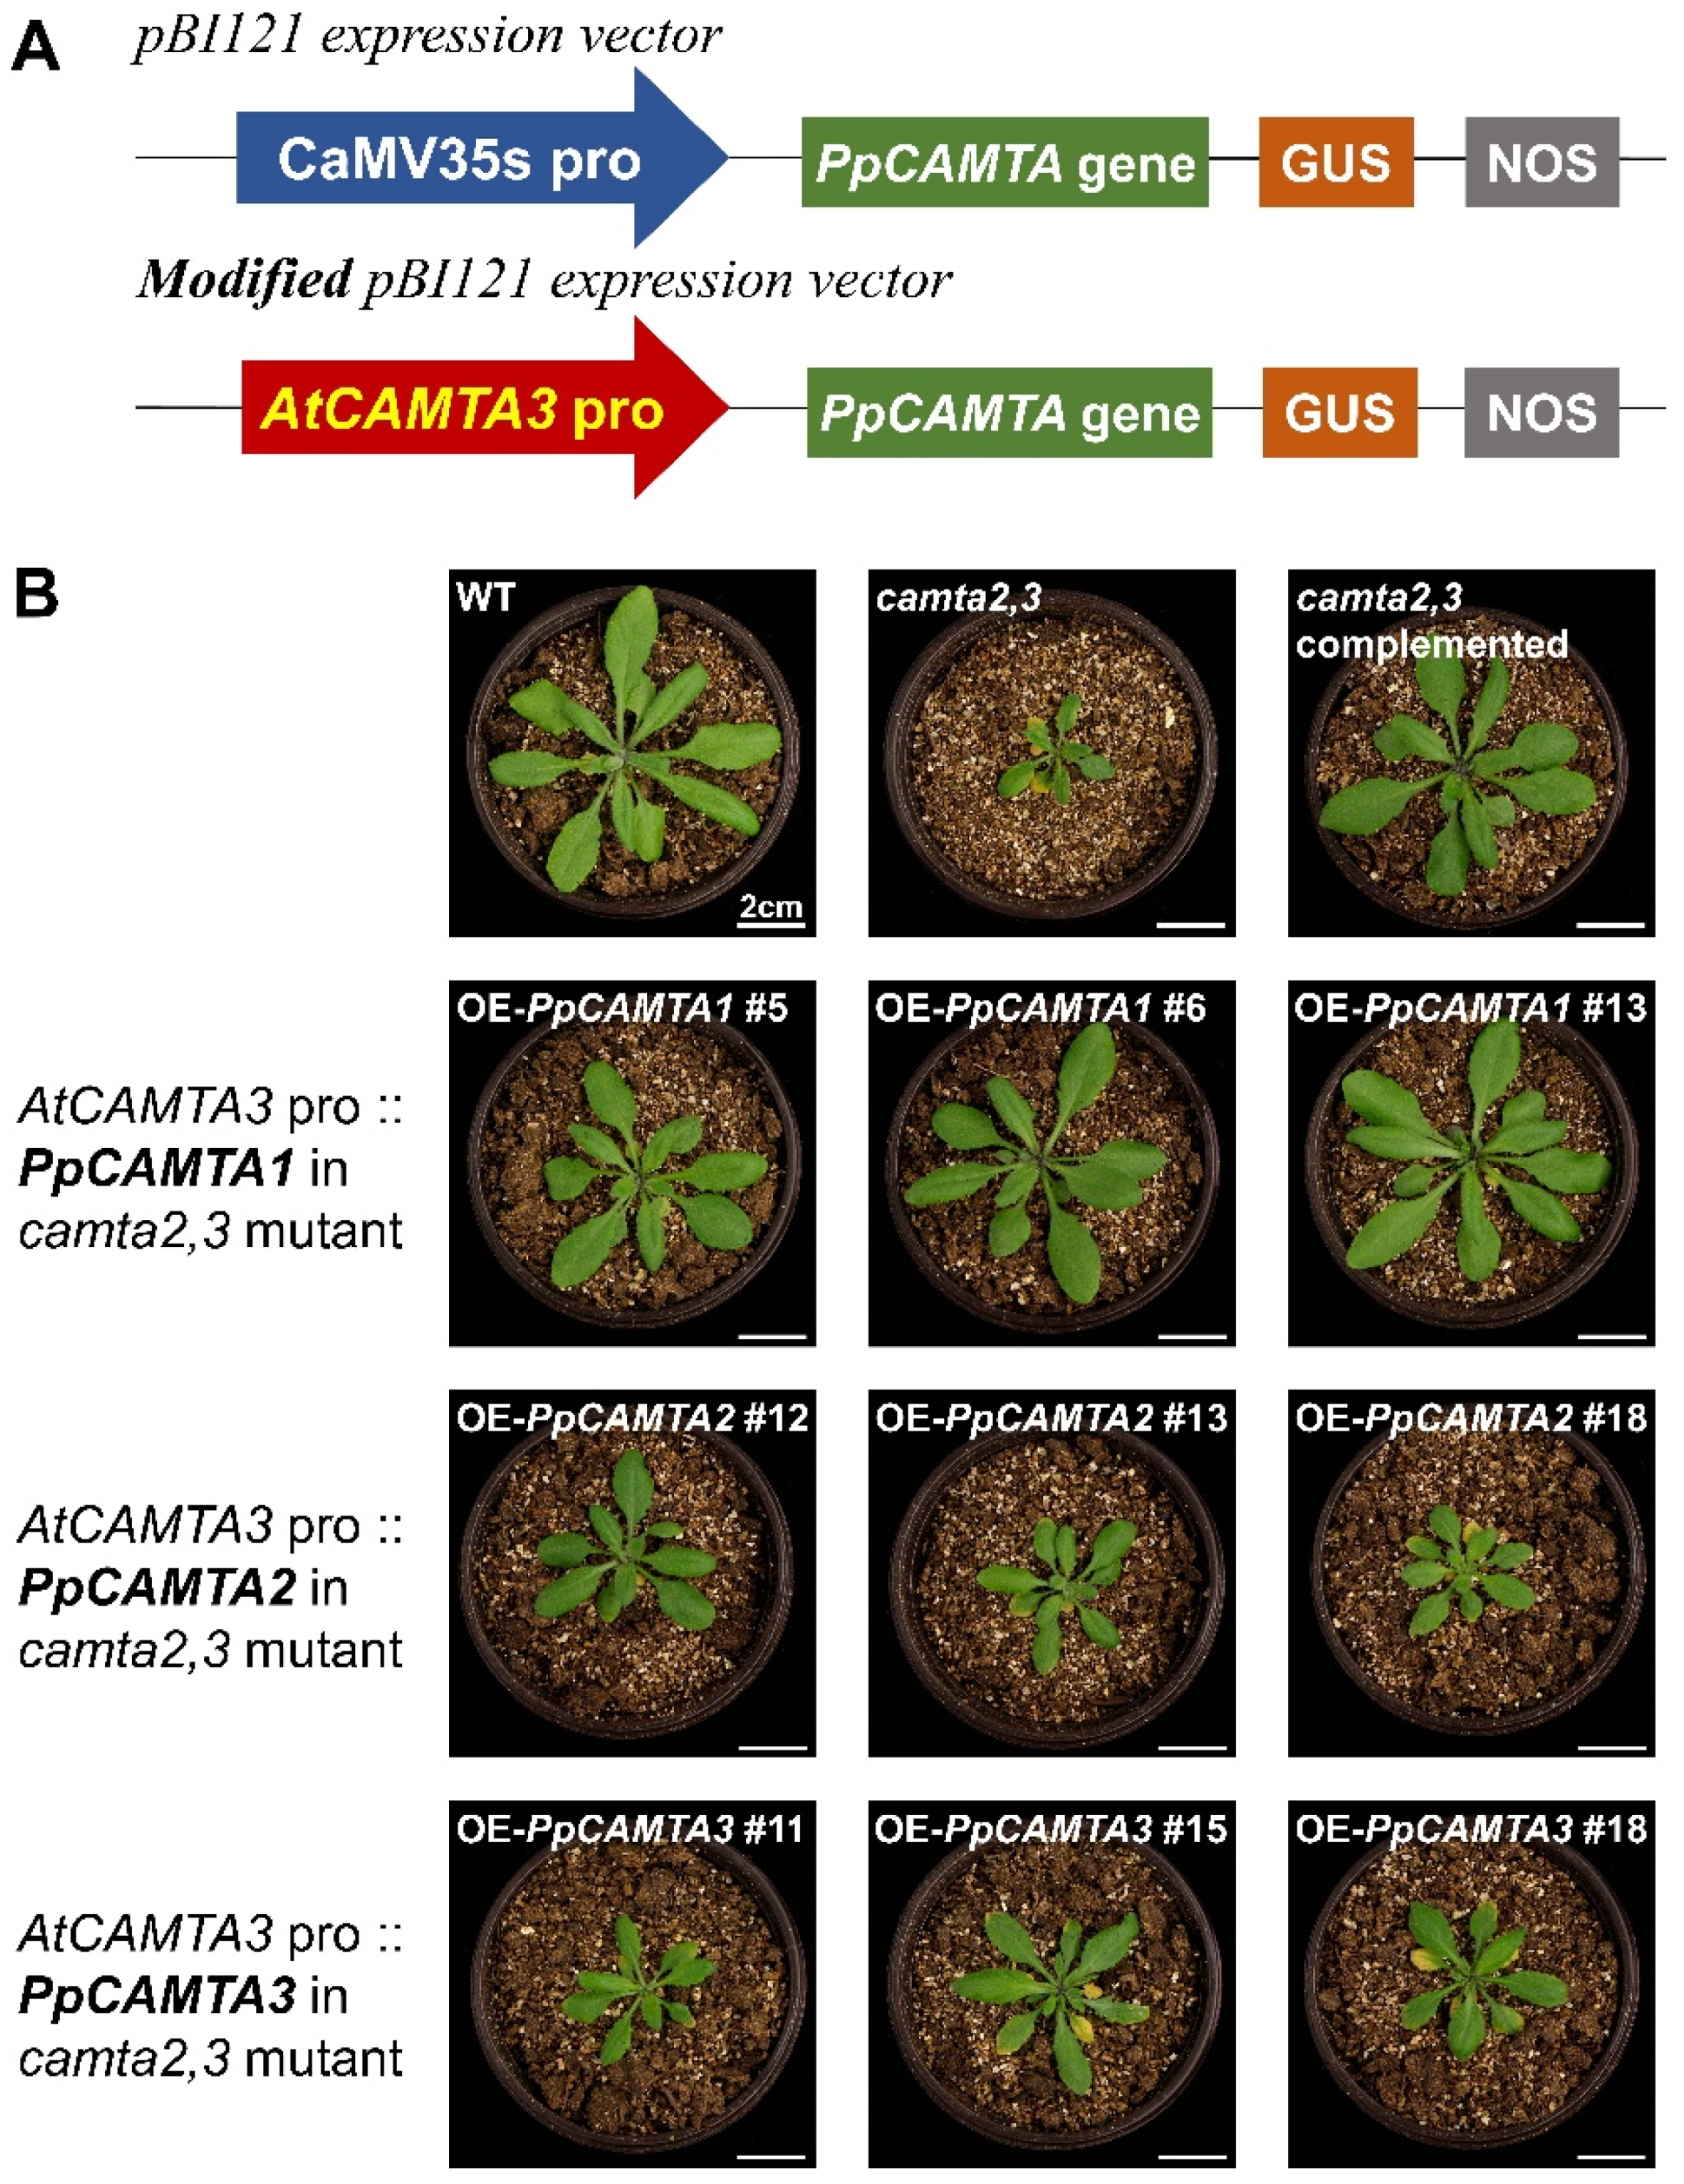
2.8. Overexpressing PpCAMTA1 Restored the Plant Size of Camta2,3 Mutant

The evolutionary tree has demonstrated the close phylogenetic relationships between peach CAMTA1/2/3 and Arabidopsis CAMTA1/2/3 (Figure 1A). In order to answer the question of whether PpCAMTA1/2/3 represents the functional homologs of AtCAMTA1/2/3, we expressed PpCAMTA1, PpCAMTA2 and PpCAMTA3 in the camta2,3 mutant, respectively (Figure S3). We chose camta2,3 as the genetic background for the same reasons as the previous study [15], camta2,3 double mutant shows greater changes in SA biosynthesis and expression of SA pathway genes than those in the camta3 single mutant, while camta1,2,3 triple mutant is tiny in size and difficult to work with.
To avoid the excessively strong expression caused by the CaMV35S promoter, we replaced the 35S promoter of the pBI121 vector with the endogenous promoter of AtCAMTA3 to ensure the natural expression level (Figure 7A). The results showed that overexpression of these three peach CAMTA genes complemented the plant size of camta2,3 to different extent. As shown in Figure 7B, the plant size of OE-PpCAMTA1 transgenic lines were larger than camta2,3 and closed to that of wild type (WT). Although OE-PpCAMTA2 and OE-PpCAMTA3 transgenic lines did not complement the plant size to the level of wild type, expression of these two genes did result in larger plant size than that of camta2,3 mutant (Figure 7B). In brief, peach PpCAMTA1 could largely rescue the plant size defect phenotype caused by camta2,3 mutation, PpCAMTA2 and PpCAMTA3 partially restored plant development after overexpressing in camta2,3 mutant.

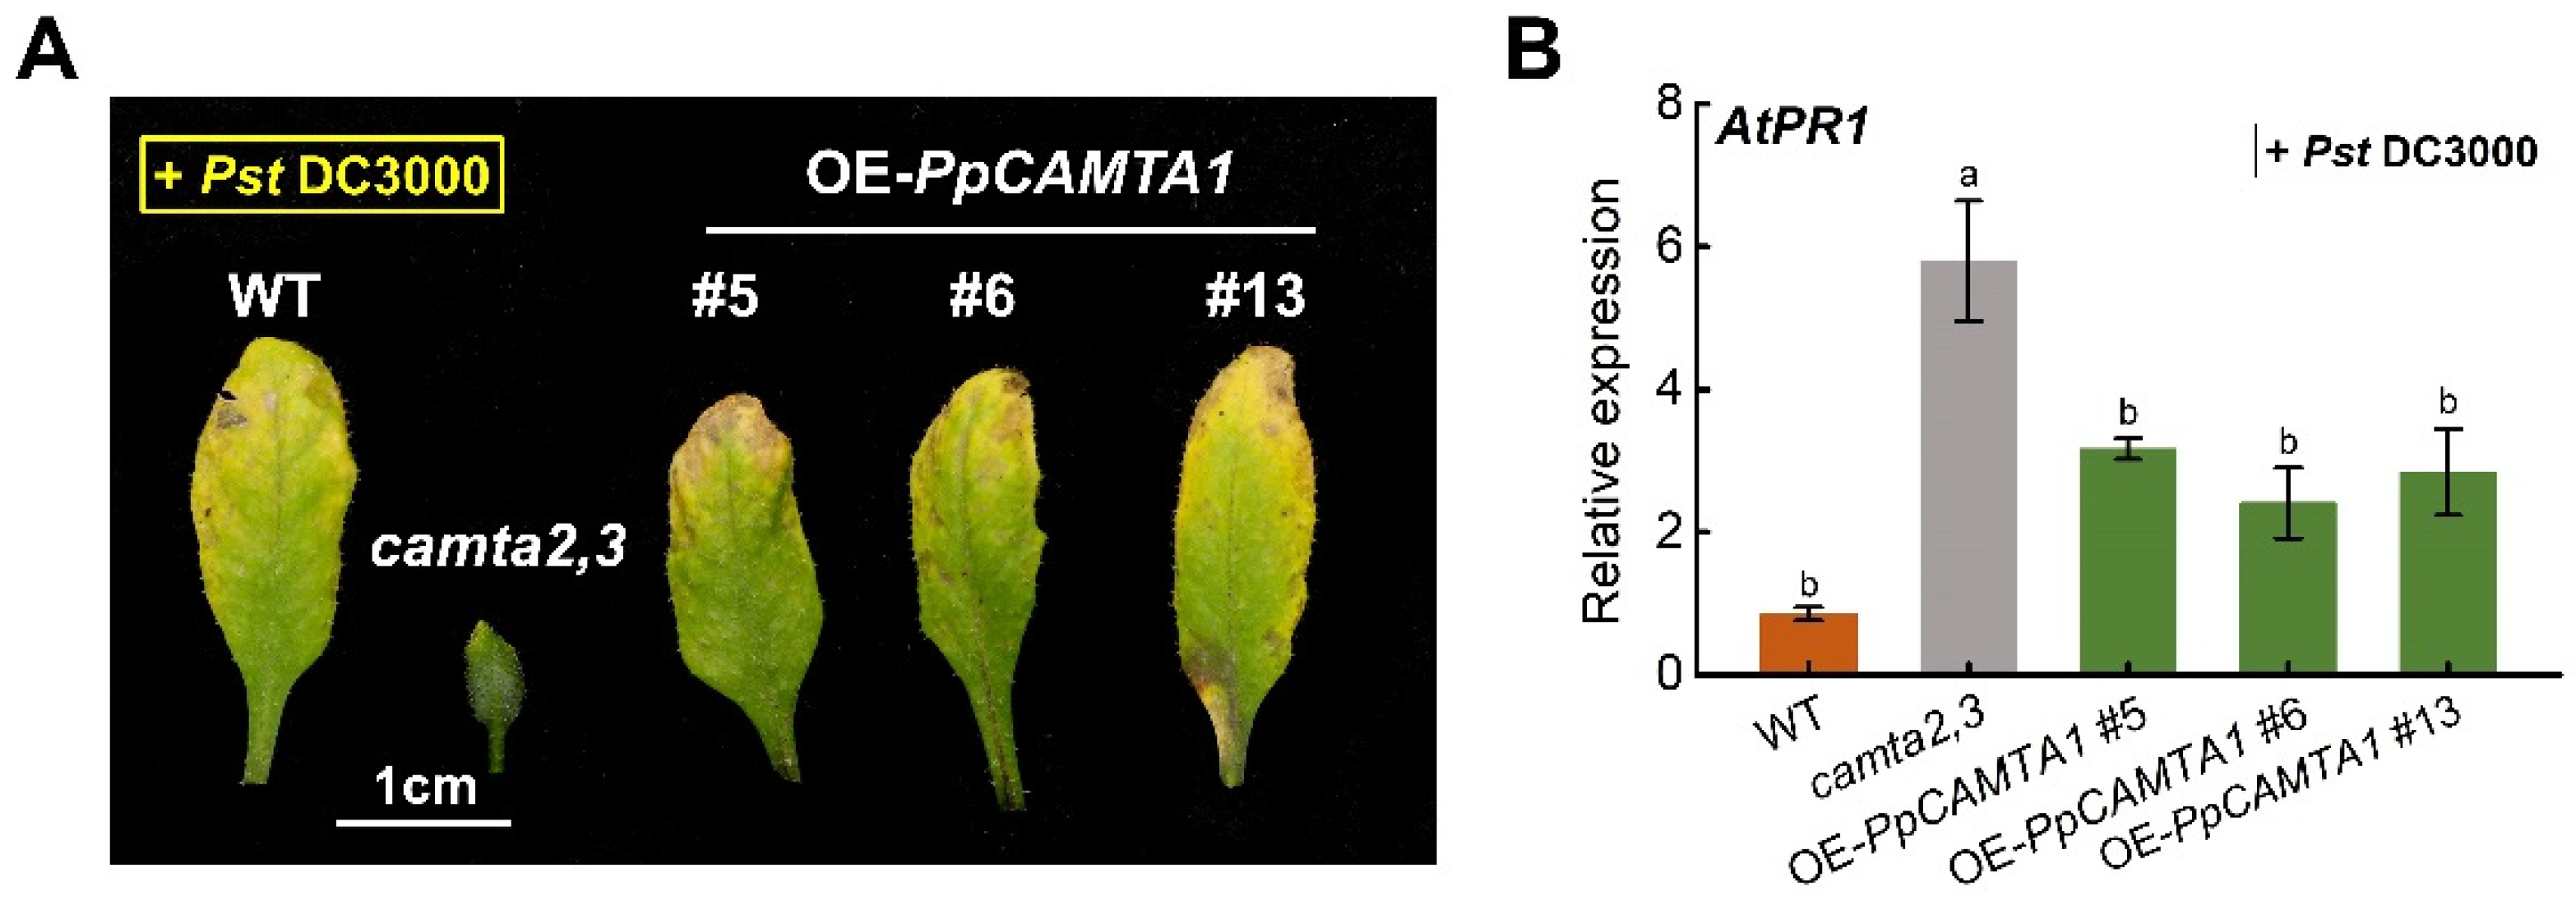
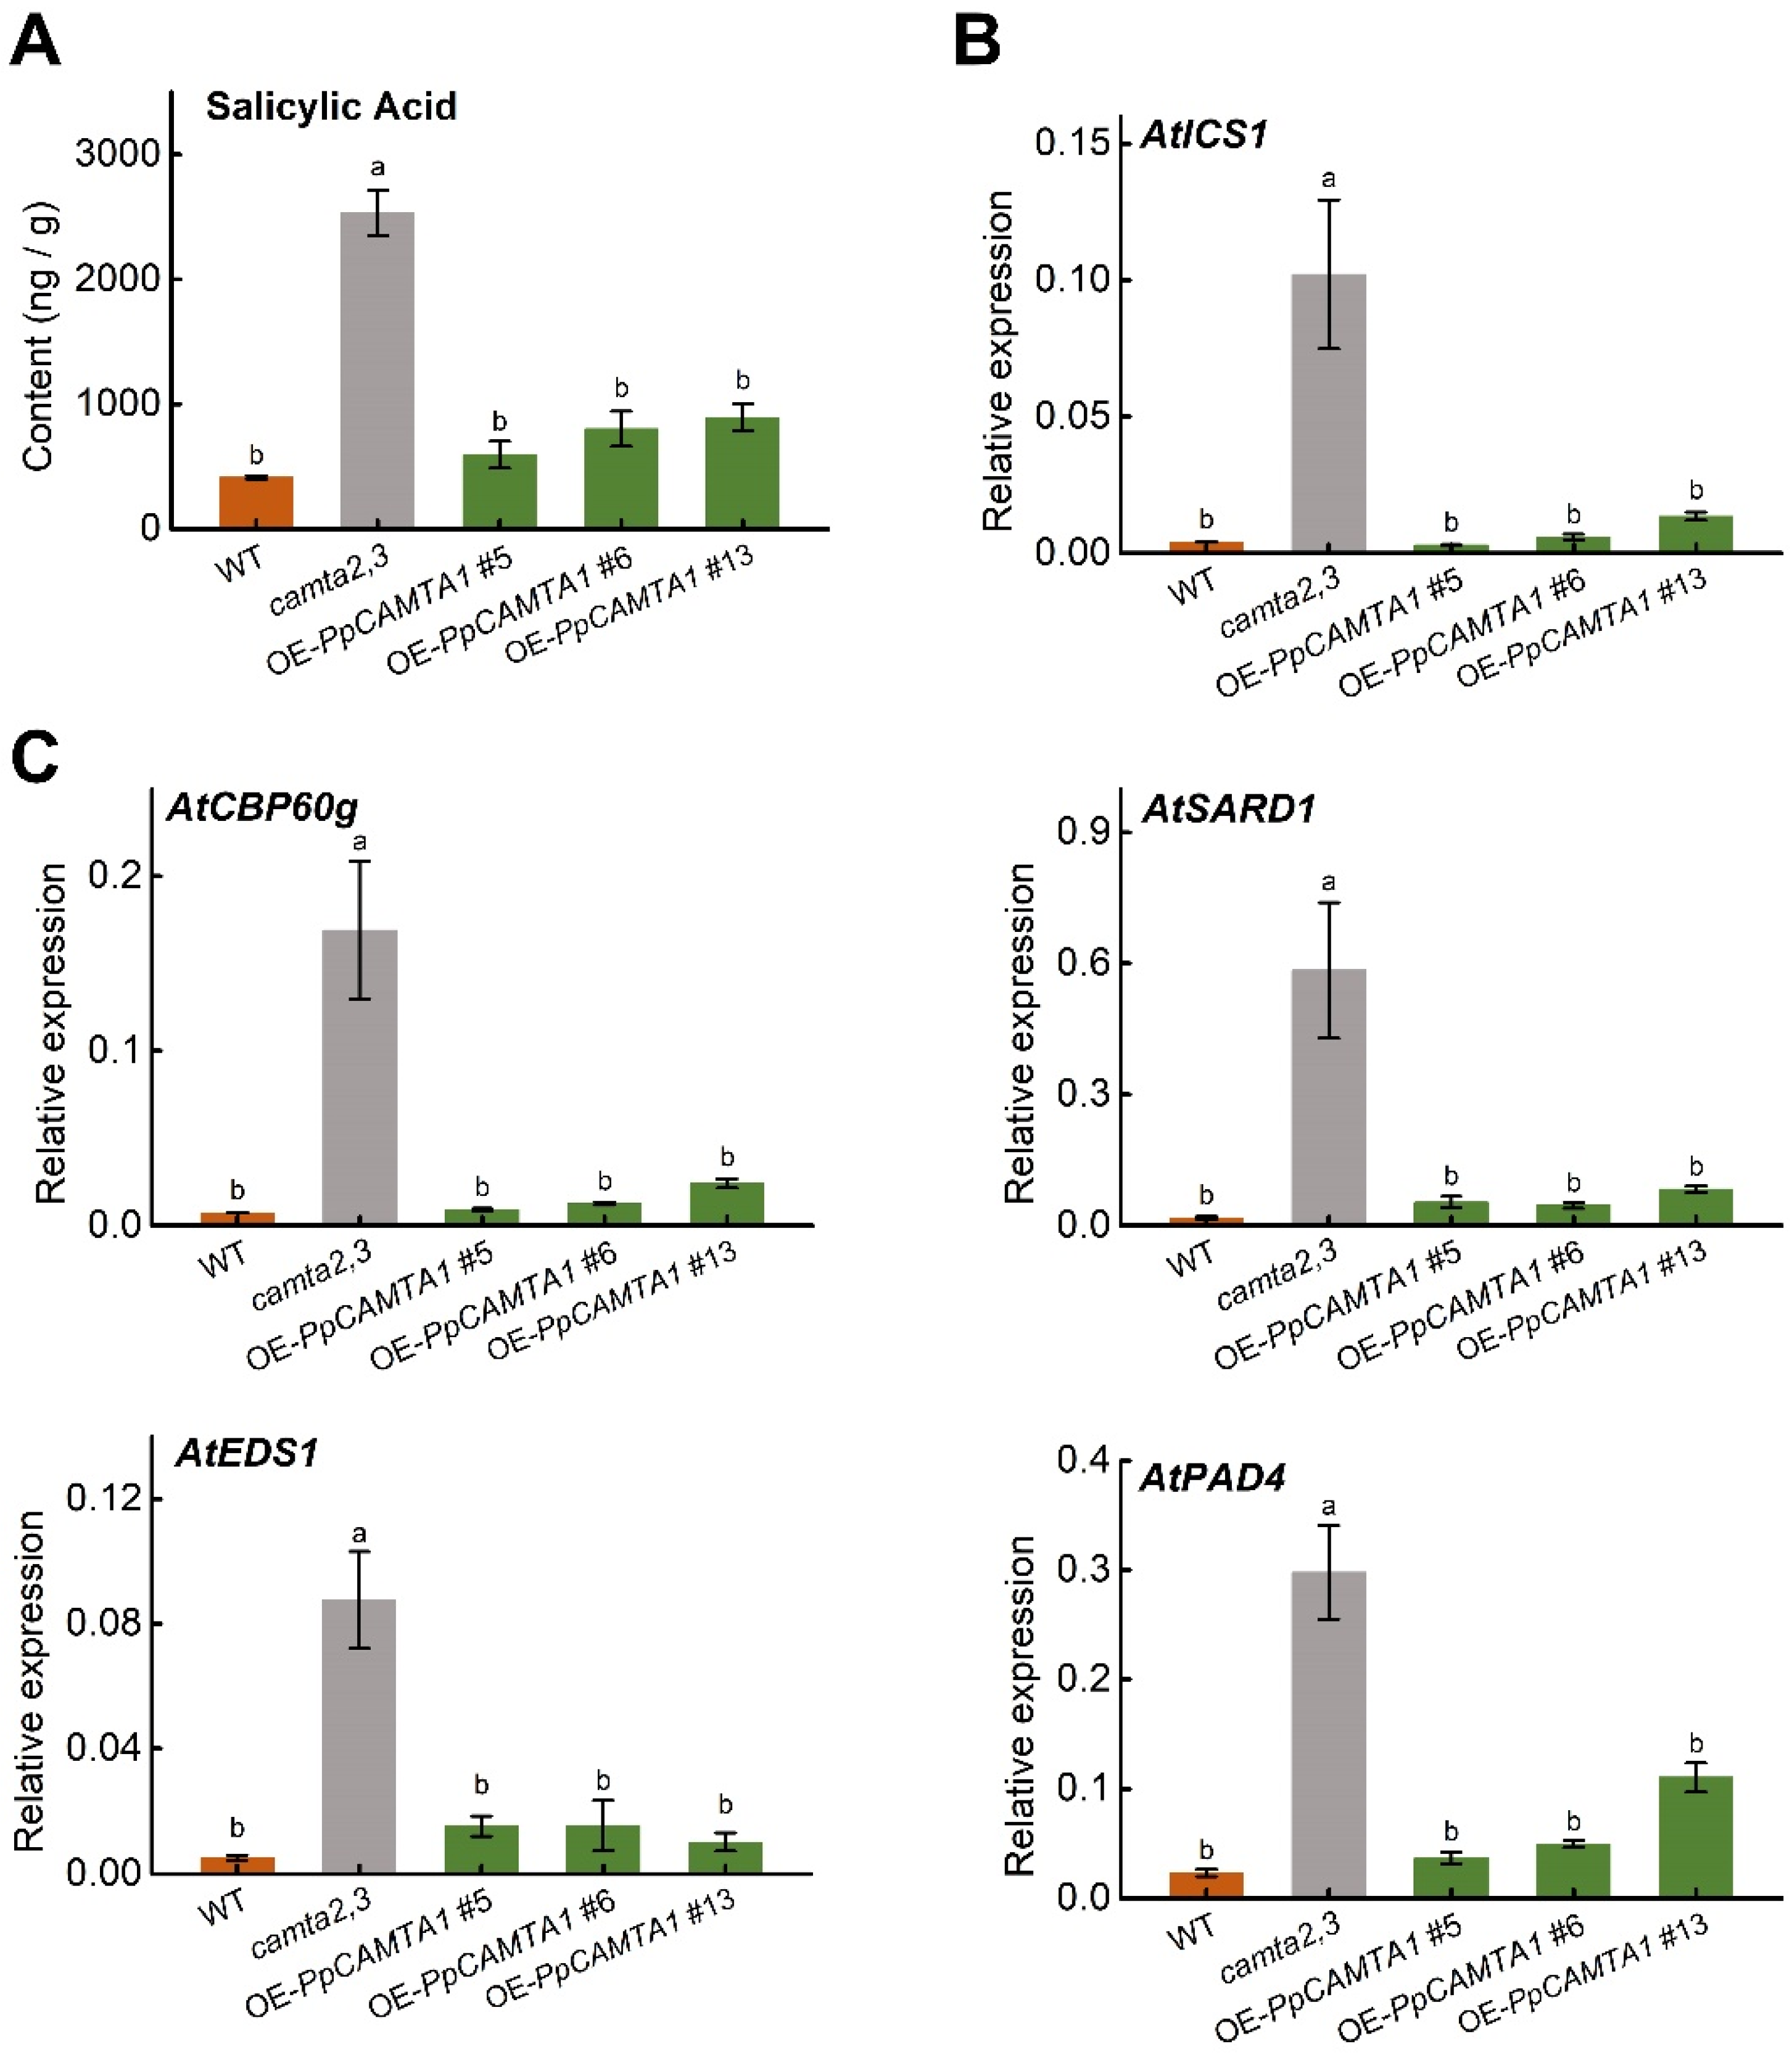
2.9. Overexpressing PpCAMTA1 Reduces SA Biosynthesis and Weakens Plant Resistance to Pathogen of Camta2,3 Mutant

Our results showed that overexpressing PpCAMTA1 recovered camta2,3 mutant size close to that of WT (Figure 7B), indicating that PpCAMTA1 is a candidate gene with a role similar to Arabidopsis CAMTA3 during plant development. Arabidopsis CAMTA1, CAMTA2 and CAMTA3 repress SA biosynthesis and ICS1 expression by regulating transcription factors at ambient temperature [14,17]. In addition, CAMTA3 regulates SARD1 and CBP60g expression [18]. Therefore, we next explored the role of PpCAMTA1 in plant immune response.
Significantly higher SA content and related genes expression levels were observed in camta2,3 mutant than those in WT (Figure 8). After overexpressing PpCAMTA1, transgenic plants resulted in at least 52 % reduction in SA content in relative to that of camta2,3 mutant (Figure 8A). Correspondingly, transcript levels of AtICS1 (a gene responsible for SA synthesis) were reduced by approximately 90% in OE-PpCAMTA1 lines when compared to that in camta2,3 mutant (Figure 8B). Besides SA content and SA synthesis related gene expression, expression levels for SA related transcription factors were analyzed as well. Transcription levels of AtCBP60g in transgenic lines were about 5.3%, 7.3% and 14.2% of that in camta2,3, respectively (Figure 8C). Moreover, in transgenic lines after overexpressing PpCAMTA1, expression levels of AtSARD1, AtEDS1 and AtPAD4 were significantly lower than those in camta2,3 mutant as well. It is noteworthy that both SA content and expression levels for genes associated with SA synthesis and signaling were similar between WT and transgenic plants after overexpressing PpCAMTA1.
Given the above phenotype, Pst DC3000 (Pseudomonas syringae pv. tomato DC3000) was used to measure the effect of PpCAMTA1 on pathogen resistance. Three days after pathogen infection, camta2,3 mutant plants exhibited scarce chlorotic spots on their leaves, while wild type and OE-PpCAMTA1 lines exhibited severity chlorotic spots on leaves, showed more susceptibility to the Pst strain (Figure 9A). Gene expression was also shown to induce stronger AtPR1 in camta2,3 mutants after 1 d of inoculation when compared with OE-PpCAMTA1 lines (Figure 9B). The expression of SA-related genes mentioned above showed similar trends among these plants (Table S6). Taken together, these results revealed that PpCAMTA1 negatively regulated SA biosynthesis and genes related to SA pathway, which may act as a negative regulator of plant immunity in peach.

3. Discussion

As important transcription factors containing CaM binding sites, the functions of CAMTAs have been reported widely in recent years [7,23,35]. Although comprehensive genome-wide analysis of CAMTAs have been reported in horticultural crops [26,27,28,29], functions of CAMTAs in fruit remain largely unknown. Peach is considered as a model plant of Rosaceae family [31]. In this study, we identified five peach CAMTA genes. Similar number of CAMTA genes were also observed for sweet cherry, apricot and almond. Rosaceae family fruit crops such as apple and strawberry have more CAMTA gene members. The number of CAMTA genes varing in different plant species is suggested to be associated with evolution although the process is complex [7].
Pathogen infection and disease development are major factors that cause postharvest decay, leading to a limitation in the storage period and marketing life of peach fruit [36]. Improving immunity resistance is an efficient and preferred strategy for reducing disease development in fruit [37]. Several studies have shown that application of calcium before and after harvesting delayed the development of peach fruit disease, and thus prolonged storage period of peach fruit [38,39,40]. Therefore, it is necessary to identify fruit immune-related transcription factors on calcium signaling pathways. In Arabidopsis, AtCAMTA1/2/3 are components derived from calcium signaling pathway and play negative roles in plant immune responses. For instance, mutant camta2,3 has increased SA content and higher expression levels of SA-regulated immunity genes than those in wild type Arabidopsis [14]. Overexpressing PpCAMTA1 in the camta2,3 mutants resulted in lower SA content, contributing to more susceptible to the virulent Pst DC3000 strain. Notably, overexpression of PpCAMTA1 restored plant size, close to that of WT plant. These results indicated that PpCAMTA1 could functionally complement Arabidopsis CAMTA2/3 by overexpressing peach gene in cmata2,3 mutant. During peach fruit storage at ambient temperature, transcript levels of PpCAMTA1 increased, accompanied with fruit postharvest ripening and senescence. Similarly, increased expression levels were also observed for tomato SlSR1/1L [10] and durian DzCAMTA3/8 during postharvest fruit ripening [30]. Induced expression of tobacco CAMTA member NtER1 was suggested to be associated with ethylene induced senescence for both leaf and flower [6]. According to expression pattern of PpCAMTA1 and transgenic Arabidopsis phenotype in camta2,3 genetic background, our results suggested that increased PpCAMTA1 expression was associated with reduced peach fruit immune response during postharvest storage, thus contributing to fruit senescence and seed dispersal.
Apart from biological stress, expression of plant CAMTAs could also be affected by abiotic stresses [23]. However, effect of abiotic stresses on expression of CAMTAs has not been well studied in fruit species. In our study, we investigated peach CAMTA genes expression profiles during peach fruit ripening and in response to stresses. The present study revealed that PpCAMTA1 expression was induced by cold treatment in peach fruit, while the expression of the left four members was inhibited during postharvest cold storage for 28 d. In tomato fruit, transcript levels of SlSR2 and SlSR3L were induced by cold treatment [10]. Transcript levels of Arabidopsis AtCAMTA3 increased and stayed at high level during exposure to low temperature for 5 weeks [14]. These results showed that induced expression of CAMTAs was conserved both in plants and in fruit species, indicating an important role of peach PpCAMTA1 during fruit cold storage. UV-B irradiation for Arabidopsis seedlings induced expression of CAMTAs [41]. Here, we showed that expression levels of PpCAMTA1, PpCAMTA2 and PpCAMTA5 were inhibited by UV-B. Based on RT-qPCR results, expression level of PpCAMTA3 was also repressed by UV-B (Figure S2A). These results revealed different response of CAMTA expression patterns between Arabidopsis leaf and peach fruit upon to UV-B treatment. Our previous study showed that UV-B had great effects on contents of both anthocyanin and volatile linalool in peach fruit [42,43], suggesting that peach CAMTAs is associated with the formation of fruit secondary metabolites.
Most previous reports showed that CAMTAs belong to nuclear protein [9,44]. Arabidopsis CAMTA2, CAMTA3 and CAMTA5 were located in nuclei [19]. The present study showed that peach CAMTAs were located both in nucleus and plasma membrane. For instance, PpCAMTA1, PpCAMTA2 and PpCAMTA3 were located in nucleus, and PpCAMTA4 and PpCAMTA5 were located in the plasma membrane. Phylogenetic analysis showed that PpCAMTA4 and PpCAMTA5 were on different clades from PpCAMTA1-3 due to difference in sequence. A previous study analyzed the subcellular localization of 465 CAMTA proteins, of which 390 proteins were predicted to located in the nucleus, and the remaining CAMTAs were localized in the cytosol, chloroplast and plasma membrane [7]. Some CAMTAs contain nuclear localization signal sequence which allows these proteins to enter the nucleus to perform their functions. Moreover, these extranuclear localizations of CAMTAs have also been reported in Arabidopsis. For example, destabilization and nuclear export were observed for AtCAMTA3 after protein phosphorylation modification caused by mitogen-activated protein kinases (MAPKs) MPK3 and MPK6 [45]. These two MAPKs were induced by bacterial flg22 elicitor in Arabidopsis. Interestingly, Arabidopsis AtCAMTA1, AtCAMTA4, and AtCAMTA6 were suggested to be unstable at room temperature or 4 °C [19]. These results indicated that it is not surprising that PpCAMTA4/5 were located outside the nucleus. The mechanisms need to be further investigated for the different location of PpCAMTAs in future.
Among five peach CAMTA gene members, PpCAMTA1, PpCAMTA2 and PpCAMPT3 were grouped with Arabidopsis AtCAMTA3 which is involved in plant development. To test if peach CAMTA genes could functionally complement the defect phenotype in Arabidopsis mutant, PpCAMTA1, PpCAMTA2 and PpCAMPT3 were overexpressed driven by the native AtCAMTA3 promoters. The second reason to choose the native AtCAMTA3 promoter is to avoid the excessively strong expression caused by the CaMV35S promoter. We found that overexpression of these three peach CAMTA genes complemented the plant size of camta2,3 to different extent. Peach PpCAMTA1 rescued the developmental defect phenotype caused by camta2,3 mutation, restored the plant size to the WT level. Notably, only partially restored plant development phenotype was observed for PpCAMTA2 and PpCAMTA3. However, we cannot exclude roles of other peach CAMTA genes during plant development. The identification of functions of each peach CAMTA gene will require further research. Our dataset in hand suggest that PpCAMTA1 is associated with plant development, including fruit ripening and postharvest responses to biotic and abiotic stresses.

4. Materials and Methods

4.1. Plant Material and Treatment

Peach (Prunus persica L. Batsch cv. Hujingmilu) fruit at different developmental stages, fully expanded leaves and flowers at bloom stage were used for gene expression analysis according to our previous study [46]. After harvest at mature stage (108 days after bloom, DAB), peach fruits were held at 20 °C for 3 d (3 days after harvest, DAH) and 6 d (6 DAH). Treatments with UV-B irradiation [42] and methyl jasmonate (MeJA) [47] were used in this study. For cold treatment, peach fruits were stored at 0 °C up to 28 days. Three biological replicates with five fruits each were sampled, frozen in liquid nitrogen immediately and stored at −80 °C for further analysis.

4.2. Identification of Peach CAMTA Genes

The peach CAMTA genes were identified by the following approaches. Firstly, searching in the peach genome database at Phytozome v12.1 website (https://phytozome.jgi.doe.gov, accessed on 24 February 2022) based on gene annotations. Secondly, sequences of Arabidopsis CAMTA members were used as queries to search against the peach genome database with BLASTN and BLASTP programs. Thirdly, sequences of peach CAMTAs were checked for CAMTA conserved protein domains by using HMMER (http://www.ebi.ac.uk, accessed on 24 February 2022), Pfam database (http://pfam.janelia.org/, accessed on 24 February 2022) and SMART (http://smart.embl-heidelberg.de/, accessed on 24 February 2022). Peach CAMTA genes were cloned and sequenced for the subsequent analysis. Finally, sequence information of CAMTA genes was also extended to various genome assemblies in Prunus persica and Rosaceae genome whose sequence were gained from GDR website (https://www.rosaceae.org/, accessed on 22 August 2022).

4.3. Physicochemical Property Analysis and Phylogenetic Analysis

Amino acid properties and physicochemical traits of the given peach CAMTA proteins were calculated using the ProtParam tool in the ExPASy web server (https://web.expasy.org/protparam/, accessed on 28 February 2022). The full-length amino acid sequences of CAMTAs in Arabidopsis and peach were used to perform the multiple sequence alignments using Clustal W with default parameters. The phylogenetic analysis was constructed using the neighbor-joining (NJ) method with 1000 bootstrap replications by MEGA 11. Peach CAMTA genes were named based on the genetic relationship with Arabidopsis CAMTA genes.

4.4. Exon-Intron Organization and Chromosomal Map Construction

The distribution patterns of exon-intron of peach CAMTA genes were obtained from the peach genome database and displayed using the online website Gene Structure Display Server v2.0 (GSDS, http://gsds.cbi.pku.edu.cn/, accessed on 11 March 2022). The locations of CAMTA genes on the chromosomes were visualized by MapChart (v2.3) (Voorrips, R.E., Wageningen, The Netherlands).

4.5. Conserved Protein Domains Distribution and Cis-Regulatory Element Analysis

Bioinformatic analysis of the conserved protein domains was conducted through the online SMART tool (http://smart.embl-heidelberg.de/, accessed on 28 February 2022). CaM binding domain (CaMBD) was predicted by the Calmodulin Target Database (http://calcium.uhnres.utoronto.ca/ctdb/ctdb/, accessed on 28 February 2022). A schematic representation of conserved protein domain structures was constructed using DOG 2.0 software (Jian Ren, Hefei, China) [48]. Online server MEME (Multiple Em for Motif Elicitation) was used to carry out motif analysis. For promoter cis-regulatory elements analysis, putative promoter sequences (2 kb from TSS) of the peach CAMTA genes were downloaded from the peach genome database, and then identification of possible cis-acting regulatory elements was performed by PlantCARE (http://bioinformatics.psb.ugent.be/webtools/plantcare/html/, accessed on 11 March 2022).

4.6. Subcellular Localization Analysis

Subcellular localization analysis was conducted according to our previous study [49]. The recombined 35S-PpCAMTA-eGFP vectors were constructed using primers listed in Table S3. To identify the nuclear location, the vector was infiltrated into transgenic tobacco plants expressing a red fluorescent nuclear marker (Nucleus–RFP). To verify the plasma membrane localization, mCherry-H+-ATPase with red fluorescence was used as a marker of plasma membrane [50]. Leaves were detached for analysis using a confocal laser scanning microscope (LSM 780; Carl Zeiss, Oberkochen, Germany).

4.7. RNA Extraction and Gene Expression Analysis

Total RNA of peach fruit was extracted according to our previous study [51], and libraries for high-throughput Illumina strand-specific RNA-sequencing were prepared as described previously [52]. Reads per kilobase of exon model per million mapped reads (RPKM) based on the length of the gene and the number of reads mapped to this gene was used to express transcript abundance [42,46]. Three biological replicates for each sampling time point were performed for RNA-Seq.
Total RNA of Arabidopsis plant leaves was extracted by using the reagent RNAiso Plus (Takara) according to its instructions. For quantitative reverse-transcription PCR (RT-qPCR) analysis, HiScript II Q RT SuperMix for qPCR (+gDNA wiper) and ChamQ Universal SYBR qPCR Master Mix (Vazyme, Nanjing, China) were used. Each RT-qPCR analysis contained three biological replicates. Oligonucleotide primers for RT-qPCR analysis were listed in Table S4.

4.8. Stable Overexpression of Arabidopsis

The transformation was conducted in four-week-old seedlings of Arabidopsis plants according to the floral dip method. The camta2,3 double mutant T-DNA insertion mutants were in Col-0 background and got from Kim [14]. The modified pBI121-PpCAMTA1/2/3 constructs were used to obtain overexpression (OE) lines in the camta2,3 genetic background. Notably, the overexpression of peach PpCAMTA1/2/3 was driven by the AtCAMTA3 promoter rather than the CaMV35S promoter. Primers were listed in Table S5. Transgenic seeds were selected on 1/2 Murashige and Skoog (MS) medium with 50 mg/L kanamycin. Wild type (WT) and mutants were planted in a growth chamber with 22 °C under 16 h light (100 μmol m−2 s−1 constant light) and 8 h dark. After 1-month growth, rosette-like basal leaves of the above-ground part were sampled for subsequent analysis.

4.9. Pathogen Infection Assay

For infection with Pst DC3000 (Pseudomonas syringae pv. tomato DC3000), some modifications were made by referring to the methods of previous studies [18]. Briefly, leaves of 4-week-old plants were sprayed with the bacteria at a dose of OD600 = 0.002 in 10 mM MgCl2. Infected leaves were covered with a clean dome to maintain high humidity, grown at 22 °C under 16/8-h light/dark cycles in a growth chamber. On 1 day after inoculation, the leaf samples were collected for RNA extraction and gene expression analysis, and plants scored 3 days for phenotypic observation.

4.10. Quantification of Salicylic Acid (SA) Content

Free SA content was extracted and measured using the previous methods with some modifications [53]. A total of 0.2 g fresh weight of leaf tissue powder was homogenized and extracted for 4 h at 65 °C using 1.2 mL of 90% (v/v) methanol. After centrifugation, the supernatants were dried in a speed vacuum at 60 °C. The residue was resuspended using 600 μL 5% (v/v) trichloroacetic acid and sonicated for 10 min. Then, 2 vol (1.2 mL) of ethylacetate-cyclopentane-isopropanol (50:50:1) were added to extract SA. The superorganic phase containing the SA was dried in a speed vacuum with 60 °C. The residue was dissolved in 500 μL methanol. SA was detected using a fluorescence detector in HPLC analysis, the excitation wavelength is 295-nm, and the emission wavelength is 405-nm.

4.11. Statistical Analysis

A completely randomized design was used in the experiments. Mean value and standard errors (SE) were calculated by Microsoft Excel, figures were produced by OriginPro 9 (Microcal Software Inc., Northampton, MA, USA). The two-sample significance test was calculated using unpaired Student’s t-test (*, p < 0.05 and **, p < 0.01). For multiple samples significance test, ANOVA analysis followed by a post-hoc Tukey HSD test was used to calculate p value, and letters were designated for significantly different values (SPSS 19.0; SPSS Inc., Chicago, IL, USA).

5. Conclusions

In this study, a total of five CAMTA genes were identifed in peach (Prunus persica L. Batsch) at the level of gene structure, sequence characteristics, promoter cis-acting elements and expression patterns. Increased transcription levels were detected for PpCAMTA1 during fruit development and ripening. Our hypothesis that PpCAMTA1 is an ortholog of AtCAMTA3 was experimentally confirmed by overexpressing PpCAMTA1 under the control of the native AtCAMTA3 promoter in Arabidopsis mutant system. Overexpressing PpCAMTA1 can complement the developmental deficiencies in Arabidopsis camta2,3, indicating an association of PpCAMTA1 during developmental process such as fruit ripening and postharvest responses to biotic and abiotic stresses.

Supplementary Materials

The following supporting information can be downloaded at: https://www.mdpi.com/article/10.3390/ijms231810500/s1. References [54,55,56,57,58] are cited in the Supplementary Materials.

Author Contributions

Conceptualization, C.Y., H.L. and B.Z.; Data curation, X.C., C.Z. and M.L.; Formal analysis, Y.Q.; Funding acquisition, H.L. and B.Z.; Investigation, Z.L. and D.J.; Methodology, W.D.; Resources, K.C.; Software, C.W.; Supervision, B.Z.; Writing—original draft, C.Y.; Writing—review & editing, C.Y., H.L. and B.Z. All authors have read and agreed to the published version of the manuscript.

Funding

This research was funded by Shanghai Agriculture Applied Technology Development Program China (2022-02-08-00-12-F01084), the National Natural Science Foundation of China (31972379, 32102451), the National Natural Science Foundation of Zhejiang Province (D22C159378), and the Fundamental Research Funds for the Zhejiang Provincial Universities (2021XZZX026), Shanghai agricultural products preservation and processing engineering technology research center (19DZ2251600), the Shanghai professional service platform for agriculture products preservation and processing (21 DZ2292200).

Data Availability Statement

The relevant datasets can be found in the NCBI with accession number PRJNA576753, PRJNA574004, PRJNA852345 and SRP103523.

Acknowledgments

We thank YongSig Kim and Michael F. Thomashow for providing Arabidopsis camta2,3 mutants, critical review and language improvement.

Conflicts of Interest

The authors declare no conflict of interest.

References

  1. Edel, K.H.; Marchadier, E.; Brownlee, C.; Kudla, J.; Hetherington, A.M. The evolution of calcium-based signalling in plants. Curr. Biol. 2017, 27, R667–R679. [Google Scholar] [CrossRef] [PubMed]
  2. Bradleigh, H.; Tyerman, S.D.; Burton, R.A.; Matthew, G. Fruit calcium: Transport and physiology. Front. Plant Sci. 2016, 7, 569. [Google Scholar]
  3. Mohanta, T.K.; Kumar, P.; Bae, H. Genomics and evolutionary aspect of calcium signaling event in calmodulin and calmodulin-like proteins in plants. BMC Plant Biol. 2017, 17, 38. [Google Scholar] [CrossRef]
  4. Ding, X.; Zhang, L.; Hao, Y.; Xiao, S.; Wu, Z.; Chen, W.; Li, X.; Zhu, X. Genome-wide identification and expression analyses of the calmodulin and calmodulin-like proteins reveal their involvement in stress response and fruit ripening in papaya. Postharvest Biol. Technol. 2018, 143, 13–27. [Google Scholar] [CrossRef]
  5. Iqbal, Z.; Shariq Iqbal, M.; Singh, S.P.; Buaboocha, T. Ca2+/Calmodulin complex triggers CAMTA transcriptional machinery under stress in plants: Signaling cascade and molecular regulation. Front. Plant Sci. 2020, 11, 598327. [Google Scholar] [CrossRef] [PubMed]
  6. Yang, T.; Poovaiah, B.W. An early ethylene up-Regulated gene encoding a calmodulin-binding protein involved in plant senescence and death. J. Biol. Chem. 2000, 275, 38467–38473. [Google Scholar] [CrossRef] [PubMed]
  7. Xiao, P.; Feng, J.W.; Zhu, X.T.; Gao, J. Evolution analyses of CAMTA transcription factor in plants and its enhancing effect on cold-Tolerance. Front. Plant Sci. 2021, 12, 758187. [Google Scholar] [CrossRef]
  8. Finkler, A.; Ashery-Padan, R.; Fromm, H. CAMTAs: Calmodulin-binding transcription activators from plants to human. FEBS Lett. 2007, 581, 3893–3898. [Google Scholar] [CrossRef]
  9. Bouché, N.; Scharlat, A.; Snedden, W.; Bouchez, D.; Fromm, H. A novel family of calmodulin-binding transcription activators in multicellular organisms. J. Biol. Chem. 2002, 277, 21851–21861. [Google Scholar] [CrossRef]
  10. Yang, T.; Peng, H.; Whitaker, B.D.; Conway, W.S. Characterization of a calcium/calmodulin-regulated SR/CAMTA gene family during tomato fruit development and ripening. BMC Plant Biol. 2012, 12, 19. [Google Scholar] [CrossRef]
  11. Rahman, H.; Yang, J.; Xu, Y.P.; Munyampundu, J.P.; Cai, X.Z. Phylogeny of plant CAMTAs and role of AtCAMTAs in nonhost resistance to Xanthomonas oryzae pv. oryzae. Front. Plant Sci. 2016, 7, 177. [Google Scholar] [CrossRef] [PubMed]
  12. Du, L.; Ali, G.S.; Simons, K.A.; Hou, J.; Yang, T.; Reddy, A.S.N.; Poovaiah, B.W. Ca2+/calmodulin regulates salicylic-acid-mediated plant immunity. Nature 2009, 457, 1154–1158. [Google Scholar] [CrossRef] [PubMed]
  13. Galon, Y.; Nave, R.; Boyce, J.M.; Nachmias, D.; Knight, M.R.; Fromm, H. Calmodulin-binding transcription activator (CAMTA) 3 mediates biotic defense responses in Arabidopsis. FEBS Lett. 2008, 582, 943–948. [Google Scholar] [CrossRef] [PubMed]
  14. Kim, Y.; Park, S.; Gilmour, S.J.; Thomashow, M.F. Roles of CAMTA transcription factors and salicylic acid in configuring the low-temperature transcriptome and freezing tolerance of Arabidopsis. Plant J. 2013, 75, 364–376. [Google Scholar] [CrossRef] [PubMed]
  15. Kim, Y.S.; An, C.; Park, S.; Gilmour, S.J.; Wang, L.; Renna, L.; Brandizzi, F.; Grumet, R.; Thomashow, M.F. CAMTA-mediated regulation of salicylic acid immunity pathway genes in Arabidopsis exposed to low temperature and pathogen infection. Plant Cell 2017, 29, 2465–2477. [Google Scholar] [CrossRef]
  16. Wildermuth, M.C.; Dewdney, J.; Wu, G.; Ausubel, F.M. Isochorismate synthase is required to synthesize salicylic acid for plant defence. Nature 2001, 414, 562–565. [Google Scholar] [CrossRef]
  17. Kim, Y.; Gilmour, S.J.; Chao, L.; Park, S.; Thomashow, M.F. Arabidopsis CAMTA transcription factors regulate pipecolic acid biosynthesis and priming of immunity genes. Mol. Plant 2020, 13, 157–168. [Google Scholar] [CrossRef]
  18. Sun, T.; Huang, J.; Xu, Y.; Verma, V.; Jing, B.; Sun, Y.; Orduna, A.R.; Tian, H.; Huang, X.; Xia, S.; et al. Redundant CAMTA transcription factors negatively regulate the biosynthesis of salicylic acid and N-Hydroxypipecolic acid by modulating the expression of SARD1 and CBP60g. Mol. Plant 2020, 13, 144–156. [Google Scholar] [CrossRef]
  19. Kidokoro, S.; Yoneda, K.; Takasaki, H.; Takahashi, F.; Shinozaki, K.; Yamaguchi-Shinozaki, K. Different cold-Signaling pathways function in the responses to rapid and gradual decreases in temperature. Plant Cell 2017, 29, 760–774. [Google Scholar] [CrossRef]
  20. Pandey, N.; Ranjan, A.; Pant, P.; Tripathi, R.K.; Ateek, F.; Pandey, H.P.; Patre, U.V.; Sawant, S.V. CAMTA 1 regulates drought responses in Arabidopsis thaliana. BMC Genom. 2013, 14, 216. [Google Scholar] [CrossRef]
  21. Galon, Y.; Aloni, R.; Nachmias, D.; Snir, O.; Feldmesser, E.; Scrase-Field, S.; Boyce, J.M.; Bouché, N.; Knight, M.R.; Fromm, H. Calmodulin-Binding transcription activator 1 mediates auxin signaling and responds to stresses in Arabidopsis. Planta 2010, 232, 165–178. [Google Scholar] [CrossRef] [PubMed]
  22. Shkolnik, D.; Finkler, A.; Pasmanik-Chor, M.; Fromm, H. Calmodulin-binding transcription activator 6: A key regulator of Na+ homeostasis during germination. Plant Physiol. 2019, 180, 1101–1118. [Google Scholar] [CrossRef] [PubMed]
  23. Noman, M.; Aysha, J.; Ketehouli, T.; Yang, J.; Du, L.; Wang, F.; Li, H. Calmodulin binding transcription activators: An interplay between calcium signalling and plant stress tolerance. J. Plant Physiol. 2021, 256, 153327. [Google Scholar] [CrossRef] [PubMed]
  24. Shen, C.; Yang, Y.; Du, L.; Wang, H. Calmodulin-binding transcription activators and perspectives for applications in biotechnology. Appl. Microbiol. Biotechnol. 2015, 99, 10379–10385. [Google Scholar] [CrossRef]
  25. Li, X.; Huang, L.; Zhang, Y.; Ouyang, Z.; Hong, Y.; Zhang, H.; Li, D.; Song, F. Tomato SR/CAMTA transcription factors SlSR1 and SlSR3L negatively regulate disease resistance response and SlSR1L positively modulates drought stress tolerance. BMC Plant Biol. 2014, 14, 286. [Google Scholar] [CrossRef]
  26. Shangguan, L.; Wang, X.; Leng, X.; Liu, D.; Ren, G.; Tao, R.; Zhang, C.; Fang, J. Identification and bioinformatic analysis of signal responsive/calmodulin-binding transcription activators gene models in Vitis vinifera. Mol. Biol. Rep. 2014, 41, 2937–2949. [Google Scholar] [CrossRef]
  27. Leng, X.; Han, J.; Wang, X.; Zhao, M.; Sun, X.; Wang, C.; Fang, J. Characterization of a calmodulin-binding transcription factor from Strawberry (Fragaria × ananassa). Plant Genome 2015, 8. [Google Scholar] [CrossRef]
  28. Zhang, J.; Pan, X.; Ge, T.; Yi, S.; Xie, R. Genome-wide identification of citrus CAMTA genes and their expression analysis under stress and hormone treatments. J. Hortic. Sci. Biotechnol. 2018, 94, 331–340. [Google Scholar] [CrossRef]
  29. Meer, L.; Mumtaz, S.; Labbo, A.M.; Khan, M.J.; Sadiq, I. Genome-wide identification and expression analysis of calmodulin-binding transcription activator genes in banana under drought stress. Sci. Hortic. 2019, 244, 10–14. [Google Scholar] [CrossRef]
  30. Iqbal, Z.; Iqbal, M.S.; Sangpong, L.; Khaksar, G.; Sirikantaramas, S.; Buaboocha, T. Comprehensive genome-wide analysis of calmodulin-binding transcription activator (CAMTA) in Durio zibethinus and identification of fruit ripening-associated DzCAMTAs. BMC Genom. 2021, 22, 743. [Google Scholar] [CrossRef]
  31. Zhu, H.; Xia, R.; Zhao, B.; An, Y.Q.; Dardick, C.D.; Callahan, A.M.; Liu, Z. Unique expression, processing regulation, and regulatory network of peach (Prunus persica) miRNAs. BMC Plant Biol. 2012, 12, 149. [Google Scholar] [CrossRef] [Green Version]
  32. Zhang, B.; Xi, W.; Wei, W.; Shen, J.; Ferguson, I.; Chen, K. Changes in aroma-related volatiles and gene expression during low temperature storage and subsequent shelf-Life of peach fruit. Postharvest Biol. Technol. 2011, 60, 7–16. [Google Scholar] [CrossRef]
  33. Papavasileiou, A.; Tanou, G.; Samaras, A.; Samiotaki, M.; Molassiotis, A.; Karaoglanidis, G. Proteomic analysis upon peach fruit infection with Monilinia fructicola and M. laxa identify responses contributing to brown rot resistance. Sci Rep. 2020, 10, 7807. [Google Scholar] [CrossRef]
  34. Liu, J.-H.; Peng, T.; Dai, W. Critical cis-acting elements and interacting transcription factors: Key players associated with abiotic stress responses in plants. Plant Mol. Biol. Report. 2014, 32, 303–317. [Google Scholar] [CrossRef]
  35. Yuan, P.; Tanaka, K.; Poovaiah, B.W. Calmodulin-Binding transcription activator AtSR1/CAMTA3 fine-tunes plant immune response by transcriptional regulation of the salicylate receptor NPR1. Plant Cell Environ. 2021, 44, 3140–3154. [Google Scholar] [CrossRef]
  36. Kou, J.; Wei, Y.; He, X.; Xu, J.; Xu, F.; Shao, X. Infection of post-harvest peaches by Monilinia fructicola accelerates sucrose decomposition and stimulates the Embden-Meyerhof-Parnas pathway. Hortic. Res. 2018, 5, 46. [Google Scholar] [CrossRef]
  37. Terry, L.A.; Joyce, D.C. Elicitors of induced disease resistance in postharvest horticultural crops: A brief review. Postharvest Biol. Technol. 2004, 32, 1–13. [Google Scholar] [CrossRef]
  38. Biggs, A.R.; El-Kholi, M.M.; El-Neshawy, S.; Nickerson, R. Effects of calcium salts on growth, polygalacturonase activity, and infection of peach fruit by Monilinia fructicola. Plant Dis. 1997, 81, 399–403. [Google Scholar] [CrossRef]
  39. Elmer, P.A.G.; Spiers, T.M.; Wood, P.N. Effects of pre-harvest foliar calcium sprays on fruit calcium levels and brown rot of peaches. Crop Prot. 2007, 26, 11–18. [Google Scholar] [CrossRef]
  40. Manganaris, G.; Vasilakakis, M.; Diamantidis, G.; Mignani, I. The effect of preharvest calcium sprays on quality attributes, physicochemical aspects of cell wall components and susceptibility to brown rot of peach fruits. Sci. Hortic. 2013, 107, 43–50. [Google Scholar] [CrossRef]
  41. Yang, T.; Poovaiah, B.W. A calmodulin-binding/CGCG box DNA-binding protein family involved in multiple signaling pathways in plants. J. Biol. Chem. 2002, 277, 45049–45058. [Google Scholar] [CrossRef] [PubMed] [Green Version]
  42. Liu, H.; Cao, X.; Liu, X.; Xin, R.; Wang, J.; Gao, J.; Wu, B.; Gao, L.; Xu, C.; Zhang, B.; et al. UV-B irradiation differentially regulates terpene synthases and terpene content of peach. Plant Cell Environ. 2017, 40, 2261–2275. [Google Scholar] [CrossRef] [PubMed]
  43. Zhao, Y.; Dong, W.; Wang, K.; Zhang, B.; Allan, A.C.; Lin-Wang, K.; Chen, K.; Xu, C. Differential sensitivity of fruit pigmentation to ultraviolet light between two peach cultivars. Front. Plant Sci. 2017, 8, 1552. [Google Scholar] [CrossRef] [PubMed]
  44. Noman, M.; Jameel, A.; Qiang, W.D.; Ahmad, N.; Liu, W.C.; Wang, F.W.; Li, H.Y. Overexpression of GmCAMTA12 enhanced drought tolerance in Arabidopsis and soybean. Int. J. Mol. Sci. 2019, 20, 4849. [Google Scholar] [CrossRef]
  45. Jiang, X.; Hoehenwarter, W.; Scheel, D.; Lee, J. Phosphorylation of the CAMTA3 transcription factor triggers its destabilization and nuclear export. Plant Physiol. 2020, 184, 1056–1071. [Google Scholar] [CrossRef]
  46. Wu, B.; Gao, L.; Gao, J.; Xu, Y.; Liu, H.; Cao, X.; Zhang, B.; Chen, K. Genome-wide identification, expression patterns, and functional analysis of UDP glycosyltransferase family in peach (Prunus persica L. Batsch). Front. Plant Sci. 2017, 8, 389. [Google Scholar] [CrossRef]
  47. Cao, X.; Duan, W.; Wei, C.; Chen, K.; Grierson, D.; Zhang, B. Genome-wide identification and functional analysis of carboxylesterase and methylesterase gene families in peach (Prunus persica L. Batsch). Front. Plant Sci. 2019, 10, 1511. [Google Scholar] [CrossRef]
  48. Ren, J.; Wen, L.; Gao, X.; Jin, C.; Xue, Y.; Yao, X. DOG 1.0: Illustrator of protein domain structures. Cell Res. 2009, 19, 271–273. [Google Scholar] [CrossRef]
  49. Cao, X.; Wei, C.; Duan, W.; Gao, Y.; Kuang, J.; Liu, M.; Chen, K.; Klee, H.; Zhang, B. Transcriptional and epigenetic analysis reveals that NAC transcription factors regulate fruit flavor ester biosynthesis. Plant J. 2021, 106, 785–800. [Google Scholar] [CrossRef]
  50. Cai, J.; Qin, G.; Chen, T.; Tian, S. The mode of action of remorin1 in regulating fruit ripening at transcriptional and post-transcriptional levels. New Phytol. 2018, 219, 1406–1420. [Google Scholar] [CrossRef]
  51. Zhang, B.; Chen, K.; Bowen, J.; Allan, A.; Espley, R.; Karunairetnam, S.; Ferguson, I. Differential expression within the LOX gene family in ripening kiwifruit. J. Exp. Bot. 2006, 57, 3825–3836. [Google Scholar] [CrossRef] [PubMed] [Green Version]
  52. Zhang, B.; Tieman, D.M.; Jiao, C.; Xu, Y.; Chen, K.; Fei, Z.; Giovannoni, J.J.; Klee, H.J. Chilling-induced tomato flavor loss is associated with altered volatile synthesis and transient changes in DNA methylation. Proc. Natl. Acad. Sci. USA 2016, 113, 12580–12585. [Google Scholar] [CrossRef] [PubMed]
  53. Chen, L.; Wang, W.-S.; Wang, T.; Meng, X.-F.; Chen, T.-T.; Huang, X.-X.; Li, Y.-J.; Hou, B.-K. Methyl salicylate glucosylation regulates plant defense signaling and systemic acquired resistance. Plant Physiol. 2019, 180, 2167–2181. [Google Scholar] [CrossRef] [PubMed]
  54. The International Peach Genome Initiative; Verde, I.; Abbott, A.G.; Scalabrin, S.; Jung, S.; Shu, S.; Marroni, F.; Zhebentyayeva, T.; Dettori, M.T.; Grimwood, J.; et al. The high-quality draft genome of peach (Prunus persica) identifies unique patterns of genetic diversity, domestication and genome evolution. Nat. Genet. 2013, 45, 487–494. [Google Scholar] [CrossRef]
  55. Verde, I.; Jenkins, J.; Dondini, L.; Micali, S.; Pagliarani, G.; Vendramin, E.; Paris, R.; Aramini, V.; Gazza, L.; Rossini, L.; et al. The Peach v2.0 release: High-resolution linkage mapping and deep resequencing improve chromosome-scale assembly and contiguity. BMC Genomics 2017, 18, 225. [Google Scholar] [CrossRef]
  56. Cao, K.; Yang, X.; Li, Y.; Zhu, G.; Fang, W.; Chen, C.; Wang, X.; Wu, J.; Wang, L. New high-quality peach (Prunus persica L. Batsch) genome assembly to analyze the molecular evolutionary mechanism of volatile compounds in peach fruits. Plant J. 2021, 108, 281–295. [Google Scholar] [CrossRef] [PubMed]
  57. Lian, X.; Zhang, H.; Jiang, C.; Gao, F.; Yan, L.; Zheng, X.; Cheng, J.; Wang, W.; Wang, X.; Ye, X.; et al. De novo chromosome-level genome of a semi-dwarf cultivar of Prunus persica identifies the aquaporin PpTIP2 as responsible for temperature-sensitive semi-dwarf trait and PpB3-1 for flower type and size. Plant Biotechnol. J. 2021, 20, 886–902. [Google Scholar] [CrossRef]
  58. Zhang, A.; Zhou, H.; Jiang, X.; Han, Y.; Zhang, X. The draft genome of a flat peach (Prunus persica L. cv. ‘124 Pan’) provides insights into its good fruit flavor traits. Plants 2021, 10, 538. [Google Scholar] [CrossRef]
Figure 1. Phylogenetic relationship and conserved protein domains between peach and Arabidopsis CAMTAs. (A) Phylogenetic analysis of the peach and Arabidopsis CAMTAs. Peach CAMTAs were marked with pink dots. (B) Protein conserved domain composition in peach and Arabidopsis CAMTAs. Different protein domains were indicated in different colors. (C) Alignment of the CaMBD sequence between peach and Arabidopsis CAMTAs. The sequence logo of the functional residues in CaMBD domain of these CAMTAs was displayed below.
Ijms 23 10500 g001
Figure 2. Distributions of exon-intron and chromosomal locations of peach CAMTA genes. (A) Distributions of exon-intron of peach CAMTA genes. Blue boxes represent UTR regions, black lines represent introns and yellow boxes represent exons. The numbers on introns indicate their phase type: Phase 0 intron does not disrupt a codon, phase 1 intron disrupts a codon between the first and second bases, and phase 2 intron disrupts a codon between the second and third bases. (B) Chromosome distributions of peach CAMTA genes. The chromosome number was shown at the top of each chromosome.
Ijms 23 10500 g002
Figure 3. Analysis of cis-acting regulatory elements of peach CAMTAs. (A) Distribution of different cis-acting motifs for peach CAMTAs promoter region. Counts of each cis-acting motif were shown in the column diagram on the right. The cis-acting motifs were classified into three major groups depending on their functional annotation. (B) The number of predicted cis-acting elements in promoter region of peach CAMTA genes.
Ijms 23 10500 g003
Figure 4. Expression patterns of peach CAMTA genes responding to abiotic stresses. (A) Cold treatment. (B) UV-B treatment. (C) MeJA treatment. Means and standard errors were calculated from three replicates. Different letters (p < 0.05) and asterisks (*, p < 0.05; **, p < 0.01) above the bars represent significant differences.
Ijms 23 10500 g004
Figure 5. Expression of peach CAMTA genes in different organs and during fruit different stage. (A) Expression pattern of peach CAMTA genes in different organs including leaf (green), flower (yellow), and ripe peach fruit (red). (B) Expression pattern of peach CAMTA genes of different stages in peach fruit. Means and standard errors were calculated from three replicates. Different letters above the bars represent significant differences (p < 0.05).
Ijms 23 10500 g005
Figure 6. Subcellular localization of peach CAMTAs in Nicotiana benthamiana leaves. (A) Subcellular localization of PpCAMTA1, PpCAMTA2, PpCAMTA3. (B) Subcellular localization of PpCAMTA4, PpCAMTA5. GFP, GFP channel; Nucleus–RFP, transgenic tobacco with red fluorescence in the nucleus; mCherry-H+-ATPase, mCherry signal of H+-ATPase with red fluorescence as a marker in the plasma membrane; Merge, merged image of the GFP and nucleus–RFP or mCherry channels; Bright-field, light microscopy image; bars = 20 µm.
Ijms 23 10500 g006
Figure 7. Overexpression of PpCAMTA1/2/3 in Arabidopsis camta2,3 mutant. (A) Schematic diagram of modified vector. (B) Photographs of the indicated plants grown at 22 °C for 28 days. WT: wild type; camta2,3: double mutant of camta2 and camta3; OE-PpCAMTA1, OE-PpCAMTA2 and OE-PpCAMTA3: overexpression of PpCAMTA1, PpCAMTA2 and PpCAMTA3 in the background of Arabidopsis camta2,3 mutant driven by AtCAMTA3 promoter, respectively.
Ijms 23 10500 g007
Figure 8. Overexpression of PpCAMTA1 in camta2,3 mutants inhibited SA level and SA pathway genes expression levels. (A) Free SA content in 4-week-old wild type, camta2,3 and OE-PpCAMTA1 plants. (B) Transcript levels for SA synthesis related gene AtICS1. (C) Transcript levels for SA pathway transcription factors. Means and standard errors were calculated from three replicates. Different letters above the bars represent significant differences (p < 0.05).
Ijms 23 10500 g008
Figure 9. Overexpression of PpCAMTA1 in camta2,3 mutant affects plant response to Pst DC3000. (A) Photos of 4-week-old plants leaves at 3 days post-inoculation (3 dpi) with the spray of Pst DC3000. (B) Transcript level of PR1 after 1 dpi with the spray of Pst DC3000. Means and standard errors were calculated from three replicates. Different letters above the bars represent significant differences (p < 0.05).
Ijms 23 10500 g009
Table 1. Physicochemical properties of peach CAMTA proteins.
Gene NameLocus IDLength (aa)MW
(kD)
pIIIAliphatic IndexGRAVY
PpCAMTA1Prupe.1G1087001012113.286.6942.2076.91−0.522
PpCAMTA2Prupe.8G0603001086121.555.6944.8478.84−0.514
PpCAMTA3Prupe.6G1877001131126.595.6939.5477.29−0.540
PpCAMTA4Prupe.1G224000994110.915.5844.5272.61−0.578
PpCAMTA5Prupe.1G122800914103.206.6244.5484.32−0.422
Notes: Grand average of hydropathicity (GRAVY); Instability index (II).
Table 2. The number of CAMTA genes in fruit crops from Rosaceae family.
Fruit NameOrganismNumber of CAMTAs
StrawberryFragaria x ananassa16
PearPyrus pyrifolia10
AppleMalus domestica8
Sweet cherryPrunus avium5
AlmondPrunus dulcis5
PeachPrunus persica5
ApricotPrunus armeniaca4
Publisher’s Note: MDPI stays neutral with regard to jurisdictional claims in published maps and institutional affiliations.

