Abstract
Although obesity is commonly associated with numerous cardiometabolic pathologies, some people with obesity are resistant to detrimental effects of excess body fat, which constitutes a condition called “metabolically healthy obesity” (MHO). Metabolic features of MHO that distinguish it from metabolically unhealthy obesity (MUO) include differences in the fat distribution, adipokine types, and levels of chronic inflammation. Murine models are available that mimic the phenotype of human MHO, with increased adiposity but preserved insulin sensitivity. Clinically, there is no established definition of MHO yet. Despite the lack of a uniform definition, most studies describe MHO as a particular case of obesity with no or only one metabolic syndrome components and lower levels of insulin resistance or inflammatory markers. Another clinical viewpoint is the dynamic and changing nature of MHO, which substantially impacts the clinical outcome. In this review, we explore the pathophysiology and some murine models of MHO. The definition, variability, and clinical implications of the MHO phenotype are also discussed. Understanding the characteristics that differentiate people with MHO from those with MUO can lead to new insights into the mechanisms behind obesity-related metabolic derangements and diseases.
1. Introduction
Obesity is related to a decreased life expectancy, mostly because obese individuals have a higher risk of developing type 2 diabetes, cardiovascular disease (CVD), and cancer [1,2]. It has become a major public health concern as its prevalence has been increasing globally. In addition to the implications of obesity at the individual level, the obesity pandemic may impose a substantial health burden on society.
However, not all obese people have an increased risk of mortality, suggesting that there is a subpopulation of healthy obese individuals, i.e., those with so-called “metabolically healthy obesity” (MHO) [3,4]. MHO is distinguished by the absence of metabolic disturbances, including insulin resistance, type 2 diabetes, hypertension, and dyslipidemia, commonly associated with a chronic inflammatory state [4,5]. In this paper, we compare the pathophysiology of MHO with that of metabolically unhealthy obesity (MUO), and then describe some animal models of MHO based on the physiology and features of this phenotype. We will also address the concept of MHO and its clinical consequences given the unstable nature of this phenotype.
2. Main Pathophysiology of MHO Versus MUO
The clinical and pathophysiologic aspects that have been associated with MHO and MUO are depicted in Figure 1. Despite the fact that the precise mechanism behind the development of MHO remains unknown, numerous plausible pathways have been proposed in both human and animal research. These include altered adipokine secretion, suppressed inflammation and fibrosis, and a particular distribution pattern of fat tissue types, such as the accumulation of more subcutaneous but less visceral and ectopic fat.
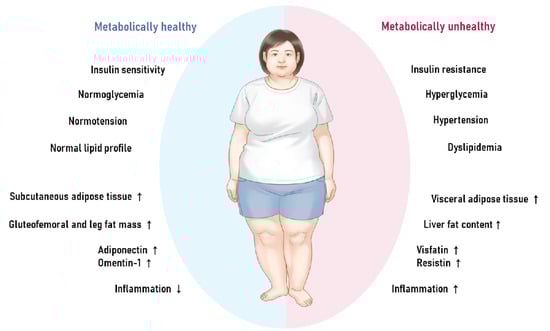
Figure 1.
The characteristics and physiology of metabolically healthy obesity versus metabolically unhealthy obesity.
2.1. Body Composition and Fat Distribution
In addition to functioning as an energy reservoir, adipose tissue is a hormonally active organ with specific biochemical properties that influence metabolic pathways. White adipose tissue (WAT) and brown adipose tissue (BAT) are the two primary forms of adipose tissue (BAT). WAT is primarily responsible for energy storage, whereas BAT is primarily responsible for energy expenditure via non-shivering thermogenesis in the mitochondria [6]. WAT depots can be divided into subcutaneous adipose tissue (SAT), which is the adipose tissue beneath the skin, and visceral adipose tissue (VAT) lining internal organs [7]. The accumulation of abdominal, visceral, and ectopic fat leads to insulin resistance and an unfavorable cardiometabolic profile [8,9,10,11,12]. Individuals with MHO are distinguished by higher levels of SAT and lower levels of VAT, and decreased fat deposition in liver and skeletal muscle, compared with MUO subjects with comparable levels of total fat mass and BMI [13]. In contrast, widespread VAT deposition, as measured by computed tomography, is linked to MUO, which is characterized by hyperinsulinemia, glucose intolerance, and atherogenic dyslipidemia [13].
According to several studies, it is indisputable that increased visceral adiposity independently correlates with a higher cardiometabolic risk [14,15,16,17,18,19]. In contrast, the metabolic profile of subcutaneous fat is more favorable [14,20]. Using whole-body MRI and spectroscopy, the German Tübingen diabetes family study evaluated total, visceral, subcutaneous abdominal, gluteofemoral and leg fat mass, and liver fat content to distinguish between individuals with healthy and unhealthy obesity [20]. In this study, a lower proportion of gluteofemoral fat mass and leg fat mass was found to be the most reliable predictor of a metabolically unhealthy condition. Increased gluteofemoral and leg fat mass and higher insulin sensitivity and preserved insulin secretion determined a metabolically healthy status while increased visceral fat mass, increased subcutaneous abdominal fat mass, and a high liver fat content contributed to a metabolically unhealthy phenotype [20,21]. Another German study with 314 white people found that the proportion of liver fat is a significant predictor of metabolically benign obesity [20]. Non-alcoholic liver disease (NAFLD) is strongly associated with the metabolically unhealthy obesity phenotype, although some subtypes of NAFLD with a stronger hepatic genetic component are not associated with insulin resistance and cardiometabolic risk [22,23]. Collectively, assessment of body fat distribution may be the key to understanding the pathophysiology linking obesity, metabolic health, and cardiometabolic risk.
2.2. Alterations in the Adipokine Phenotype
Adiponectin is the most extensively researched adipokine associated with MHO. In both men and women, adiponectin, the most abundant protein released by adipose tissue, is inversely correlated with percentage body fat and directly correlated with insulin sensitivity [24]. Plasma adiponectin levels in patients with MHO are reported to be higher than those in patients with MUO [25,26,27,28]. The reasons behind the lower adiponectin levels in patients with MUO are unknown but may be related to the chronic hyperinsulinemia observed in MUO, which suppresses adiponectin production in adipose tissue [29,30], resulting in a positive feedback cycle where decreased adiponectin secretion causes insulin resistance and increased insulin resistance, in turn, causes decreased adiponectin levels [3]. In addition to adiponectin, Sanidasa et al. investigated the cardioprotective (omentin-1) and non-cardioprotective (visfatin, resistin, chemerin) hormones in MHO and MUO [31]. The cardioprotective adipokines omentin-1 [32,33] and adiponectin were found to be higher in cases of MHO, but the non-cardioprotective adipokines visfatin and resistin [32,34,35] were found to be lower. Mateusz Lejawa et al. [36] recently observed some differences in the adipokine profiles between MHO and MUO in the cohort from the Metabolic and Genetic Profiling of Young Adults with and without a Family History of Premature Coronary Heart Disease (MAGNETIC) study. According to their findings, adipsin is linked only to MHO and not to MUO. Furthermore, markers such as ghrelin and PAI-1 are solely associated with MUO not with MHO [36]. Further research is required to determine the precise involvement of those adipokines in the cardiometabolic fates of MHO and MUO.
2.3. Adipose Tissue Inflammation and Fibrosis
Chronic inflammation, particularly in adipose tissue, has been recognized as the main pathophysiology of obesity-related comorbidities, where insulin resistance has a crucial role [3,37,38]. Previous research has shown that people with MUO exhibit higher levels of circulating inflammation markers such as C-reactive protein, plasminogen activator inhibitor-1 (PAI-1), IL-6, and TNF-α, compared with those with MHO [39,40,41,42,43,44,45]. However, a few studies [46,47,48] provided contradictory results, with no difference between the two groups. Such discrepancies can be attributed to inconsistencies in the definitions of MHO and MUO, differences in the sets of markers studied, or the relatively small number of participants. It has been reported that patients with MUO, compared with those with MHO, have higher M1-like (proinflammatory) macrophages and proinflammatory CD4+ T cells in adipose tissue [39,49,50,51,52,53,54]. In addition to inflammation, fibrosis in adipose tissue has also been postulated as an obesity-linked pathology [3]. Obese patients exhibit higher expression levels of collagen I, IV, V, and VI genes, and increased fibrosis, notably pericellular fibrosis in adipose tissue [55,56,57,58,59]. Adipose tissue collagen gene expression and collagen levels are also inversely correlated with insulin sensitivity in obese patients and decrease with weight loss [60,61,62,63]. Recently, Jun Yoshino et al. showed that adipose tissue expression of connective tissue growth factor is positively correlated with body fat mass and inversely correlated with insulin sensitivity indices [64]. These findings corroborate the hypothesis that adipose tissue fibrosis is linked to MUO, as observed in animal models [65].
3. Animal Models of MHO
Obesity models using mice have provided invaluable insights into obesity in humans and associated metabolic consequences, such as metabolically protected obesity. In this section, we introduce genetic mouse models harboring some characteristics of MHO (Table 1).

Table 1.
Murine models representing the human metabolically healthy obesity phenotype.
3.1. Adiponectin Transgenic Mouse
Adiponectin is an anti-inflammatory, insulin-sensitizing adipokine expressed by adipocytes that improves lipid and glucose metabolism via several mechanisms. Kim et al. overexpressed adiponectin in transgenic ob/ob mice, resulting in a 2–3 fold increase in steady-state levels of adiponectin complexes in plasma [66]. These animals exhibit higher levels of PPAR-gamma target gene expression and lower levels of macrophage infiltration in adipose tissue and suppressed systemic inflammation [66]. As a result, the transgenic mice were morbidly obese, with considerably more adipose tissue than their ob/ob littermates, resulting in an intriguing paradox of increased fat mass paired with improved insulin sensitivity [66]. Overexpression of adiponectin results in the development of hyper-obese animals that exhibit subcutaneous fat as the most abundant type of adipose tissue, a larger number of adipocytes with a much smaller average cell size, reduced inflammation, and metabolic fitness, all of which are specific features of MHO [66].
3.2. Txnip Knockout Mice
Thioredoxin-interacting protein (Txnip), a cellular oxidative stress regulator, is activated by hyperglycemia and limits glucose absorption into fat and muscle tissues. Txnip knockout mice acquire considerably greater adipose mass, according to Chutkow et al., due to elevated levels of calorie intake and adipogenesis [67]. Despite having more fat, compared with the controls, Txnip knockout mice are significantly more insulin sensitive and exhibit enhanced glucose transport in both adipose and skeletal muscle tissues [67]. Txnip deficiency also directly affects PPAR expression and activity, implying Txnip is a novel mediator of insulin resistance and a regulator of adipogenesis. Txnip knockout mice are, thus, a promising mouse model for human MHO.
3.3. Tumor Progression Locus 2 (TPL2) Knockout Mice
Tumor progression locus 2 (TPL2) has been identified as an important modulator of immune responses that transmits inflammatory signals to downstream effectors, thereby modulating the generation and function of inflammatory cells [72]. TPL2 is activated by Toll-like receptor (TLR) ligands; cytokines, including tumor necrosis factor (TNF) family and interleukin (IL)-1β; and several chemokines [73,74]. Thus, knocking out TPL2 prevents cytokines (TNF- and IL-1) and proinflammatory stimuli (via lipopolysaccharide) from activating ERK and JNK [75,76]. In this context, TPL2 is in a unique position to integrate various inflammatory signaling pathways involved in the development and progression of obesity-related complications [68]. A study using a diet-induced obesity model with or without TPL2 knockout demonstrated that TPL2 deletion reduces peripheral inflammation and hepatic steatosis, and improves whole-body insulin resistance in obese mice, mimicking MHO observed in humans [68].
3.4. COL6 Knockout Mice
As previously noted, recent research suggests that excessive collagen and fibrosis exacerbate inflammatory and metabolic pathologies in obese patients. Particularly, collagen VI (COL6) is a highly enriched extracellular matrix component in adipose tissue [69]. Tayeba Khan et al. showed that obese (ob/ob) mice with COL6 knockdown, compared with ob/ob mice with intact COL6 expression, resulted in the uninhibited expansion of individual adipocytes but was paradoxically associated with substantial improvements in energy homeostasis such as better glucose tolerance and lower levels of circulating triacylglycerol after lipid challenge [69]. These findings indicate a possible role of COL6 in modulating adipocyte physiology and suggest COL6-KO mice as a potential murine model of human MHO.
3.5. Adipose-Specific GLUT4 Overexpression (AG4OX) Mice
GLUT4, the major insulin-responsive glucose transporter, plays a key role in systemic glucose metabolism in adipose tissue [77,78,79]. In insulin-resistant conditions, GLUT4 is downregulated in adipose tissue but not in muscle, the primary site of insulin-stimulated glucose uptake [77]. Moreover, mice with adipose-specific GLUT4 overexpression (AG4OX) have improved glucose homeostasis [79] while mice with adipose-specific GLUT4 knockout (AG4KO) have insulin resistance and type 2 diabetes [78]. Herman et al. revealed that AG4OX animals are more obese and insulin-sensitive than wild-type mice, which is consistent with the MHO phenotype [70]. In their study, the authors further showed that ChREBP, a glucose-responsive transcription factor that regulates fatty acid synthesis and glycolysis [80], is highly regulated by GLUT4 in adipose tissue and is a key determinant of systemic insulin sensitivity and glucose homeostasis, indicating that adipose ChREBP may be a novel strategy for preventing and treating obesity-related metabolic dysfunction [70].
3.6. MitoNEET Overexpression Mice
MitoNEET has been identified as a distinct dimeric mitochondrial membrane target that is crosslinked to pioglitazone [81,82]. MitoNEET was named based on its C-terminal amino acid sequence, AsnGluGluThr (NEET), which is found in the outer mitochondrial membrane [81]. MitoNEET achieves its effects on cellular and systemic metabolic homeostasis by acting as a potent iron content regulator in mitochondria. Kusminski et al. [71] created an adipose-specific transgenic model, an inducible tissue-specific overexpression system, and an inducible constitutive mitoNEET knockdown. The overexpression of mitoNEET disrupted the cellular energy balance by impairing mitochondrial activity, resulting in a decrease in oxidation and a compensatory increase in the cellular energy balance. This resulted in persistent adipose tissue development, and the mice in this model became extremely obese. Despite their obesity, mitoNEET overexpression during high caloric intake resulted in system-wide improvements in insulin sensitivity, providing a model of a metabolically healthy, obese state that minimizes lipotoxicity in tissues that are prone to storing lipids during excess caloric intake [71].
4. Definition and Concept of MHO
4.1. Clinical Definition of MHO
Currently, there is no internationally adopted standard for identifying MHO, and more than 30 distinct criteria have been employed to operationalize the symptoms in research [3,83]. Some criteria used to define metabolically healthy obesity are shown in Table 2. This may explain why the prevalence, stability, and clinical effects of MHO differ from study to study, contributing to an ongoing unresolved dispute [83]. Despite differences in definitions, some common elements of MHO are repeatedly empathized: healthy obesity denotes an absence of metabolic abnormalities in obese individuals, such as type 2 diabetes, dyslipidemia, and hypertension. When more data is available, measures of insulin resistance, such as homeostasis model assessment (HOMA) and inflammatory markers, are also utilized [4].
Table 2.
Various criteria used to define metabolically healthy obesity in clinical investigations.
4.2. Dynamic Nature of MHO
Another barrier to determining the outcome of the MHO phenotype is its dynamic and changing nature. The health condition of a subject may change from metabolically healthy to metabolically unhealthy and vice versa. As a result, the clinical implications of MHO should be examined from the perspective of metabolic health being a transitory rather than permanent state. Approximately one-third to one-half of people with MHO progress to a metabolically unhealthy condition over time [88,89,90,91,92]. A healthier lifestyle; stronger incretin response to meals; less abdominal, visceral, and ectopic fat deposition; lower levels of inflammation; and insulin sensitivity are postulated attributes that help preserve a metabolically healthy state in individuals with MHO [4]. Maintaining these characteristics may therefore avoid the transition from MHO to MUO. These findings also imply that MHO is a dynamic condition that should be examined across time.
5. Clinical Outcomes of MHO and Possible Mechanisms
The predictive significance of MHO is a hotly debated topic that confronts significant challenges due to its varied definitions across studies and dynamic nature, as discussed above. In this context, our research team has investigated the effects of MHO, taking into account its phenotypic shift throughout time. In this section, we describe reported findings regarding the role of MHO in several outcomes, including mortality, cardiovascular risk, chronic kidney disease (CKD), dementia, and colorectal cancer. We also discuss some potential pathways for explaining the observed outcomes in patients with MHO (Table 3).
Table 3.
Clinical outcomes of metabolically healthy obesity versus unhealthy obesity.
5.1. Mortality and Cardiovascular Event Risk
Obesity is a well-known risk factor for cardiovascular events (CVEs) and mortality. Although CVE risk is higher in patients with MHO than in metabolically healthy individuals with normal body weight, the risk is substantially lower in individuals with MHO, compared to those with MUO [95,96,102]. We analyzed the mortality and cardiovascular event rates in 514,866 participants from the Korean National Health Insurance Service–Health Examination Cohort [94] and found that the risk of CVE in the baseline MHO group was higher than that in the metabolically healthy nonobesity (MHNO) group (hazard ratio (HR), 1.14; 95% confidence interval (CI), 1.05–1.24). However, the all-cause mortality in the MHO group was lower than that in the MHNO group (HR, 0.86; 95% CI, 0.79–0.93). Among baseline MHO subjects, the risk of CVE was significantly higher in those who transitioned from MHO to MUO with a multivariate-adjusted HR of 1.24 (95% CI, 1.00–1.54), suggesting that weight loss and progression to a metabolically unhealthy state are the reasons behind the significant increase in mortality.
The concept of the “obesity paradox” is rooted in the fact a higher BMI is associated with high incidence of type 2 diabetes, hypertension, dyslipidemia, and cardiovascular disease (CVD), obese individuals with these conditions may survive longer than leaner individuals [105,106]. Similarly, individuals classified as normal weight or underweight may have a poorer prognosis than overweight persons with respect to CVD, a condition termed the “lean paradox” [107]. Although the mechanism has not been fully elucidated, a progressive catabolic state and loss of lean muscle mass may result in improved outcomes for obese people and poorer ones for lean individuals [107]. Moreover, because obesity is a well-known cardiometabolic risk factor, more vigorous diagnostic testing and therapeutic interventions in the obese population may result in earlier testing and diagnosis, which may lead to better survival [107,108].
5.2. Chronic Kidney Disease
Obesity is a known risk factor for CKD and a serious public health issue globally [97,109,110]. Since obesity-induced metabolic disturbances, such as hypertension, insulin resistance, hyperglycemia, and dyslipidemia, are well-known factors in the development of CKD [111], the direct link between CKD and obesity or obesity-induced metabolic disturbances is unknown [4]. With regard to the risk of CKD in MHO subjects, prior studies have reported contradictory results [98,99,100,101]. In our longitudinal cohort study [112], the probability of incident CKD in the baseline MHO group was greater than that in the MHNO group (HR, 1.23; 95% CI, 1.12–1.36). Patients who converted to MHNO did not have an elevated risk (HR, 0.98; 95% CI, 0.72–1.32), whereas the stable MHO group and the groups that progressed to a metabolically unhealthy condition had a higher risk of incident CKD compared with the stable MHNO group. Although the processes by which obesity contributes to CKD are unknown, several possible explanations tying obesity to kidney disease that are independent of metabolic risk factors can be considered, including hemodynamic alterations, oxidative stress, and hormonal variables [113,114,115,116]. Obesity-induced renal impairment has been linked to changes in renal hemodynamics such as hyperfiltration, increased glomerular capillary wall tension, and podocyte stress [97,114]. Several adipokines, including leptin and adiponectin, and other adipose tissue-derived molecules, including TNF-α, IL-6, and plasminogen activator inhibitor-1, have been shown to impair renal function [115,117]. Although it is unclear whether these molecules have altered expression levels in MHO patients, these pathways may contribute to the development of incident CKD in obese individuals, particularly in those with MHO.
5.3. Dementia
Studies on the association between obesity and the development of Alzheimer’s disease (AD) indicate that midlife obesity is associated with a 1.7–2.0-fold increase in the risk of developing dementia and AD [118,119]. On the contrary, more recent publications report that being overweight or obese at old age protects against Alzheimer’s disease [120,121,122,123,124]. According to our nationwide population-based cohort study, the risk of AD is considerably reduced among people with MHO [125], which is consistent with some earlier findings [126,127]. In addition, we analyzed the risk of developing AD based on the changes in metabolic phenotype. Importantly, switching from MUO to MHO reduces the risk of AD development relative to maintaining a stable MHNO status (multivariable-adjusted HR, 0.62; 95% CI, 0.50–0.78), indicating a protective effect of MHO against AD. Several pathways are proposed to have a role in this protective effect. Insulin-like growth factor I, which has neurotrophic effects in the hippocampus [128,129,130,131], may play at least a partial role. Furthermore, adipokines released by adipose tissue, such as leptin, may also be involved [132]. Higher circulating leptin levels have been linked to a lower risk of dementia and Alzheimer’s disease, and increased brain volume [133,134,135]. As a result, altered levels of hormones and adipokines in patients with MHO may increase dementia risk, albeit further research is needed to better understand the underlying mechanisms.
5.4. Colorectal Cancer
Obesity is a well-known risk factor for CRC; however, only a few studies have investigated whether obese patients without metabolic abnormalities are at increased risk of CRC. A prospective cohort study in Korea showed that the MHO phenotype is a risk factor for CRC in men [104]. However, recently, Cao et al. used data derived from 390,575 adults from the UK Biobank and reported that even in metabolically healthy individuals, obesity was associated with increased risks of colorectal cancers [103]. Our study on a nationwide population-based cohort suggested that metabolic unhealthiness significantly contributes to incident CRC in the obese population [136]. The stable MHO group showed no increased risk of incident CRC (HR, 0.97; 95% CI, 0.83–1.14). However, the group transitioning from MHO to MUO had a higher risk of incident CRC compared with the stable MHNO group (HR, 1.34; 95% CI, 1.15–1.57). Among the patients with baseline MUO, those transitioning into MHO were not at increased risk of CRC (HR, 1.06; 95% CI, 0.91–1.25), whereas those who remained in the stable MUO group had a higher risk of incident CRC compared with those in the stable MHNO group (HR, 1.29; 95% CI, 1.19–1.41). Previously, Ko et al. reported that for advanced CRN, metabolically unhealthy status (i.e., MUNO or MUO) increased the risk but MHO did not [137]. However, MHO subjects were at an increased risk of CRN in general; based on these findings, the authors proposed that metabolically unhealthy status may be the step after simple obesity in the process of colorectal carcinogenesis via increased levels of growth factors (e.g., insulin-like growth factor or epidermal growth factor receptor) by insulin resistance, which leads to advanced cancer [137]. Therefore, chronic inflammation and disturbance of adipokines or growth factors in obesity could be potential mechanisms linking obesity and cancer, which was proposed from the studies on MHO subjects [136,137,138].
6. Summary and Conclusions
MHO is not an entirely new concept. Numerous possible mechanisms underlying MHO have been suggested, including adipose tissue distribution, inflammation and fibrosis in adipose tissue, and altered adipokine secretion. Murine models of metabolically protected obesity, with a salutary profile of adipose tissue function and energy metabolism, have provided robust insights into the human MHO phenotype. Clinically, the prognostic value of MHO is a subject of debate and the impact of MHO on obesity-related morbidity and mortality requires further investigation. Further efforts are needed to establish a unified definition of MHO to develop effective treatment strategies and to discover the pathophysiologic underpinnings of MHO.
Author Contributions
Conceptualization, C.H.J.; investigation, Y.K.C., Y.L.L. and C.H.J.; writing—original draft preparation, Y.K.C.; writing—review and editing, C.H.J. All authors have read and agreed to the published version of the manuscript.
Funding
This work was supported by the Basic Science Research Program through the National Research Foundation of Korea (NRF), funded by the Ministry of Education (grant numbers: NRF-2020R1A2C1101977: Chang Hee Jung). This work was also supported by the Basic Science Research Program through the National Research Foundation of Korea (NRF), funded by the Ministry of Education (grant numbers: 2021R1I1A3051083: Yun Kyung Cho). These funding sources had no roles in the writing of the article or the decision to submit the article for publication.
Institutional Review Board Statement
Not applicable.
Informed Consent Statement
Not applicable.
Conflicts of Interest
The authors declare no conflict of interest.
References
- GBD 2015 Obesity Collaborators; Afshin, A.; Forouzanfar, M.H.; Reitsma, M.B.; Sur, P.; Estep, K.; Lee, A.; Marczak, L.; Mokdad, A.H.; Moradi-Lakeh, M.; et al. Health Effects of Overweight and Obesity in 195 Countries over 25 Years. N. Engl. J. Med. 2017, 377, 13–27. [Google Scholar] [PubMed]
- Dai, H.; Alsalhe, T.A.; Chalghaf, N.; Ricco, M.; Bragazzi, N.L.; Wu, J. The global burden of disease attributable to high body mass index in 195 countries and territories, 1990–2017: An analysis of the Global Burden of Disease Study. PLoS Med. 2020, 17, e1003198. [Google Scholar] [CrossRef] [PubMed]
- Smith, G.I.; Mittendorfer, B.; Klein, S. Metabolically healthy obesity: Facts and fantasies. J. Clin. Investig. 2019, 129, 3978–3989. [Google Scholar] [CrossRef] [PubMed]
- Jung, C.H.; Lee, W.J.; Song, K.H. Metabolically healthy obesity: A friend or foe? Korean J. Intern. Med. 2017, 32, 611–621. [Google Scholar] [CrossRef]
- Bluher, M. Metabolically Healthy Obesity. Endocr. Rev. 2020, 41, bnaa004. [Google Scholar] [CrossRef]
- Lee, J.H.; Park, A.; Oh, K.J.; Lee, S.C.; Kim, W.K.; Bae, K.H. The Role of Adipose Tissue Mitochondria: Regulation of Mitochondrial Function for the Treatment of Metabolic Diseases. Int. J. Mol. Sci. 2019, 20, 4924. [Google Scholar] [CrossRef]
- Mittal, B. Subcutaneous adipose tissue & visceral adipose tissue. Indian J. Med. Res. 2019, 149, 571–573. [Google Scholar]
- Candi, E.; Campanelli, M.; Sica, G.; Schinzari, F.; Rovella, V.; Di Daniele, N.; Melino, J.; Tesauro, M. Differences in the vascular and metabolic profiles between metabolically healthy and unhealthy obesity. Endocr. Metab. Sci. 2021, 2, 100077. [Google Scholar] [CrossRef]
- Bluher, M. The distinction of metabolically ‘healthy’ from ‘unhealthy’ obese individuals. Curr. Opin. Lipidol. 2010, 21, 38–43. [Google Scholar] [CrossRef]
- Schinzari, F.; Tesauro, M.; Rovella, V.; Galli, A.; Mores, N.; Porzio, O.; Lauro, D.; Cardillo, C. Generalized impairment of vasodilator reactivity during hyperinsulinemia in patients with obesity-related metabolic syndrome. Am. J. Physiol. Endocrinol. Metab. 2010, 299, E947–E952. [Google Scholar] [CrossRef] [PubMed]
- Gaggini, M.; Morelli, M.; Buzzigoli, E.; DeFronzo, R.A.; Bugianesi, E.; Gastaldelli, A. Non-alcoholic fatty liver disease (NAFLD) and its connection with insulin resistance, dyslipidemia, atherosclerosis and coronary heart disease. Nutrients 2013, 5, 1544–1560. [Google Scholar] [CrossRef] [PubMed]
- Stefan, N. Metabolically Healthy and Unhealthy Normal Weight and Obesity. Endocrinol. Metab. 2020, 35, 487–493. [Google Scholar] [CrossRef] [PubMed]
- Tchernof, A.; Despres, J.P. Pathophysiology of human visceral obesity: An update. Physiol. Rev. 2013, 93, 359–404. [Google Scholar] [CrossRef] [PubMed]
- Stefan, N. Causes, consequences, and treatment of metabolically unhealthy fat distribution. Lancet Diabetes Endocrinol. 2020, 8, 616–627. [Google Scholar] [CrossRef]
- Fox, C.S.; Massaro, J.M.; Hoffmann, U.; Pou, K.M.; Maurovich-Horvat, P.; Liu, C.Y.; Vasan, R.S.; Murabito, J.M.; Meigs, J.B.; Cupples, L.A.; et al. Abdominal visceral and subcutaneous adipose tissue compartments: Association with metabolic risk factors in the Framingham Heart Study. Circulation 2007, 116, 39–48. [Google Scholar] [CrossRef]
- Pou, K.M.; Massaro, J.M.; Hoffmann, U.; Lieb, K.; Vasan, R.S.; O’Donnell, C.J.; Fox, C.S. Patterns of abdominal fat distribution: The Framingham Heart Study. Diabetes Care 2009, 32, 481–485. [Google Scholar] [CrossRef]
- Neeland, I.J.; Ayers, C.R.; Rohatgi, A.K.; Turer, A.T.; Berry, J.D.; Das, S.R.; Vega, G.L.; Khera, A.; McGuire, D.K.; Grundy, S.M.; et al. Associations of visceral and abdominal subcutaneous adipose tissue with markers of cardiac and metabolic risk in obese adults. Obesity 2013, 21, E439–E447. [Google Scholar] [CrossRef]
- Neeland, I.J.; Turer, A.T.; Ayers, C.R.; Powell-Wiley, T.M.; Vega, G.L.; Farzaneh-Far, R.; Grundy, S.M.; Khera, A.; McGuire, D.K.; de Lemos, J.A. Dysfunctional adiposity and the risk of prediabetes and type 2 diabetes in obese adults. JAMA 2012, 308, 1150–1159. [Google Scholar] [CrossRef]
- Neeland, I.J.; Turer, A.T.; Ayers, C.R.; Berry, J.D.; Rohatgi, A.; Das, S.R.; Khera, A.; Vega, G.L.; McGuire, D.K.; Grundy, S.M.; et al. Body fat distribution and incident cardiovascular disease in obese adults. J. Am. Coll. Cardiol. 2015, 65, 2150–2151. [Google Scholar] [CrossRef]
- Stefan, N.; Kantartzis, K.; Machann, J.; Schick, F.; Thamer, C.; Rittig, K.; Balletshofer, B.; Machicao, F.; Fritsche, A.; Haring, H.U. Identification and characterization of metabolically benign obesity in humans. Arch. Intern. Med. 2008, 168, 1609–1616. [Google Scholar] [CrossRef]
- Stefan, N.; Schick, F.; Haring, H.U. Causes, Characteristics, and Consequences of Metabolically Unhealthy Normal Weight in Humans. Cell Metab. 2017, 26, 292–300. [Google Scholar] [CrossRef] [PubMed]
- Stefan, N.; Haring, H.U.; Cusi, K. Non-alcoholic fatty liver disease: Causes, diagnosis, cardiometabolic consequences, and treatment strategies. Lancet Diabetes Endocrinol. 2019, 7, 313–324. [Google Scholar] [CrossRef]
- Stefan, N.; Cusi, K. A global view of the interplay between non-alcoholic fatty liver disease and diabetes. Lancet Diabetes Endocrinol. 2022, 10, 284–296. [Google Scholar] [CrossRef]
- Tschritter, O.; Fritsche, A.; Thamer, C.; Haap, M.; Shirkavand, F.; Rahe, S.; Staiger, H.; Maerker, E.; Haring, H.; Stumvoll, M. Plasma adiponectin concentrations predict insulin sensitivity of both glucose and lipid metabolism. Diabetes 2003, 52, 239–243. [Google Scholar] [CrossRef] [PubMed]
- Aguilar-Salinas, C.A.; Garcia, E.G.; Robles, L.; Riano, D.; Ruiz-Gomez, D.G.; Garcia-Ulloa, A.C.; Melgarejo, M.A.; Zamora, M.; Guillen-Pineda, L.E.; Mehta, R.; et al. High adiponectin concentrations are associated with the metabolically healthy obese phenotype. J. Clin. Endocrinol. Metab. 2008, 93, 4075–4079. [Google Scholar] [CrossRef]
- Martinez-Larrad, M.T.; Corbaton Anchuelo, A.; Del Prado, N.; Ibarra Rueda, J.M.; Gabriel, R.; Serrano-Rios, M. Profile of individuals who are metabolically healthy obese using different definition criteria. A population-based analysis in the Spanish population. PLoS ONE 2014, 9, e106641. [Google Scholar] [CrossRef]
- Ahl, S.; Guenther, M.; Zhao, S.; James, R.; Marks, J.; Szabo, A.; Kidambi, S. Adiponectin Levels Differentiate Metabolically Healthy vs Unhealthy Among Obese and Nonobese White Individuals. J. Clin. Endocrinol. Metab. 2015, 100, 4172–4180. [Google Scholar] [CrossRef]
- Doumatey, A.P.; Bentley, A.R.; Zhou, J.; Huang, H.; Adeyemo, A.; Rotimi, C.N. Paradoxical Hyperadiponectinemia is Associated With the Metabolically Healthy Obese (MHO) Phenotype in African Americans. J. Endocrinol. Metab. 2012, 2, 51–65. [Google Scholar] [CrossRef]
- Martinez, G.; Hart, R.W.; Hill, H.M.; Lang, J.R.; Lessard, D.; Houle, J.M. Determination of loxtidine in human serum by capillary column gas chromatography with nitrogen-phosphorus detection. J. Chromatogr. 1990, 533, 235–240. [Google Scholar] [CrossRef]
- Elisha, B.; Karelis, A.D.; Imbeault, P.; Rabasa-Lhoret, R. Effects of acute hyperinsulinaemia on total and high-molecular-weight adiponectin concentration in metabolically healthy but obese postmenopausal women: A Montreal-Ottawa New Emerging Team (MONET) study. Diabetes Metab. 2010, 36, 319–321. [Google Scholar] [CrossRef]
- Sanidas, E.; Velliou, M.; Papadopoulos, D.; Iliopoulos, D.; Barbetseas, J. Healthy and non healthy obese patients. The truth lies in the adipose tissue. Eur. J. Intern. Med. 2020, 82, 133–134. [Google Scholar] [CrossRef] [PubMed]
- Smekal, A.; Vaclavik, J. Adipokines and cardiovascular disease: A comprehensive review. Biomed. Pap. Med. Fac. Univ. Palacky Olomouc Czech Repub 2017, 161, 31–40. [Google Scholar] [CrossRef] [PubMed]
- Alizadeh, S.; Mirzaei, K.; Mohammadi, C.; Keshavarz, S.A.; Maghbooli, Z. Circulating omentin-1 might be associated with metabolic health status in different phenotypes of body size. Arch. Endocrinol. Metab. 2017, 61, 567–574. [Google Scholar] [CrossRef] [PubMed]
- Romacho, T.; Sanchez-Ferrer, C.F.; Peiro, C. Visfatin/Nampt: An adipokine with cardiovascular impact. Mediat. Inflamm. 2013, 2013, 946427. [Google Scholar] [CrossRef]
- Bik, W.; Ostrowski, J.; Baranowska-Bik, A.; Wolinska-Witort, E.; Bialkowska, M.; Martynska, L.; Baranowska, B. Adipokines and genetic factors in overweight or obese but metabolically healthy Polish women. Neuroendocrinol. Lett. 2010, 31, 497–506. [Google Scholar]
- Lejawa, M.; Osadnik, K.; Czuba, Z.; Osadnik, T.; Pawlas, N. Association of Metabolically Healthy and Unhealthy Obesity Phenotype with Markers Related to Obesity, Diabetes among Young, Healthy Adult Men. Analysis of MAGNETIC Study. Life 2021, 11, 1350. [Google Scholar] [CrossRef]
- Lee, Y.S.; Wollam, J.; Olefsky, J.M. An Integrated View of Immunometabolism. Cell 2018, 172, 22–40. [Google Scholar] [CrossRef]
- Hotamisligil, G.S.; Shargill, N.S.; Spiegelman, B.M. Adipose expression of tumor necrosis factor-alpha: Direct role in obesity-linked insulin resistance. Science 1993, 259, 87–91. [Google Scholar] [CrossRef]
- Kloting, N.; Fasshauer, M.; Dietrich, A.; Kovacs, P.; Schon, M.R.; Kern, M.; Stumvoll, M.; Bluher, M. Insulin-sensitive obesity. Am. J. Physiol. Endocrinol. Metab. 2010, 299, E506–E515. [Google Scholar] [CrossRef]
- Karelis, A.D.; Faraj, M.; Bastard, J.P.; St-Pierre, D.H.; Brochu, M.; Prud’homme, D.; Rabasa-Lhoret, R. The metabolically healthy but obese individual presents a favorable inflammation profile. J. Clin. Endocrinol. Metab. 2005, 90, 4145–4150. [Google Scholar] [CrossRef]
- Kouvari, M.; Panagiotakos, D.B.; Yannakoulia, M.; Georgousopoulou, E.; Critselis, E.; Chrysohoou, C.; Tousoulis, D.; Pitsavos, C.; Investigators, A.S. Transition from metabolically benign to metabolically unhealthy obesity and 10-year cardiovascular disease incidence: The ATTICA cohort study. Metabolism 2019, 93, 18–24. [Google Scholar] [CrossRef] [PubMed]
- Koster, A.; Stenholm, S.; Alley, D.E.; Kim, L.J.; Simonsick, E.M.; Kanaya, A.M.; Visser, M.; Houston, D.K.; Nicklas, B.J.; Tylavsky, F.A.; et al. Body fat distribution and inflammation among obese older adults with and without metabolic syndrome. Obesity 2010, 18, 2354–2361. [Google Scholar] [CrossRef] [PubMed]
- Shin, M.J.; Hyun, Y.J.; Kim, O.Y.; Kim, J.Y.; Jang, Y.; Lee, J.H. Weight loss effect on inflammation and LDL oxidation in metabolically healthy but obese (MHO) individuals: Low inflammation and LDL oxidation in MHO women. Int. J. Obes. 2006, 30, 1529–1534. [Google Scholar] [CrossRef] [PubMed]
- Wildman, R.P.; Kaplan, R.; Manson, J.E.; Rajkovic, A.; Connelly, S.A.; Mackey, R.H.; Tinker, L.F.; Curb, J.D.; Eaton, C.B.; Wassertheil-Smoller, S. Body size phenotypes and inflammation in the Women’s Health Initiative Observational Study. Obesity 2011, 19, 1482–1491. [Google Scholar] [CrossRef]
- Jung, C.H.; Lee, M.J.; Kang, Y.M.; Jang, J.E.; Leem, J.; Hwang, J.Y.; Kim, E.H.; Park, J.Y.; Kim, H.K.; Lee, W.J. The risk of incident type 2 diabetes in a Korean metabolically healthy obese population: The role of systemic inflammation. J. Clin. Endocrinol. Metab. 2015, 100, 934–941. [Google Scholar] [CrossRef]
- Amouzou, C.; Breuker, C.; Fabre, O.; Bourret, A.; Lambert, K.; Birot, O.; Fedou, C.; Dupuy, A.M.; Cristol, J.P.; Sutra, T.; et al. Skeletal Muscle Insulin Resistance and Absence of Inflammation Characterize Insulin-Resistant Grade I Obese Women. PLoS ONE 2016, 11, e0154119. [Google Scholar] [CrossRef]
- Ctoi, A.F.; Parvu, A.E.; Andreicut, A.D.; Mironiuc, A.; Crciun, A.; Ctoi, C.; Pop, I.D. Metabolically Healthy versus Unhealthy Morbidly Obese: Chronic Inflammation, Nitro-Oxidative Stress, and Insulin Resistance. Nutrients 2018, 10, 1199. [Google Scholar] [CrossRef]
- Iglesias Molli, A.E.; Penas Steinhardt, A.; Lopez, A.P.; Gonzalez, C.D.; Vilarino, J.; Frechtel, G.D.; Cerrone, G.E. Metabolically healthy obese individuals present similar chronic inflammation level but less insulin-resistance than obese individuals with metabolic syndrome. PLoS ONE 2017, 12, e0190528. [Google Scholar]
- Bigornia, S.J.; Farb, M.G.; Mott, M.M.; Hess, D.T.; Carmine, B.; Fiscale, A.; Joseph, L.; Apovian, C.M.; Gokce, N. Relation of depot-specific adipose inflammation to insulin resistance in human obesity. Nutr. Diabetes 2012, 2, e30. [Google Scholar] [CrossRef]
- Esser, N.; L’Homme, L.; De Roover, A.; Kohnen, L.; Scheen, A.J.; Moutschen, M.; Piette, J.; Legrand-Poels, S.; Paquot, N. Obesity phenotype is related to NLRP3 inflammasome activity and immunological profile of visceral adipose tissue. Diabetologia 2013, 56, 2487–2497. [Google Scholar] [CrossRef]
- McLaughlin, T.; Deng, A.; Gonzales, O.; Aillaud, M.; Yee, G.; Lamendola, C.; Abbasi, F.; Connolly, A.J.; Sherman, A.; Cushman, S.W.; et al. Insulin resistance is associated with a modest increase in inflammation in subcutaneous adipose tissue of moderately obese women. Diabetologia 2008, 51, 2303–2308. [Google Scholar] [CrossRef] [PubMed]
- Wentworth, J.M.; Naselli, G.; Brown, W.A.; Doyle, L.; Phipson, B.; Smyth, G.K.; Wabitsch, M.; O’Brien, P.E.; Harrison, L.C. Pro-inflammatory CD11c+CD206+ adipose tissue macrophages are associated with insulin resistance in human obesity. Diabetes 2010, 59, 1648–1656. [Google Scholar] [CrossRef] [PubMed]
- Fabbrini, E.; Cella, M.; McCartney, S.A.; Fuchs, A.; Abumrad, N.A.; Pietka, T.A.; Chen, Z.; Finck, B.N.; Han, D.H.; Magkos, F.; et al. Association between specific adipose tissue CD4+ T-cell populations and insulin resistance in obese individuals. Gastroenterology 2013, 145, 366–374.e3. [Google Scholar] [CrossRef] [Green Version]
- Pandolfi, J.B.; Ferraro, A.A.; Sananez, I.; Gancedo, M.C.; Baz, P.; Billordo, L.A.; Fainboim, L.; Arruvito, L. ATP-Induced Inflammation Drives Tissue-Resident Th17 Cells in Metabolically Unhealthy Obesity. J. Immunol. 2016, 196, 3287–3296. [Google Scholar] [CrossRef] [PubMed]
- Henegar, C.; Tordjman, J.; Achard, V.; Lacasa, D.; Cremer, I.; Guerre-Millo, M.; Poitou, C.; Basdevant, A.; Stich, V.; Viguerie, N.; et al. Adipose tissue transcriptomic signature highlights the pathological relevance of extracellular matrix in human obesity. Genome Biol. 2008, 9, R14. [Google Scholar] [CrossRef]
- Spencer, M.; Unal, R.; Zhu, B.; Rasouli, N.; McGehee, R.E., Jr.; Peterson, C.A.; Kern, P.A. Adipose tissue extracellular matrix and vascular abnormalities in obesity and insulin resistance. J. Clin. Endocrinol. Metab. 2011, 96, E1990–E1998. [Google Scholar] [CrossRef]
- Michaud, A.; Tordjman, J.; Pelletier, M.; Liu, Y.; Laforest, S.; Noel, S.; Le Naour, G.; Bouchard, C.; Clement, K.; Tchernof, A. Relevance of omental pericellular adipose tissue collagen in the pathophysiology of human abdominal obesity and related cardiometabolic risk. Int. J. Obes. 2016, 40, 1823–1831. [Google Scholar] [CrossRef]
- Pasarica, M.; Gowronska-Kozak, B.; Burk, D.; Remedios, I.; Hymel, D.; Gimble, J.; Ravussin, E.; Bray, G.A.; Smith, S.R. Adipose tissue collagen VI in obesity. J. Clin. Endocrinol. Metab. 2009, 94, 5155–5162. [Google Scholar] [CrossRef]
- Divoux, A.; Tordjman, J.; Lacasa, D.; Veyrie, N.; Hugol, D.; Aissat, A.; Basdevant, A.; Guerre-Millo, M.; Poitou, C.; Zucker, J.D.; et al. Fibrosis in human adipose tissue: Composition, distribution, and link with lipid metabolism and fat mass loss. Diabetes 2010, 59, 2817–2825. [Google Scholar] [CrossRef]
- Lawler, H.M.; Underkofler, C.M.; Kern, P.A.; Erickson, C.; Bredbeck, B.; Rasouli, N. Adipose Tissue Hypoxia, Inflammation, and Fibrosis in Obese Insulin-Sensitive and Obese Insulin-Resistant Subjects. J. Clin. Endocrinol. Metab. 2016, 101, 1422–1428. [Google Scholar] [CrossRef]
- Magkos, F.; Fraterrigo, G.; Yoshino, J.; Luecking, C.; Kirbach, K.; Kelly, S.C.; de Las Fuentes, L.; He, S.; Okunade, A.L.; Patterson, B.W.; et al. Effects of Moderate and Subsequent Progressive Weight Loss on Metabolic Function and Adipose Tissue Biology in Humans with Obesity. Cell Metab. 2016, 23, 591–601. [Google Scholar] [CrossRef]
- Dankel, S.N.; Svard, J.; Mattha, S.; Claussnitzer, M.; Kloting, N.; Glunk, V.; Fandalyuk, Z.; Grytten, E.; Solsvik, M.H.; Nielsen, H.J.; et al. COL6A3 expression in adipocytes associates with insulin resistance and depends on PPARgamma and adipocyte size. Obesity 2014, 22, 1807–1813. [Google Scholar] [CrossRef] [PubMed]
- Reggio, S.; Rouault, C.; Poitou, C.; Bichet, J.C.; Prifti, E.; Bouillot, J.L.; Rizkalla, S.; Lacasa, D.; Tordjman, J.; Clement, K. Increased Basement Membrane Components in Adipose Tissue During Obesity: Links With TGFbeta and Metabolic Phenotypes. J. Clin. Endocrinol. Metab. 2016, 101, 2578–2587. [Google Scholar] [CrossRef] [PubMed] [Green Version]
- Yoshino, J.; Patterson, B.W.; Klein, S. Adipose Tissue CTGF Expression is Associated with Adiposity and Insulin Resistance in Humans. Obesity 2019, 27, 957–962. [Google Scholar] [CrossRef] [PubMed]
- Sun, K.; Tordjman, J.; Clement, K.; Scherer, P.E. Fibrosis and adipose tissue dysfunction. Cell Metab. 2013, 18, 470–477. [Google Scholar] [CrossRef] [PubMed]
- Kim, J.Y.; van de Wall, E.; Laplante, M.; Azzara, A.; Trujillo, M.E.; Hofmann, S.M.; Schraw, T.; Durand, J.L.; Li, H.; Li, G.; et al. Obesity-associated improvements in metabolic profile through expansion of adipose tissue. J. Clin. Investig. 2007, 117, 2621–2637. [Google Scholar] [CrossRef] [PubMed]
- Chutkow, W.A.; Birkenfeld, A.L.; Brown, J.D.; Lee, H.Y.; Frederick, D.W.; Yoshioka, J.; Patwari, P.; Kursawe, R.; Cushman, S.W.; Plutzky, J.; et al. Deletion of the alpha-arrestin protein Txnip in mice promotes adiposity and adipogenesis while preserving insulin sensitivity. Diabetes 2010, 59, 1424–1434. [Google Scholar] [CrossRef]
- Perfield, J.W., II.; Lee, Y.; Shulman, G.I.; Samuel, V.T.; Jurczak, M.J.; Chang, E.; Xie, C.; Tsichlis, P.N.; Obin, M.S.; Greenberg, A.S. Tumor progression locus 2 (TPL2) regulates obesity-associated inflammation and insulin resistance. Diabetes 2011, 60, 1168–1176. [Google Scholar] [CrossRef]
- Khan, T.; Muise, E.S.; Iyengar, P.; Wang, Z.V.; Chandalia, M.; Abate, N.; Zhang, B.B.; Bonaldo, P.; Chua, S.; Scherer, P.E. Metabolic dysregulation and adipose tissue fibrosis: Role of collagen VI. Mol. Cell Biol. 2009, 29, 1575–1591. [Google Scholar] [CrossRef]
- Herman, M.A.; Peroni, O.D.; Villoria, J.; Schon, M.R.; Abumrad, N.A.; Bluher, M.; Klein, S.; Kahn, B.B. A novel ChREBP isoform in adipose tissue regulates systemic glucose metabolism. Nature 2012, 484, 333–338. [Google Scholar] [CrossRef]
- Kusminski, C.M.; Holland, W.L.; Sun, K.; Park, J.; Spurgin, S.B.; Lin, Y.; Askew, G.R.; Simcox, J.A.; McClain, D.A.; Li, C.; et al. MitoNEET-driven alterations in adipocyte mitochondrial activity reveal a crucial adaptive process that preserves insulin sensitivity in obesity. Nat. Med. 2012, 18, 1539–1549. [Google Scholar] [CrossRef] [PubMed]
- Njunge, L.W.; Estania, A.P.; Guo, Y.; Liu, W.; Yang, L. Tumor progression locus 2 (TPL2) in tumor-promoting Inflammation, Tumorigenesis and Tumor Immunity. Theranostics 2020, 10, 8343–8364. [Google Scholar] [CrossRef] [PubMed]
- Waterfield, M.; Jin, W.; Reiley, W.; Zhang, M.; Sun, S.C. IkappaB kinase is an essential component of the Tpl2 signaling pathway. Mol. Cell Biol. 2004, 24, 6040–6048. [Google Scholar] [CrossRef] [Green Version]
- Cho, J.; Melnick, M.; Solidakis, G.P.; Tsichlis, P.N. Tpl2 (tumor progression locus 2) phosphorylation at Thr290 is induced by lipopolysaccharide via an Ikappa-B Kinase-beta-dependent pathway and is required for Tpl2 activation by external signals. J. Biol. Chem. 2005, 280, 20442–20448. [Google Scholar] [CrossRef] [PubMed]
- Papoutsopoulou, S.; Symons, A.; Tharmalingham, T.; Belich, M.P.; Kaiser, F.; Kioussis, D.; O’Garra, A.; Tybulewicz, V.; Ley, S.C. ABIN-2 is required for optimal activation of Erk MAP kinase in innate immune responses. Nat. Immunol. 2006, 7, 606–615. [Google Scholar] [CrossRef] [PubMed]
- Eliopoulos, A.G.; Dumitru, C.D.; Wang, C.C.; Cho, J.; Tsichlis, P.N. Induction of COX-2 by LPS in macrophages is regulated by Tpl2-dependent CREB activation signals. EMBO J. 2002, 21, 4831–4840. [Google Scholar] [CrossRef]
- Shepherd, P.R.; Kahn, B.B. Glucose transporters and insulin action--implications for insulin resistance and diabetes mellitus. N. Engl. J. Med. 1999, 341, 248–257. [Google Scholar] [CrossRef]
- Abel, E.D.; Peroni, O.; Kim, J.K.; Kim, Y.B.; Boss, O.; Hadro, E.; Minnemann, T.; Shulman, G.I.; Kahn, B.B. Adipose-selective targeting of the GLUT4 gene impairs insulin action in muscle and liver. Nature 2001, 409, 729–733. [Google Scholar] [CrossRef]
- Shepherd, P.R.; Gnudi, L.; Tozzo, E.; Yang, H.; Leach, F.; Kahn, B.B. Adipose cell hyperplasia and enhanced glucose disposal in transgenic mice overexpressing GLUT4 selectively in adipose tissue. J. Biol. Chem. 1993, 268, 22243–22246. [Google Scholar] [CrossRef]
- Iizuka, K.; Bruick, R.K.; Liang, G.; Horton, J.D.; Uyeda, K. Deficiency of carbohydrate response element-binding protein (ChREBP) reduces lipogenesis as well as glycolysis. Proc. Natl. Acad. Sci. USA 2004, 101, 7281–7286. [Google Scholar] [CrossRef]
- Colca, J.R.; McDonald, W.G.; Waldon, D.J.; Leone, J.W.; Lull, J.M.; Bannow, C.A.; Lund, E.T.; Mathews, W.R. Identification of a novel mitochondrial protein (“mitoNEET”) cross-linked specifically by a thiazolidinedione photoprobe. Am. J. Physiol. Endocrinol. Metab. 2004, 286, E252–E260. [Google Scholar] [CrossRef] [PubMed]
- Paddock, M.L.; Wiley, S.E.; Axelrod, H.L.; Cohen, A.E.; Roy, M.; Abresch, E.C.; Capraro, D.; Murphy, A.N.; Nechushtai, R.; Dixon, J.E.; et al. MitoNEET is a uniquely folded 2Fe 2S outer mitochondrial membrane protein stabilized by pioglitazone. Proc. Natl. Acad. Sci. USA 2007, 104, 14342–14347. [Google Scholar] [CrossRef] [PubMed]
- April-Sanders, A.K.; Rodriguez, C.J. Metabolically Healthy Obesity Redefined. JAMA Netw. Open 2021, 4, e218860. [Google Scholar] [CrossRef]
- Expert Panel on Detection, Evaluation, and Treatment of High Blood Cholesterol in Adults. Executive Summary of The Third Report of The National Cholesterol Education Program (NCEP) Expert Panel on Detection, Evaluation, And Treatment of High Blood Cholesterol In Adults (Adult Treatment Panel III). JAMA 2001, 285, 2486–2497. [Google Scholar] [CrossRef] [PubMed]
- Karelis, A.D.; Brochu, M.; Rabasa-Lhoret, R. Can we identify metabolically healthy but obese individuals (MHO)? Diabetes Metab. 2004, 30, 569–572. [Google Scholar] [CrossRef]
- Wildman, R.P.; Muntner, P.; Reynolds, K.; McGinn, A.P.; Rajpathak, S.; Wylie-Rosett, J.; Sowers, M.R. The obese without cardiometabolic risk factor clustering and the normal weight with cardiometabolic risk factor clustering: Prevalence and correlates of 2 phenotypes among the US population (NHANES 1999-2004). Arch. Intern. Med. 2008, 168, 1617–1624. [Google Scholar] [CrossRef]
- Zembic, A.; Eckel, N.; Stefan, N.; Baudry, J.; Schulze, M.B. An Empirically Derived Definition of Metabolically Healthy Obesity Based on Risk of Cardiovascular and Total Mortality. JAMA Netw. Open 2021, 4, e218505. [Google Scholar] [CrossRef]
- Soriguer, F.; Gutierrez-Repiso, C.; Rubio-Martin, E.; Garcia-Fuentes, E.; Almaraz, M.C.; Colomo, N.; Esteva de Antonio, I.; de Adana, M.S.; Chaves, F.J.; Morcillo, S.; et al. Metabolically healthy but obese, a matter of time? Findings from the prospective Pizarra study. J. Clin. Endocrinol. Metab. 2013, 98, 2318–2325. [Google Scholar] [CrossRef]
- Appleton, S.L.; Seaborn, C.J.; Visvanathan, R.; Hill, C.L.; Gill, T.K.; Taylor, A.W.; Adams, R.J.; North West Adelaide Health Study, T. Diabetes and cardiovascular disease outcomes in the metabolically healthy obese phenotype: A cohort study. Diabetes Care 2013, 36, 2388–2394. [Google Scholar] [CrossRef]
- Lee, S.H.; Yang, H.K.; Ha, H.S.; Lee, J.H.; Kwon, H.S.; Park, Y.M.; Yim, H.W.; Kang, M.I.; Lee, W.C.; Son, H.Y.; et al. Changes in Metabolic Health Status Over Time and Risk of Developing Type 2 Diabetes: A Prospective Cohort Study. Medicine 2015, 94, e1705. [Google Scholar] [CrossRef]
- Hamer, M.; Bell, J.A.; Sabia, S.; Batty, G.D.; Kivimaki, M. Stability of metabolically healthy obesity over 8 years: The English Longitudinal Study of Ageing. Eur. J. Endocrinol. 2015, 173, 703–708. [Google Scholar] [CrossRef] [PubMed]
- Bell, J.A.; Hamer, M.; Sabia, S.; Singh-Manoux, A.; Batty, G.D.; Kivimaki, M. The natural course of healthy obesity over 20 years. J. Am. Coll. Cardiol. 2015, 65, 101–102. [Google Scholar] [CrossRef] [PubMed]
- Hinnouho, G.M.; Czernichow, S.; Dugravot, A.; Batty, G.D.; Kivimaki, M.; Singh-Manoux, A. Metabolically healthy obesity and risk of mortality: Does the definition of metabolic health matter? Diabetes Care 2013, 36, 2294–2300. [Google Scholar] [CrossRef] [PubMed] [Green Version]
- Cho, Y.K.; Kang, Y.M.; Yoo, J.H.; Lee, J.; Park, J.Y.; Lee, W.J.; Kim, Y.J.; Jung, C.H. Implications of the dynamic nature of metabolic health status and obesity on risk of incident cardiovascular events and mortality: A nationwide population-based cohort study. Metabolism 2019, 97, 50–56. [Google Scholar] [CrossRef] [PubMed]
- Eckel, N.; Meidtner, K.; Kalle-Uhlmann, T.; Stefan, N.; Schulze, M.B. Metabolically healthy obesity and cardiovascular events: A systematic review and meta-analysis. Eur. J. Prev. Cardiol. 2016, 23, 956–966. [Google Scholar] [CrossRef]
- Caleyachetty, R.; Thomas, G.N.; Toulis, K.A.; Mohammed, N.; Gokhale, K.M.; Balachandran, K.; Nirantharakumar, K. Metabolically Healthy Obese and Incident Cardiovascular Disease Events Among 3.5 Million Men and Women. J. Am. Coll. Cardiol. 2017, 70, 1429–1437. [Google Scholar] [CrossRef] [PubMed]
- Wahba, I.M.; Mak, R.H. Obesity and obesity-initiated metabolic syndrome: Mechanistic links to chronic kidney disease. Clin. J. Am. Soc. Nephrol. 2007, 2, 550–562. [Google Scholar]
- Chang, A.R.; Surapaneni, A.; Kirchner, H.L.; Young, A.; Kramer, H.J.; Carey, D.J.; Appel, L.J.; Grams, M.E. Metabolically Healthy Obesity and Risk of Kidney Function Decline. Obesity 2018, 26, 762–768. [Google Scholar] [CrossRef]
- Lin, L.; Peng, K.; Du, R.; Huang, X.; Lu, J.; Xu, Y.; Xu, M.; Chen, Y.; Bi, Y.; Wang, W. Metabolically healthy obesity and incident chronic kidney disease: The role of systemic inflammation in a prospective study. Obesity 2017, 25, 634–641. [Google Scholar] [CrossRef]
- Jam, S.A.; Moloudpour, B.; Najafi, F.; Darbandi, M.; Pasdar, Y. Metabolic obesity phenotypes and chronic kidney disease: A cross-sectional study from the RaNCD cohort study. BMC Nephrol. 2022, 23, 233. [Google Scholar] [CrossRef]
- Hashimoto, Y.; Tanaka, M.; Okada, H.; Senmaru, T.; Hamaguchi, M.; Asano, M.; Yamazaki, M.; Oda, Y.; Hasegawa, G.; Toda, H.; et al. Metabolically healthy obesity and risk of incident CKD. Clin. J. Am. Soc. Nephrol. 2015, 10, 578–583. [Google Scholar] [CrossRef] [PubMed]
- Stefan, N.; Haring, H.U.; Schulze, M.B. Metabolically healthy obesity: The low-hanging fruit in obesity treatment? Lancet Diabetes Endocrinol. 2018, 6, 249–258. [Google Scholar] [CrossRef]
- Cao, Z.; Zheng, X.; Yang, H.; Li, S.; Xu, F.; Yang, X.; Wang, Y. Association of obesity status and metabolic syndrome with site-specific cancers: A population-based cohort study. Br. J. Cancer 2020, 123, 1336–1344. [Google Scholar] [CrossRef]
- Shin, C.M.; Han, K.; Lee, D.H.; Choi, Y.J.; Kim, N.; Park, Y.S.; Yoon, H. Association Among Obesity, Metabolic Health, and the Risk for Colorectal Cancer in the General Population in Korea Using the National Health Insurance Service-National Sample Cohort. Dis. Colon Rectum 2017, 60, 1192–1200. [Google Scholar] [CrossRef]
- Goyal, A.; Nimmakayala, K.R.; Zonszein, J. Is there a paradox in obesity? Cardiol. Rev. 2014, 22, 163–170. [Google Scholar] [CrossRef] [PubMed]
- Ma, W.Q.; Sun, X.J.; Wang, Y.; Han, X.Q.; Zhu, Y.; Liu, N.F. Does body mass index truly affect mortality and cardiovascular outcomes in patients after coronary revascularization with percutaneous coronary intervention or coronary artery bypass graft? A systematic review and network meta-analysis. Obes. Rev. 2018, 19, 1236–1247. [Google Scholar] [CrossRef] [PubMed]
- Elagizi, A.; Kachur, S.; Lavie, C.J.; Carbone, S.; Pandey, A.; Ortega, F.B.; Milani, R.V. An Overview and Update on Obesity and the Obesity Paradox in Cardiovascular Diseases. Prog. Cardiovasc. Dis. 2018, 61, 142–150. [Google Scholar] [CrossRef]
- De Schutter, A.; Lavie, C.J.; Milani, R.V. The impact of obesity on risk factors and prevalence and prognosis of coronary heart disease-the obesity paradox. Prog. Cardiovasc. Dis. 2014, 56, 401–408. [Google Scholar] [CrossRef]
- Jung, C.H.; Lee, M.J.; Kang, Y.M.; Hwang, J.Y.; Kim, E.H.; Park, J.Y.; Kim, H.K.; Lee, W.J. The risk of chronic kidney disease in a metabolically healthy obese population. Kidney Int. 2015, 88, 843–850. [Google Scholar] [CrossRef]
- Ruster, C.; Wolf, G. Adipokines promote chronic kidney disease. Nephrol. Dial. Transplant. 2013, 28 (Suppl. 4), iv8–iv14. [Google Scholar] [CrossRef]
- Foster, M.C.; Hwang, S.J.; Larson, M.G.; Lichtman, J.H.; Parikh, N.I.; Vasan, R.S.; Levy, D.; Fox, C.S. Overweight, obesity, and the development of stage 3 CKD: The Framingham Heart Study. Am. J. Kidney Dis. 2008, 52, 39–48. [Google Scholar] [CrossRef]
- Cho, Y.K.; Lee, J.; Kim, H.S.; Park, J.Y.; Lee, W.J.; Kim, Y.J.; Jung, C.H. Impact of Transition in Metabolic Health and Obesity on the Incident Chronic Kidney Disease: A Nationwide Cohort Study. J. Clin. Endocrinol. Metab. 2020, 105, e148–e157. [Google Scholar] [CrossRef] [PubMed]
- de Jong, P.E.; Verhave, J.C.; Pinto-Sietsma, S.J.; Hillege, H.L.; PREVEND Study Group. Obesity and target organ damage: The kidney. Int. J. Obes. Relat. Metab. Disord. 2002, 26 (Suppl. 4), S21–S24. [Google Scholar] [CrossRef]
- Wickman, C.; Kramer, H. Obesity and kidney disease: Potential mechanisms. In Seminars in Nephrology; WB Saunders: Philadelphia, PA, USA, 2013; Volume 33, pp. 14–22. [Google Scholar]
- Garland, J.S. Elevated body mass index as a risk factor for chronic kidney disease: Current perspectives. Diabetes Metab. Syndr. Obes. 2014, 7, 347–355. [Google Scholar] [CrossRef] [PubMed] [Green Version]
- Kalaitzidis, R.G.; Siamopoulos, K.C. The role of obesity in kidney disease: Recent findings and potential mechanisms. Int. Urol. Nephrol. 2011, 43, 771–784. [Google Scholar] [CrossRef] [PubMed]
- Hunley, T.E.; Ma, L.J.; Kon, V. Scope and mechanisms of obesity-related renal disease. Curr. Opin. Nephrol. Hypertens. 2010, 19, 227–234. [Google Scholar] [CrossRef]
- Whitmer, R.A.; Gunderson, E.P.; Barrett-Connor, E.; Quesenberry, C.P., Jr.; Yaffe, K. Obesity in middle age and future risk of dementia: A 27 year longitudinal population based study. BMJ 2005, 330, 1360. [Google Scholar] [CrossRef]
- Kivipelto, M.; Ngandu, T.; Fratiglioni, L.; Viitanen, M.; Kareholt, I.; Winblad, B.; Helkala, E.L.; Tuomilehto, J.; Soininen, H.; Nissinen, A. Obesity and vascular risk factors at midlife and the risk of dementia and Alzheimer disease. Arch. Neurol. 2005, 62, 1556–1560. [Google Scholar] [CrossRef]
- Fitzpatrick, A.L.; Kuller, L.H.; Lopez, O.L.; Diehr, P.; O’Meara, E.S.; Longstreth, W.T., Jr.; Luchsinger, J.A. Midlife and late-life obesity and the risk of dementia: Cardiovascular health study. Arch. Neurol. 2009, 66, 336–342. [Google Scholar] [CrossRef]
- Hughes, T.F.; Borenstein, A.R.; Schofield, E.; Wu, Y.; Larson, E.B. Association between late-life body mass index and dementia: The Kame Project. Neurology 2009, 72, 1741–1746. [Google Scholar] [CrossRef]
- Atti, A.R.; Palmer, K.; Volpato, S.; Winblad, B.; De Ronchi, D.; Fratiglioni, L. Late-life body mass index and dementia incidence: Nine-year follow-up data from the Kungsholmen Project. J. Am. Geriatr. Soc. 2008, 56, 111–116. [Google Scholar] [CrossRef] [PubMed]
- Buchman, A.S.; Schneider, J.A.; Wilson, R.S.; Bienias, J.L.; Bennett, D.A. Body mass index in older persons is associated with Alzheimer disease pathology. Neurology 2006, 67, 1949–1954. [Google Scholar] [CrossRef]
- Ye, B.S.; Jang, E.Y.; Kim, S.Y.; Kim, E.J.; Park, S.A.; Lee, Y.; Hong, C.H.; Choi, S.H.; Yoon, B.; Yoon, S.J.; et al. Unstable Body Mass Index and Progression to Probable Alzheimer’s Disease Dementia in Patients with Amnestic Mild Cognitive Impairment. J. Alzheimers. Dis. 2016, 49, 483–491. [Google Scholar] [CrossRef] [PubMed]
- Cho, Y.K.; Lee, J.; Kim, H.S.; Park, J.Y.; Lee, W.J.; Kim, Y.J.; Jung, C.H. The risk of Alzheimer’s disease according to dynamic changes in metabolic health and obesity: A nationwide population-based cohort study. Aging 2021, 13, 16974–16989. [Google Scholar] [CrossRef] [PubMed]
- Ma, L.Z.; Huang, Y.Y.; Wang, Z.T.; Li, J.Q.; Hou, X.H.; Shen, X.N.; Ou, Y.N.; Dong, Q.; Tan, L.; Yu, J.T.; et al. Metabolically healthy obesity reduces the risk of Alzheimer’s disease in elders: A longitudinal study. Aging 2019, 11, 10939–10951. [Google Scholar] [CrossRef] [PubMed]
- Lee, J.Y.; Han, K.; Han, E.; Kim, G.; Cho, H.; Kim, K.J.; Lee, B.W.; Kang, E.S.; Cha, B.S.; Brayne, C.; et al. Risk of Incident Dementia According to Metabolic Health and Obesity Status in Late Life: A Population-Based Cohort Study. J. Clin. Endocrinol. Metab. 2019, 104, 2942–2952. [Google Scholar] [CrossRef]
- Bianchi, V.E.; Locatelli, V.; Rizzi, L. Neurotrophic and Neuroregenerative Effects of GH/IGF1. Int. J. Mol. Sci. 2017, 18, 2441. [Google Scholar] [CrossRef]
- Watanabe, T.; Miyazaki, A.; Katagiri, T.; Yamamoto, H.; Idei, T.; Iguchi, T. Relationship between serum insulin-like growth factor-1 levels and Alzheimer’s disease and vascular dementia. J. Am. Geriatr. Soc. 2005, 53, 1748–1753. [Google Scholar] [CrossRef]
- Al-Delaimy, W.K.; von Muhlen, D.; Barrett-Connor, E. Insulinlike growth factor-1, insulinlike growth factor binding protein-1, and cognitive function in older men and women. J. Am. Geriatr. Soc. 2009, 57, 1441–1446. [Google Scholar] [CrossRef]
- Yamamoto, H.; Kato, Y. Relationship between plasma insulin-like growth factor I (IGF-I) levels and body mass index (BMI) in adults. Endocr. J. 1993, 40, 41–45. [Google Scholar] [CrossRef]
- Doehner, W.; Clark, A.; Anker, S.D. The obesity paradox: Weighing the benefit. Eur. Heart J. 2010, 31, 146–148. [Google Scholar] [CrossRef] [PubMed]
- Lee, E.B. Obesity, leptin, and Alzheimer’s disease. Ann. N. Y. Acad. Sci. 2011, 1243, 15–29. [Google Scholar] [CrossRef] [PubMed]
- Beccano-Kelly, D.; Harvey, J. Leptin: A novel therapeutic target in Alzheimer’s disease? Int. J. Alzheimers. Dis. 2012, 2012, 594137. [Google Scholar] [CrossRef]
- Lieb, W.; Beiser, A.S.; Vasan, R.S.; Tan, Z.S.; Au, R.; Harris, T.B.; Roubenoff, R.; Auerbach, S.; DeCarli, C.; Wolf, P.A.; et al. Association of plasma leptin levels with incident Alzheimer disease and MRI measures of brain aging. JAMA 2009, 302, 2565–2572. [Google Scholar] [CrossRef] [PubMed] [Green Version]
- Cho, Y.K.; Lee, J.; Kim, H.S.; Park, J.Y.; Lee, W.J.; Kim, Y.J.; Jung, C.H. Metabolic health is a determining factor for incident colorectal cancer in the obese population: A nationwide population-based cohort study. Cancer Med. 2021, 10, 220–229. [Google Scholar] [CrossRef]
- Ko, S.H.; Baeg, M.K.; Ko, S.Y.; Jung, H.S.; Kim, P.; Choi, M.G. Obesity and Metabolic Unhealthiness Have Different Effects on Colorectal Neoplasms. J. Clin. Endocrinol. Metab. 2017, 102, 2762–2769. [Google Scholar] [CrossRef]
- Bardou, M.; Barkun, A.N.; Martel, M. Obesity and colorectal cancer. Gut 2013, 62, 933–947. [Google Scholar] [CrossRef] [Green Version]
Publisher’s Note: MDPI stays neutral with regard to jurisdictional claims in published maps and institutional affiliations. |
© 2022 by the authors. Licensee MDPI, Basel, Switzerland. This article is an open access article distributed under the terms and conditions of the Creative Commons Attribution (CC BY) license (https://creativecommons.org/licenses/by/4.0/).