
Salt Dependence of DNA Binding Activity of Human Transcription Factor Dlx3

 ,
, 
Abstract
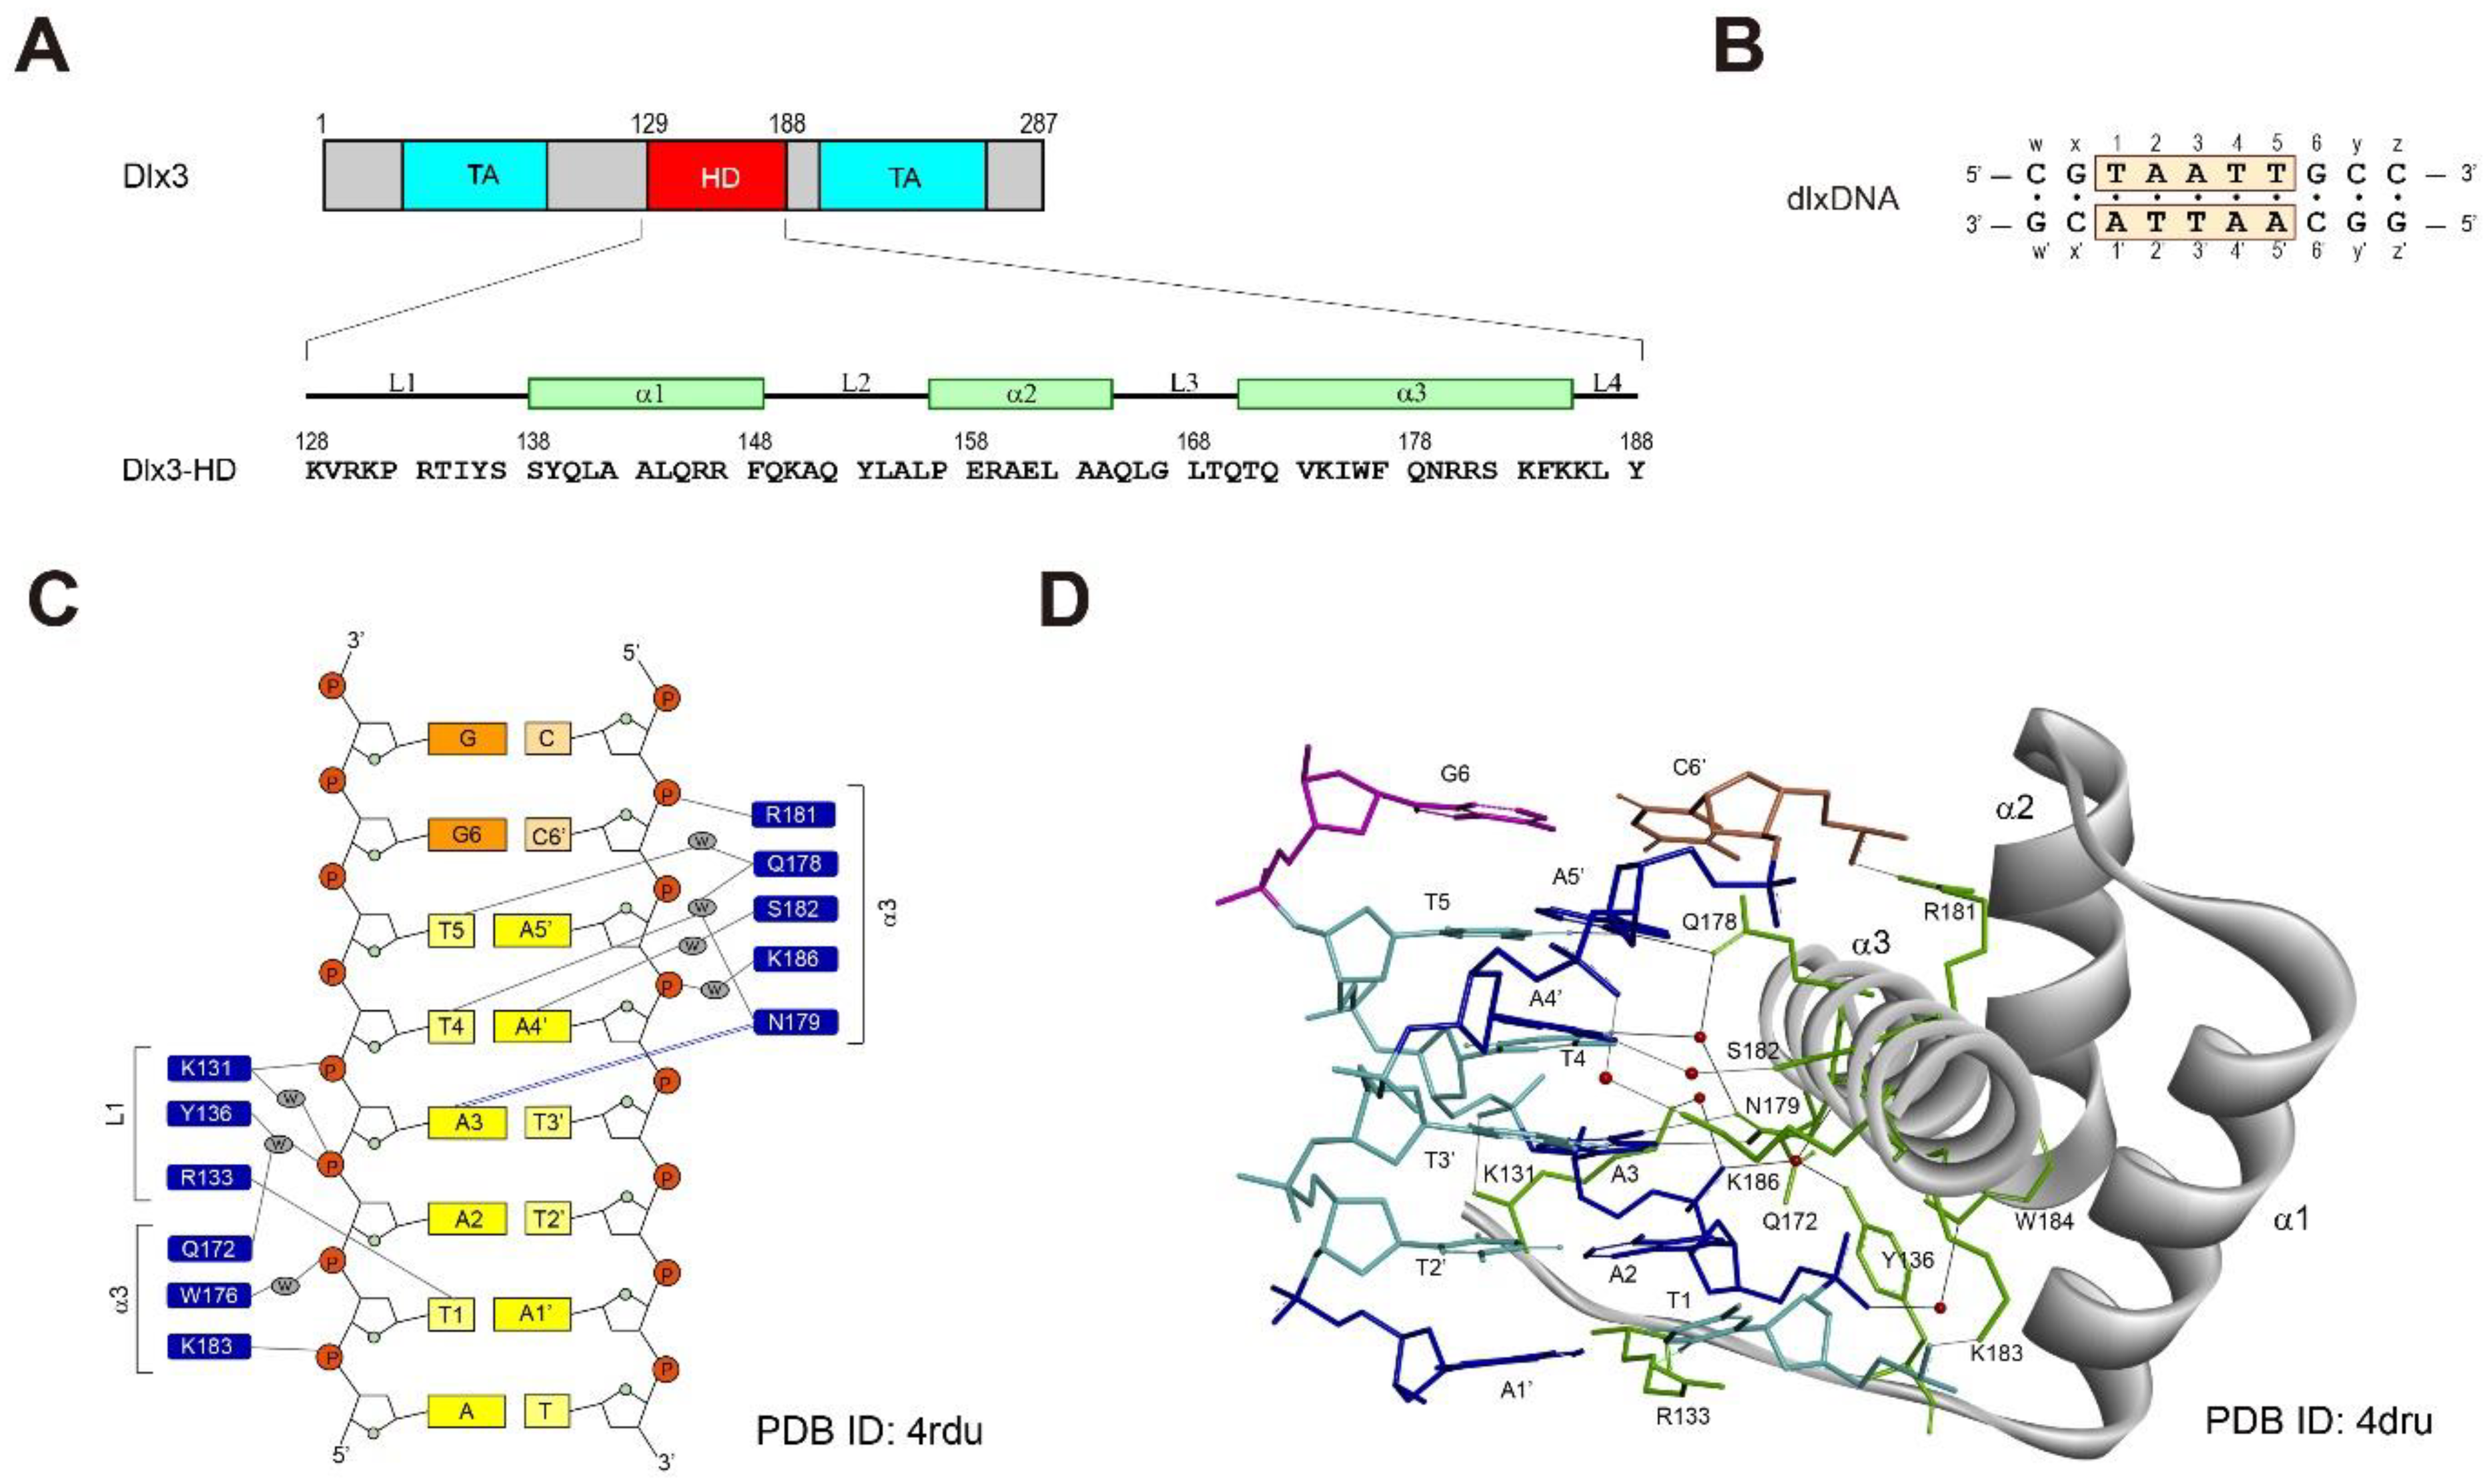
:1. Introduction
2. Results
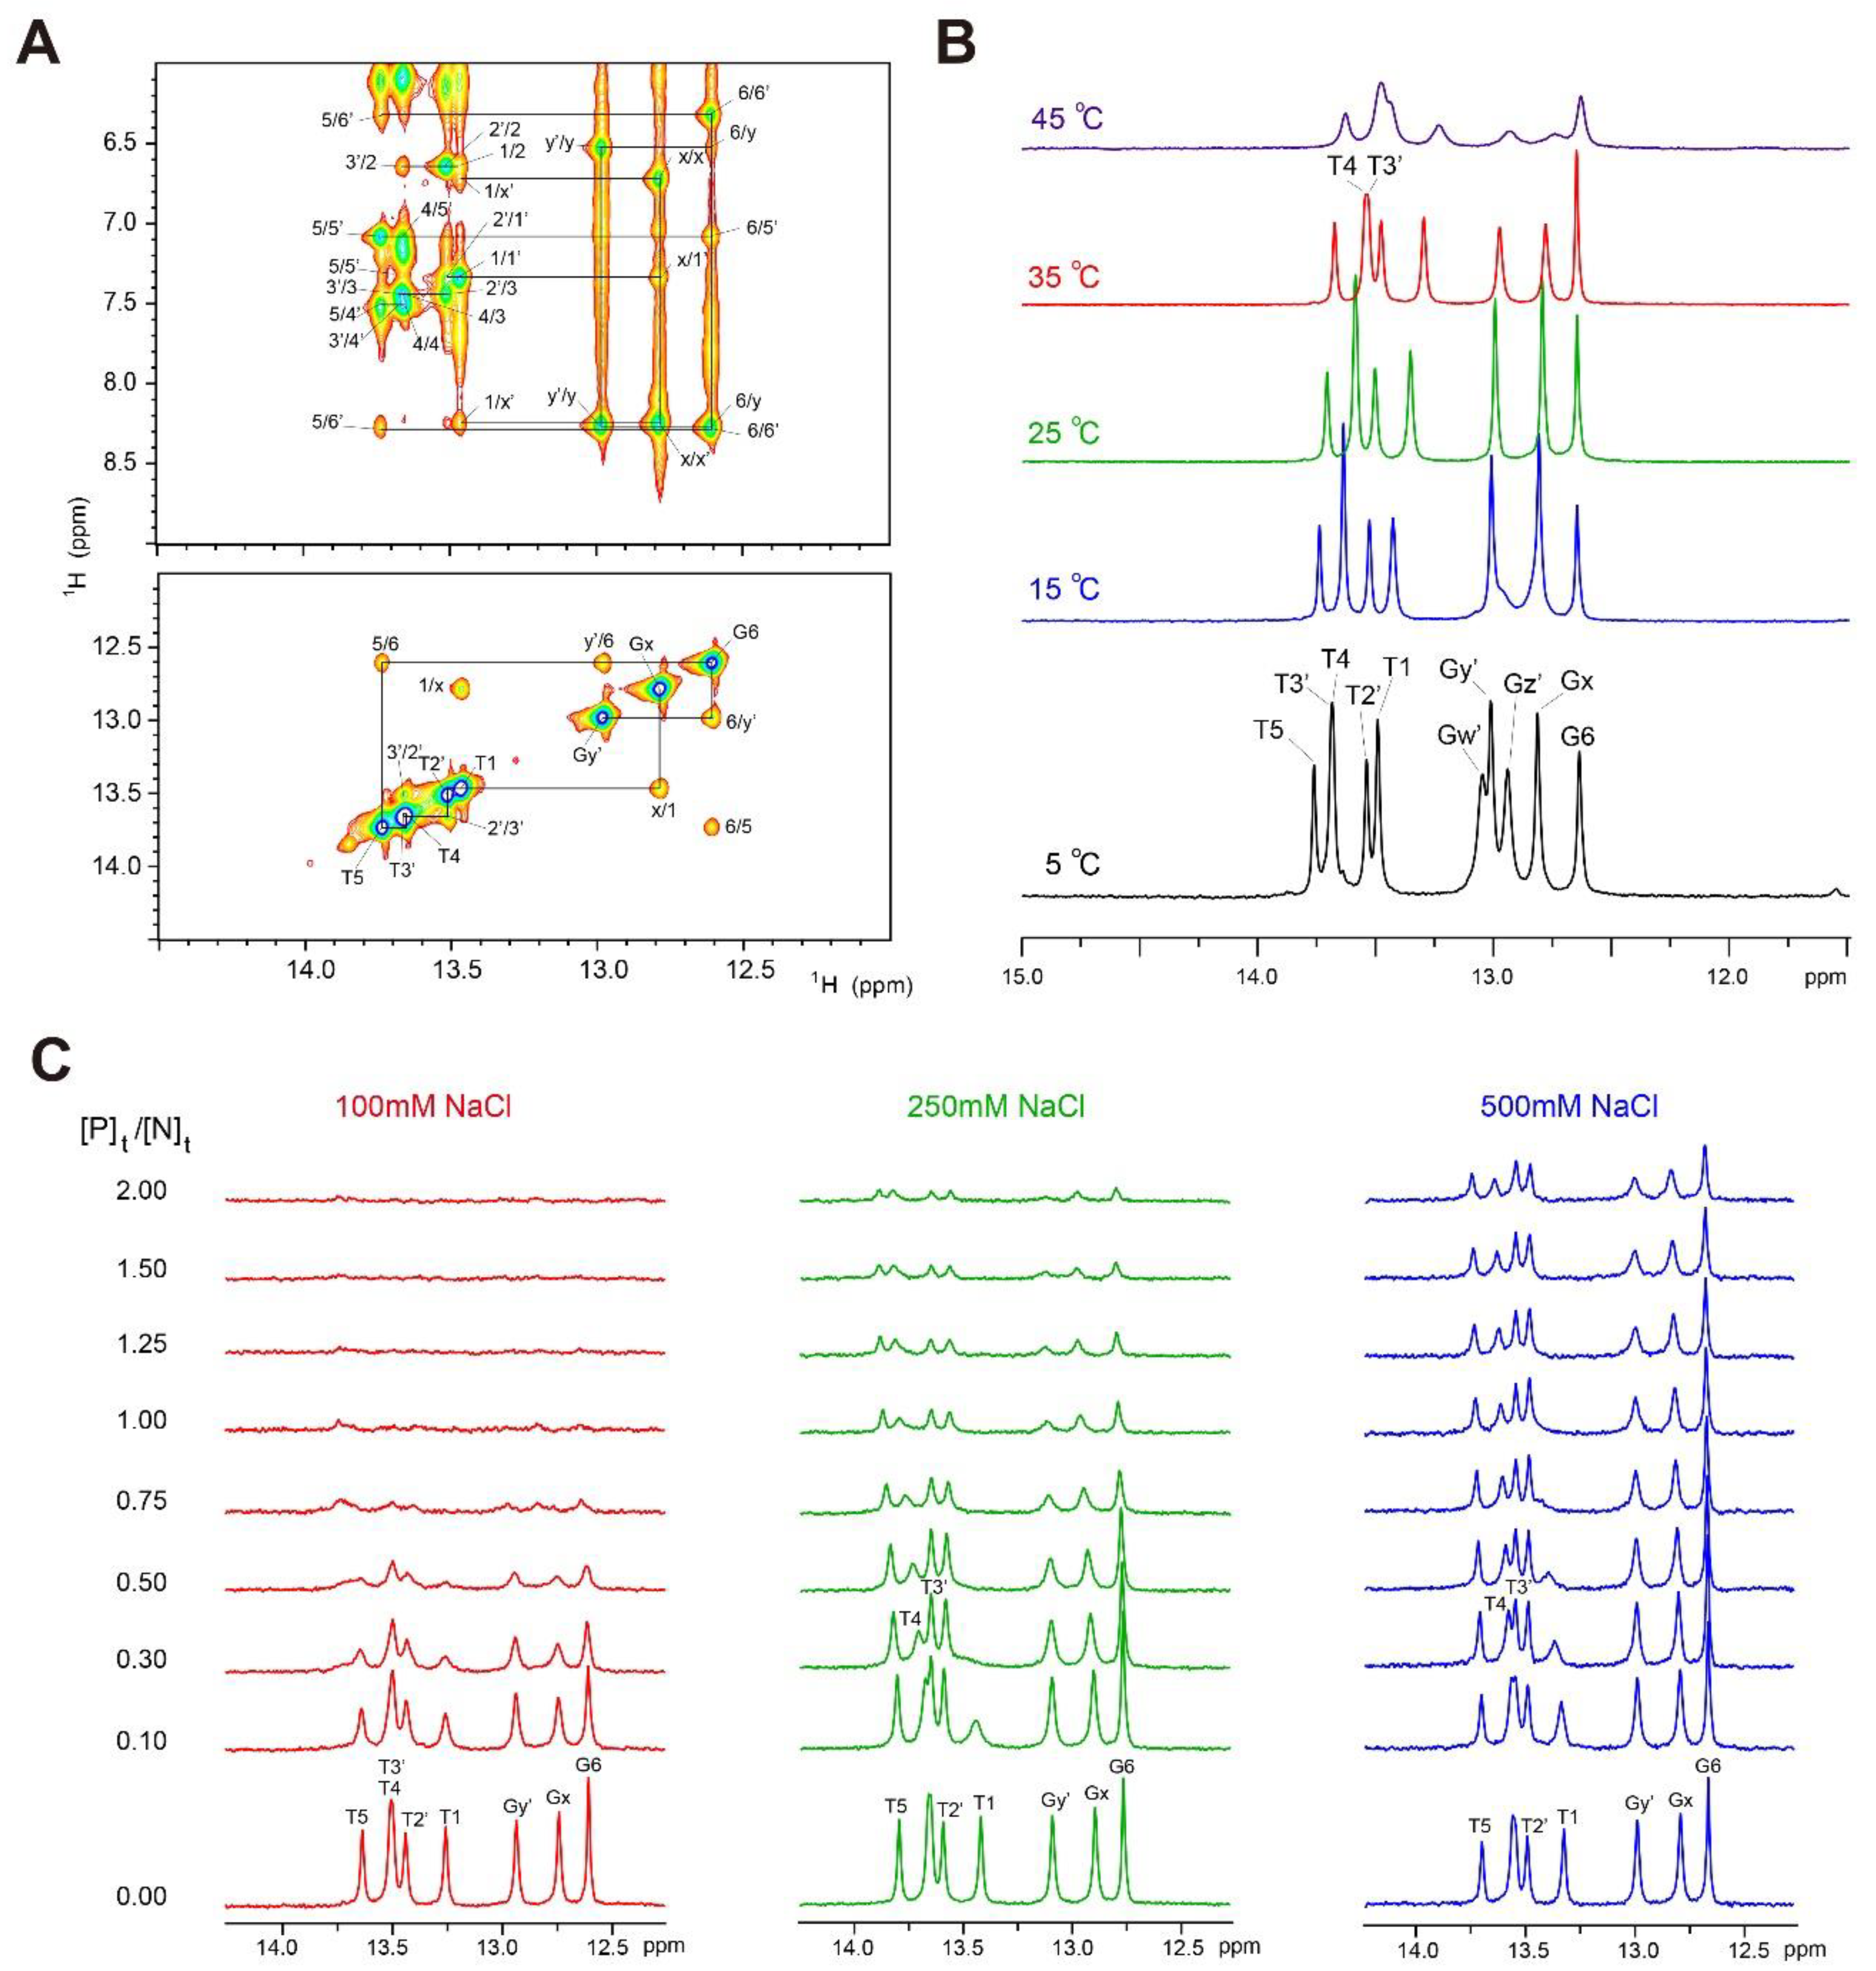
2.1. Assignments of Imino Proton Resonances of dlxDNA
2.2. Change in 1D Imino Proton Spectra of dlxDNA in Complex with Dlx3-HD
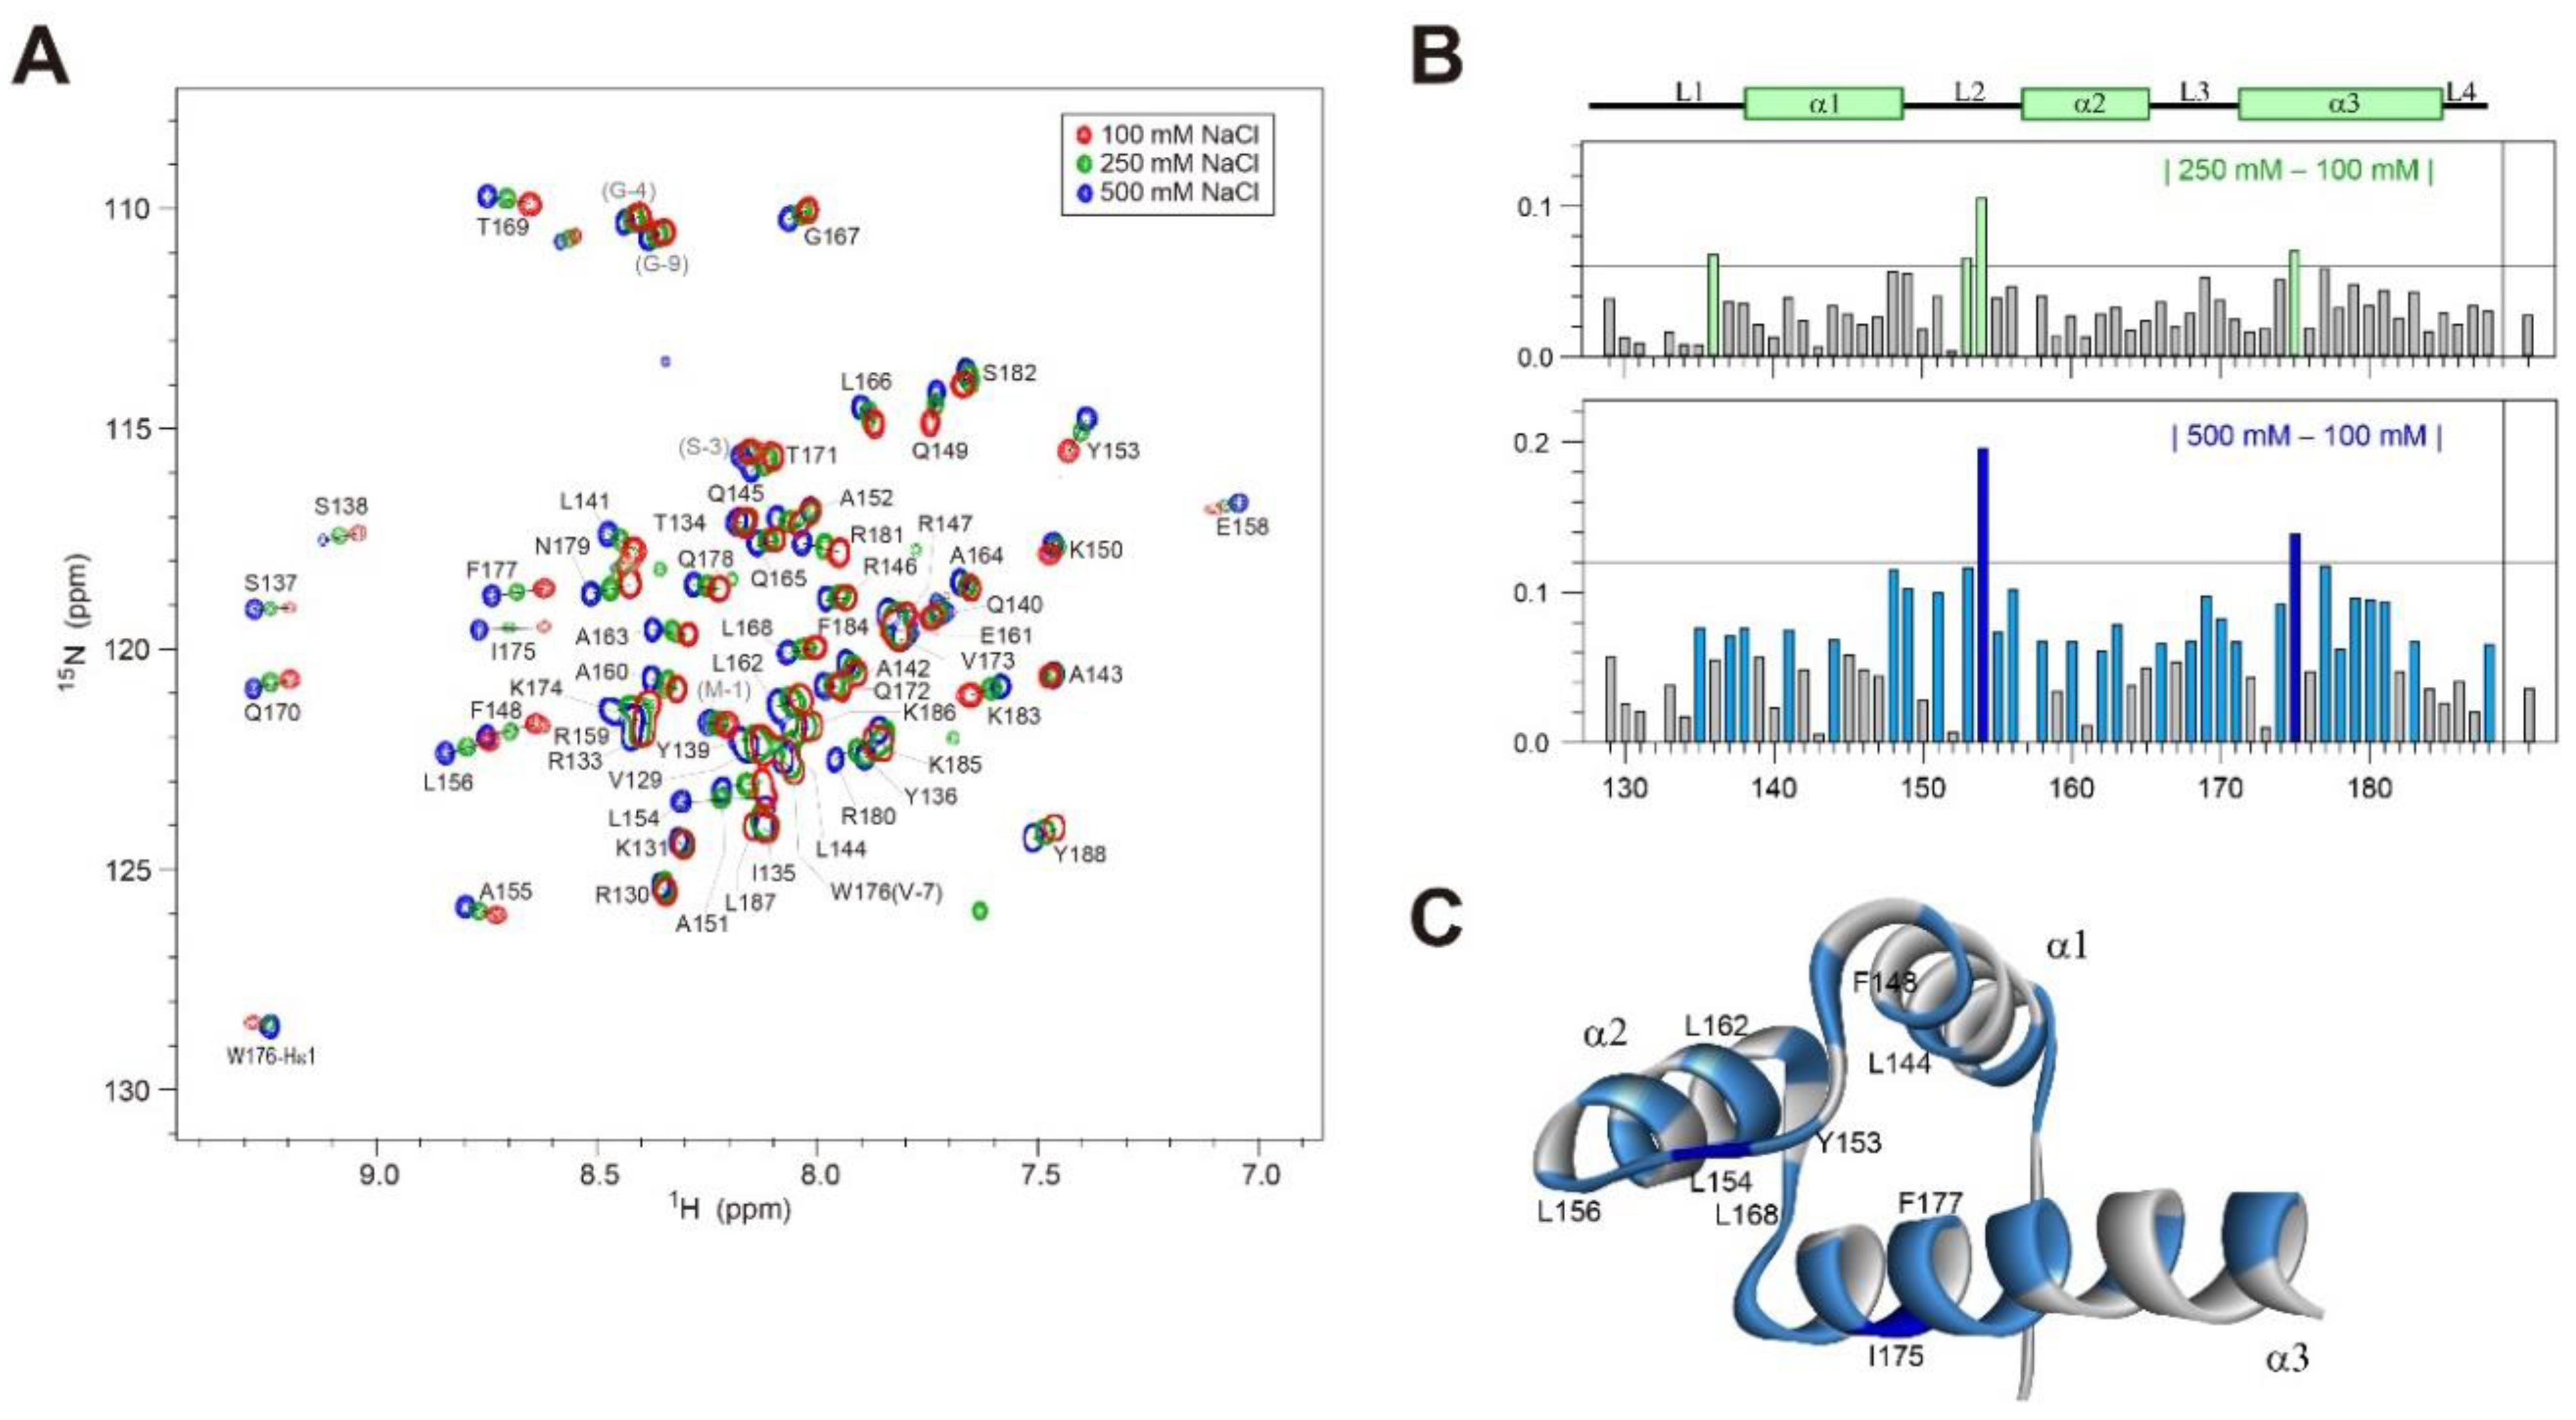
2.3. 1H/15N-HSQC Spectra of Dlx3-HD at Various [NaCl]
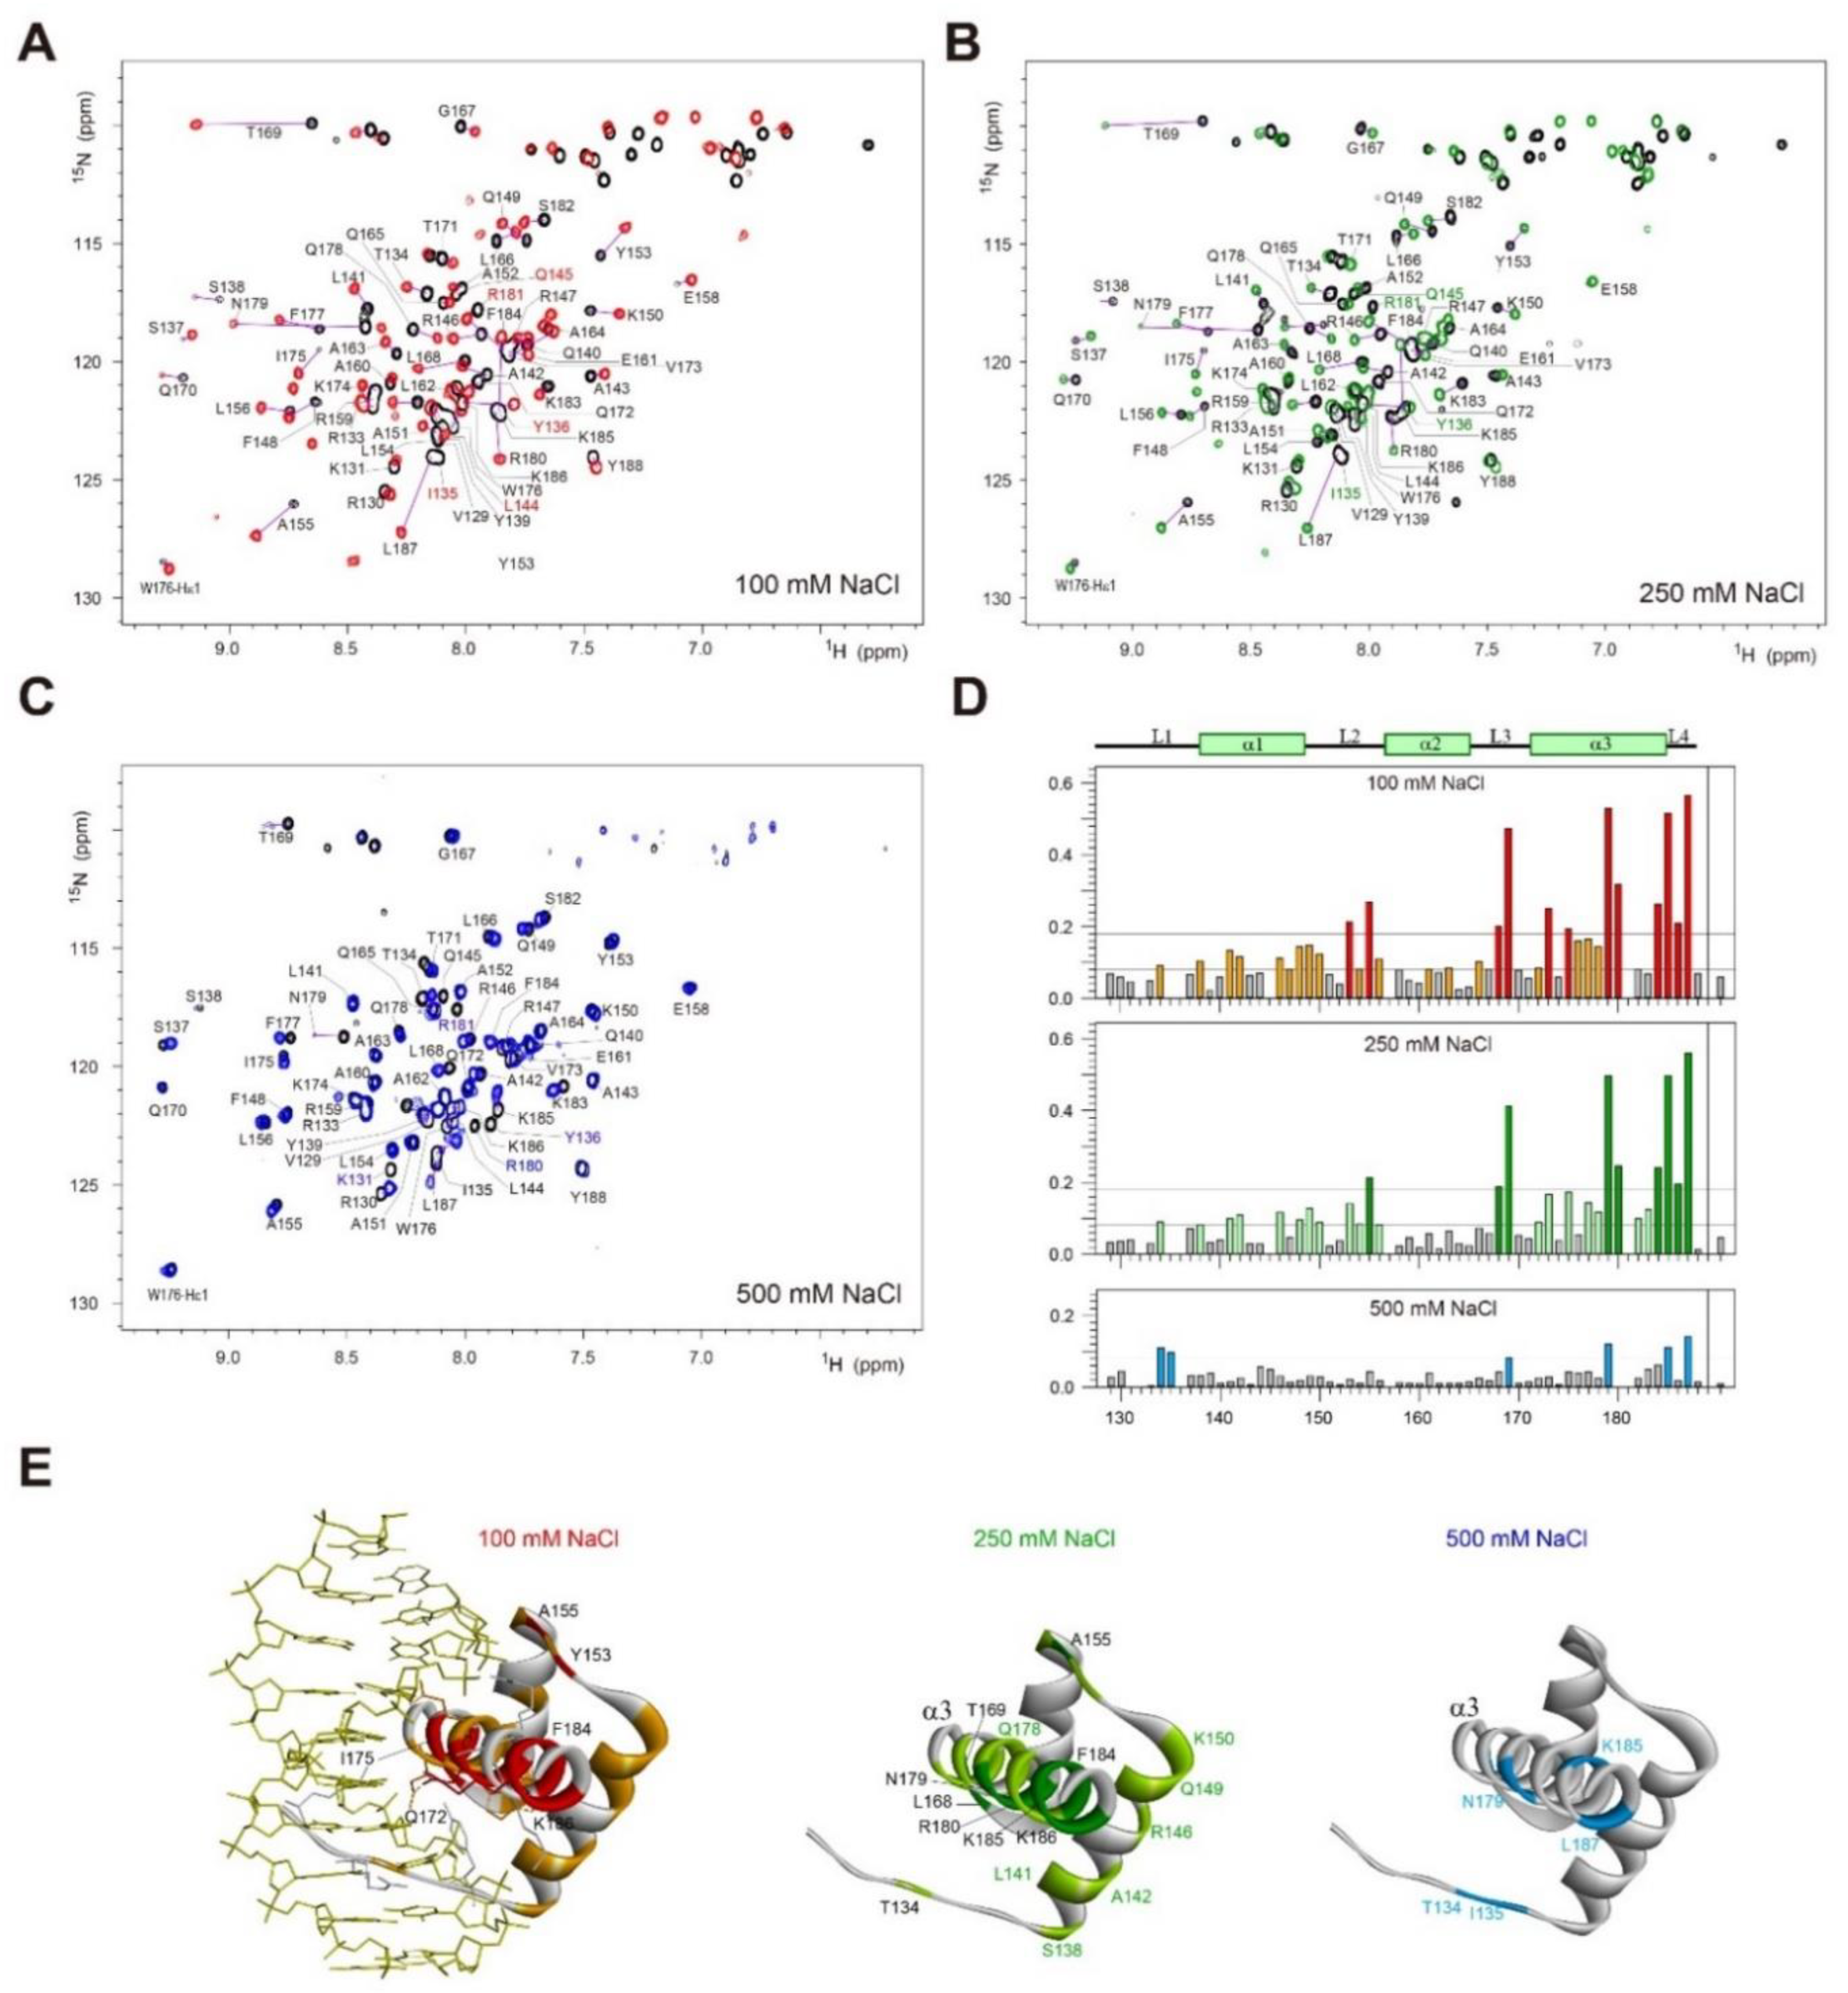
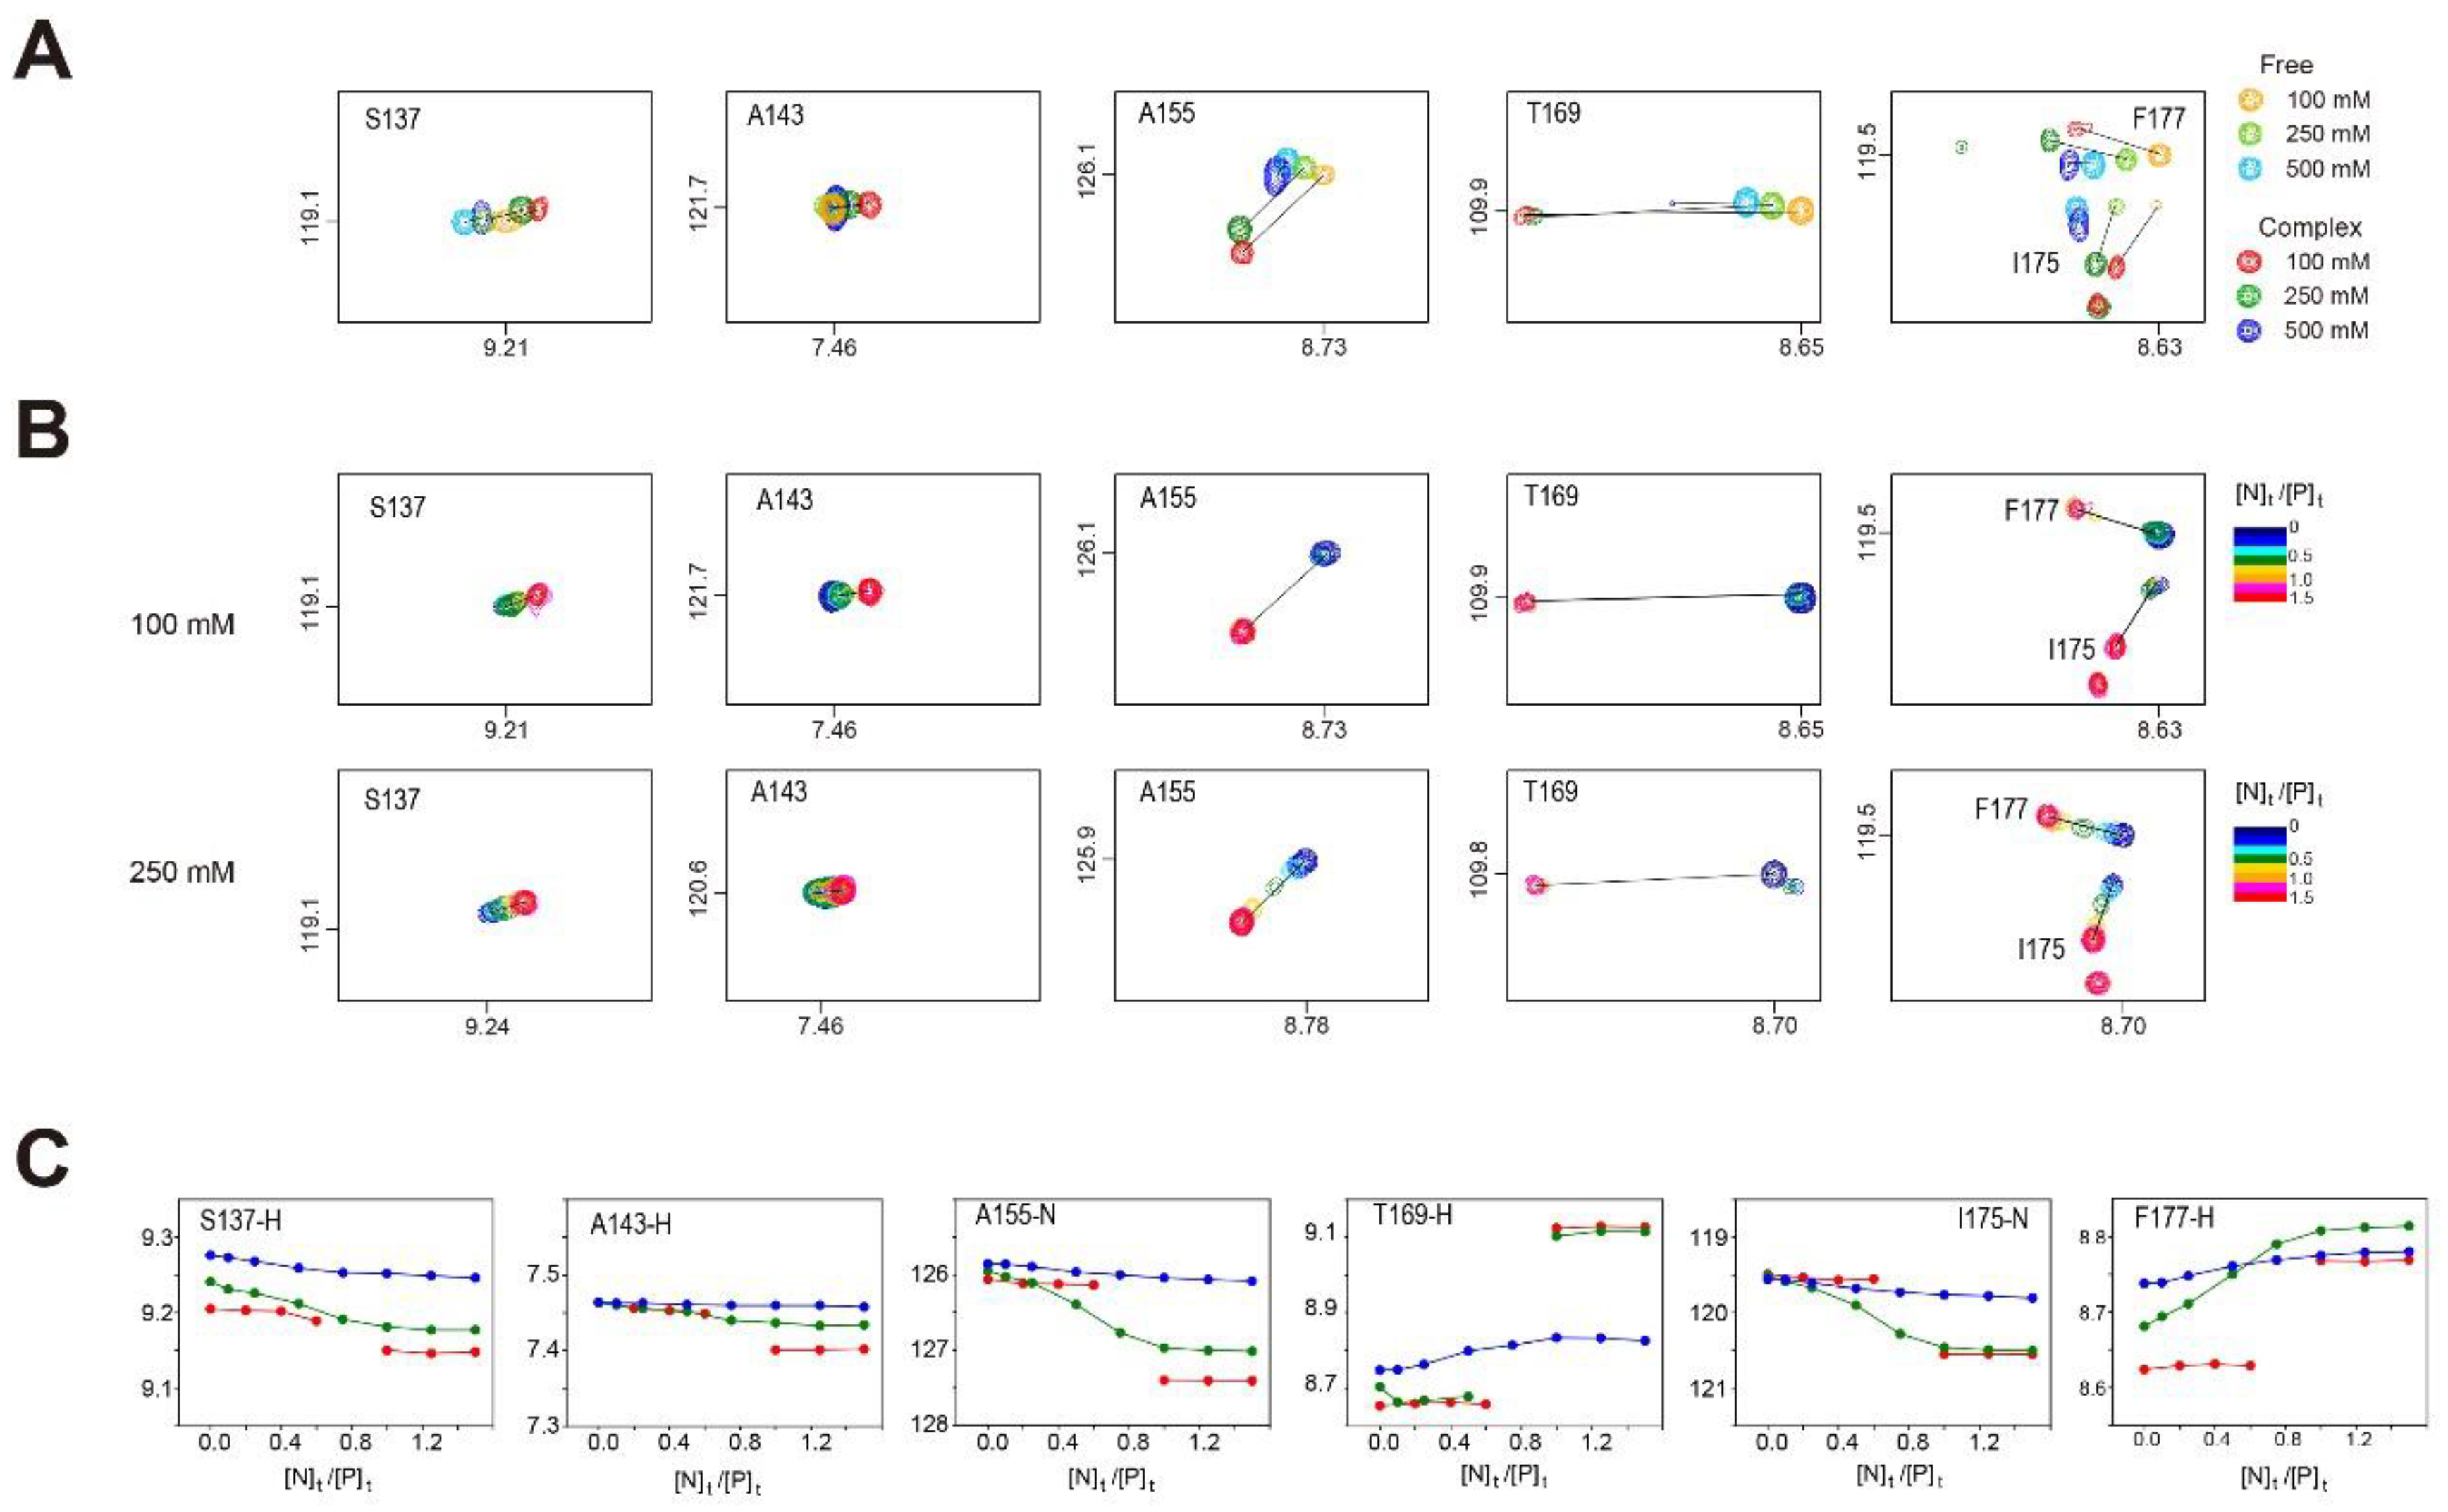
2.4. 1H/15N-HSQC Spectra of Dlx3-HD–dlx3DNA Complex at 100 mM NaCl
2.5. 1H/15N-HSQC Spectra of Dlx3-HD–dlx3DNA Complex at 250 and 500 mM NaCl
2.6. Change in 1H/15N-HSQC Spectra of Dlx3-HD in Complex with dlxDNA
3. Discussion
4. Materials and Methods
4.1. Sample Preparations
4.2. NMR Experiments
5. Conclusions
Author Contributions
Funding
Informed Consent Statement
Data Availability Statement
Acknowledgments
Conflicts of Interest
References
- Cohen, S.M.; Bronner, G.; Kuttner, F.; Jurgens, G.; Jackle, H. Distal-less encodes a homoeodomain protein required for limb development in Drosophila. Nature 1989, 338, 432–434. [Google Scholar] [CrossRef] [PubMed]
- Beanan, M.J.; Sargent, T.D. Regulation and function of Dlx3 in vertebrate development. Dev. Dyn. 2000, 218, 545–553. [Google Scholar] [CrossRef]
- Bendall, A.J.; Abate-Shen, C. Roles for Msx and Dlx homeoproteins in vertebrate development. Gene 2000, 247, 17–31. [Google Scholar] [CrossRef]
- Berghorn, K.A.; Clark-Campbell, P.A.; Han, L.; McGrattan, M.; Weiss, R.S.; Roberson, M.S. Smad6 represses Dlx3 transcriptional activity through inhibition of DNA binding. J. Biol. Chem. 2006, 281, 20357–20367. [Google Scholar] [CrossRef] [PubMed] [Green Version]
- Merlo, G.R.; Zerega, B.; Paleari, L.; Trombino, S.; Mantero, S.; Levi, G. Multiple functions of Dlx genes. Int. J. Dev. Biol. 2000, 44, 619–626. [Google Scholar] [PubMed]
- Zhao, N.; Han, D.; Liu, H.; Li, Y.; Wong, S.W.; Cao, Z.; Xu, J.; Zhang, X.; Cai, T.; Wang, Y.; et al. Senescence: Novel insight into DLX3 mutations leading to enhanced bone formation in Tricho-Dento-Osseous syndrome. Sci. Rep. 2016, 6, 38680. [Google Scholar] [CrossRef]
- Morasso, M.I.; Mahon, K.A.; Sargent, T.D. A Xenopus distal-less gene in transgenic mice: Conserved regulation in distal limb epidermis and other sites of epithelial-mesenchymal interaction. Proc. Natl. Acad. Sci. USA 1995, 92, 3968–3972. [Google Scholar] [CrossRef] [PubMed] [Green Version]
- Li, X.; Yang, G.; Fan, M. Effects of homeobox gene distal-less 3 on proliferation and odontoblastic differentiation of human dental pulp cells. J. Endod. 2012, 38, 1504–1510. [Google Scholar] [CrossRef]
- Hwang, J.; Mehrani, T.; Millar, S.E.; Morasso, M.I. Dlx3 is a crucial regulator of hair follicle differentiation and cycling. Development 2008, 135, 3149–3159. [Google Scholar] [CrossRef] [Green Version]
- Choi, S.J.; Song, I.S.; Ryu, O.H.; Choi, S.W.; Hart, P.S.; Wu, W.W.; Shen, R.F.; Hart, T.C. A 4 bp deletion mutation in DLX3 enhances osteoblastic differentiation and bone formation in vitro. Bone 2008, 42, 162–171. [Google Scholar] [CrossRef] [Green Version]
- Hassan, M.Q.; Javed, A.; Morasso, M.I.; Karlin, J.; Montecino, M.; van Wijnen, A.J.; Stein, G.S.; Stein, J.L.; Lian, J.B. Dlx3 transcriptional regulation of osteoblast differentiation: Temporal recruitment of Msx2, Dlx3, and Dlx5 homeodomain proteins to chromatin of the osteocalcin gene. Mol. Cell Biol. 2004, 24, 9248–9261. [Google Scholar] [CrossRef] [Green Version]
- Feledy, J.A.; Morasso, M.I.; Jang, S.I.; Sargent, T.D. Transcriptional activation by the homeodomain protein distal-less 3. Nucleic Acids Res. 1999, 27, 764–770. [Google Scholar] [CrossRef] [Green Version]
- Bryan, J.T.; Morasso, M.I. The Dlx3 protein harbors basic residues required for nuclear localization, transcriptional activity and binding to Msx1. J. Cell Sci. 2000, 113, 4013–4023. [Google Scholar] [CrossRef]
- Price, J.A.; Bowden, D.W.; Wright, J.T.; Pettenati, M.J.; Hart, T.C. Identification of a mutation in DLX3 associated with tricho-dento-osseous (TDO) syndrome. Hum. Mol. Genet. 1998, 7, 563–569. [Google Scholar] [CrossRef] [Green Version]
- Price, J.A.; Wright, J.T.; Kula, K.; Bowden, D.W.; Hart, T.C. A common DLX3 gene mutation is responsible for tricho-dento-osseous syndrome in Virginia and North Carolina families. J. Med. Genet. 1998, 35, 825–828. [Google Scholar] [CrossRef] [Green Version]
- Haldeman, R.J.; Cooper, L.F.; Hart, T.C.; Phillips, C.; Boyd, C.; Lester, G.E.; Wright, J.T. Increased bone density associated with DLX3 mutation in the tricho-dento-osseous syndrome. Bone 2004, 35, 988–997. [Google Scholar] [CrossRef]
- Lichtenstein, J.; Warson, R.; Jorgenson, R.; Dorst, J.P.; McKusick, V.A. The tricho-dento-osseous (TDO) syndrome. Am. J. Hum. Genet. 1972, 24, 569–582. [Google Scholar]
- Nieminen, P.; Lukinmaa, P.L.; Alapulli, H.; Methuen, M.; Suojarvi, T.; Kivirikko, S.; Peltola, J.; Asikainen, M.; Alaluusua, S. DLX3 homeodomain mutations cause tricho-dento-osseous syndrome with novel phenotypes. Cells Tissues Organs 2011, 194, 49–59. [Google Scholar] [CrossRef]
- Li, Y.; Han, D.; Zhang, H.; Liu, H.; Wong, S.; Zhao, N.; Qiu, L.; Feng, H. Morphological analyses and a novel de novo DLX3 mutation associated with tricho-dento-osseous syndrome in a Chinese family. Eur. J. Oral. Sci. 2015, 123, 228–234. [Google Scholar] [CrossRef]
- Jolma, A.; Yin, Y.; Nitta, K.R.; Dave, K.; Popov, A.; Taipale, M.; Enge, M.; Kivioja, T.; Morgunova, E.; Taipale, J. DNA-dependent formation of transcription factor pairs alters their binding specificity. Nature 2015, 527, 384–388. [Google Scholar] [CrossRef]
- Proudfoot, A.; Axelrod, H.L.; Geralt, M.; Fletterick, R.J.; Yumoto, F.; Deacon, A.M.; Elsliger, M.A.; Wilson, I.A.; Wuthrich, K.; Serrano, P. Dlx5 Homeodomain:DNA Complex: Structure, Binding and Effect of Mutations Related to Split Hand and Foot Malformation Syndrome. J. Mol. Biol. 2016, 428, 1130–1141. [Google Scholar] [CrossRef] [PubMed] [Green Version]
- Mayer, D.E.; Baal, C.; Litschauer-Poursadrollah, M.; Hemmer, W.; Jarisch, R. Uncombable hair and atopic dermatitis in a case of trichodento-osseous syndrome. J. Dtsch. Dermatol. Ges. 2010, 8, 102–104. [Google Scholar] [CrossRef] [PubMed]
- Ferreira, R.M.; Ware, A.D.; Matozel, E.; Price, A.C. Salt concentration modulates the DNA target search strategy of NdeI. Biochem. Biophys. Res. Commun. 2021, 534, 1059–1063. [Google Scholar] [CrossRef] [PubMed]
- Bigman, L.S.; Greenblatt, H.M.; Levy, Y. What are the Molecular Requirements for Protein Sliding along DNA? J. Phys. Chem. B 2021, 125, 3119–3131. [Google Scholar] [CrossRef]
- Park, C.; Raines, R.T. Quantitative analysis of the effect of salt concentration on enzymatic catalysis. J. Am. Chem. Soc. 2001, 123, 11472–11479. [Google Scholar] [CrossRef]
- Meneses, E.; Mittermaier, A. Electrostatic interactions in the binding pathway of a transient protein complex studied by NMR and isothermal titration calorimetry. J. Biol. Chem. 2014, 289, 27911–27923. [Google Scholar] [CrossRef] [Green Version]
- Lee, A.R.; Park, C.J.; Cheong, H.K.; Ryu, K.S.; Park, J.W.; Kwon, M.Y.; Lee, J.; Kim, K.K.; Choi, B.S.; Lee, J.H. Solution structure of the Z-DNA binding domain of PKR-like protein kinase from Carassius auratus and quantitative analyses of the intermediate complex during B-Z transition. Nucleic Acids Res. 2016, 44, 2936–2948. [Google Scholar] [CrossRef] [Green Version]
- Szatmari, D.; Sarkany, P.; Kocsis, B.; Nagy, T.; Miseta, A.; Barko, S.; Longauer, B.; Robinson, R.C.; Nyitrai, M. Intracellular ion concentrations and cation-dependent remodelling of bacterial MreB assemblies. Sci. Rep. 2020, 10, 12002. [Google Scholar] [CrossRef]
- Delaglio, F.; Grzesiek, S.; Vuister, G.W.; Zhu, G.; Pfeifer, J.; Bax, A. NMRPipe: A multidimensional spectral processing system based on UNIX pipes. J. Biomol. NMR 1995, 6, 277–293. [Google Scholar] [CrossRef]
- Goddard, T.D.; Kneller, D.G. SPARKY 3; University of California: San Francisco, CA, USA, 2003. [Google Scholar]


Publisher’s Note: MDPI stays neutral with regard to jurisdictional claims in published maps and institutional affiliations. |
© 2022 by the authors. Licensee MDPI, Basel, Switzerland. This article is an open access article distributed under the terms and conditions of the Creative Commons Attribution (CC BY) license (https://creativecommons.org/licenses/by/4.0/).
Share and Cite
Jin, H.-S.; Son, J.; Seo, Y.-J.; Choi, S.-R.; Ahn, H.-B.; Go, Y.; Lim, J.; Oh, K.-I.; Ryu, K.-S.; Lee, J.-H. Salt Dependence of DNA Binding Activity of Human Transcription Factor Dlx3. Int. J. Mol. Sci. 2022, 23, 9497. https://doi.org/10.3390/ijms23169497
Jin H-S, Son J, Seo Y-J, Choi S-R, Ahn H-B, Go Y, Lim J, Oh K-I, Ryu K-S, Lee J-H. Salt Dependence of DNA Binding Activity of Human Transcription Factor Dlx3. International Journal of Molecular Sciences. 2022; 23(16):9497. https://doi.org/10.3390/ijms23169497
Chicago/Turabian StyleJin, Ho-Seong, Juyeon Son, Yeo-Jin Seo, Seo-Ree Choi, Hye-Bin Ahn, Youyeon Go, Juhee Lim, Kwang-Im Oh, Kyoung-Seok Ryu, and Joon-Hwa Lee. 2022. "Salt Dependence of DNA Binding Activity of Human Transcription Factor Dlx3" International Journal of Molecular Sciences 23, no. 16: 9497. https://doi.org/10.3390/ijms23169497
APA StyleJin, H.-S., Son, J., Seo, Y.-J., Choi, S.-R., Ahn, H.-B., Go, Y., Lim, J., Oh, K.-I., Ryu, K.-S., & Lee, J.-H. (2022). Salt Dependence of DNA Binding Activity of Human Transcription Factor Dlx3. International Journal of Molecular Sciences, 23(16), 9497. https://doi.org/10.3390/ijms23169497