
Plasma Microbiome in COVID-19 Subjects: An Indicator of Gut Barrier Defects and Dysbiosis

 ,
,  ,
,  , and
, and
Abstract
:1. Introduction
2. Results
2.1. Clinical Characteristics of the COVID-19 Patients and Healthy Individuals
2.2. Laboratory Findings and COVID-19 Manifestation in Patients
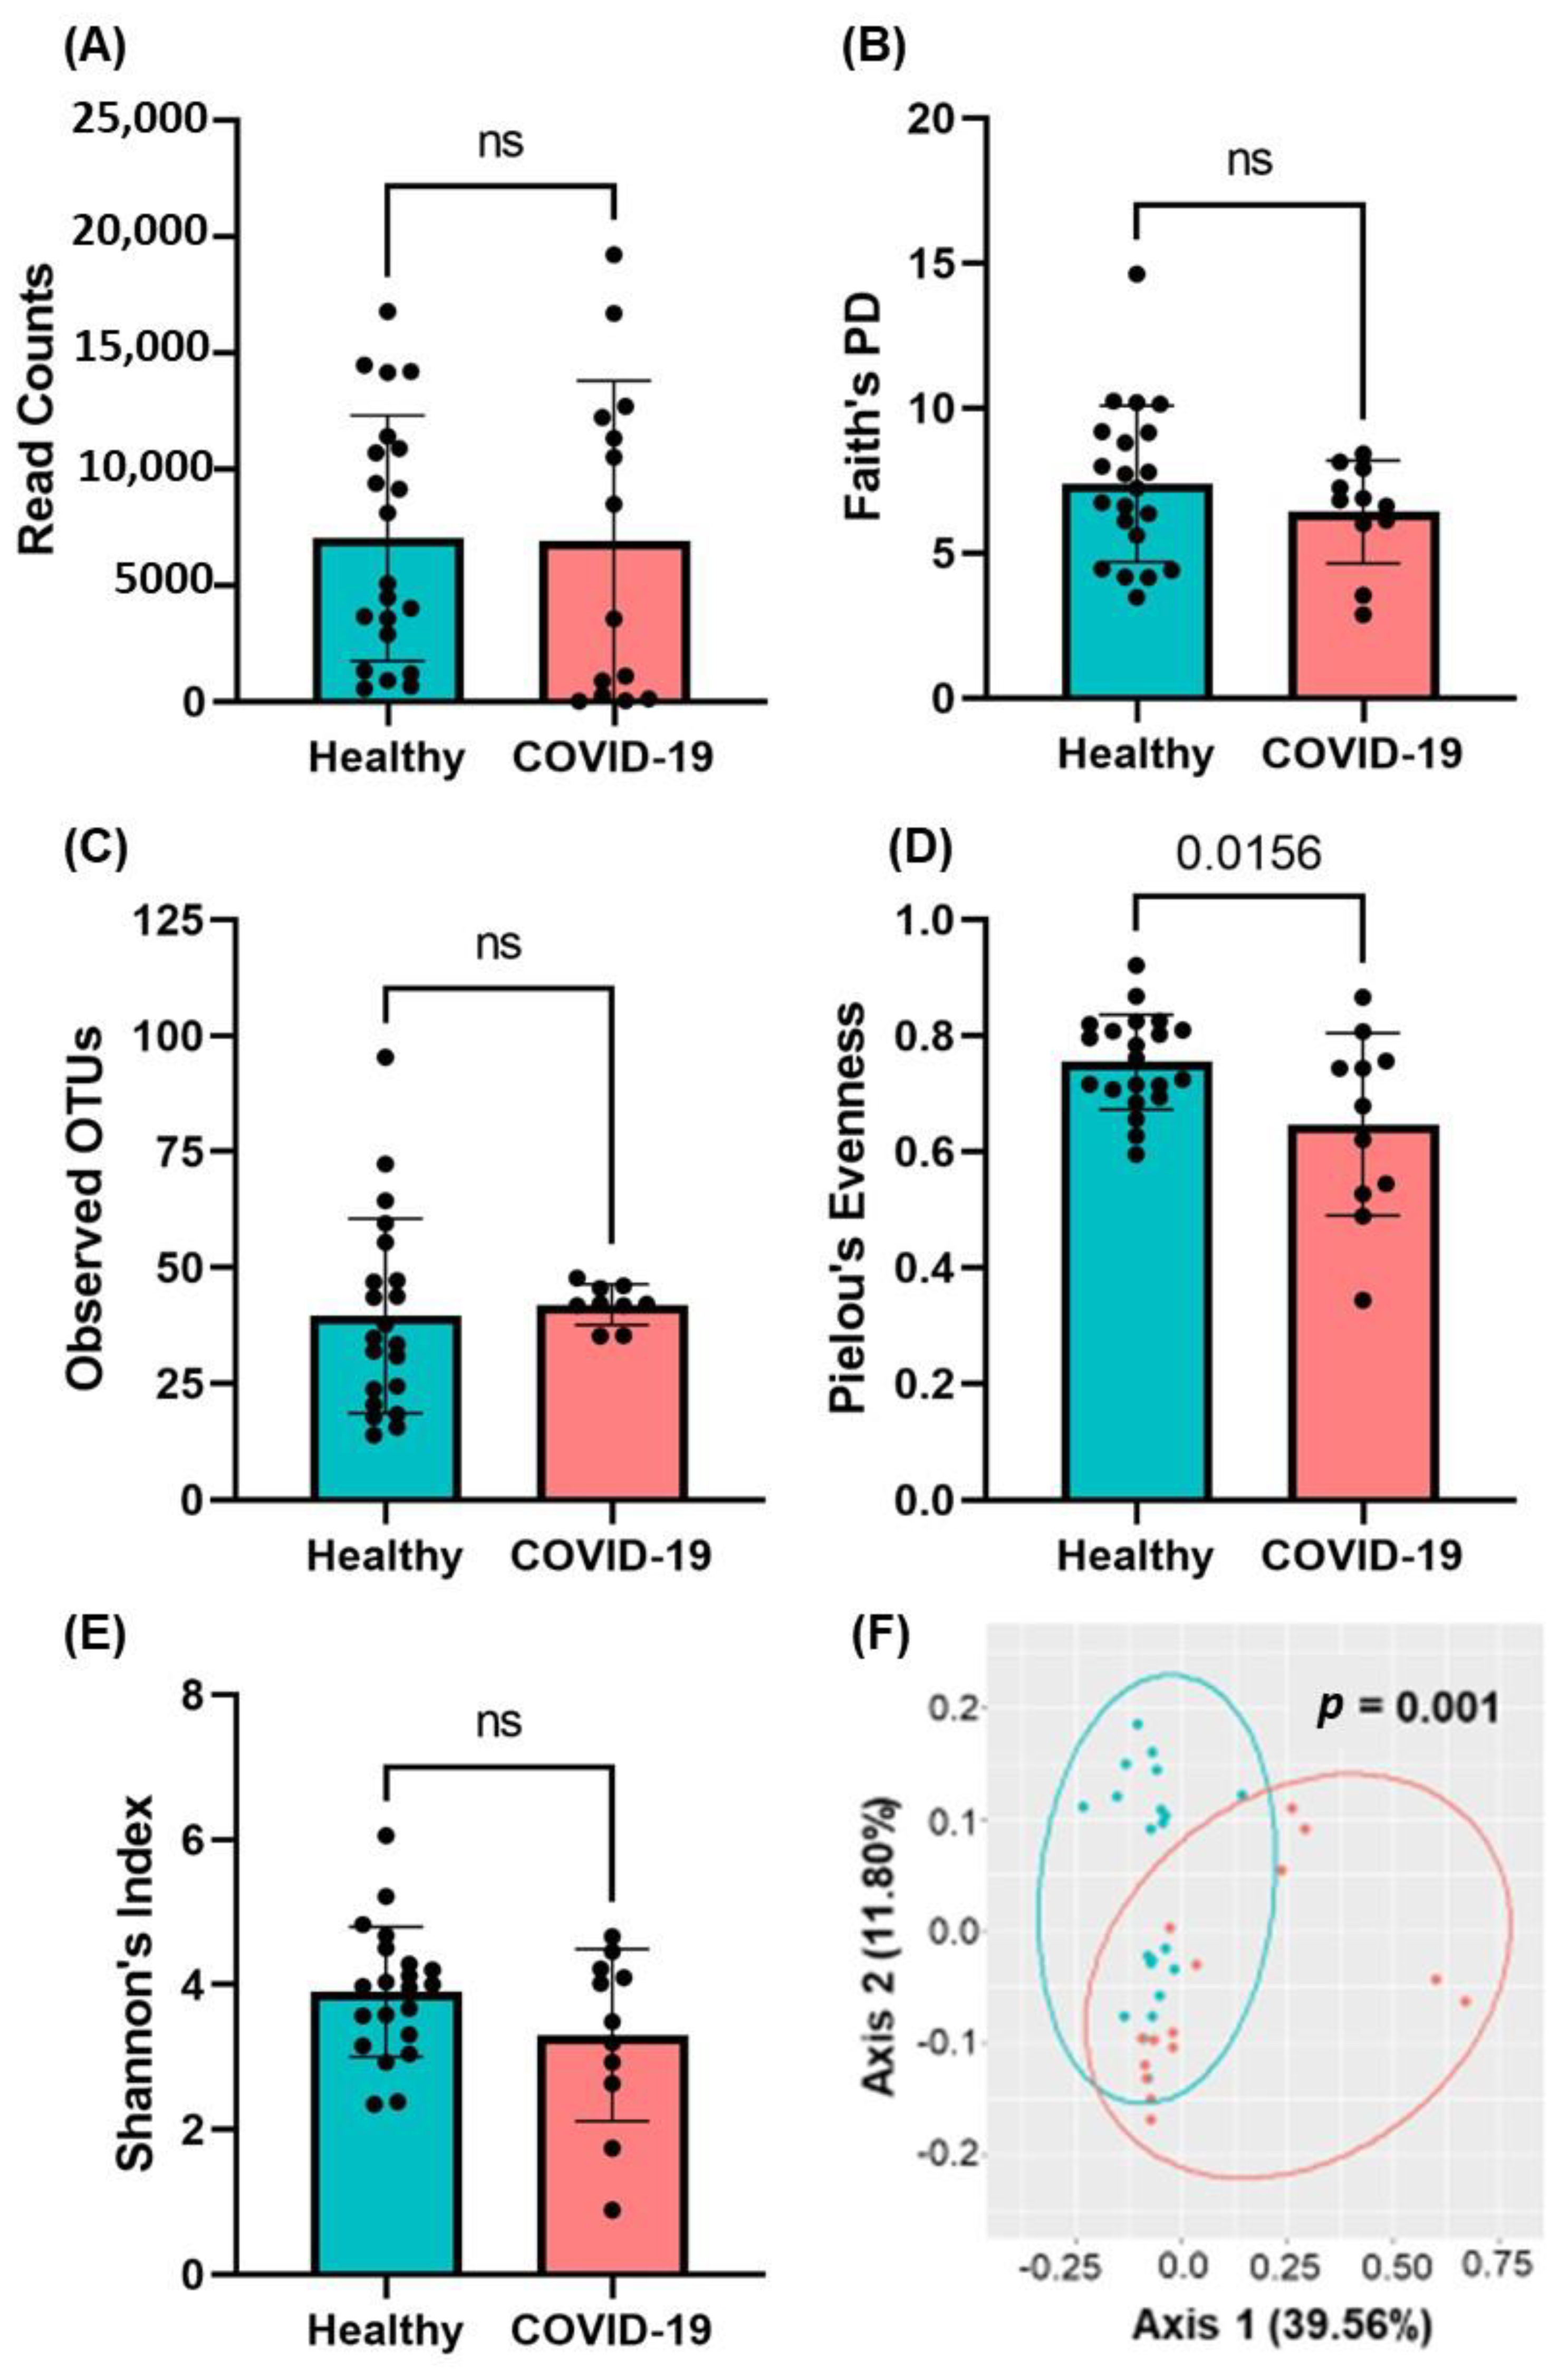
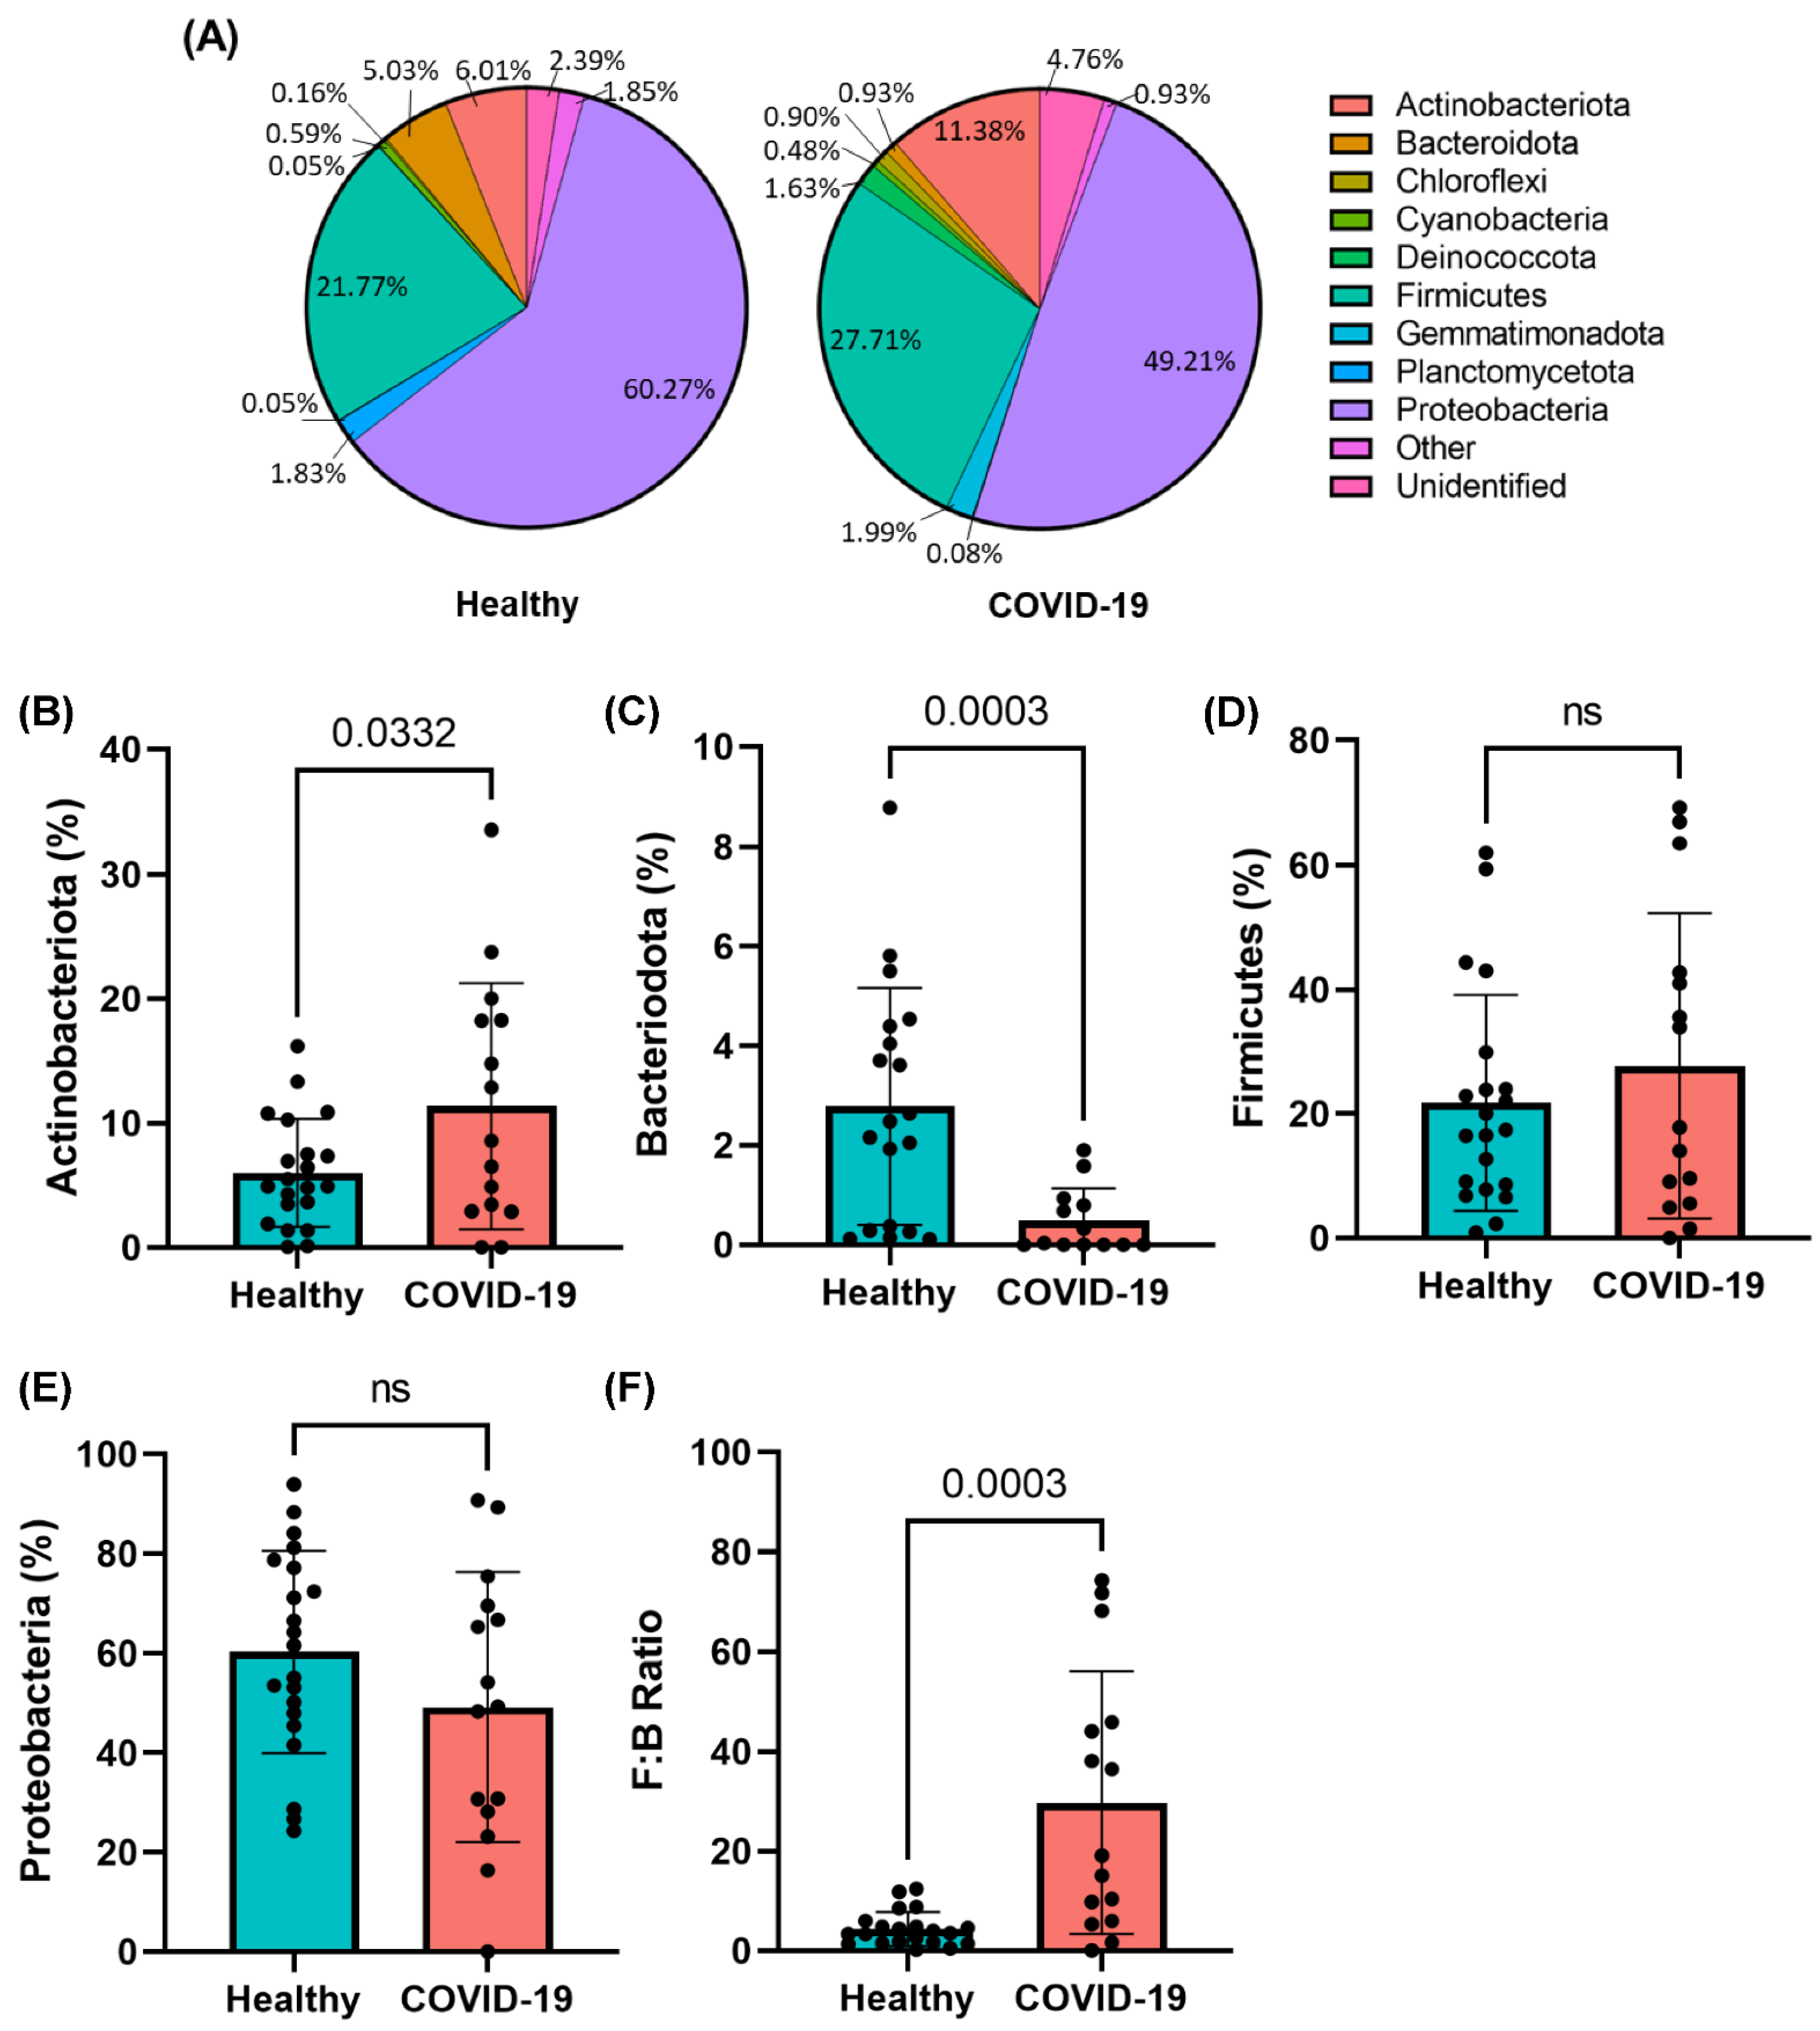
2.3. Presence of Gut Microbial Abundance in the Blood of COVID-19 Patients
2.4. Phylogenic Differences in Plasma Microbiome in the COVID-19 Plasma Samples
2.5. SARS-CoV-2 Infections Promote Gut Barrier Defects and Endotoxemia in COVID-19 Patients
2.6. COVID-19 Infections Promote Increased Pro-Inflammatory Cytokine Production
3. Discussion
4. Material and Methods
4.1. Study Subjects
4.2. Microbial DNA Extraction and 16S rRNA Sequencing
4.3. Bioinformatic Analysis
4.4. Alpha and Beta Diversity Analysis
4.5. Measurement of Gut Permeability Marker FABP2
4.6. Enzyme-Linked Immunosorbent Assay for Measuring Gut Microbial Peptide Translocation into the Systemic Circulation
4.7. Immunological Marker Detection in Human Plasma
4.8. Statistical Analysis
Author Contributions
Funding
Institutional Review Board Statement
Informed Consent Statement
Data Availability Statement
Conflicts of Interest
References
- WHO Coronavirus (COVID-19) Dashboard. Available online: https://covid19.who.int/ (accessed on 21 July 2022).
- COVID-19 Weekly Cases and Deaths per 100,000 Population by Age, Race/Ethnicity, and Sex. Available online: https://covid.cdc.gov/covid-data-tracker/#demographicsovertime (accessed on 21 July 2022).
- Sanyaolu, A.; Okorie, C.; Marinkovic, A.; Patidar, R.; Younis, K.; Desai, P.; Hosein, Z.; Padda, I.; Mangat, J.; Altaf, M. Comorbidity and its Impact on Patients with COVID-19. SN Compr. Clin. Med. 2020, 2, 1069–1076. [Google Scholar] [CrossRef] [PubMed]
- Guzik, T.J.; Mohiddin, S.A.; Dimarco, A.; Patel, V.; Savvatis, K.; Marelli-Berg, F.M.; Madhur, M.S.; Tomaszewski, M.; Maffia, P.; D’Acquisto, F.; et al. COVID-19 and the cardiovascular system: Implications for risk assessment, diagnosis, and treatment options. Cardiovasc. Res. 2020, 116, 1666–1687. [Google Scholar] [CrossRef]
- Ruan, Q.; Yang, K.; Wang, W.; Jiang, L.; Song, J. Clinical predictors of mortality due to COVID-19 based on an analysis of data of 150 patients from Wuhan, China. Intensive Care Med. 2020, 46, 846–848. [Google Scholar] [CrossRef]
- Zhou, F.; Yu, T.; Du, R.; Fan, G.; Liu, Y.; Liu, Z.; Xiang, J.; Wang, Y.; Song, B.; Gu, X.; et al. Clinical course and risk factors for mortality of adult inpatients with COVID-19 in Wuhan, China: A retrospective cohort study. Lancet 2020, 395, 1054–1062. [Google Scholar] [CrossRef]
- Dorjee, K.; Kim, H.; Bonomo, E.; Dolma, R. Prevalence and predictors of death and severe disease in patients hospitalized due to COVID-19: A comprehensive systematic review and meta-analysis of 77 studies and 38,000 patients. PLoS ONE 2020, 15, e0243191. [Google Scholar] [CrossRef]
- Mehra, M.R.; Desai, S.S.; Kuy, S.; Henry, T.D.; Patel, A.N. Cardiovascular Disease, Drug Therapy, and Mortality in COVID-19. N. Engl. J. Med. 2020, 382, e102. [Google Scholar] [CrossRef]
- Lim, S.; Bae, J.H.; Kwon, H.S.; Nauck, M.A. COVID-19 and diabetes mellitus: From pathophysiology to clinical management. Nat. Rev. Endocrinol. 2021, 17, 11–30. [Google Scholar] [CrossRef]
- Lee, L.Y.; Cazier, J.B.; Angelis, V.; Arnold, R.; Bisht, V.; Campton, N.A.; Chackathayil, J.; Cheng, V.W.; Curley, H.M.; Fittall, M.W.; et al. COVID-19 mortality in patients with cancer on chemotherapy or other anticancer treatments: A prospective cohort study. Lancet 2020, 395, 1919–1926. [Google Scholar] [CrossRef]
- Wu, C.P.; Adhi, F.; Highland, K. Recognition and management of respiratory co-infection and secondary bacterial pneumonia in patients with COVID-19. Cleve Clin. J. Med. 2020, 87, 659–663. [Google Scholar] [CrossRef]
- Langford, B.J.; So, M.; Raybardhan, S.; Leung, V.; Westwood, D.; MacFadden, D.R.; Soucy, J.R.; Daneman, N. Bacterial co-infection and secondary infection in patients with COVID-19: A living rapid review and meta-analysis. Clin. Microbiol. Infect. 2020, 26, 1622–1629. [Google Scholar] [CrossRef]
- Feng, Y.; Ling, Y.; Bai, T.; Xie, Y.; Huang, J.; Li, J.; Xiong, W.; Yang, D.; Chen, R.; Lu, F.; et al. COVID-19 with Different Severities: A Multicenter Study of Clinical Features. Am. J. Respir. Crit. Care Med. 2020, 201, 1380–1388. [Google Scholar] [CrossRef]
- Rawson, T.M.; Moore, L.S.P.; Zhu, N.; Ranganathan, N.; Skolimowska, K.; Gilchrist, M.; Satta, G.; Cooke, G.; Holmes, A. Bacterial and Fungal Coinfection in Individuals With Coronavirus: A Rapid Review To Support COVID-19 Antimicrobial Prescribing. Clin. Infect. Dis. 2020, 71, 2459–2468. [Google Scholar] [CrossRef]
- Hunt, R.H.; East, J.E.; Lanas, A.; Malfertheiner, P.; Satsangi, J.; Scarpignato, C.; Webb, G.J. COVID-19 and Gastrointestinal Disease: Implications for the Gastroenterologist. Dig. Dis. 2021, 39, 119–139. [Google Scholar] [CrossRef] [PubMed]
- El Moheb, M.; Naar, L.; Christensen, M.A.; Kapoen, C.; Maurer, L.R.; Farhat, M.; Kaafarani, H.M.A. Gastrointestinal Complications in Critically Ill Patients With and Without COVID-19. JAMA 2020, 324, 1899–1901. [Google Scholar] [CrossRef]
- Zhong, P.; Xu, J.; Yang, D.; Shen, Y.; Wang, L.; Feng, Y.; Du, C.; Song, Y.; Wu, C.; Hu, X.; et al. COVID-19-associated gastrointestinal and liver injury: Clinical features and potential mechanisms. Signal Transduct. Target. Ther. 2020, 5, 256. [Google Scholar] [CrossRef] [PubMed]
- Giron, L.B.; Dweep, H.; Yin, X.; Wang, H.; Damra, M.; Goldman, A.R.; Gorman, N.; Palmer, C.S.; Tang, H.-Y.; Shaikh, M.W.; et al. Severe COVID-19 Is Fueled by Disrupted Gut Barrier Integrity. medRxiv 2021. [Google Scholar] [CrossRef]
- Pan, L.; Mu, M.; Yang, P.; Sun, Y.; Wang, R.; Yan, J.; Li, P.; Hu, B.; Wang, J.; Hu, C.; et al. Clinical Characteristics of COVID-19 Patients With Digestive Symptoms in Hubei, China: A Descriptive, Cross-Sectional, Multicenter Study. Am. J. Gastroenterol. 2020, 115, 766–773. [Google Scholar] [CrossRef]
- Cheung, K.S.; Hung, I.F.N.; Chan, P.P.Y.; Lung, K.C.; Tso, E.; Liu, R.; Ng, Y.Y.; Chu, M.Y.; Chung, T.W.H.; Tam, A.R.; et al. Gastrointestinal Manifestations of SARS-CoV-2 Infection and Virus Load in Fecal Samples From a Hong Kong Cohort: Systematic Review and Meta-analysis. Gastroenterology 2020, 159, 81–95. [Google Scholar] [CrossRef]
- Sultan, S.; Altayar, O.; Siddique, S.M.; Davitkov, P.; Feuerstein, J.D.; Lim, J.K.; Falck-Ytter, Y.; El-Serag, H.B.; AGA Institute. AGA Institute Rapid Review of the Gastrointestinal and Liver Manifestations of COVID-19, Meta-Analysis of International Data, and Recommendations for the Consultative Management of Patients with COVID-19. Gastroenterology 2020, 159, 320–334.e327. [Google Scholar] [CrossRef]
- El Ouali, S.; Achkar, J.P.; Lashner, B.; Regueiro, M. Gastrointestinal manifestations of COVID-19. Cleve Clin. J. Med. 2021. [Google Scholar] [CrossRef] [PubMed]
- Morris, E.K.; Caruso, T.; Buscot, F.; Fischer, M.; Hancock, C.; Maier, T.S.; Meiners, T.; Muller, C.; Obermaier, E.; Prati, D.; et al. Choosing and using diversity indices: Insights for ecological applications from the German Biodiversity Exploratories. Ecol. Evol. 2014, 4, 3514–3524. [Google Scholar] [CrossRef]
- Simpson, E.H. Measurement of Diversity. Nat. Biomed. Eng. 1949, 163, 668. [Google Scholar] [CrossRef]
- Jost, L. The Relation between Evenness and Diversity. Diversity 2010, 2, 207–232. [Google Scholar] [CrossRef]
- Fernandes, J.; Su, W.; Rahat-Rozenbloom, S.; Wolever, T.M.; Comelli, E.M. Adiposity, gut microbiota and faecal short chain fatty acids are linked in adult humans. Nutr. Diabetes 2014, 4, e121. [Google Scholar] [CrossRef]
- Durk, R.P.; Castillo, E.; Marquez-Magana, L.; Grosicki, G.J.; Bolter, N.D.; Lee, C.M.; Bagley, J.R. Gut Microbiota Composition Is Related to Cardiorespiratory Fitness in Healthy Young Adults. Int. J. Sport Nutr. Exerc. Metab. 2019, 29, 249–253. [Google Scholar] [CrossRef] [PubMed]
- Spychala, M.S.; Venna, V.R.; Jandzinski, M.; Doran, S.J.; Durgan, D.J.; Ganesh, B.P.; Ajami, N.J.; Putluri, N.; Graf, J.; Bryan, R.M.; et al. Age-related changes in the gut microbiota influence systemic inflammation and stroke outcome. Ann. Neurol. 2018, 84, 23–36. [Google Scholar] [CrossRef]
- Belancic, A. Gut microbiome dysbiosis and endotoxemia—Additional pathophysiological explanation for increased COVID-19 severity in obesity. Obes. Med. 2020, 20, 100302. [Google Scholar] [CrossRef]
- Kim, H.N.; Joo, E.J.; Lee, C.W.; Ahn, K.S.; Kim, H.L.; Park, D.I.; Park, S.K. Reversion of Gut Microbiota during the Recovery Phase in Patients with Asymptomatic or Mild COVID-19: Longitudinal Study. Microorganisms 2021, 9, 1237. [Google Scholar] [CrossRef]
- Augusti, P.R.; Conterato, G.M.M.; Denardin, C.C.; Prazeres, I.D.; Serra, A.T.; Bronze, M.R.; Emanuelli, T. Bioactivity, bioavailability, and gut microbiota transformations of dietary phenolic compounds: Implications for COVID-19. J. Nutr. Biochem. 2021, 97, 108787. [Google Scholar] [CrossRef]
- Charteris, W.P.; Kelly, P.M.; Morelli, L.; Collins, J.K. Selective detection, enumeration and identification of potentially probiotic Lactobacillus and Bifidobacterium species in mixed bacterial populations. Int. J. Food. Microbiol. 1997, 35, 1–27. [Google Scholar] [CrossRef]
- Bozzi Cionci, N.; Baffoni, L.; Gaggia, F.; Di Gioia, D. Therapeutic Microbiology: The Role of Bifidobacterium breve as Food Supplement for the Prevention/Treatment of Paediatric Diseases. Nutrients 2018, 10, 1723. [Google Scholar] [CrossRef]
- Dahl, C.; Stanislawski, M.; Iszatt, N.; Mandal, S.; Lozupone, C.; Clemente, J.C.; Knight, R.; Stigum, H.; Eggesbo, M. Gut microbiome of mothers delivering prematurely shows reduced diversity and lower relative abundance of Bifidobacterium and Streptococcus. PLoS ONE 2017, 12, e0184336. [Google Scholar] [CrossRef]
- De Wolfe, T.J.; Eggers, S.; Barker, A.K.; Kates, A.E.; Dill-McFarland, K.A.; Suen, G.; Safdar, N. Oral probiotic combination of Lactobacillus and Bifidobacterium alters the gastrointestinal microbiota during antibiotic treatment for Clostridium difficile infection. PLoS ONE 2018, 13, e0204253. [Google Scholar] [CrossRef]
- Wauters, G.; Haase, G.; Avesani, V.; Charlier, J.; Janssens, M.; Van Broeck, J.; Delmee, M. Identification of a novel Brevibacterium species isolated from humans and description of Brevibacterium sanguinis sp. nov. J. Clin. Microbiol 2004, 42, 2829–2832. [Google Scholar] [CrossRef]
- Dass, K.N.; Smith, M.A.; Gill, V.J.; Goldstein, S.A.; Lucey, D.R. Brevibacterium endocarditis: A first report. Clin. Infect. Dis. 2002, 35, e20–e21. [Google Scholar] [CrossRef]
- Funke, G.; Carlotti, A. Differentiation of Brevibacterium spp. encountered in clinical specimens. J. Clin. Microbiol. 1994, 32, 1729–1732. [Google Scholar] [CrossRef] [PubMed]
- Ulrich, S.; Zbinden, R.; Pagano, M.; Fischler, M.; Speich, R. Central venous catheter infection with Brevibacterium sp. in an immunocompetent woman: Case report and review of the literature. Infection 2006, 34, 103–106. [Google Scholar] [CrossRef]
- Brazzola, P.; Zbinden, R.; Rudin, C.; Schaad, U.B.; Heininger, U. Brevibacterium casei sepsis in an 18-year-old female with AIDS. J. Clin. Microbiol. 2000, 38, 3513–3514. [Google Scholar] [CrossRef]
- De Baere, T.; Verhelst, R.; Labit, C.; Verschraegen, G.; Wauters, G.; Claeys, G.; Vaneechoutte, M. Bacteremic infection with Pantoea ananatis. J. Clin. Microbiol. 2004, 42, 4393–4395. [Google Scholar] [CrossRef]
- Asai, N.; Koizumi, Y.; Yamada, A.; Sakanashi, D.; Watanabe, H.; Kato, H.; Shiota, A.; Hagihara, M.; Suematsu, H.; Yamagishi, Y.; et al. Pantoea dispersa bacteremia in an immunocompetent patient: A case report and review of the literature. J. Med. Case Rep. 2019, 13, 33. [Google Scholar] [CrossRef]
- Belkaid, Y.; Hand, T.W. Role of the microbiota in immunity and inflammation. Cell 2014, 157, 121–141. [Google Scholar] [CrossRef] [PubMed]
- Yan, A.W.; Schnabl, B. Bacterial translocation and changes in the intestinal microbiome associated with alcoholic liver disease. World J. Hepatol. 2012, 4, 110–118. [Google Scholar] [CrossRef] [PubMed]
- Keshavarzian, A.; Choudhary, S.; Holmes, E.W.; Yong, S.; Banan, A.; Jakate, S.; Fields, J.Z. Preventing gut leakiness by oats supplementation ameliorates alcohol-induced liver damage in rats. J. Pharmacol. Exp. Ther. 2001, 299, 442–448. [Google Scholar] [PubMed]
- Chakaroun, R.M.; Massier, L.; Kovacs, P. Gut Microbiome, Intestinal Permeability, and Tissue Bacteria in Metabolic Disease: Perpetrators or Bystanders? Nutrients 2020, 12, 1082. [Google Scholar] [CrossRef]
- Guarner, C.; Gonzalez-Navajas, J.M.; Sanchez, E.; Soriando, G.; Frances, R.; Chiva, M.; Zapater, P.; Benlloch, S.; Munoz, C.; Pascual, S.; et al. The detection of bacterial DNA in blood of rats with CCl4-induced cirrhosis with ascites represents episodes of bacterial translocation. Hepatology 2006, 44, 633–639. [Google Scholar] [CrossRef]
- Runyon, B.A.; Squier, S.; Borzio, M. Translocation of gut bacteria in rats with cirrhosis to mesenteric lymph nodes partially explains the pathogenesis of spontaneous bacterial peritonitis. J. Hepatol. 1994, 21, 792–796. [Google Scholar] [CrossRef]
- Lau, E.; Marques, C.; Pestana, D.; Santoalha, M.; Carvalho, D.; Freitas, P.; Calhau, C. The role of I-FABP as a biomarker of intestinal barrier dysfunction driven by gut microbiota changes in obesity. Nutr. Metab. (Lond.) 2016, 13, 31. [Google Scholar] [CrossRef]
- Pelsers, M.M.; Namiot, Z.; Kisielewski, W.; Namiot, A.; Januszkiewicz, M.; Hermens, W.T.; Glatz, J.F. Intestinal-type and liver-type fatty acid-binding protein in the intestine. Tissue distribution and clinical utility. Clin. Biochem. 2003, 36, 529–535. [Google Scholar] [CrossRef]
- Stevens, B.R.; Goel, R.; Seungbum, K.; Richards, E.M.; Holbert, R.C.; Pepine, C.J.; Raizada, M.K. Increased human intestinal barrier permeability plasma biomarkers zonulin and FABP2 correlated with plasma LPS and altered gut microbiome in anxiety or depression. Gut 2018, 67, 1555–1557. [Google Scholar] [CrossRef]
- Graupera, I.; Coll, M.; Pose, E.; Elia, C.; Piano, S.; Sola, E.; Blaya, D.; Huelin, P.; Sole, C.; Moreira, R.; et al. Adipocyte Fatty-Acid Binding Protein is Overexpressed in Cirrhosis and Correlates with Clinical Outcomes. Sci. Rep. 2017, 7, 1829. [Google Scholar] [CrossRef]
- Zhang, J.; Zhao, D.; Yi, D.; Wu, M.; Chen, H.; Wu, T.; Zhou, J.; Li, P.; Hou, Y.; Wu, G. Microarray analysis reveals the inhibition of intestinal expression of nutrient transporters in piglets infected with porcine epidemic diarrhea virus. Sci. Rep. 2019, 9, 19798. [Google Scholar] [CrossRef] [PubMed]
- Wang, J.; Chen, W.D.; Wang, Y.D. The Relationship Between Gut Microbiota and Inflammatory Diseases: The Role of Macrophages. Front. Microbiol. 2020, 11, 1065. [Google Scholar] [CrossRef]
- Sochocka, M.; Donskow-Lysoniewska, K.; Diniz, B.S.; Kurpas, D.; Brzozowska, E.; Leszek, J. The Gut Microbiome Alterations and Inflammation-Driven Pathogenesis of Alzheimer’s Disease-a Critical Review. Mol. Neurobiol. 2019, 56, 1841–1851. [Google Scholar] [CrossRef]
- Ichinohe, T.; Pang, I.K.; Kumamoto, Y.; Peaper, D.R.; Ho, J.H.; Murray, T.S.; Iwasaki, A. Microbiota regulates immune defense against respiratory tract influenza A virus infection. Proc. Natl. Acad. Sci. USA 2011, 108, 5354–5359. [Google Scholar] [CrossRef]
- Fernandez-Tome, S.; Marin, A.C.; Ortega Moreno, L.; Baldan-Martin, M.; Mora-Gutierrez, I.; Lanas-Gimeno, A.; Moreno-Monteagudo, J.A.; Santander, C.; Sanchez, B.; Chaparro, M.; et al. Immunomodulatory Effect of Gut Microbiota-Derived Bioactive Peptides on Human Immune System from Healthy Controls and Patients with Inflammatory Bowel Disease. Nutrients 2019, 11, 2605. [Google Scholar] [CrossRef] [PubMed]
- Yucel, G.; Zhao, Z.; El-Battrawy, I.; Lan, H.; Lang, S.; Li, X.; Buljubasic, F.; Zimmermann, W.H.; Cyganek, L.; Utikal, J.; et al. Lipopolysaccharides induced inflammatory responses and electrophysiological dysfunctions in human-induced pluripotent stem cell derived cardiomyocytes. Sci. Rep. 2017, 7, 2935. [Google Scholar] [CrossRef] [PubMed]
- Zhao, J.; Bi, W.; Xiao, S.; Lan, X.; Cheng, X.; Zhang, J.; Lu, D.; Wei, W.; Wang, Y.; Li, H.; et al. Neuroinflammation induced by lipopolysaccharide causes cognitive impairment in mice. Sci. Rep. 2019, 9, 5790. [Google Scholar] [CrossRef]
- Fang, H.; Pengal, R.A.; Cao, X.; Ganesan, L.P.; Wewers, M.D.; Marsh, C.B.; Tridandapani, S. Lipopolysaccharide-induced macrophage inflammatory response is regulated by SHIP. J. Immunol. 2004, 173, 360–366. [Google Scholar] [CrossRef]
- Wolf, A.J.; Underhill, D.M. Peptidoglycan recognition by the innate immune system. Nat. Rev. Immunol. 2018, 18, 243–254. [Google Scholar] [CrossRef]
- Hoijer, M.A.; Melief, M.J.; Debets, R.; Hazenberg, M.P. Inflammatory properties of peptidoglycan are decreased after degradation by human N-acetylmuramyl-L-alanine amidase. Eur. Cytokine Netw. 1997, 8, 375–381. [Google Scholar]
- Laman, J.D.; ’t Hart, B.A.; Power, C.; Dziarski, R. Bacterial Peptidoglycan as a Driver of Chronic Brain Inflammation. Trends Mol. Med. 2020, 26, 670–682. [Google Scholar] [CrossRef]
- Whittle, E.; Leonard, M.O.; Harrison, R.; Gant, T.W.; Tonge, D.P. Multi-Method Characterization of the Human Circulating Microbiome. Front. Microbiol. 2018, 9, 3266. [Google Scholar] [CrossRef]
- Ricci, V.; Carcione, D.; Messina, S.; Colombo, G.I.; D’Alessandra, Y. Circulating 16S RNA in Biofluids: Extracellular Vesicles as Mirrors of Human Microbiome? Int. J. Mol. Sci. 2020, 21, 8959. [Google Scholar] [CrossRef]
- Chen, H.; Ma, Y.; Liu, Z.; Li, J.; Li, X.; Yang, F.; Qiu, M. Circulating microbiome DNA: An emerging paradigm for cancer liquid biopsy. Cancer Lett. 2021, 521, 82–87. [Google Scholar] [CrossRef]
- Arunachalam, P.S.; Wimmers, F.; Mok, C.K.P.; Perera, R.; Scott, M.; Hagan, T.; Sigal, N.; Feng, Y.; Bristow, L.; Tak-Yin Tsang, O.; et al. Systems biological assessment of immunity to mild versus severe COVID-19 infection in humans. Science 2020, 369, 1210–1220. [Google Scholar] [CrossRef]
- Wang, J.; Gu, X.; Yang, J.; Wei, Y.; Zhao, Y. Gut Microbiota Dysbiosis and Increased Plasma LPS and TMAO Levels in Patients With Preeclampsia. Front. Cell Infect. Microbiol. 2019, 9, 409. [Google Scholar] [CrossRef] [PubMed]
- Vojinovic, D.; Radjabzadeh, D.; Kurilshikov, A.; Amin, N.; Wijmenga, C.; Franke, L.; Ikram, M.A.; Uitterlinden, A.G.; Zhernakova, A.; Fu, J.; et al. Relationship between gut microbiota and circulating metabolites in population-based cohorts. Nat. Commun. 2019, 10, 5813. [Google Scholar] [CrossRef]
- Wilmanski, T.; Rappaport, N.; Earls, J.C.; Magis, A.T.; Manor, O.; Lovejoy, J.; Omenn, G.S.; Hood, L.; Gibbons, S.M.; Price, N.D. Blood metabolome predicts gut microbiome alpha-diversity in humans. Nat. Biotechnol. 2019, 37, 1217–1228. [Google Scholar] [CrossRef]
- Prasad, R.; Patton, M.J.; Floyd, J.L.; Vieira, C.P.; Fortmann, S.; DuPont, M.; Harbour, A.; Jeremy, C.S.; Wright, J.; Lamendella, R.; et al. Plasma microbiome in COVID-19 subjects: An indicator of gut barrier defects and dysbiosis. bioRxiv 2021. [Google Scholar] [CrossRef]
- Venzon, M.; Bernard, L.; Klein, J.; Axelrad, J.E.; Hussey, G.A.; Sullivan, A.P.; Casanovas-Massana, A.; Noval, M.G.; Valero-Jimenez, A.M.; Gago, J.; et al. Gut microbiome dysbiosis during COVID-19 is associated with increased risk for bacteremia and microbial translocation. bioRxiv 2021. [Google Scholar] [CrossRef]
- Wikoff, W.R.; Anfora, A.T.; Liu, J.; Schultz, P.G.; Lesley, S.A.; Peters, E.C.; Siuzdak, G. Metabolomics analysis reveals large effects of gut microflora on mammalian blood metabolites. Proc. Natl. Acad. Sci. USA 2009, 106, 3698–3703. [Google Scholar] [CrossRef] [PubMed]
- Sun, M.; Du, B.; Shi, Y.; Lu, Y.; Zhou, Y.; Liu, B. Combined Signature of the Fecal Microbiome and Plasma Metabolome in Patients with Ulcerative Colitis. Med. Sci. Monit. 2019, 25, 3303–3315. [Google Scholar] [CrossRef] [PubMed]
- Kurilshikov, A.; van den Munckhof, I.C.L.; Chen, L.; Bonder, M.J.; Schraa, K.; Rutten, J.H.W.; Riksen, N.P.; de Graaf, J.; Oosting, M.; Sanna, S.; et al. Gut Microbial Associations to Plasma Metabolites Linked to Cardiovascular Phenotypes and Risk. Circ. Res. 2019, 124, 1808–1820. [Google Scholar] [CrossRef]
- Chunxi, L.; Haiyue, L.; Yanxia, L.; Jianbing, P.; Jin, S. The Gut Microbiota and Respiratory Diseases: New Evidence. J. Immunol. Res. 2020, 2020, 2340670. [Google Scholar] [CrossRef] [PubMed]
- Biedermann, L.; Zeitz, J.; Mwinyi, J.; Sutter-Minder, E.; Rehman, A.; Ott, S.J.; Steurer-Stey, C.; Frei, A.; Frei, P.; Scharl, M.; et al. Smoking cessation induces profound changes in the composition of the intestinal microbiota in humans. PLoS ONE 2013, 8, e59260. [Google Scholar] [CrossRef]
- Singh, D.; Mathioudakis, A.G.; Higham, A. Chronic obstructive pulmonary disease and COVID-19: Interrelationships. Curr. Opin. Pulm. Med. 2022, 28, 76–83. [Google Scholar] [CrossRef]
- Gerayeli, F.V.; Milne, S.; Cheung, C.; Li, X.; Yang, C.W.T.; Tam, A.; Choi, L.H.; Bae, A.; Sin, D.D. COPD and the risk of poor outcomes in COVID-19: A systematic review and meta-analysis. eClinicalMedicine 2021, 33, 100789. [Google Scholar] [CrossRef] [PubMed]
- Amar, J.; Lange, C.; Payros, G.; Garret, C.; Chabo, C.; Lantieri, O.; Courtney, M.; Marre, M.; Charles, M.A.; Balkau, B.; et al. Blood microbiota dysbiosis is associated with the onset of cardiovascular events in a large general population: The D.E.S.I.R. study. PLoS ONE 2013, 8, e54461. [Google Scholar] [CrossRef]
- Lelouvier, B.; Servant, F.; Paisse, S.; Brunet, A.C.; Benyahya, S.; Serino, M.; Valle, C.; Ortiz, M.R.; Puig, J.; Courtney, M.; et al. Changes in blood microbiota profiles associated with liver fibrosis in obese patients: A pilot analysis. Hepatology 2016, 64, 2015–2027. [Google Scholar] [CrossRef]
- Paisse, S.; Valle, C.; Servant, F.; Courtney, M.; Burcelin, R.; Amar, J.; Lelouvier, B. Comprehensive description of blood microbiome from healthy donors assessed by 16S targeted metagenomic sequencing. Transfusion 2016, 56, 1138–1147. [Google Scholar] [CrossRef]
- Olde Loohuis, L.M.; Mangul, S.; Ori, A.P.S.; Jospin, G.; Koslicki, D.; Yang, H.T.; Wu, T.; Boks, M.P.; Lomen-Hoerth, C.; Wiedau-Pazos, M.; et al. Transcriptome analysis in whole blood reveals increased microbial diversity in schizophrenia. Transl. Psychiatry 2018, 8, 96. [Google Scholar] [CrossRef]
- Serena, G.; Davies, C.; Cetinbas, M.; Sadreyev, R.I.; Fasano, A. Analysis of blood and fecal microbiome profile in patients with celiac disease. Hum. Microbiome J. 2019, 11, 100049. [Google Scholar] [CrossRef]
- Buford, T.W.; Carter, C.S.; VanDerPol, W.J.; Chen, D.; Lefkowitz, E.J.; Eipers, P.; Morrow, C.D.; Bamman, M.M. Composition and richness of the serum microbiome differ by age and link to systemic inflammation. Geroscience 2018, 40, 257–268. [Google Scholar] [CrossRef]
- Khan, R.; Petersen, F.C.; Shekhar, S. Commensal Bacteria: An Emerging Player in Defense Against Respiratory Pathogens. Front. Immunol. 2019, 10, 1203. [Google Scholar] [CrossRef]
- Heeney, D.D.; Gareau, M.G.; Marco, M.L. Intestinal Lactobacillus in health and disease, a driver or just along for the ride? Curr. Opin. Biotechnol. 2018, 49, 140–147. [Google Scholar] [CrossRef]
- Laureys, D.; Cnockaert, M.; De Vuyst, L.; Vandamme, P. Bifidobacterium aquikefiri sp. nov., isolated from water kefir. Int. J. Syst. Evol. Microbiol. 2016, 66, 1281–1286. [Google Scholar] [CrossRef]
- Ventura, M.; Canchaya, C.; Tauch, A.; Chandra, G.; Fitzgerald, G.F.; Chater, K.F.; van Sinderen, D. Genomics of Actinobacteria: Tracing the evolutionary history of an ancient phylum. Microbiol. Mol. Biol. Rev. 2007, 71, 495–548. [Google Scholar] [CrossRef] [PubMed]
- Klijn, A.; Mercenier, A.; Arigoni, F. Lessons from the genomes of bifidobacteria. FEMS Microbiol. Rev. 2005, 29, 491–509. [Google Scholar] [CrossRef]
- Le Leu, R.K.; Hu, Y.; Brown, I.L.; Woodman, R.J.; Young, G.P. Synbiotic intervention of Bifidobacterium lactis and resistant starch protects against colorectal cancer development in rats. Carcinogenesis 2010, 31, 246–251. [Google Scholar] [CrossRef]
- Venturi, A.; Gionchetti, P.; Rizzello, F.; Johansson, R.; Zucconi, E.; Brigidi, P.; Matteuzzi, D.; Campieri, M. Impact on the composition of the faecal flora by a new probiotic preparation: Preliminary data on maintenance treatment of patients with ulcerative colitis. Aliment Pharmacol. Ther. 1999, 13, 1103–1108. [Google Scholar] [CrossRef]
- Duan, Y.; Prasad, R.; Feng, D.; Beli, E.; Li Calzi, S.; Longhini, A.L.F.; Lamendella, R.; Floyd, J.L.; Dupont, M.; Noothi, S.K.; et al. Bone Marrow-Derived Cells Restore Functional Integrity of the Gut Epithelial and Vascular Barriers in a Model of Diabetes and ACE2 Deficiency. Circ. Res. 2019, 125, 969–988. [Google Scholar] [CrossRef]
- Million, M.; Maraninchi, M.; Henry, M.; Armougom, F.; Richet, H.; Carrieri, P.; Valero, R.; Raccah, D.; Vialettes, B.; Raoult, D. Obesity-associated gut microbiota is enriched in Lactobacillus reuteri and depleted in Bifidobacterium animalis and Methanobrevibacter smithii. Int. J. Obes. (Lond.) 2012, 36, 817–825. [Google Scholar] [CrossRef] [PubMed]
- Singer, M.; Deutschman, C.S.; Seymour, C.W.; Shankar-Hari, M.; Annane, D.; Bauer, M.; Bellomo, R.; Bernard, G.R.; Chiche, J.D.; Coopersmith, C.M.; et al. The Third International Consensus Definitions for Sepsis and Septic Shock (Sepsis-3). JAMA 2016, 315, 801–810. [Google Scholar] [CrossRef]
- Alhazzani, W.; Moller, M.H.; Arabi, Y.M.; Loeb, M.; Gong, M.N.; Fan, E.; Oczkowski, S.; Levy, M.M.; Derde, L.; Dzierba, A.; et al. Surviving Sepsis Campaign: Guidelines on the management of critically ill adults with Coronavirus Disease 2019 (COVID-19). Intensive Care Med. 2020, 46, 854–887. [Google Scholar] [CrossRef] [PubMed]
- Rothschild, D.; Weissbrod, O.; Barkan, E.; Kurilshikov, A.; Korem, T.; Zeevi, D.; Costea, P.I.; Godneva, A.; Kalka, I.N.; Bar, N.; et al. Environment dominates over host genetics in shaping human gut microbiota. Nature 2018, 555, 210–215. [Google Scholar] [CrossRef] [PubMed]
- Zhang, H.; Sparks, J.B.; Karyala, S.V.; Settlage, R.; Luo, X.M. Host adaptive immunity alters gut microbiota. ISME J. 2015, 9, 770–781. [Google Scholar] [CrossRef] [PubMed]
- Hakansson, A.; Molin, G. Gut microbiota and inflammation. Nutrients 2011, 3, 637–682. [Google Scholar] [CrossRef] [PubMed]
- Willis, E. Nurses and independent fee-for-service practice: A critical view. Contemp. Nurse 1993, 2, 135–142. [Google Scholar] [CrossRef]
- Xu, W.; Luo, Z.; Alekseyenko, A.V.; Martin, L.; Wan, Z.; Ling, B.; Qin, Z.; Heath, S.L.; Maas, K.; Cong, X.; et al. Distinct systemic microbiome and microbial translocation are associated with plasma level of anti-CD4 autoantibody in HIV infection. Sci. Rep. 2018, 8, 12863. [Google Scholar] [CrossRef]
- Luo, Z.; Li, M.; Wu, Y.; Meng, Z.; Martin, L.; Zhang, L.; Ogunrinde, E.; Zhou, Z.; Qin, S.; Wan, Z.; et al. Systemic translocation of Staphylococcus drives autoantibody production in HIV disease. Microbiome 2019, 7, 25. [Google Scholar] [CrossRef]
- Dinh, D.M.; Volpe, G.E.; Duffalo, C.; Bhalchandra, S.; Tai, A.K.; Kane, A.V.; Wanke, C.A.; Ward, H.D. Intestinal microbiota, microbial translocation, and systemic inflammation in chronic HIV infection. J. Infect. Dis. 2015, 211, 19–27. [Google Scholar] [CrossRef]
- Villanueva-Millan, M.J.; Perez-Matute, P.; Recio-Fernandez, E.; Lezana Rosales, J.M.; Oteo, J.A. Differential effects of antiretrovirals on microbial translocation and gut microbiota composition of HIV-infected patients. J. Int. AIDS Soc. 2017, 20, 21526. [Google Scholar] [CrossRef]
- Dhar, D.; Mohanty, A. Gut microbiota and COVID-19-possible link and implications. Virus Res. 2020, 285, 198018. [Google Scholar] [CrossRef]
- Tuck, M.K.; Chan, D.W.; Chia, D.; Godwin, A.K.; Grizzle, W.E.; Krueger, K.E.; Rom, W.; Sanda, M.; Sorbara, L.; Stass, S.; et al. Standard operating procedures for serum and plasma collection: Early detection research network consensus statement standard operating procedure integration working group. J. Proteome Res. 2009, 8, 113–117. [Google Scholar] [CrossRef]
- Walters, W.; Hyde, E.R.; Berg-Lyons, D.; Ackermann, G.; Humphrey, G.; Parada, A.; Gilbert, J.A.; Jansson, J.K.; Caporaso, J.G.; Fuhrman, J.A.; et al. Improved Bacterial 16S rRNA Gene (V4 and V4-5) and Fungal Internal Transcribed Spacer Marker Gene Primers for Microbial Community Surveys. mSystems 2016, 1, e00009-15. [Google Scholar] [CrossRef]
- Bolyen, E.; Rideout, J.R.; Dillon, M.R.; Bokulich, N.A.; Abnet, C.C.; Al-Ghalith, G.A.; Alexander, H.; Alm, E.J.; Arumugam, M.; Asnicar, F.; et al. Reproducible, interactive, scalable and extensible microbiome data science using QIIME 2. Nat. Biotechnol. 2019, 37, 852–857. [Google Scholar] [CrossRef] [PubMed]
- Rognes, T.; Flouri, T.; Nichols, B.; Quince, C.; Mahe, F. VSEARCH: A versatile open source tool for metagenomics. PeerJ 2016, 4, e2584. [Google Scholar] [CrossRef]
- Callahan, B.J.; McMurdie, P.J.; Rosen, M.J.; Han, A.W.; Johnson, A.J.; Holmes, S.P. DADA2: High-resolution sample inference from Illumina amplicon data. Nat. Methods 2016, 13, 581–583. [Google Scholar] [CrossRef]
- Faith, D.P.; Baker, A.M. Phylogenetic diversity (PD) and biodiversity conservation: Some bioinformatics challenges. Evol. Bioinform. Online 2007, 2, 121–128. [Google Scholar] [CrossRef]
- DeSantis, T.Z.; Hugenholtz, P.; Larsen, N.; Rojas, M.; Brodie, E.L.; Keller, K.; Huber, T.; Dalevi, D.; Hu, P.; Andersen, G.L. Greengenes, a chimera-checked 16S rRNA gene database and workbench compatible with ARB. Appl. Environ. Microbiol. 2006, 72, 5069–5072. [Google Scholar] [CrossRef]
- Pielou, E.C. The measurement of diversity in different types of biological collections. J. Theor. Biol. 1966, 13, 131–144. [Google Scholar] [CrossRef]
- Shannon, C.E.; Weaver, W. A Mathematical Theory of Communication. Bell Syst. Tech. J. 1948, 27, 379–423. [Google Scholar] [CrossRef]
- Paulson, J.N.; Stine, O.C.; Bravo, H.C.; Pop, M. Differential abundance analysis for microbial marker-gene surveys. Nat. Methods 2013, 10, 1200–1202. [Google Scholar] [CrossRef]
- Lozupone, C.A.; Hamady, M.; Kelley, S.T.; Knight, R. Quantitative and qualitative beta diversity measures lead to different insights into factors that structure microbial communities. Appl. Environ. Microbiol. 2007, 73, 1576–1585. [Google Scholar] [CrossRef]


| Patient Characteristics | N 1 | Severity on Admission | p-Value 2 | ||
|---|---|---|---|---|---|
| (qSOFA 0) Mild (N = 89) | (qSOFA 1–2) Moderate (N = 47) | (qSOFA 3) Severe (N = 10) | |||
| Sex, n (%) | 146 | <0.001 | |||
| Female | 60 (67) | 14 (30) | 5 (50) | ||
| Male | 29 (33) | 33 (70) | 5 (50) | ||
| Age Range (Years), n (%) | 144 | 0.65 | |||
| <50 | 16 (18) | 10 (22) | 3 (30) | ||
| >75 | 6 (6.8) | 5 (11) | 1 (10) | ||
| 50–75 | 66 (75) | 31 (67) | 6 (60) | ||
| Unknown | 1 | 1 | 0 | ||
| Diabetic Comorbidity, n (%) | 114 | 0.36 | |||
| Diabetes History | 30 (40) | 18 (55) | 3 (50) | ||
| No Diabetes History | 45 (60) | 15 (45) | 3 (50) | ||
| Unknown | 14 | 14 | 4 | ||
| Cardiac Comorbidity, n (%) | 114 | 0.012 | |||
| Heart Failure or MI History | 10 (13) | 11 (33) | 3 (50) | ||
| No Cardiac History | 65 (87) | 22 (67) | 3 (50) | ||
| Unknown | 14 | 14 | 4 | ||
| Pulmonary Comorbidity, n (%) | 114 | 0.25 | |||
| COPD History | 23 (31) | 12 (36) | 0 (0) | ||
| No COPD History | 52 (69) | 21 (64) | 6 (100) | ||
| Unknown | 14 | 14 | 4 | ||
| Oncologic Comorbidity, n (%) | 114 | 0.83 | |||
| Cancer or Metastatic Tumor History | 13 (17) | 6 (18) | 0 (0) | ||
| No Oncologic History | 62 (83) | 27 (82) | 6 (100) | ||
| Unknown | 14 | 14 | 4 | ||
| Outcomes | |||||
| Hospitilization (days), n (%) | 145 | 0.022 | |||
| <15 | 81 (92) | 40 (85) | 7 (70) | ||
| >30 | 5 (5.7) | 2 (4.3) | 0 (0) | ||
| 16–30 | 2 (2.3) | 5 (11) | 3 (30) | ||
| Unknown | 1 | 0 | 0 | ||
| In-Hospital Mortality, n (%) | 146 | <0.001 | |||
| Deceased In-Hospital | 1 (1.1) | 4 (8.5) | 6 (60) | ||
| Discharged | 88 (99) | 43 (91) | 4 (40) | ||
| ICU Admission (anytime), n (%) | 146 | <0.001 | |||
| ICU Admission | 2 (2.2) | 12 (26) | 9 (90) | ||
| No ICU Admission | 87 (98) | 35 (74) | 1 (10) | ||
| Vasopressor Therapy, n (%) | 146 | <0.001 | |||
| Required Vasopressor | 3 (3.4) | 6 (13) | 9 (90) | ||
| No Vasopressor | 86 (97) | 41 (87) | 1 (10) | ||
| Invasive Mechanical Veniltaion, n (%) | 146 | <0.001 | |||
| Required Ventilation | 3 (3.4) | 5 (11) | 9 (90) | ||
| No Ventilation | 86 (97) | 42 (89) | 1 (10) | ||
| Continuous Renal Replacement Therapy, n (%) | 146 | <0.001 | |||
| Required CRRT | 0 (0) | 2 (4.3) | 4 (40) | ||
| No CRRT COVID-19+ Evidence | 89 (100) | 45 (96) | 6 (60) | ||
| COVID-19 Billing Code Evidence, n (%) | 146 | <0.001 | |||
| COVID19+ Billing Code During Encounter | 58 (65) | 47 (100) | 10 (100) | ||
| No Billing Code | 31 (35) | 0 (0) | 0 (0) | ||
| COVID-19 Laboratory Test Evidence, n (%) | 146 | <0.001 | |||
| COVID19+ Test During Encounter | 18 (20) | 47 (100) | 10 (100) | ||
| No Test | 71 (80) | 0 (0) | 0 (0) | ||
| Laboratory Value 1 | N 2 | Severity on Admission | p-Value 3 | q-Value 4 | ||
|---|---|---|---|---|---|---|
| (qSOFA 0) Mild (N = 59) | (qSOFA 1–2) Moderate (N = 4) | (qSOFA 3) Severe (N = 10) | ||||
| Ferritin (ng/L) | 65 | 326 (196–1184) | 478 (188–1065) | 382 (305–1665) | 0.83 | >0.99 |
| C-reactive Protein (mg/L) | 100 | 26 (7–84) | 90 (45–131) | 136 (43–172) | <0.001 | <0.001 |
| Hemoglobin (g/dL) | 116 | 13.40 (11.85–14.55) | 12.35 (11.15–13.83) | 10.05 (9.03–11.86) | 0.006 | 0.059 |
| Glucose (mg/dL) | 116 | 114 (100–142) | 122 (110–154) | 150 (128–189) | 0.040 | 0.40 |
| D-Dimer (mg/L FEU) | 96 | 287 (218–551) | 451 (300–1324) | 556 (435–920) | 0.008 | 0.076 |
| Procalcitonin (ng/mL) | 65 | 0.07 (0.05–0.09) | 0.12 (0.07–0.47) | 0.77 (0.12–3.00) | 0.004 | 0.035 |
| Hs Troponin-I (ng/L) | 60 | 8 (5–13) | 10 (5–31) | 20 (8–33) | 0.32 | >0.99 |
| BNP (pg/mL) | 39 | 103 (68–137) | 76 (25–120) | 90 (66–180) | 0.36 | >0.99 |
| Laboratory Value 1 | N 2 | Severity on Admission | p-Value 3 | q-Value 4 | ||
|---|---|---|---|---|---|---|
| (qSOFA 0) Mild (N = 58) | (qSOFA 1–2) Moderate (N = 50) | (qSOFA 3) Severe (N = 12) | ||||
| Red Blood Cell Count (×103/uL) | 120 | 4.56 (4.12–4.87) | 4.63 (4.31–5.06) | 4.52 (4.08–4.77) | 0.45 | >0.99 |
| Platelet Count (×103/uL) | 120 | 212 (170–260) | 225 (160–282) | 228 (161–281) | >0.99 | >0.99 |
| White Blood Cell Count (×103/uL) | 120 | 5.7 (4.0–8.2) | 8.4 (6.2–11.2) | 9.8 (5.7–12.7) | <0.001 | 0.004 |
| Lymphocytes (relative; %) | 117 | 21 (11–37) | 12 (8–20) | 10 (7–21) | 0.003 | 0.028 |
| Neutrophils (relative; %) | 117 | 68 (52–79) | 76 (68–86) | 78 (72–88) | 0.005 | 0.041 |
| Monocytes (relative; %) | 117 | 8.0 (6.0–10.0) | 8.0 (5.2–11.8) | 6.0 (5.0–8.8) | 0.22 | >0.99 |
| Basophils (relative; %) | 116 | 1.00 (0.00–1.00) | 0.00 (0.00–1.00) | 0.00 (0.00–0.75) | 0.046 | 0.36 |
| Eosinophils (relative; %) | 84 | 1.00 (0.00–2.75) | 0.00 (0.00–1.25) | 1.00 (0.00–2.00) | 0.073 | 0.59 |
| Patient’s Charactersitics | Severity on Admission | |
|---|---|---|
| Mild | Moderate | |
| Total number, n = 15 (%) | 5 (33.3%) | 10 (66.6%) |
| Sex, n (%) | ||
| Male | 4 (40%) | 6 (60%) |
| Female | 1 (20%) | 4 (80%) |
| Age Range (Years), n (%) | ||
| <30 | 0 | 0 |
| 30–50 | 2 (40%) | 2 (20%) |
| >50 | 3 (60%) | 8 (80%) |
| Diabetes, n (%) | 3 (60%) | 2 (20%) |
| Thrombosis, n (%) | 1 (20%) | 7 (70%) |
| Hospitalization, n (%) | ||
| <15 | 3 (60%) | 4 (40%) |
| 16–30 | 1 (20%) | 5 (50%) |
| >30 | 1 (20%) | 1 (10%) |
| Mortality, n (%) | 0 | 5 (50%) |
| Diabetic patients with COVID-19, n (%) | 0 | 0 |
| Thrombosis in COVID-19 patients, n (%) | 0 | 5 (50%) |
| Cytokine/Chemokine | Mean ± SD (pg/mL) | 95% CI (pg/mL) | p-Value | ||
|---|---|---|---|---|---|
| Healthy | COVID-19 | Healthy | COVID-19 | ||
| Pro-inflammatory | |||||
| IL-1β | 1.46 ± 0.61 | 0.96 ± 0.57 | (1.16, 1.77) | (0.71, 1.21) | 0.0106 * |
| IL-2 | 3.21 ± 1.26 | 2.75 ± 1.34 | (2.58, 3.84) | (2.16, 3.35) | 0.279 |
| IL-6 | 1.55 ± 1.22 | 5.09 ± 6.54 | (0.94, 2.16) | (2.26, 7.92) | 0.0294 * |
| IL-8 | 2.21 ± 1.55 | 4.70 ± 2.84 | (1.44, 2.98) | (3.47, 5.93) | 0.0019 ** |
| IL-12p70 | 2.91 ± 0.75 | 3.78 ± 5.89 | (2.54, 3.29) | (1.29, 6.27) | 0.54 |
| IL-17 | 1.01 ± 0.31 | 1.02 ± 0.32 | (0.85, 1.17) | (0.87, 1.16) | 0.947 |
| GM-CSF | 2.33 ± 0.26 | 2.58 ± 1.10 | (2.20, 2.47) | (2.11, 3.06) | 0.349 |
| IFN-γ | 3.05 ± 0.97 | 4.39 ± 1.96 | (2.49, 3.61) | (3.44, 5.34) | 0.0261 * |
| TNF-α | 9.12 ± 1.91 | 14.97 ± 8.26 | (8.17, 10.07) | (11.39, 18.54) | 0.00556 ** |
| MCP-1 (CCL2) | 95.64 ± 55 | 274.60 ± 147.2 | (68.29, 123) | (212.5, 336.8) | <0.0001 **** |
| MIP-1α (CCL3) | 2.60 ± 1.03 | 3.79 ± 2.02 | (2.077 3.14) | (2.89, 4.69) | 0.0341 * |
| MIP-1β (CCL4) | 13.02 ± 8.09 | 19.20 ± 10.80 | (8.99, 17.04) | (14.64, 23.76) | 0.0486 * |
| Anti-inflammatory | |||||
| IL-4 | 0.77 ± 0.17 | 0.81 ± 0.48 | (0.67, 0.86) | (0.59, 1.032) | 0.749 |
| IL-5 | 0.67 ± 0.33 | 0.49 ± 0.20 | (0.51, 0.84) | (0.40, 0.58) | 0.0412 * |
| IL-9 | 5.04 ± 1.65 | 4.27 ± 2.14 | (4.22, 5.86) | (3.34, 5.20) | 0.215 |
| IL-10 | 8.14 ± 3.16 | 11.36 ± 5.59 | (6.56, 9.71) | (8.87, 13.84) | 0.0365 * |
| IL-13 | 20.11 ± 20.52 | 22.62 ± 20.12 | (−1.42, 41.65) | (−2.35, 47.60) | 0.843 |
Publisher’s Note: MDPI stays neutral with regard to jurisdictional claims in published maps and institutional affiliations. |
© 2022 by the authors. Licensee MDPI, Basel, Switzerland. This article is an open access article distributed under the terms and conditions of the Creative Commons Attribution (CC BY) license (https://creativecommons.org/licenses/by/4.0/).
Share and Cite
Prasad, R.; Patton, M.J.; Floyd, J.L.; Fortmann, S.; DuPont, M.; Harbour, A.; Wright, J.; Lamendella, R.; Stevens, B.R.; Oudit, G.Y.; et al. Plasma Microbiome in COVID-19 Subjects: An Indicator of Gut Barrier Defects and Dysbiosis. Int. J. Mol. Sci. 2022, 23, 9141. https://doi.org/10.3390/ijms23169141
Prasad R, Patton MJ, Floyd JL, Fortmann S, DuPont M, Harbour A, Wright J, Lamendella R, Stevens BR, Oudit GY, et al. Plasma Microbiome in COVID-19 Subjects: An Indicator of Gut Barrier Defects and Dysbiosis. International Journal of Molecular Sciences. 2022; 23(16):9141. https://doi.org/10.3390/ijms23169141
Chicago/Turabian StylePrasad, Ram, Michael John Patton, Jason Levi. Floyd, Seth Fortmann, Mariana DuPont, Angela Harbour, Justin Wright, Regina Lamendella, Bruce R. Stevens, Gavin Y. Oudit, and et al. 2022. "Plasma Microbiome in COVID-19 Subjects: An Indicator of Gut Barrier Defects and Dysbiosis" International Journal of Molecular Sciences 23, no. 16: 9141. https://doi.org/10.3390/ijms23169141
APA StylePrasad, R., Patton, M. J., Floyd, J. L., Fortmann, S., DuPont, M., Harbour, A., Wright, J., Lamendella, R., Stevens, B. R., Oudit, G. Y., & Grant, M. B. (2022). Plasma Microbiome in COVID-19 Subjects: An Indicator of Gut Barrier Defects and Dysbiosis. International Journal of Molecular Sciences, 23(16), 9141. https://doi.org/10.3390/ijms23169141