Article

Aberrant Retinal Pigment Epithelial Cells Derived from Induced Pluripotent Stem Cells of a Retinitis Pigmentosa Patient with the PRPF6 Mutation

1
Aier School of Ophthalmology, Central South University, Changsha 410015, China
2
Aier Eye Institute, Changsha 410015, China
3
Institute for Tissue Engineering and Regenerative Medicine, The Chinese University of Hong Kong, Hong Kong 999077, China
4
School of Biomedical Sciences, Faculty of Medicine, The Chinese University of Hong Kong, Hong Kong 999077, China
5
Key Laboratory for Regenerative Medicine, Ministry of Education, Jinan University, Guangzhou 510632, China
*
Authors to whom correspondence should be addressed.
Int. J. Mol. Sci. 2022, 23(16), 9049; https://doi.org/10.3390/ijms23169049
Submission received: 27 July 2022 / Revised: 8 August 2022 / Accepted: 11 August 2022 / Published: 12 August 2022
(This article belongs to the Special Issue Retinal Degenerative Diseases)

Abstract

:
Pre-mRNA processing factors (PRPFs) are vital components of the spliceosome and are involved in the physiological process necessary for pre-mRNA splicing to mature mRNA. As an important member, PRPF6 mutation resulting in autosomal dominant retinitis pigmentosa (adRP) is not common. Recently, we reported the establishment of an induced pluripotent stem cells (iPSCs; CSUASOi004-A) model by reprogramming the peripheral blood mononuclear cells of a PRPF6-related adRP patient, which could recapitulate a consistent disease-specific genotype. In this study, a disease model of retinal pigment epithelial (RPE) cells was generated from the iPSCs of this patient to further investigate the underlying molecular and pathological mechanisms. The results showed the irregular morphology, disorganized apical microvilli and reduced expressions of RPE-specific genes in the patient’s iPSC-derived RPE cells. In addition, RPE cells carrying the PRPF6 mutation displayed a decrease in the phagocytosis of fluorescein isothiocyanate-labeled photoreceptor outer segments and exhibited impaired cell polarity and barrier function. This study will benefit the understanding of PRPF6-related RPE cells and future cell therapy.

1. Introduction

Retinitis pigmentosa (RP) is one of the most common inherited retinal diseases characterized by progressive degeneration of retinal pigment epithelial (RPE) cells and photoreceptors [1]. The disease initially manifests as nyctalopia, followed by a gradual decrease in vision, visual field contraction and eventually blindness. The prevalence of RP is approximately one in 4000, affecting about 1.5 million individuals worldwide [2,3]. To date, mutations in more than 84 genes and loci have been identified, and 23 of them cause autosomal dominant RP (adRP; RetNet: sph.uth.edu/retnet, last accessed 9 June 2022). The effective treatment of RP remains a major challenge in medicine, as gene therapy for RP is limited by the high genetic heterogeneity of the disease, emphasizing the importance of studying the molecular mechanisms that are independent of mutated genes [4].
The spliceosome is an RNA and protein complex involved in the generation of mature mRNA transcripts carrying the coding protein sequence by removing non-coding introns and joining exons from pre-mRNA [5]. The spliceosome mainly consists of five small nuclear ribonucleoprotein particles (snRNPs), namely U1, U2, U4, U5 and U6. The U1 and U2 snRNPs recognize the 5′-splice site and branch site of targeted introns, respectively. The U4, U5 and U6 snRNPs are recruited to form a tri-snRNP complex [6]. Subsequently, the U1 and U4 snRNPs are released from the pre-catalytic spliceosome, and the catalytic complex is generated and activated to complete the two steps of the pre-mRNA splicing process [7]. Pre-mRNA processing factors (PRPFs) are essential for the U4/U6/U5 tri-snRNP complex, playing a critical role in the splicing process. Mutations in PRPF genes linked to adRP have been identified, including PRPF3, PRPF4, PRPF6, PRPF8, PRPF31, SNRNP200 and RP9 [8].
PRPF6, an important member of the PRPF family, is located on chromosome 20q13.33. More and more studies have confirmed that the PRPF6 protein not only acts as the bridge between U5 snRNP and U4/U6 snRNPs, but also promotes the formation of tri-snRNP [9,10,11]. PRPF6 mutation can lead to adRP, while its overexpression is a common oncogenic driver of proliferation in some malignant tumors [12,13,14]. However, there is very limited published research on the pathogenesis of adRP patients with PRPF6 mutation due to its low incidence [15]. With the advancement of molecular diagnosis, two novel missense variants, c.514C > T (p.Arg172Trp) and c.551A > G (p.Asp184Gly), were discovered in a cohort of Chinese patients with RP [16]. Still, only one variant reported in 2011, c.2185C > T (p.Arg729Trp), has been further studied [9,11,17]. Another recent manuscript showed that the expression of the mutated form of PRPF6, c.67C > T (p.Arg23Trp), caused mis-splicing in periventricular heterotopia disease [18]. For adRP patients with PRPF6 mutation, it remains unclear whether some unique pathological features may predispose them to accelerated disease progression.
RPE is composed of a monolayer of polarized epithelial cells, anatomically located between the neural retina and the choroid. The RPE collaborates with the choriocapillaris and Bruch’s membrane to form the outer blood–retinal barrier, which is essential in maintaining the stability of the subretinal environment [19]. There is a rich extracellular matrix (ECM) between them. RPE cells are also responsible for the daily phagocytosis of shed outer segment membrane discs, nutrients and ions’ transepithelial transport, directional secretion of growth factors and visual cycle [20,21]. Retina degeneration is known to be a significant feature of RP, but its effect on the biological function of RPE needs to be further investigated. Induced pluripotent stem cells (iPSCs) are similar to human embryonic stem cells in their self-renewal, reproduction and differentiation potential, which can be used in disease modeling, regenerative medicine and gene therapy [22]. RPE cells can be effectively produced from iPSCs based on established protocols [23,24,25]. Regent et al. [26] developed an automated system that obtained a pure population of RPE cells without the 3-dimensional culture and manual dissection of pigmented foci during the differentiation process.
A usable disease model of adRP associated with PRPF6 mutation plays an important role in pathogenesis research. However, such a model has not been established so far [27]. In this study, we produced a human in vitro disease model of RPE cells derived from the iPSCs of a patient carrying a pathogenic mutation in PRPF6 (c.G2699A:p.Arg900His) (CSUASOi004-A) [28]. Then, the patient iPSC-derived RPE cells were compared with those derived from age- and sex-matched normal iPSCs. Cellular, molecular and transcriptome analyses were performed, demonstrating aberrant developmental features of the PRPF6-related RPE cells.

2. Results

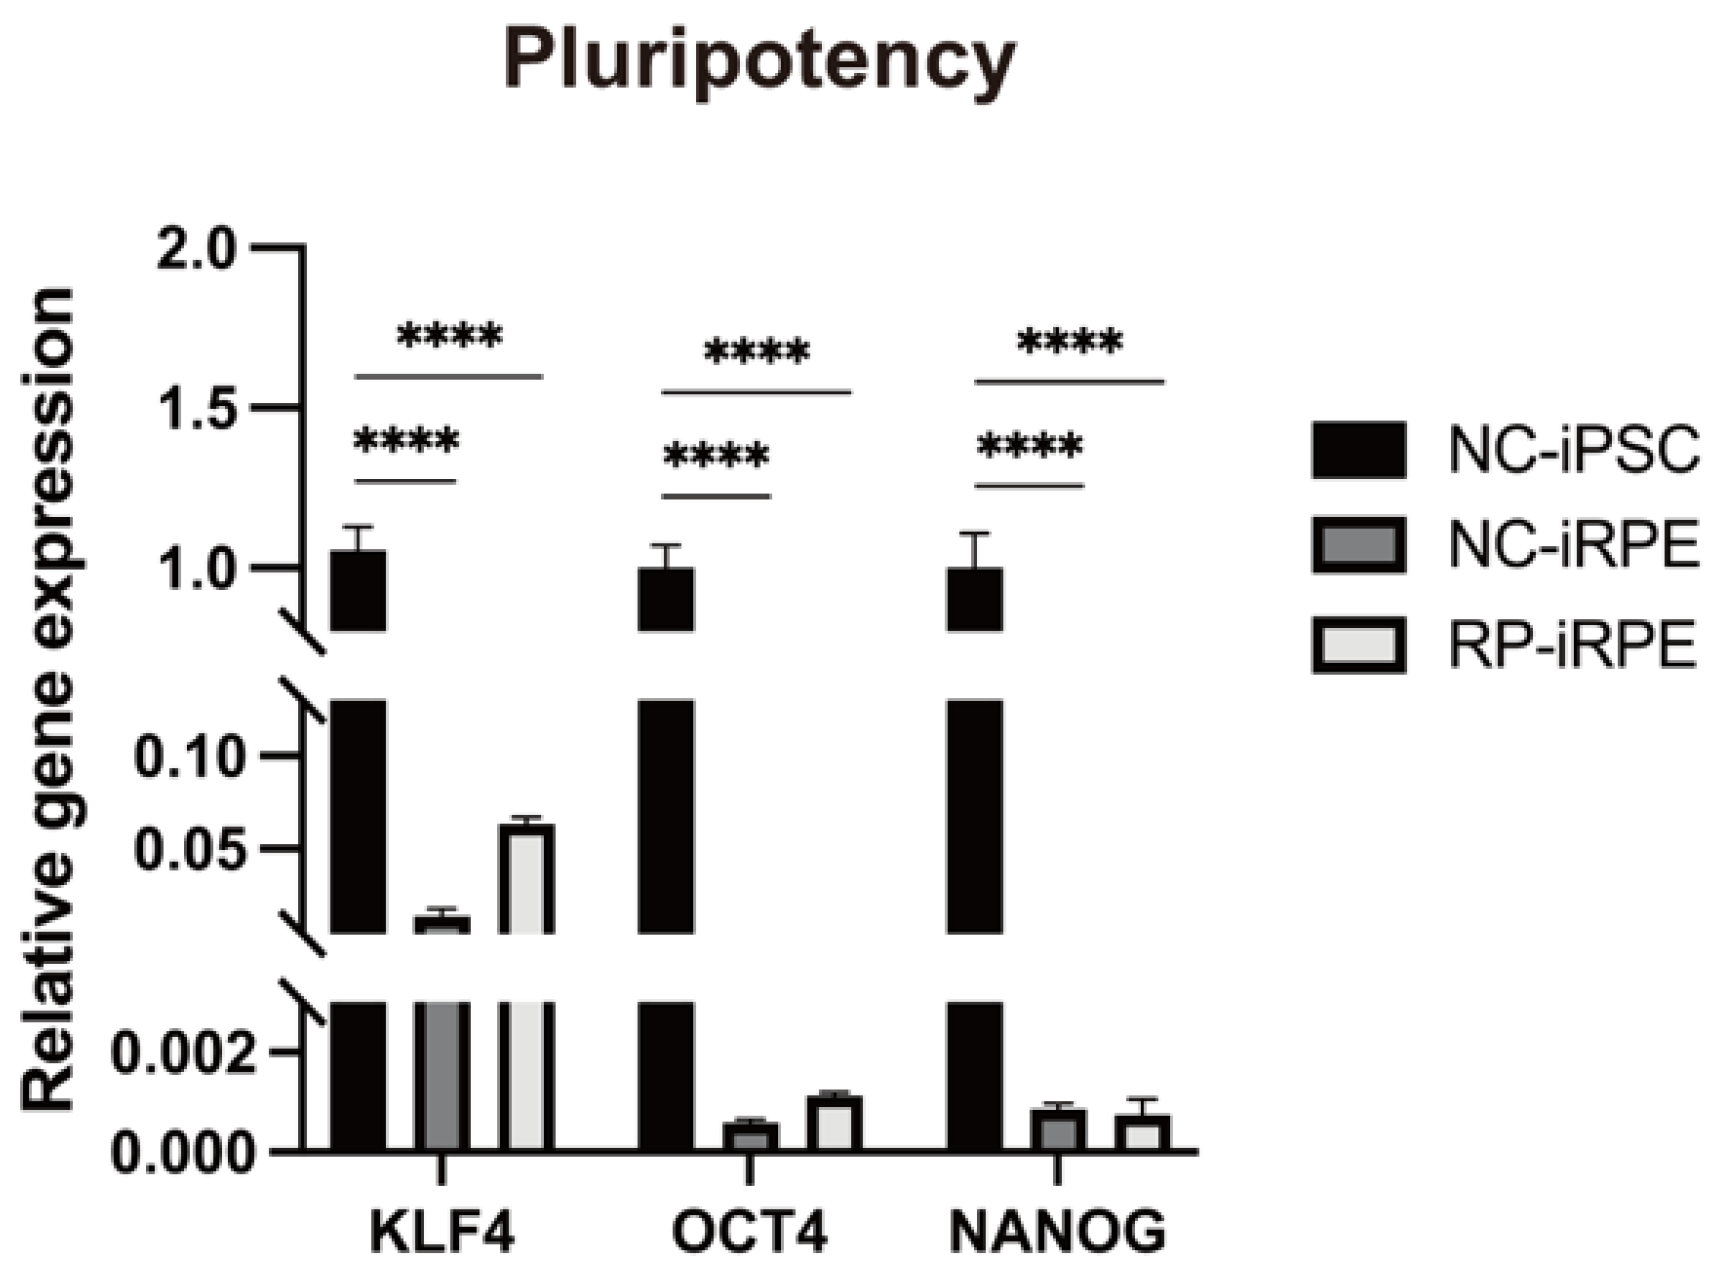
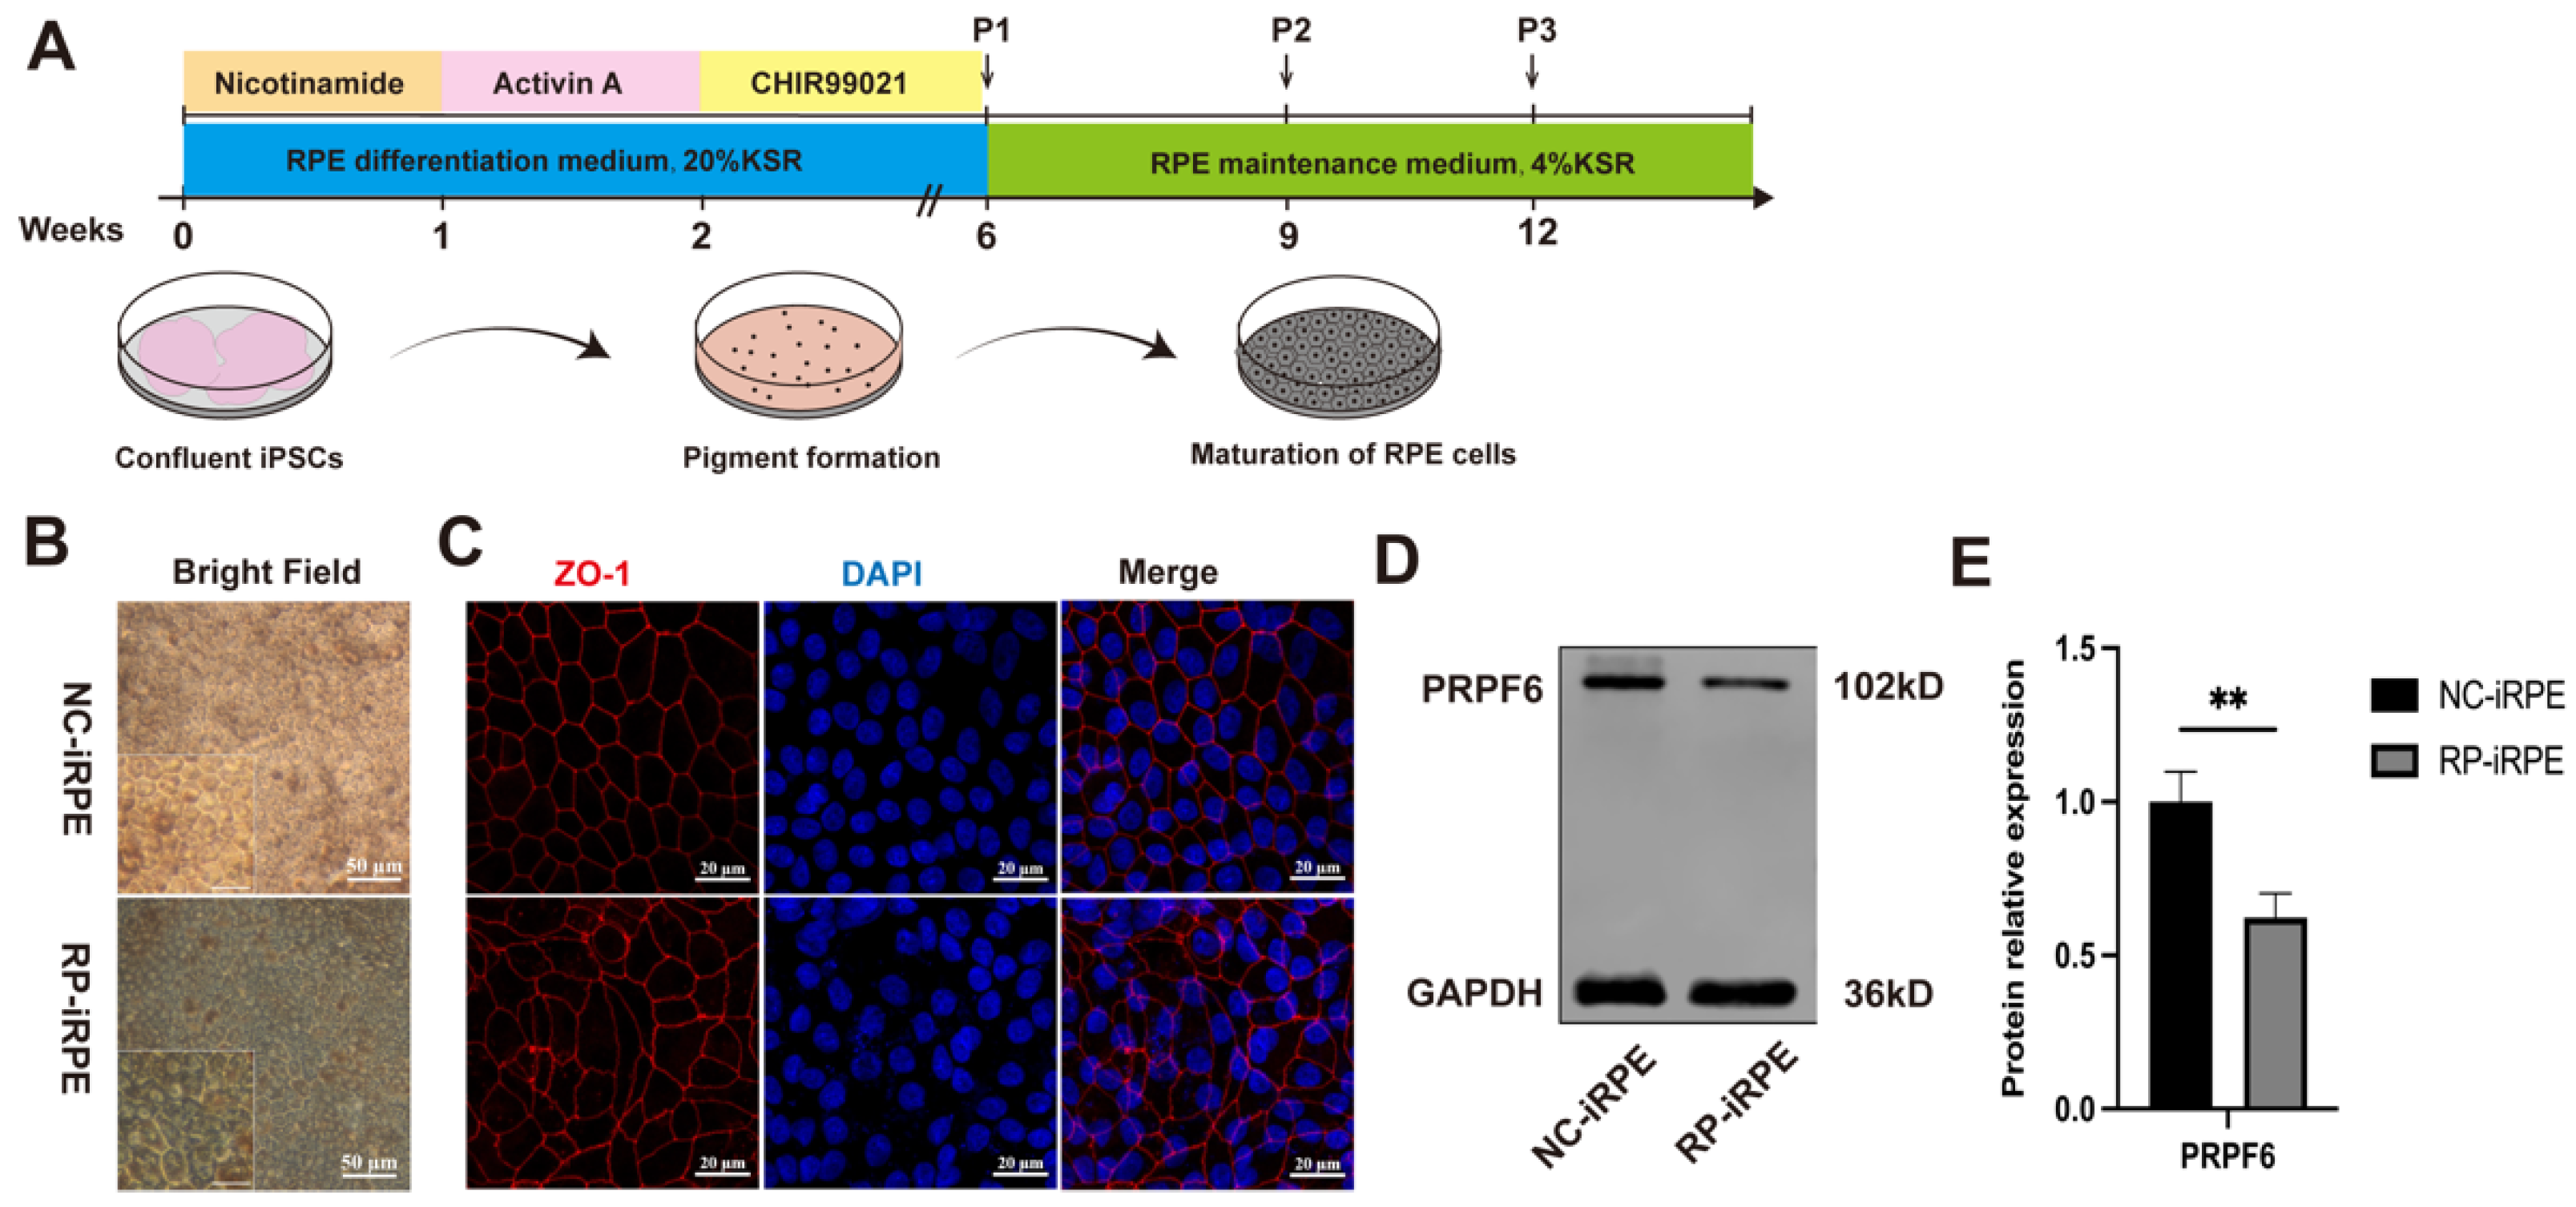
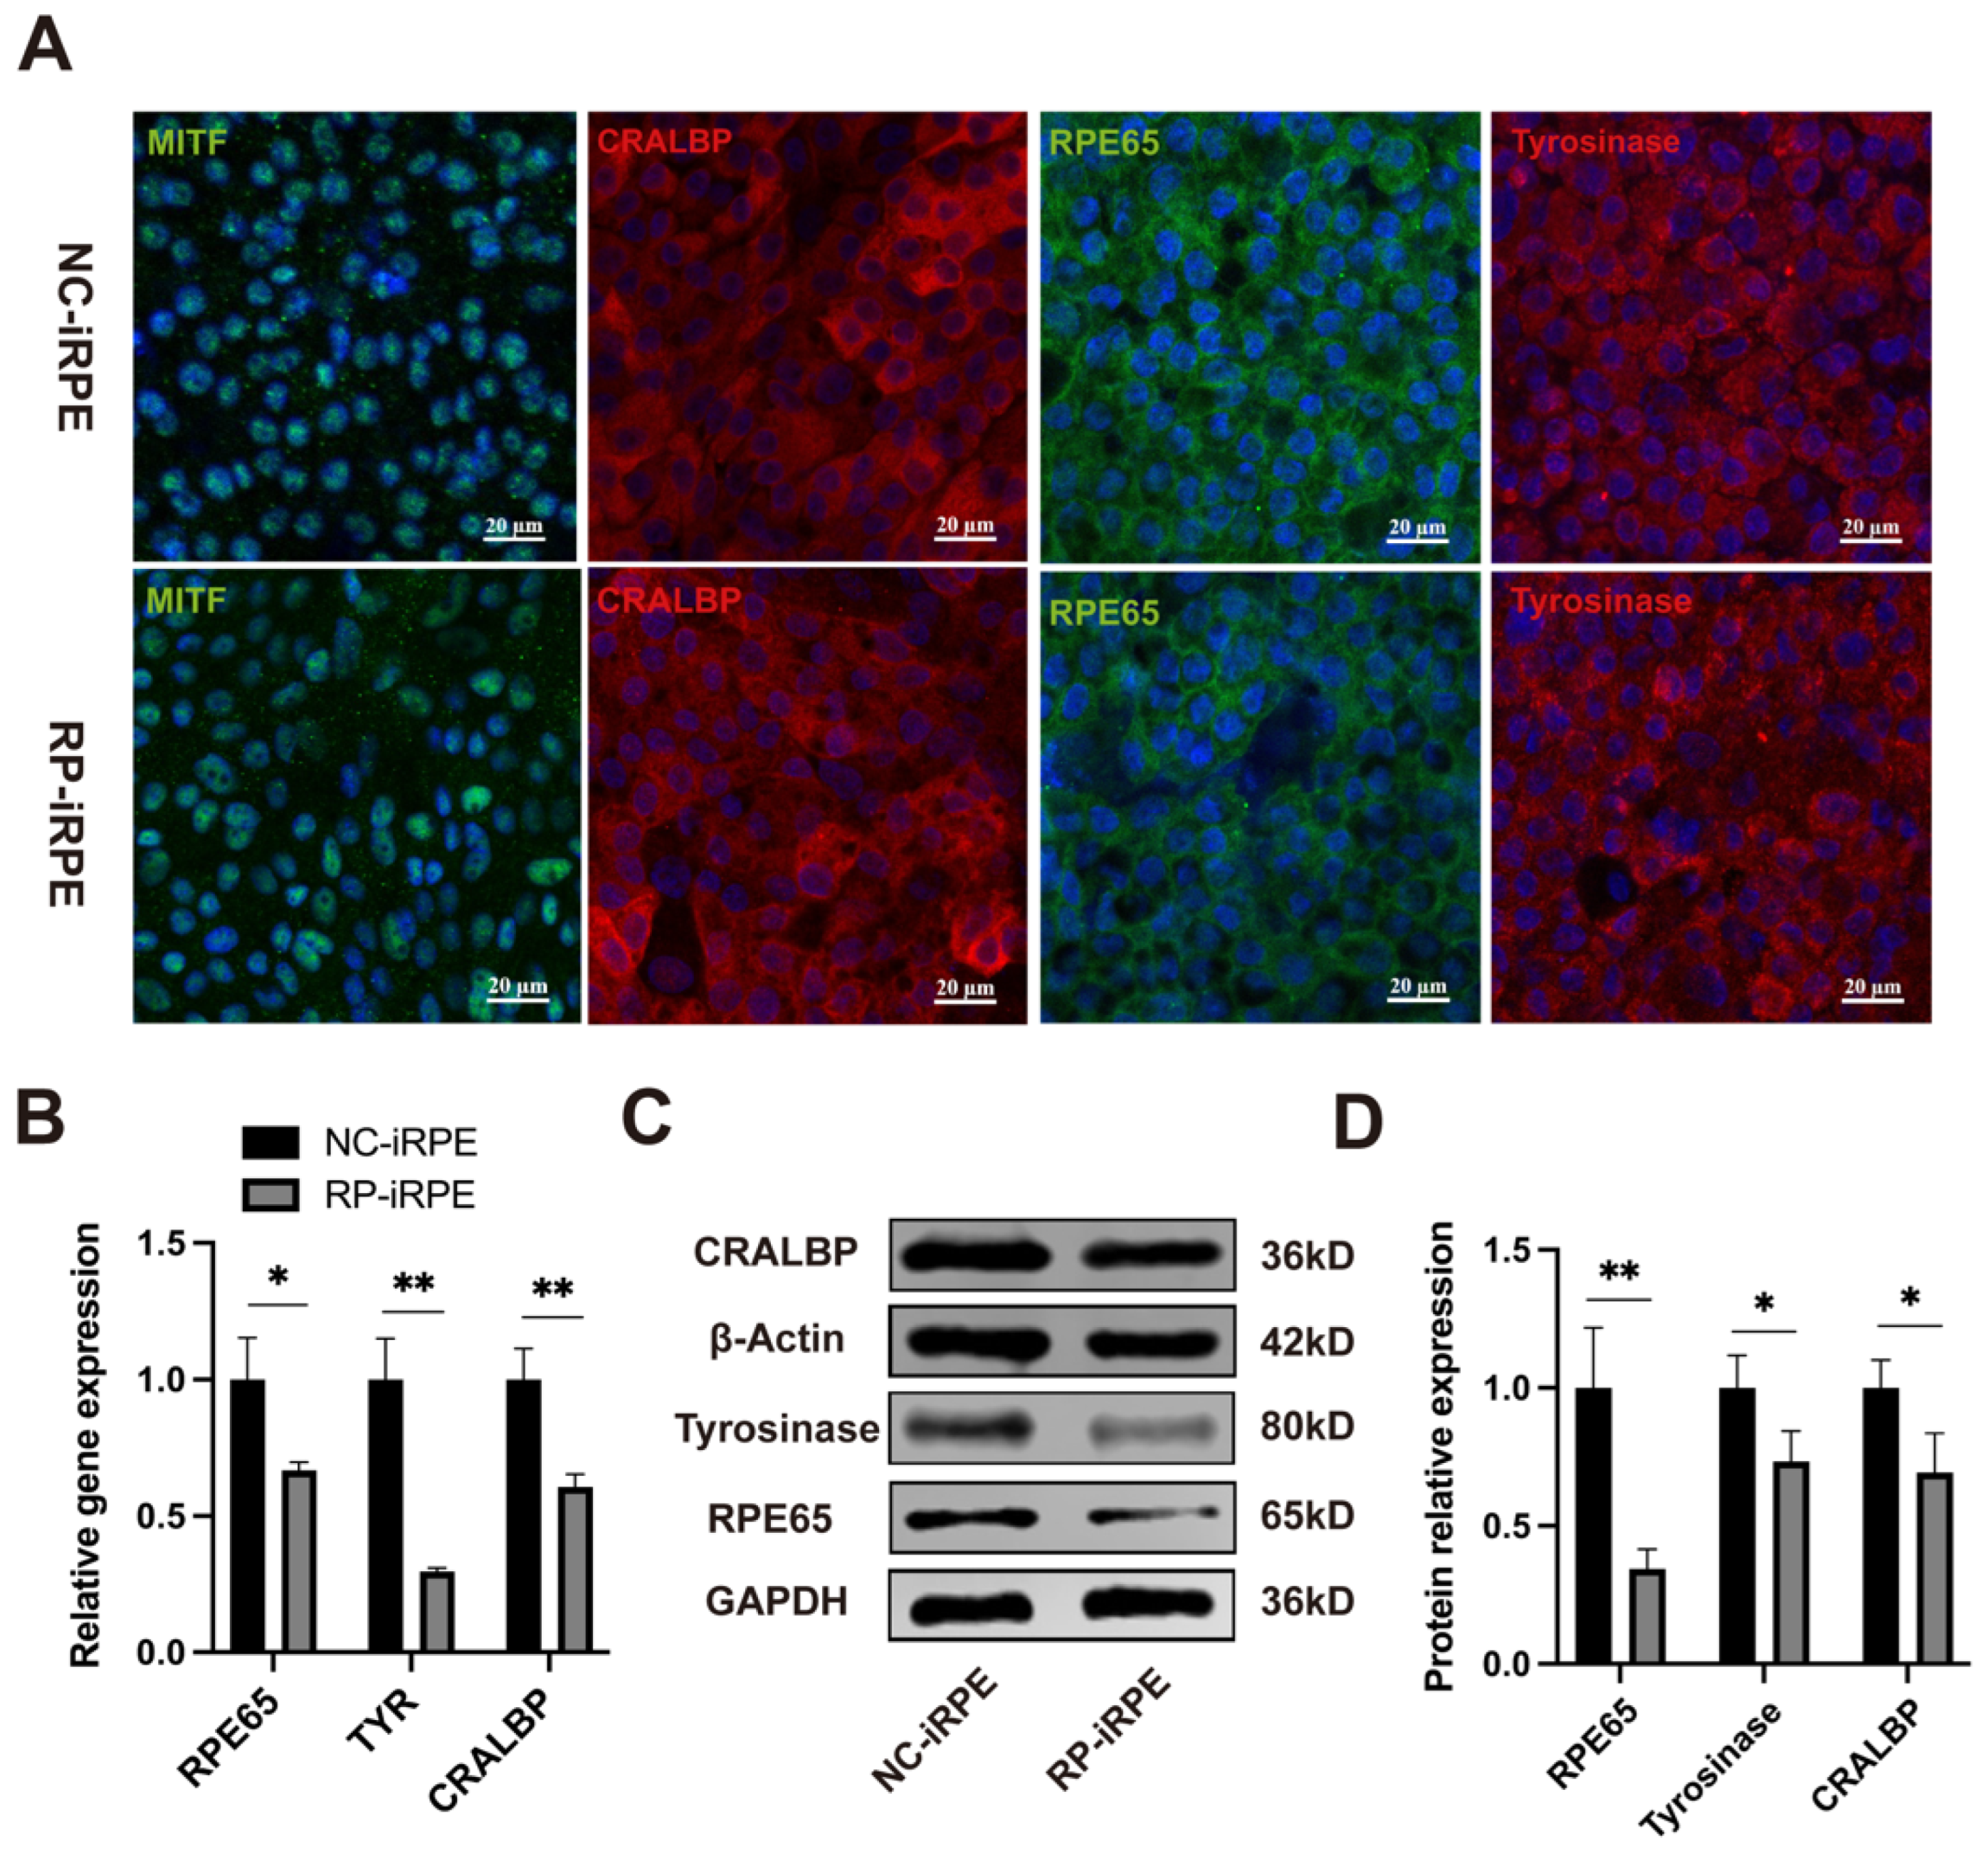
2.1. Generation and Characterization of NC-iRPE and RP-iRPE

The proband was a 15-year-old girl who has had nyctalopia, low vision acuity and a clinical diagnosis of RP since she was a child. The fundus photographs of both eyes showed attenuated retinal arteries and extensive bone spicule pigment of the peripheral retina (Appendix A, Figure A1).
The normal and patient iPSC cell lines in this study were induced into RPE (NC-iRPE; RP-iRPE) cells according to the protocol previously established by Regent et al. [26] (Figure 1A). The morphological observation of RPE cells was determined by brightfield microscopy and immunofluorescence staining in the culture of approximately 2 weeks. Mature RPE cells derived from both iPSC cell lines displayed a classic cobblestone-like appearance, with pigmented and polygonal morphology (Figure 1B). Immunofluorescence staining of the tight junction marker ZO-1 revealed the hexagonal structure of NC-iRPE cells, while irregular, abnormal morphology was observed in RP-iRPE cells (Figure 1C). Western blotting was performed to analyze the protein expression level, showing reduced PRPF6 expression in the RP-iRPE group (Figure 1D,E).
The prerequisite for human iPSC differentiation is that the self-renewal mechanism can be switched off under the action of signaling molecules [29]. Quantitative real-time polymerase chain reaction (PCR) analysis revealed a significant decrease in the expression of pluripotency genes KLF4, NANOG and OCT4 in mature RPE cells (Appendix A, Figure A2). Furthermore, immunofluorescence staining results showed that RPE-specific markers were expressed in both groups, including CRALBP and RPE65 as visual cycle markers, pigment synthesis marker tyrosinase and transcription factor marker MITF (Figure 2A). The mRNA expression levels of the RPE genes, RPE65, TYR and CRALBP, were lower in the RP-iRPE group than in the NC-iRPE group (Figure 2B). Western blotting also showed the reduced protein expressions of these genes (Figure 2C,D).
These results suggested that an adequate disease model was successfully established for subsequent research. Compared with the NC-iRPE group, the RP-iRPE group showed an irregular morphological structure and a decrease in RPE-specific markers, which indicated defective characterization in RP-iRPE cells.

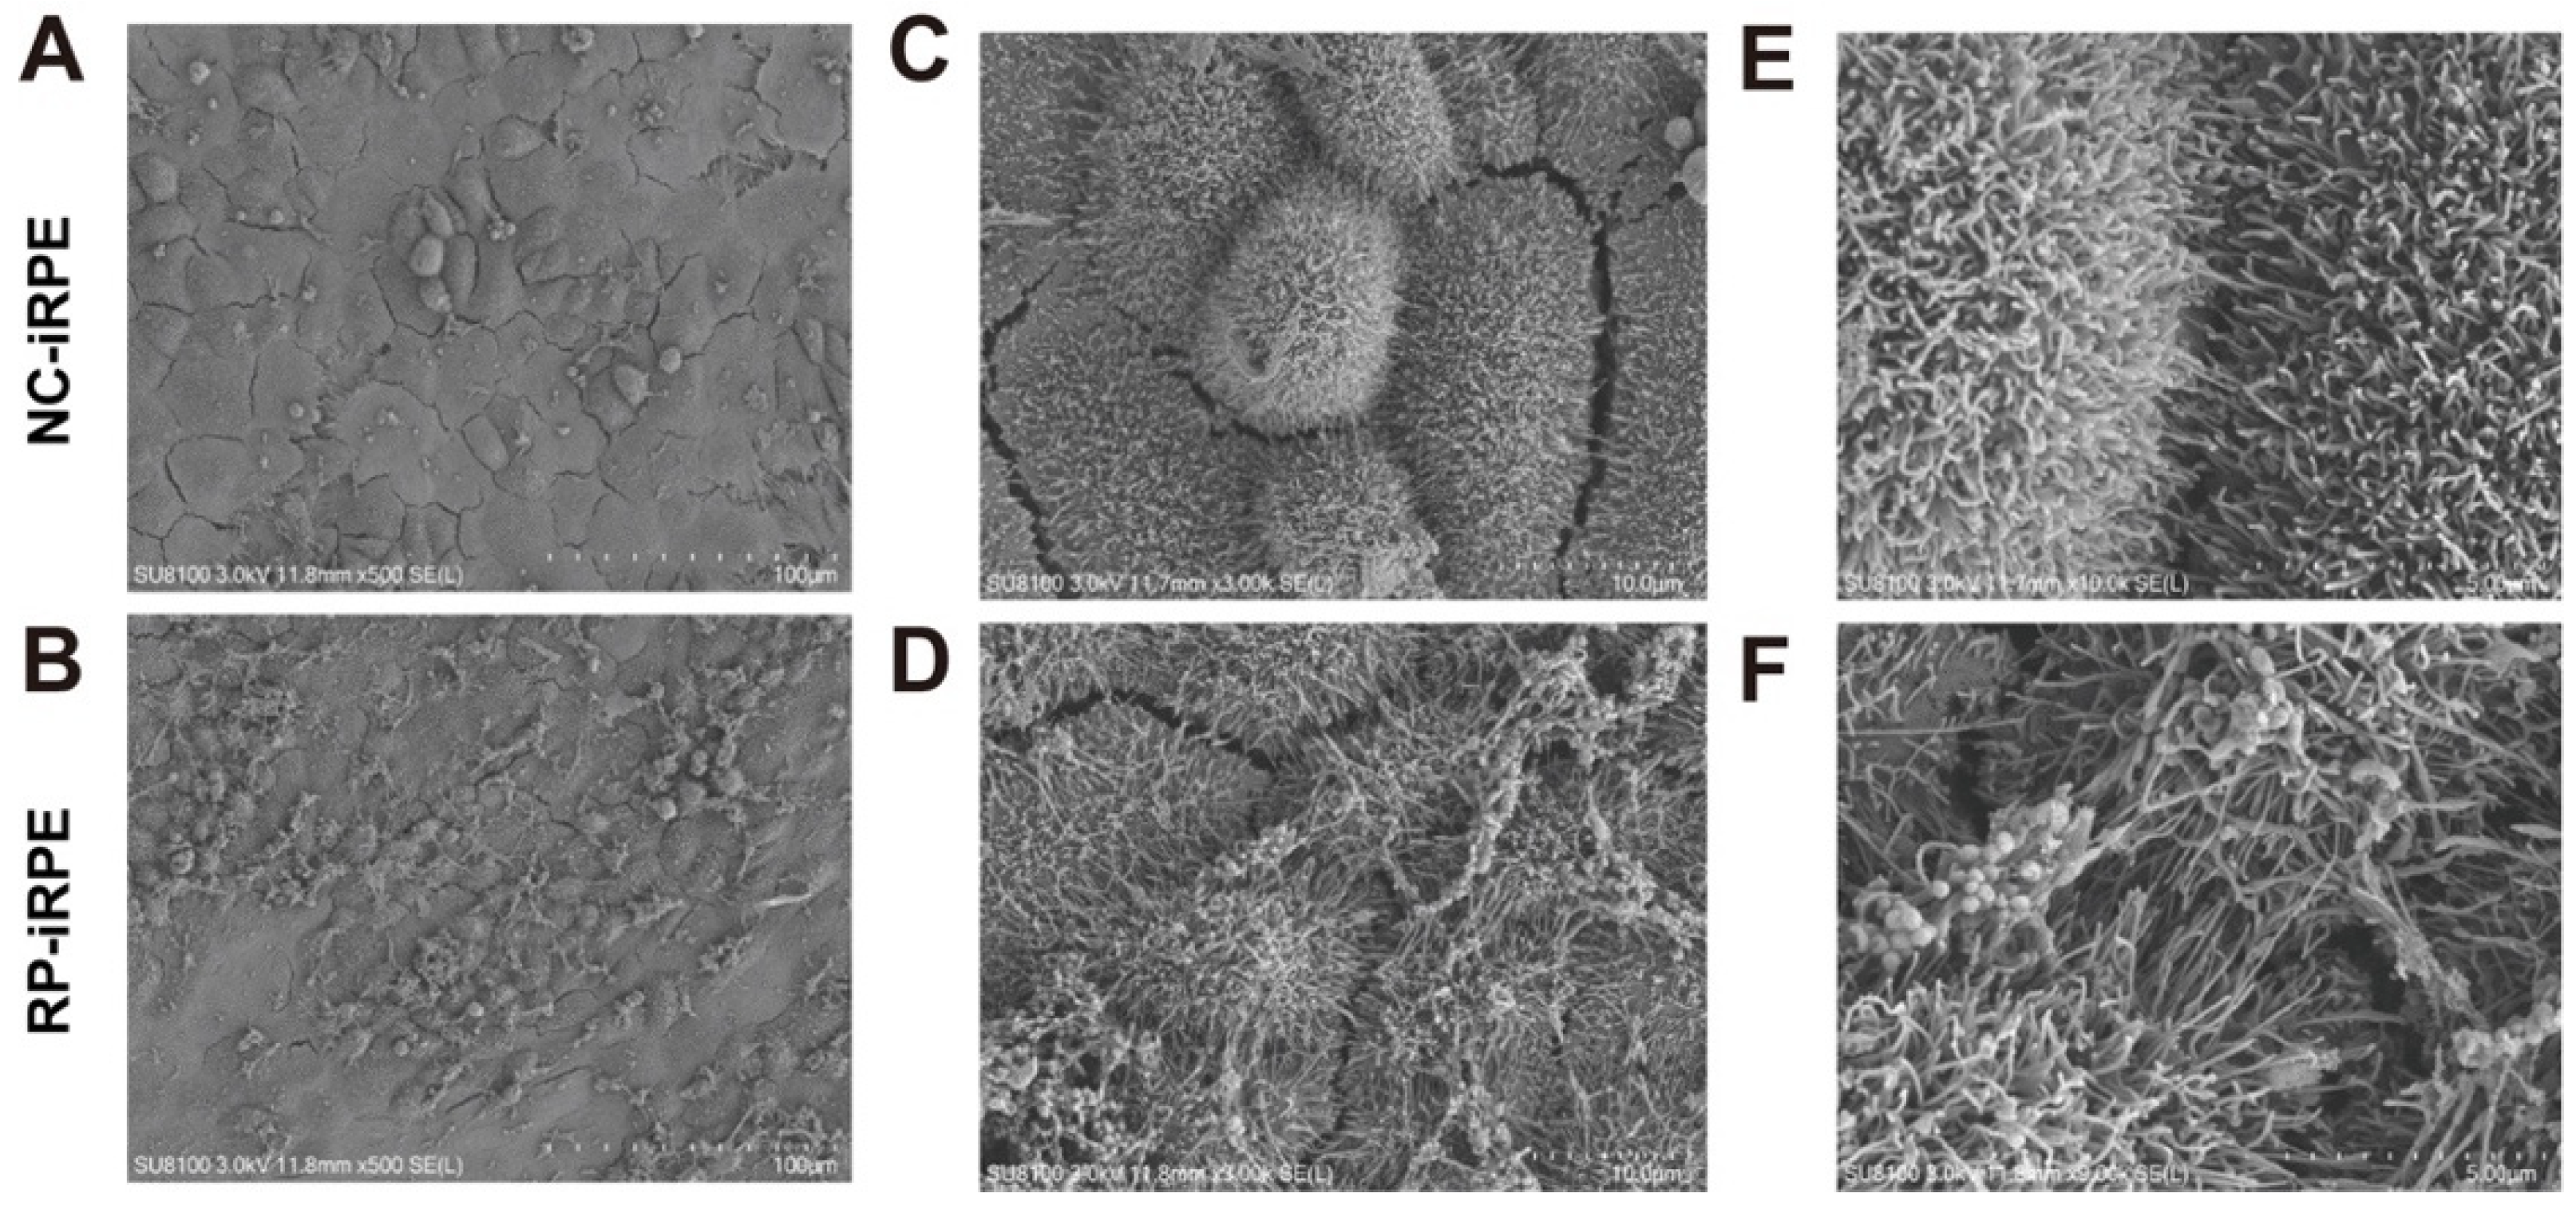
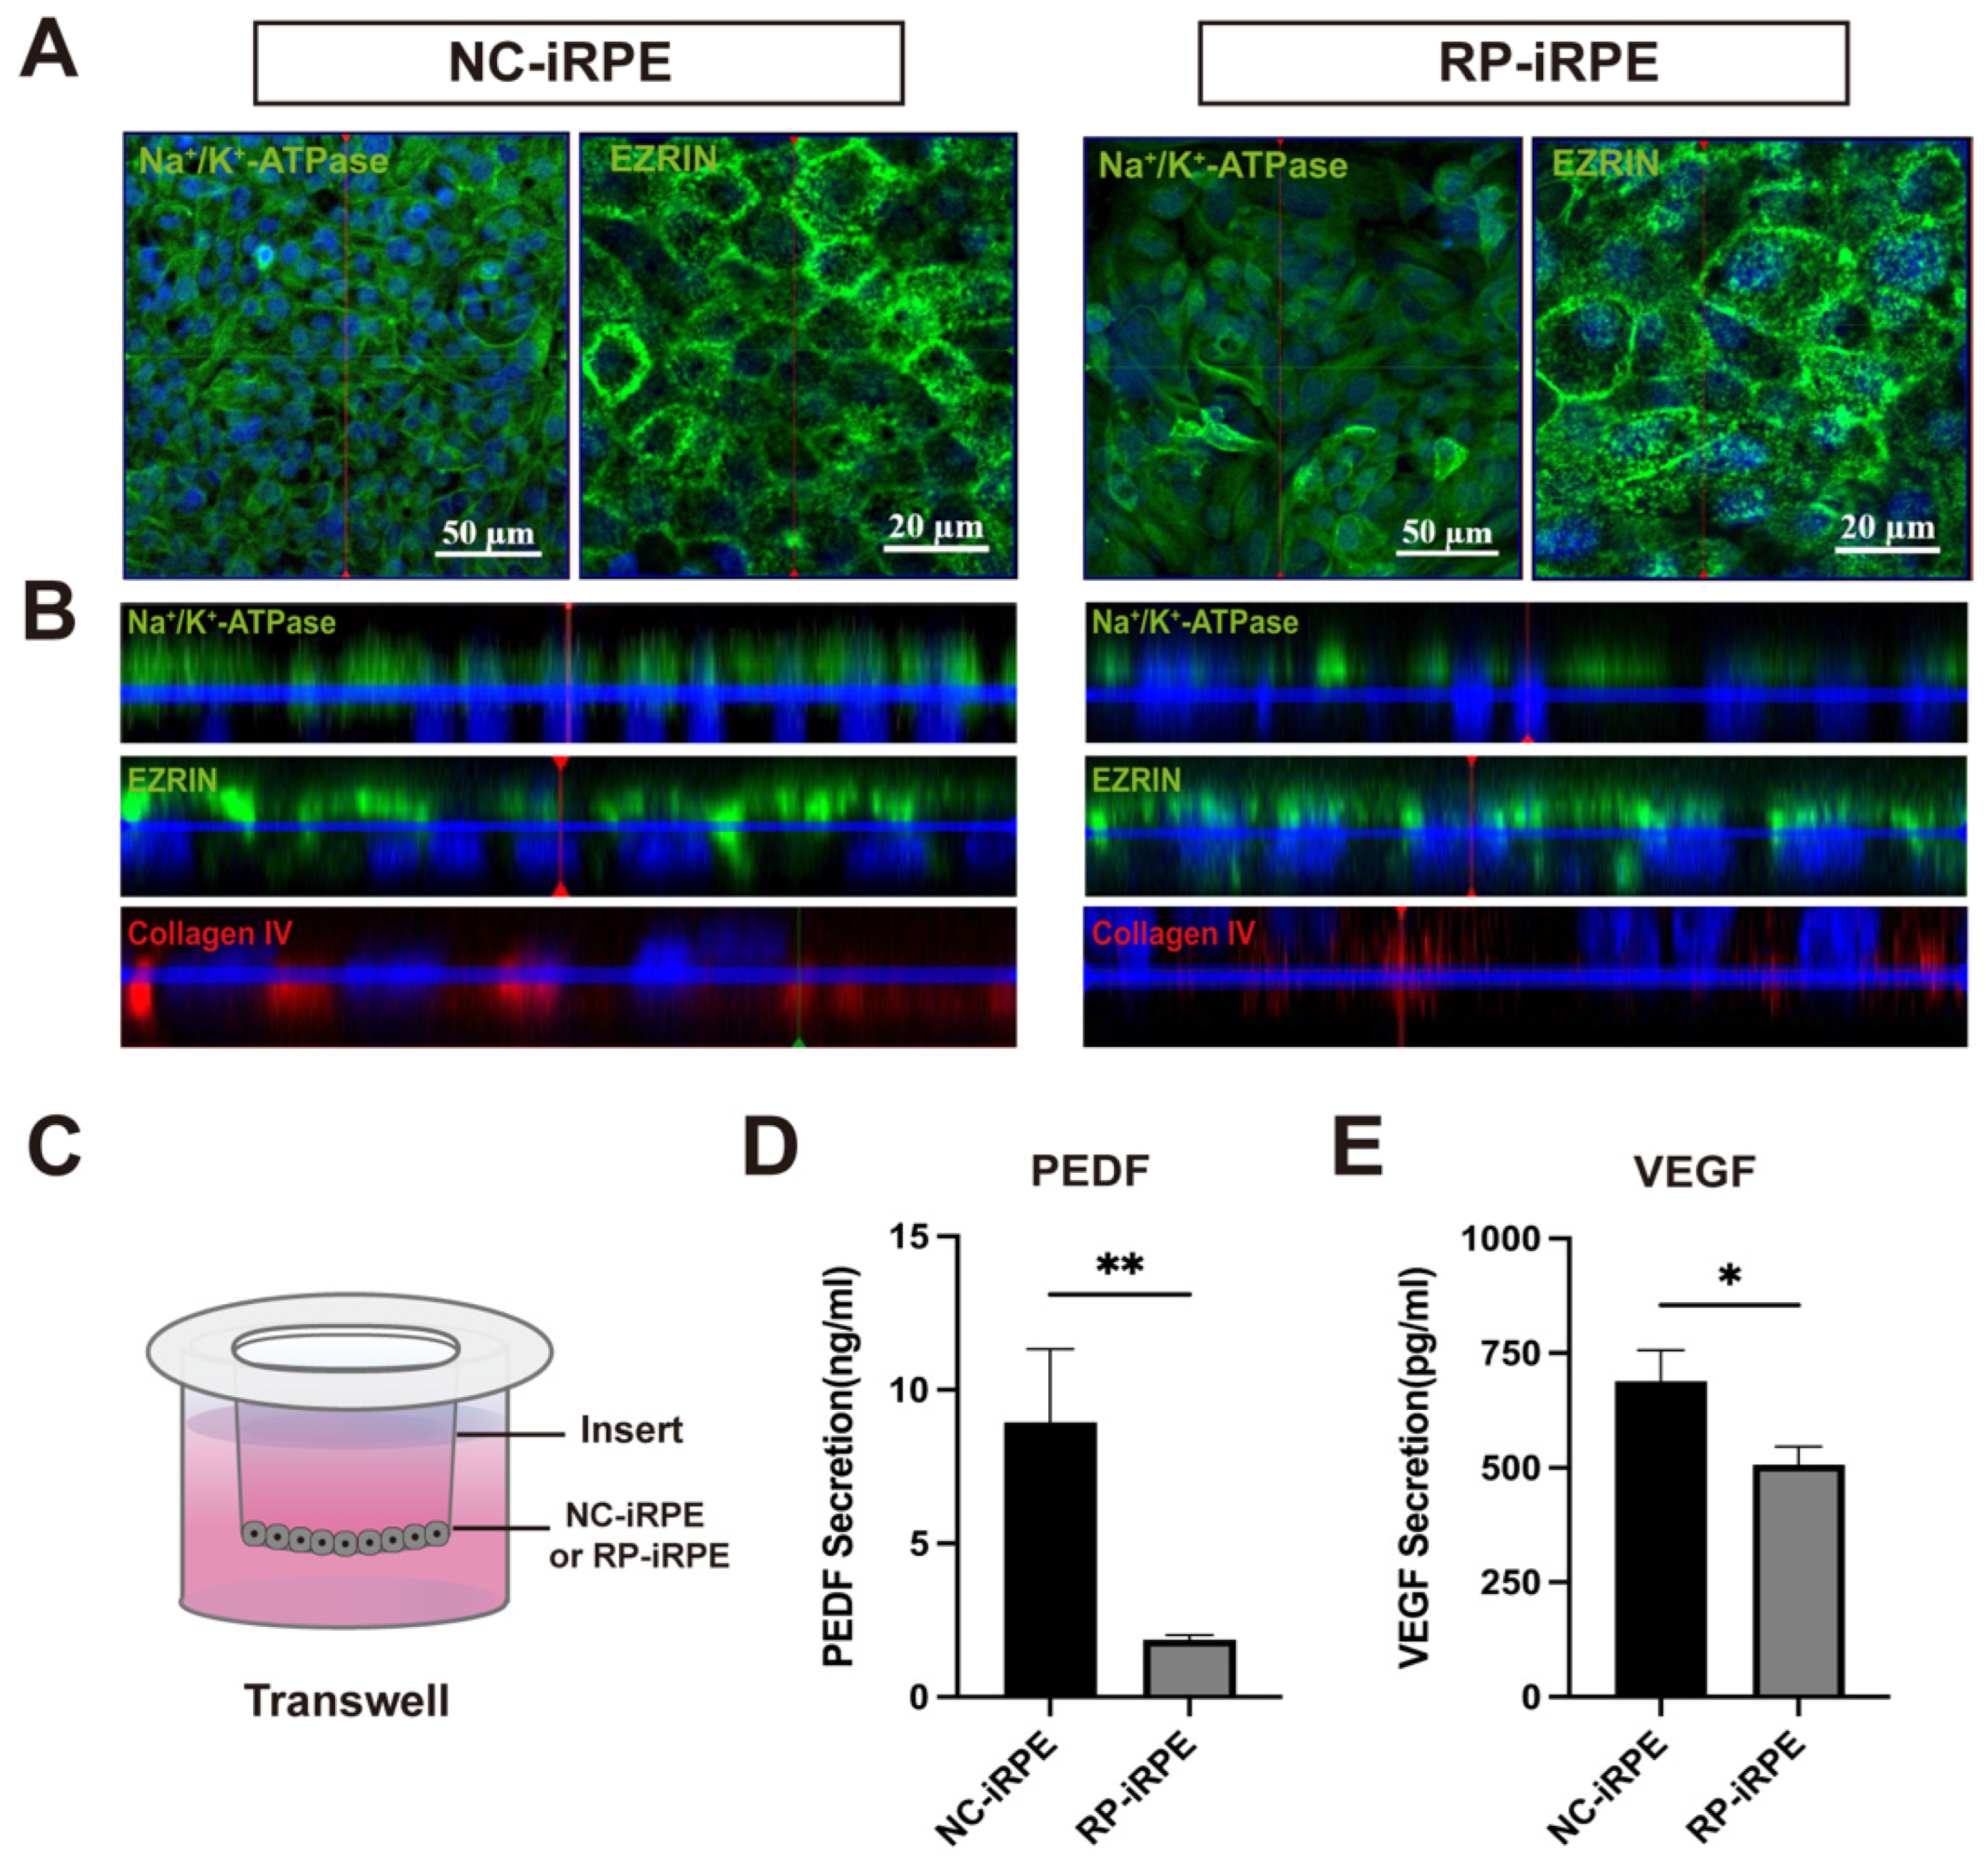
2.2. Association of PRPF6 Mutation with Changes in RPE Cell Polarity

The polarity of the RPE cell monolayer plays an important role in maintaining its barrier function [30]. To evaluate the expression of polarity biomarkers, immunofluorescence staining of the apical markers Na+/k+-ATPase and EZRIN was performed (Figure 3A). In addition, confocal z-stack microscopy revealed that the expression of the Na+/k+-ATPase marker in the RP-iRPE group was significantly lower than that in the NC-iRPE group, while the apically-located microvilli marker EZRIN was similarly expressed in both groups (Figure 3B). Collagen IV, the marker of basal side distribution, was reduced in RP-iRPE cells (Figure 3B). In order to understand the differences in apical microvilli between the NC-iRPE group and RP-iRPE group, an ultrastructural observation was carried out. Scanning electron microscopy (SEM) revealed that compared with the disordered microvilli structure in the RP-iRPE group, the microvilli in the NC-iRPE group were organized more neatly, and the RPE cells were more closely connected to each other without obvious intercellular space (Appendix A, Figure A3).
To further assess the highly polarized RPE monolayer, the secretions of pigment epithelium-derived factor (PEDF) and vascular endothelial growth factor (VEGF) from the apical and basal sides were measured. RPE cells derived from the NC-iRPE group and RP-iRPE group were seeded in 24-transwell inserts and cultured for 2 weeks (Figure 3C). Media samples were collected from the upper and lower chambers of the two groups. Enzyme-linked immunosorbent assay (ELISA) analysis showed that the secretion levels of PEDF and VEGF proteins in the RP-iRPE group were lower than those in the NC-iRPE group (Figure 3D,E). Together, these results revealed that the polarity was impaired in RPE cells with PRPF6 mutation.

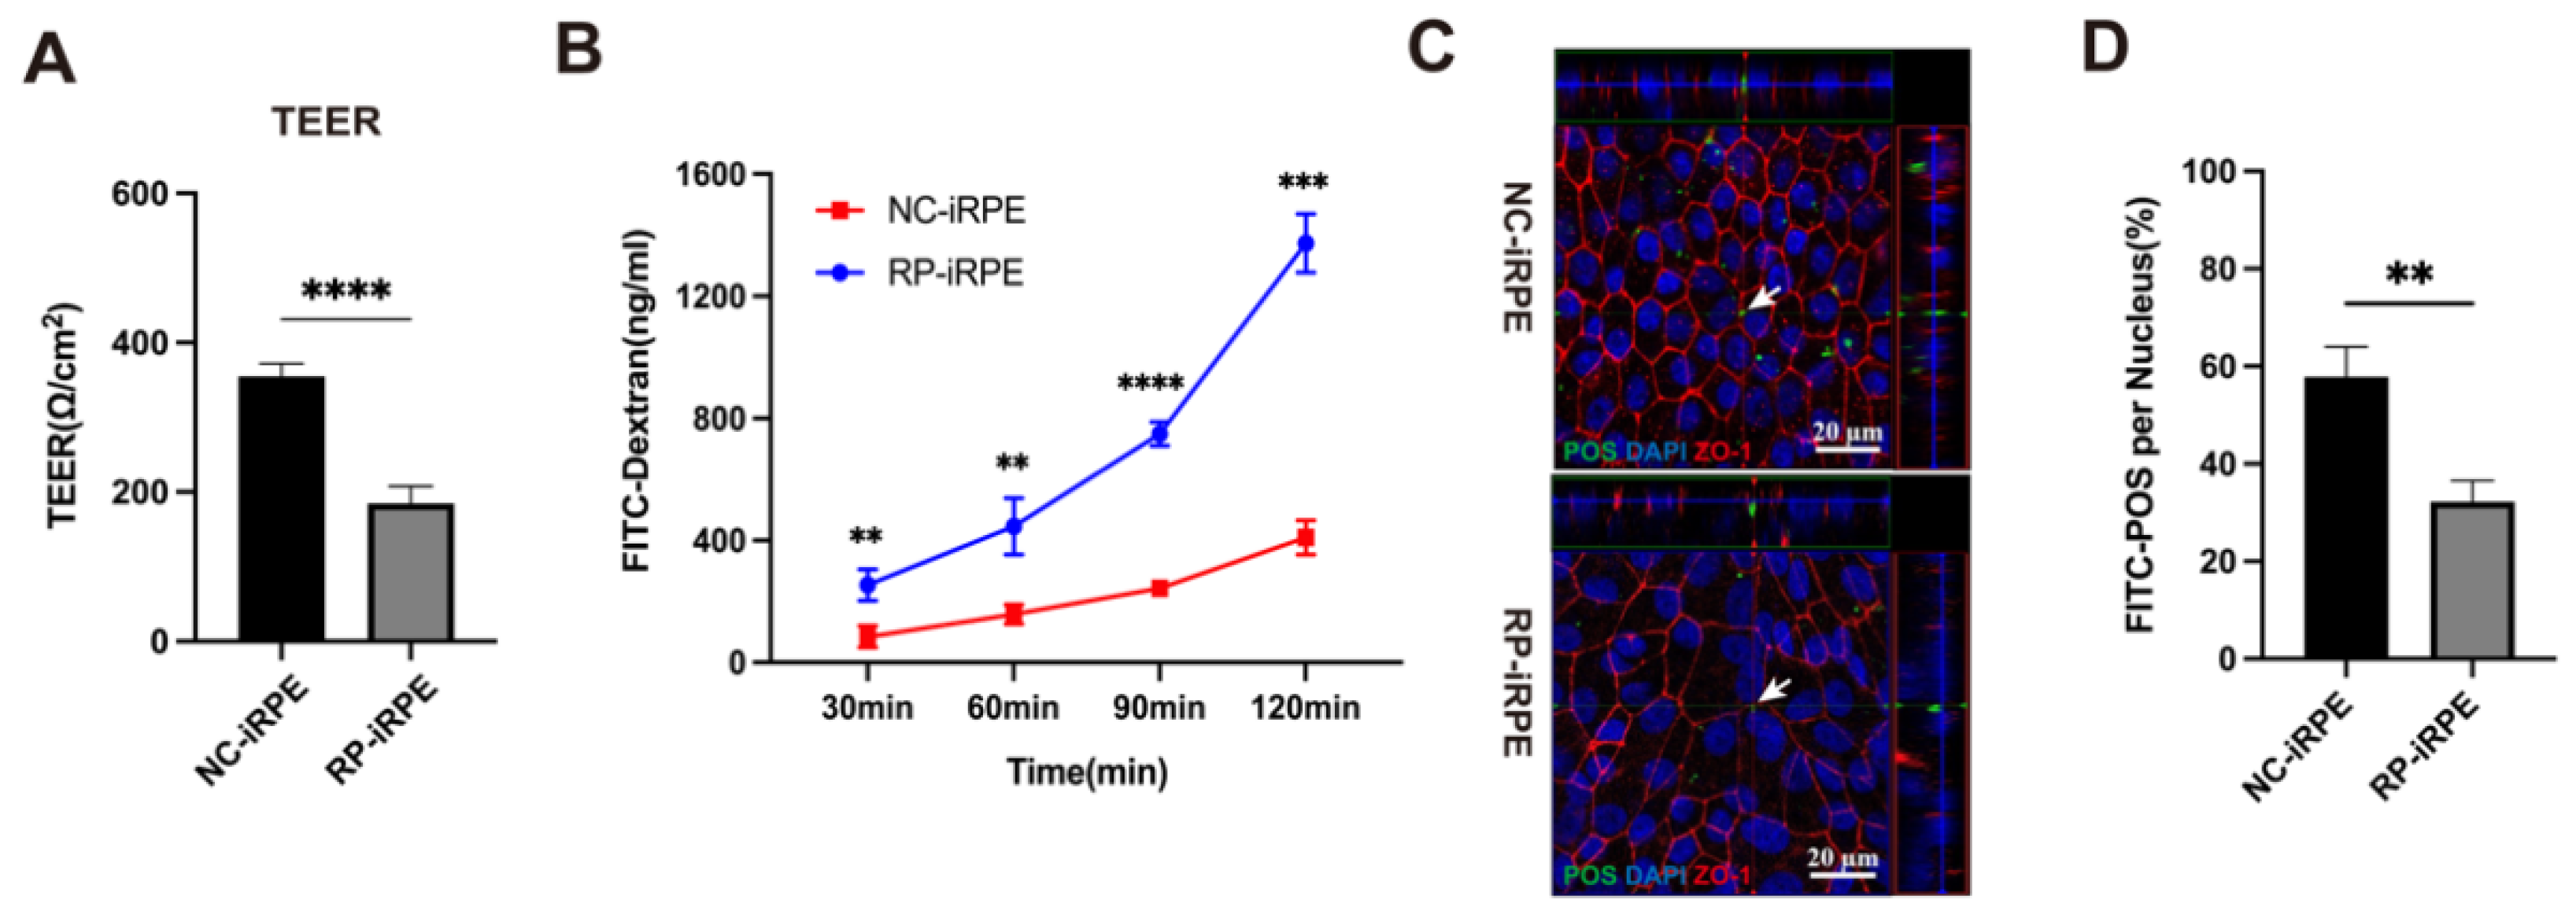
2.3. Aberrant Barrier Function in RPE Cells with PRPF6 Mutation

The barrier function of RPE cells was assessed by several experiments: (1) transepithelial electrical resistance (TEER) measurement to monitor cellular dynamic barrier function; (2) permeability assay to detect the apical-to-basolateral movements of molecules; (3) photoreceptor outer segments (POS) phagocytosis test. The TEER values of the confluent RPE monolayer seeded in 24-transwell inserts achieved stability at approximately 2 weeks. The TEER values of the RP-iRPE group (184.85 ± 23.08 Ω/cm2, n = 4) were lower than those in the NC-iRPE group (355.30 ± 16.85 Ω/cm2, n = 4) (Figure 4A). Moreover, a permeability assay was performed after the stabilization of the TEER values. The concentrations of fluorescein isothiocyanate (FITC) dextran in the NC-iRPE group were 84.63 ± 35.62 ng/mL, 158.49 ± 31.99 ng/mL, 243.44 ± 11.08 ng/mL, 409.64 ± 55.40 ng/mL at 30, 60, 90 and 120 min, respectively, while they were 254.52 ± 50.77 ng/mL, 446.57 ± 92.26 ng/mL, 749.43 ± 38.91 ng/mL and 1373.60 ± 95.96 ng/mL, respectively, in the RP-iRPE group (Figure 4B). Over time, the FITC molecule penetrated from the apical-to-basal side in the RP-iRPE group more than in the NC-iRPE group. In addition to the secretion of growth factors, RPE cells are also responsible for daily POS phagocytosis, which plays an important role in maintaining the outer retinal barrier [20]. The internalized localization of POS in the two groups was observed via confocal z-stack imaging (Figure 4C, arrows). The results suggested that the number of internalized POS was markedly reduced in the RP-iRPE group (Figure 4D).

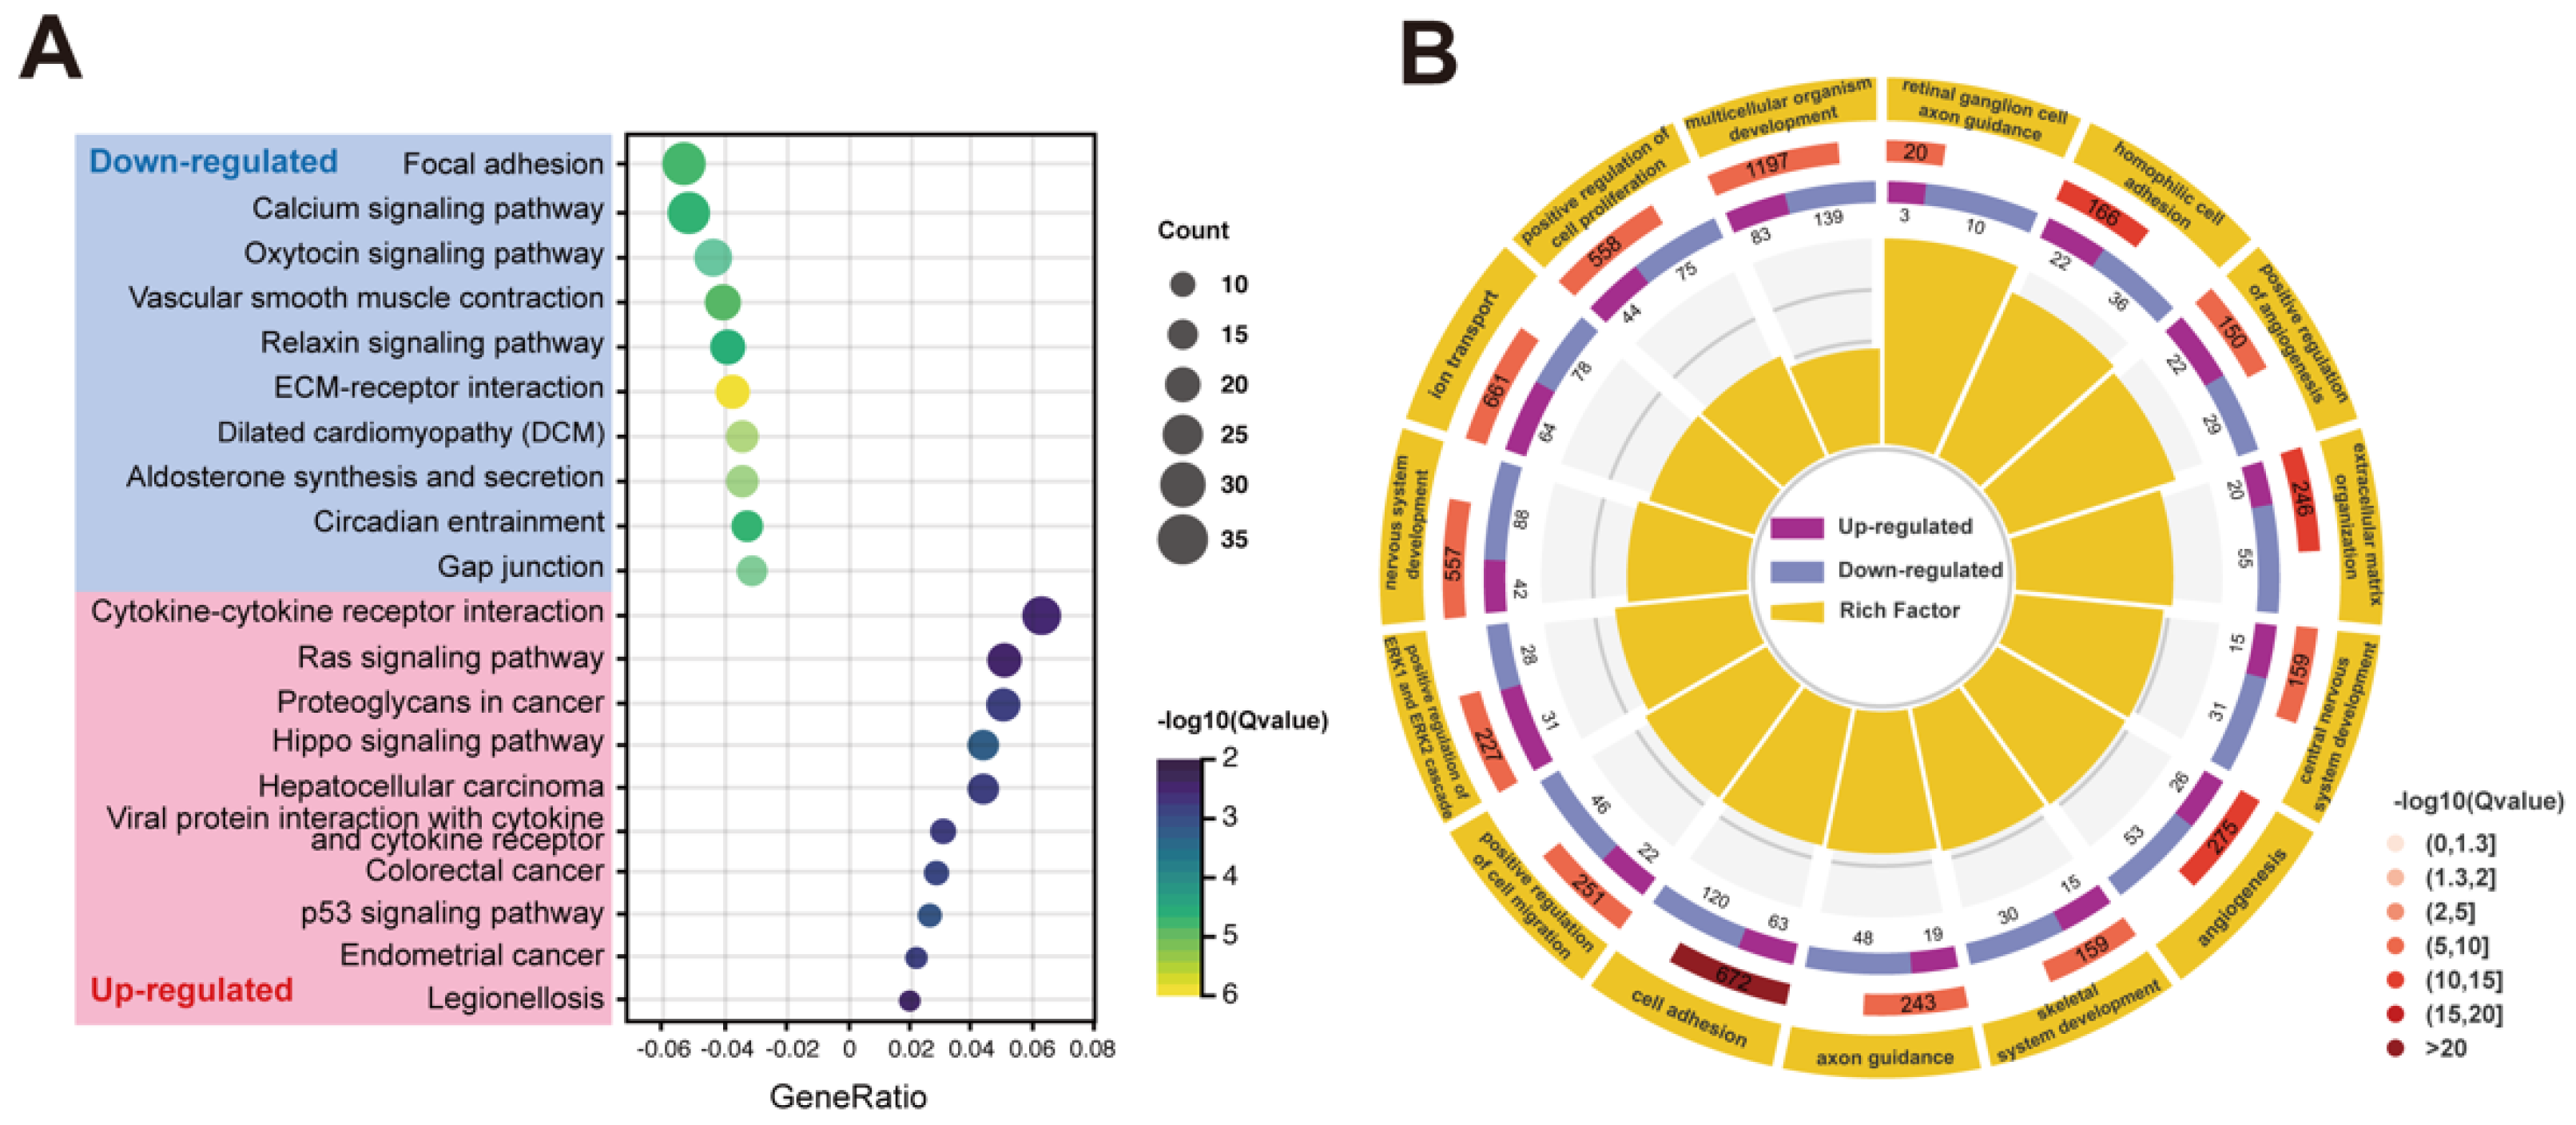
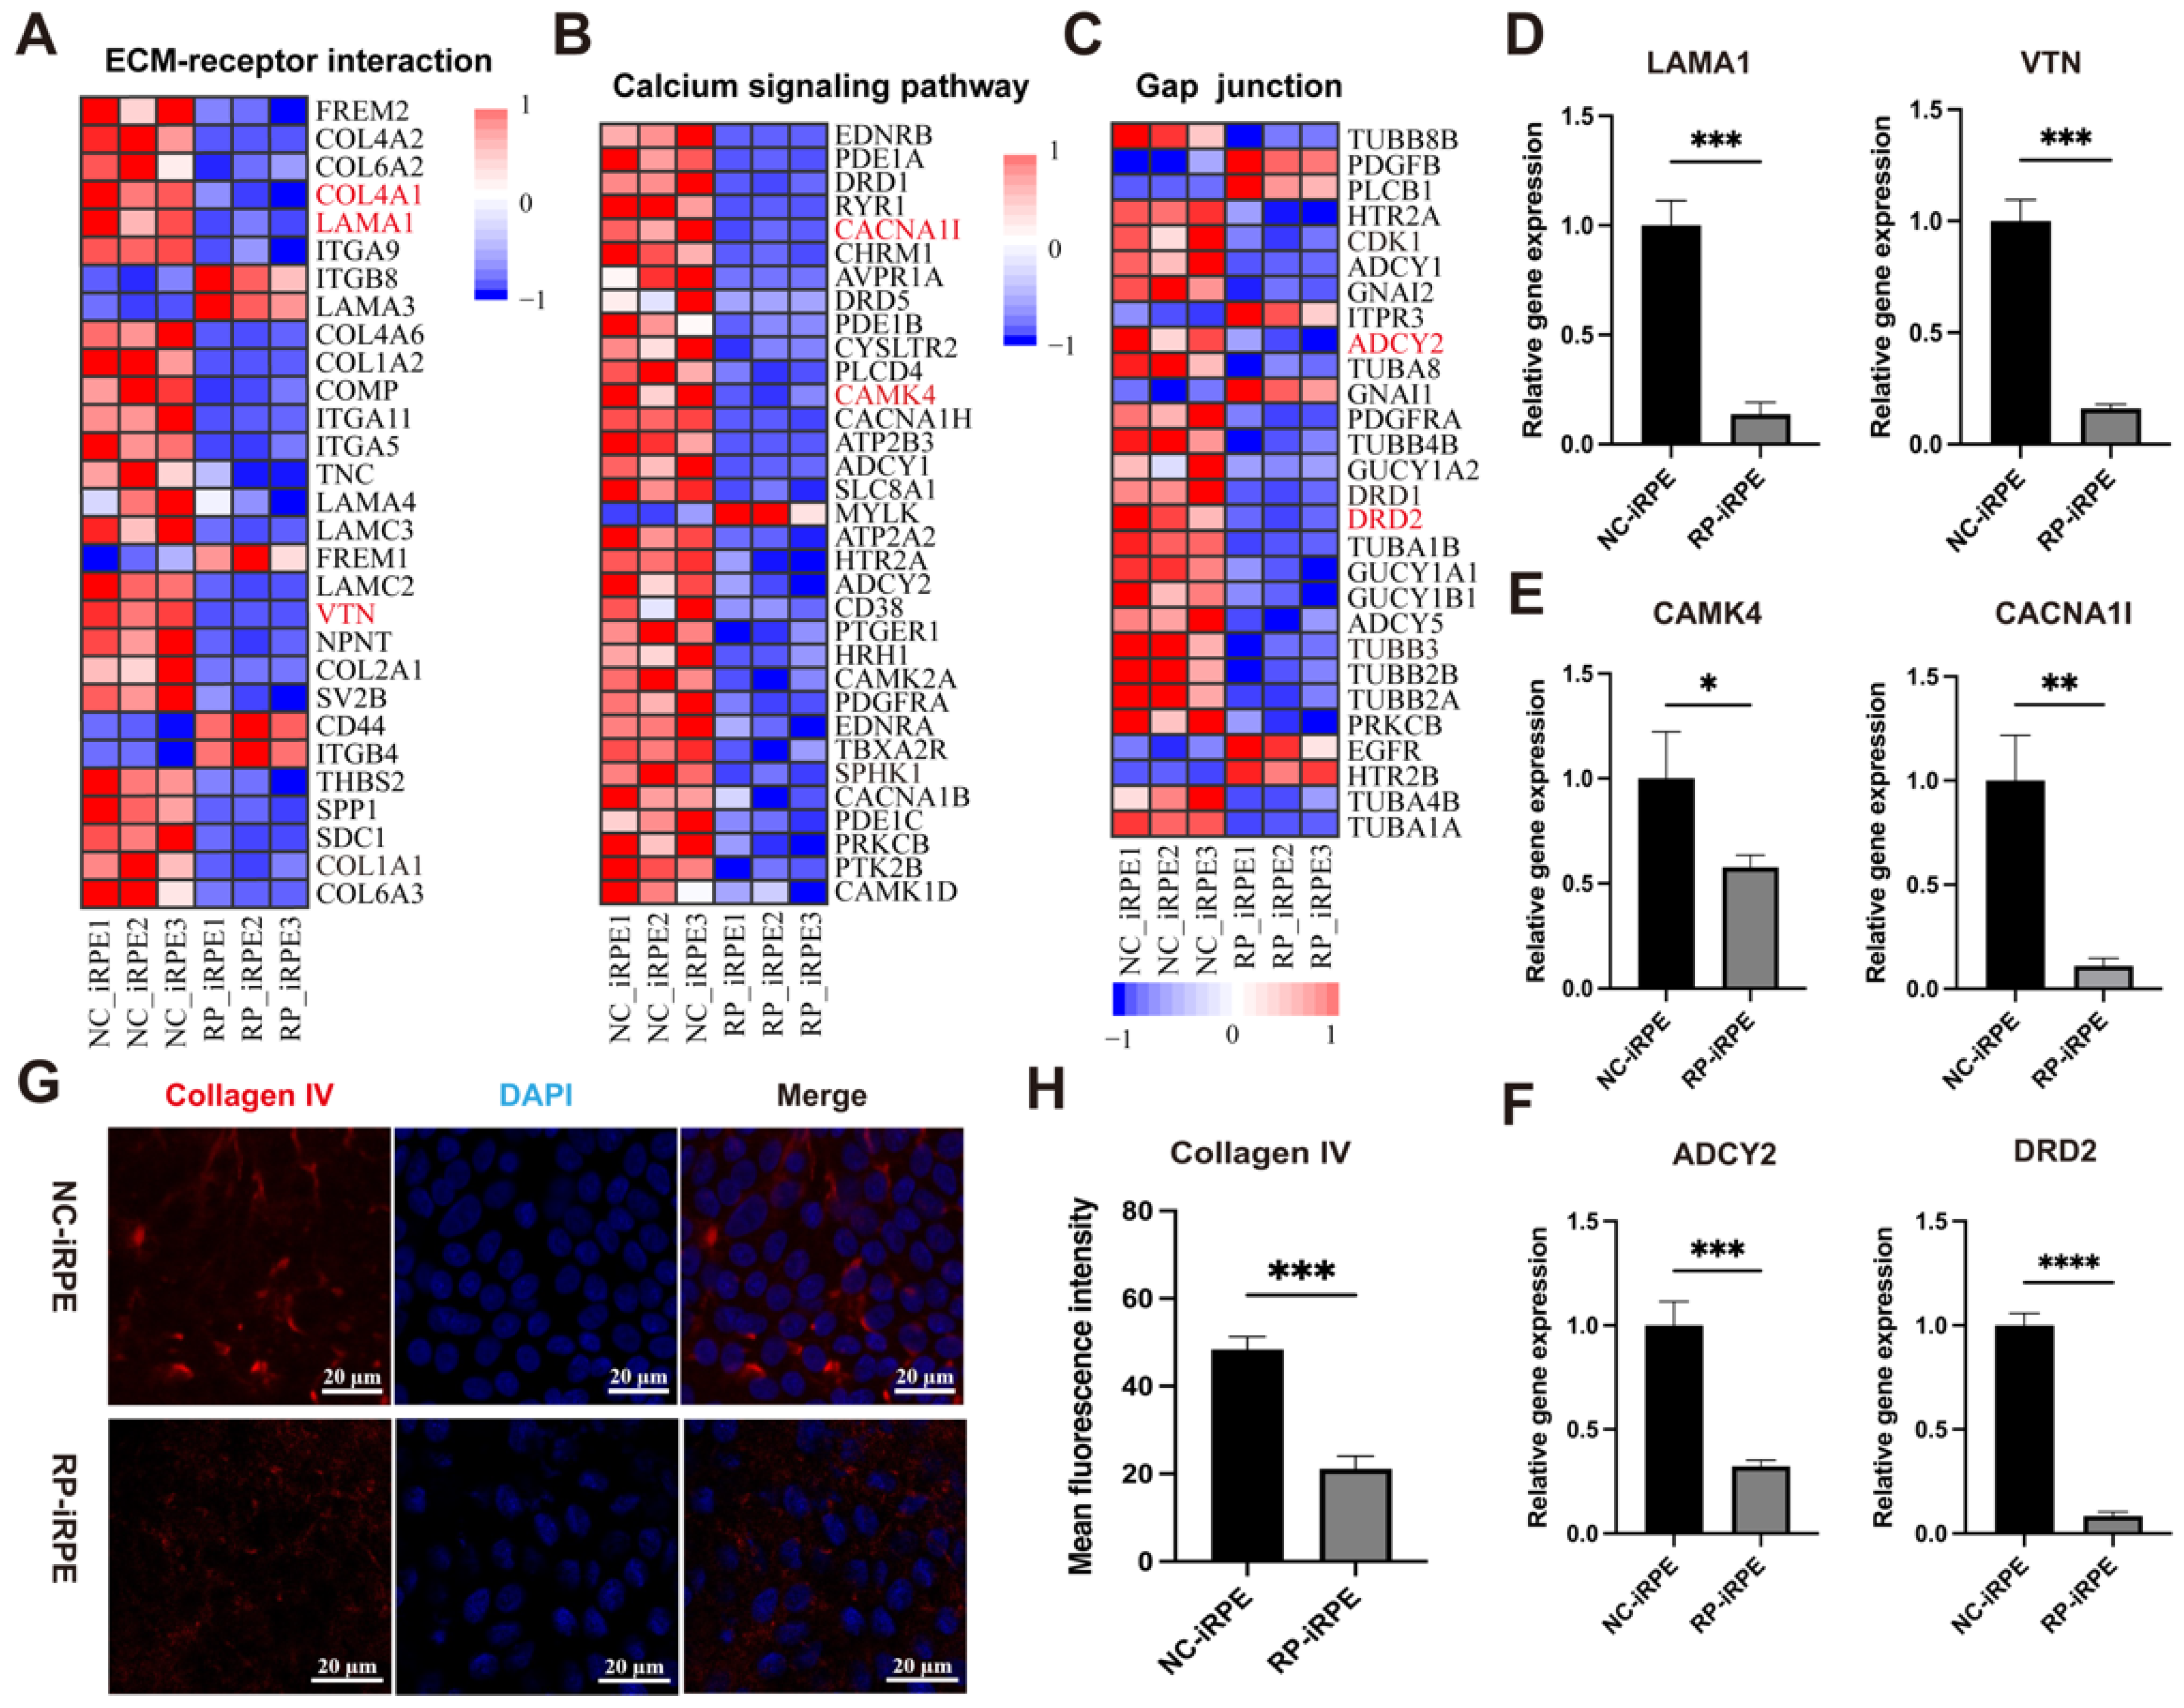
2.4. Transcriptome Analysis of RPE Cells with PRPF6 Mutation

To investigate the potential mechanism of PRPF6 mutation in affecting the biological functions of RPE cells, RNA-sequencing analysis was conducted between the NC-iRPE group and the RP-iRPE group. Principal component analysis (PCA) showed obvious differences between the two groups (Figure 5A). Moreover, Pearson’s correlation coefficient revealed a correlation between the biological replicates of each group (Figure 5B). A total of 2686 differentially expressed genes (DEGs) were identified based on the threshold of the adjusted p-value < 0.05 and fold change > 2. A volcano plot illustrated that 1460 genes were downregulated and 1226 genes were upregulated (Figure 5C).
To further explore the bioinformatic differences between the two groups, Gene Ontology (GO) terms and Kyoto Encyclopedia of Genes and Genomes (KEGG) pathways analyses were performed based on all DEGs. The top 20 KEGG signaling pathways with the most significant differences were selected (Figure 6A) (Appendix B, Table A2). Compared with the NC-iRPE group, the ECM-receptor interaction, focal adhesion, calcium signaling pathway, gap junction, circadian entrainment and aldosterone synthesis and secretion were downregulated signaling pathways in the RP-iRPE group. The upregulated signaling pathways included cytokine–cytokine receptor interaction, the Ras signaling pathway, hippo signaling pathway, hepatocellular carcinoma, p53 signaling pathway and viral protein interaction with the cytokine and cytokine receptor. Notably, ECM–receptor interaction was the most affected signaling pathway. In the GO functional enrichment, the top 15 GO terms associated with the biological process were shown with a circle diagram, including cell adhesion, extracellular matrix organization, nervous system development, the positive regulation of cell proliferation, ion transport, axon guidance and the positive regulation of the ERK1/2 cascade (Figure 6B) (Appendix B, Table A3).
Next, we selected three important signaling pathways that may be associated with the effects of PRPF6 mutation on the biological function of RPE cells for further analysis based on KEGG enrichment, including ECM–receptor interaction, the calcium signaling pathway and gap junction. DEGs in these signaling pathways were obtained through RNA-sequencing data and presented in the form of heat maps (Figure 7A–C). To validate the results of transcriptome sequencing, the expression levels of the corresponding DEGs were evaluated by quantitative real-time PCR. As shown in Figure 7D–F, the expression of ECM-related genes (LAMA1, VTN), calcium signaling-related genes (CACNA1I, CAMK4) and gap junction-related genes (ADY2, DRD2) in the RP-iRPE group were significantly lower than those in the NC-iRPE group. The quantitative real-time PCR results were consistent with RNA-sequencing data. Moreover, immunofluorescence staining analysis was also performed, demonstrating lower expression of the collagen IV marker in RP-iRPE cells (Figure 7G,H).

3. Discussion

Despite the rapid pace of RP pathogenic gene discovery in the last decade, research into the specific pathogenesis and precise gene therapy remain as major challenges for RP due to its high genetic heterogenicity [31]. In this study, a disease model of the RPE cells derived from an adRP patient with the PRPF6 missense variant of c.2699G > A (p.Arg900His) was successfully established, while this variant has not been previously reported in other laboratories. Moreover, we demonstrated that compared with the control, RP-iRPE cells displayed irregular morphology, disorganized apical microvilli and aberrant functional characteristics, including reduced phagocytosis of FITC-labeled POS, damaged cell polarity and barrier function. Transcriptome analysis showed that a higher ratio of downregulated DEGs in the RP-iRPE group was related to the ECM–receptor interaction, calcium signaling pathway and gap junction.
Rodent models are used to study RP associated with splicing factors by knock-in or knockout gene editing [32]. However, in addition to ethical concerns, none of the rodent models are fully representative of the onset and development of human retinal diseases due to genetic and clinical diversity [33,34,35]. For example, photoreceptors and RPE cells are the primary degenerated cells for RP, but it has been reported that splicing factors-associated animal models developed late-onset functional deficiencies in mutant RPE, while a nearly normal phenotype of photoreceptor cells was observed [36,37]. In order to overcome the translation hurdle between rodents and humans, we generated RPE cells derived from patient iPSCs that could recapitulate the genetic background of adRP caused by PRPF6 mutation. This is beneficial for studying the correlations between the genotypes and phenotypes of the disease.
In this study, we found that RP-iRPE cells lost their classic hexagonal appearance and expressed lower levels of the RPE-specific markers RPE65, MITF, CRALBP and tyrosinase. Additionally, a decreased degree of polarity, phagocytic ability and barrier function was observed in the RP-iRPE group compared to the NC-iRPE group. Such an aberrant phenotype was also observed in iPSC-RPE cells with PRPF31 mutation [38,39]. Their results also revealed that splicing defects appeared to be correlated with the ultrastructural, cellular and functional deficiencies that are characteristic of RPE in the RP disease state [38]. Furthermore, it has previously been described that knock-in/knockout animal models of some splicing factors present an RPE degenerative phenotype [36]. A heterozygous knock-in mouse model carrying the prpf31p.A216P mutation displayed RPE pathological morphologies, including a drusen-like deposit, large lipofuscin accumulation and atrophy of basal infoldings [33]. However, intriguingly, it was reported that PRPF8 mutation caused widespread splicing changes but did not display distinctly abnormal behavior in patient iPSC-derived RPE cells [8,40]. Therefore, different member mutations from the PRPF family may lead to different effects on RPE. We propose the hypothesis that certain spliceosome proteins are destroyed by disease-related variants, but this has no dominant effect.
Next, RNA-sequencing was analyzed in the RP-iRPE and NC-iRPE groups. Based on the top 20 significantly enriched pathways by KEGG enrichment analysis, this study focused on ECM–receptor interaction, the calcium signaling pathway and gap junction. COL4A1, LAMA1 and VTN were selected from the ECM–receptor interaction. Bruch’s membrane, which is rich in collagen I, collagen IV and laminin, plays a crucial role in supporting and maintaining the RPE structure and function [41]. The changes in Bruch’s membrane affect the health of the RPE and photoreceptor cells and also the onset and progression of some diseases such as RP and age-related macular degeneration [41]. Zhu et al. reported that the ECM protein vitronectin is more conducive to the in vitro culture of RPE cells compared with the laminin-521 [42]. Cruz et al. developed a therapeutic patch via the RPE monolayer immobilized on a vitronectin-coated PET membrane [43]. However, our results revealed that the expression levels of COL4A1, LAMA1 and VTN were significantly reduced in the RP-iRPE group, which could suggest that PRPF6 mutation affects the biological function of RPE cells by downregulating ECM-related genes. In addition, defective ECM is also associated with vascular diseases, such as cerebral cavernous malformations (CCM) [44,45,46]. Transcriptome analysis on human brain microvascular endothelial cells isolated by CCM specimens revealed that DEGs were associated with neuroinflammation, ECM remodeling, cell junction impairment and reactive oxygen species metabolism. Intriguingly, consistent with our RNA sequencing results, the ECM-related genes of COL1A1, COL1A2, COL4A1, LAMA4, SDC1 and TNC were also dysregulated [46].
Calcium signaling is fundamentally important for several critical RPE functions, including the transepithelial transport of ions and water, dark adaptation of photoreceptor activity, phagocytosis and growth factor secretion [47,48]. RPE is known to embryologically originate from the neural ectoderm. CACNA1I and CAMK4 have been reported to be associated with nervous development [49,50]. Moreover, the RPE cells are connected with gap junctions, tight junctions and adherent junctions [51]. ADCY2 and DRD2 were selected from the gap junction pathway for quantitative real-time PCR validation, and the results were consistent with transcriptomic data.
A few limitations in the present study need to be considered. The first was that only one patient was included in our research design due to the low incidence of PRPF6-associated adRP. Still, a greater number of patients, or/and isogenic controls generated by gene editing systems [52], will be included as far as possible in our future experiments. Meanwhile, the mechanisms by which splicing factors lead to the alterations in RPE function need more in-depth investigation due to the likely involvement of a variety of complex and comprehensive factors. Another limitation was that the interaction between photoreceptors and underlying RPE was not taken into account in our research. Mature co-culture technologies of RPE cells and retinal organoids containing photoreceptors by microfluidic chip platform will be the focus of our future efforts [53].

4. Materials and Methods

4.1. iPSCs Culture and Passaging

The patient iPSC line (CSUASOi004-A) employed in this study was generated from the peripheral blood mononuclear cells of a patient with PRPF6 mutation, as previously reported [28]. The cells were cultured in 6-well plates coated with Matrigel (Corning, New York, USA) using mTeSRTMPlus medium (StemCell Technologies, Vancouver, BC, Canada) at 37 °C, 5% CO2 in a humidified incubator. Medium was changed every other day and enzymatically passaged with EDTA every 5 to 7 days at splitting ratios from 1:6 to 1:10. The normal iPSC cell line, as a control, was also differentiated into RPE cells under the same conditions. Sanger sequencing of all cell samples was performed regularly for genotyping verification.

4.2. iPSCs Differentiation to RPE Cells

RPE cells were generated from iPSCs following the previously reported method [26]. Briefly, iPSCs were grown to 80% confluence in mTeSRTMPlus medium and switched to RPE differentiation medium containing Dulbecco’s modified Eagle’s medium (DMEM; Gibco, Grand Island, NY, USA), 20% knockout serum replacement (KSR; Thermo Fisher Scientific, Waltham, MA, USA), 1× non-essential amino acids (NEAA; Sigma, San Luis, MO, USA), 50 μM β-mercaptoethanol (Gibco), 1% penicillin–streptomycin (Gibco) and 10 mM nicotinamide (MedChemExpress, Princeton, NJ, USA) for 0–7 days. Then, nicotinamide was replaced with 100 ng/mL Activin A (Peprotech, Rocky Hill, NJ, USA) for another week. On day 14 of differentiation, Activin A was removed from the medium, and 3 μM CHIR99021 (MedChemExpress) was added. On day 42, RPE cells were collected by incubating in TrypLE Express (Gibco) for 30 min at 37 °C and then seeded on a Matrigel-coated 6-well plate with a density of approximately 1 × 10⁶ cells/well. Meanwhile, RPE differentiation medium was replaced with RPE maintenance medium consisting of DMEM, 4% KSR, 1× NEAA, 1% penicillin–streptomycin and 50 μM β-mercaptoethanol without molecule compound. At this point, the cells were defined as passage 1 (P1). Only RPE cells at P2 and P3 were used in this study.

4.3. Immunofluorescence Staining

RPE cells were cultured for 14 days and washed two times with PBS. After fixing with 4% paraformaldehyde (PFA), cells were permeabilized with 0.5% Triton X-100 and blocked with 3% BSA in PBS for 1 h at room temperature. Then, cells were incubated overnight at 4 °C with primary antibodies, including mouse anti-ZO-1 (1:100, Invitrogen, Carlsbad, CA, USA), rabbit anti-MITF (1:200, Invitrogen), mouse anti-RPE65 (1:50, Abcam, Cambridge, UK), rabbit anti-CRALBP (1:100, Proteintech, Rosemont, IL, USA), rabbit anti-tyrosinase (1:100, Abcam), rabbit anti-EZRIN (1:200, GeneTex, Irvine, CA, USA), mouse anti-Na+/K+-ATPase (1:50, Santa Cruz Biotechnology, Santa Cruz, CA, USA) and mouse anti-Collagen IV (1:100, Abcam) (Appendix B, Table A1) followed by washing three times in PBS and incubation with secondary goat anti-mouse/rabbit Alexa Fluor 594/488 antibody (1:1000, Invitrogen) for 1 h at room temperature. After washing three times with PBS, cell nuclei were stained with 4′,6-diamidino-2-phenylindole (DAPI; Solarbio, Beijing, China) for 10 min. Immunofluorescence images were captured using a laser scanning confocal microscope (LSM800; Zeiss, Thornwood, Germany).

4.4. Reverse Transcription PCR and Quantitative Real-Time PCR

After 14 days of culture, total RNA of RPE cells was extracted with TRIzol reagent (Thermo Fisher Scientific) following the manufacturer’s instructions. HiScipt II Q RT SuperMix (Vazyme, Nanjing, China) was then used for reverse transcription of RNA into cDNA. The quantitative real-time PCR was performed using ChamQ Universal SYBR qPCR Master Mix (Vazyme) on a Roche LightCycler 96 system (Roche, Basel, Switzerland). The total volume of each reaction solution was 10 uL. The expression levels of genes were normalized to the GAPDH gene and calculated using the 2−ΔΔCt method. All results were obtained from at least three independent experiments for statistical analysis.

4.5. Western Blotting

RPE cells were cultured for 14 days and lysed by RIPA buffer (Beyotime, Shanghai, China) for 30 min. After centrifugation, total protein concentrations of all samples were quantified using a BCA Protein Quantification Kit (Vazyme) according to the manufacturer’s protocols. Equal amounts (30 μg) of proteins per lane were loaded and separated on sodium dodecyl sulfate (SDS)-polyacrylamide gel, and then transferred to nitrocellulose membranes. After blocking with PBS containing 3% BSA for 1 h at room temperature, the membranes were incubated with primary antibodies, including rabbit anti-PRPF6 (1:1000, Invitrogen), rabbit anti-CRALBP (1:1000, Proteintech), mouse anti-RPE65 (1:1000, Abcam), rabbit anti-tyrosinase (1:1000, Abcam), mouse/rabbit anti-GAPDH (1:2000, Arigo) and mouse anti-β-Actin (1:2000, Cell Signaling Technology, Danvers, MA, USA) overnight at 4 °C. Then, membranes were incubated with goat anti-rabbit IRDye 680RD secondary antibodies or goat anti-mouse IRDye 800 CW secondary antibodies (1:10,000, LI-COR Bioscience, Lincoln, NE, USA) for 1 h at room temperature. The bands were imaged on the Odyssey Fc Imaging System (LI-COR Bioscience), and the results were analyzed by Fiji/Image J software (National Institutes of Health, Bethesda, MD, USA).

4.6. TEER Assay

TEER assay was used to assess the integrity of the tight junction dynamic of epithelioid cells as described previously [54,55]. RPE cells were seeded on 24-transwell inserts at a density of 1 × 10⁴ cells/insert. To test the dynamic barrier of RPE cells monolayer, TEER assay was performed every 2–3 days with a Millicell-ERS-2 volt-ohm meter (Millipore, Billerica, MA, USA) until the TEER value reached stability. The TEER value was calculated according to the following equation
TEER (Ω/cm2) = (Rtotal − Rinsert)/A
Rtotal is the total resistance measured (Ω), Rinsert (Ω) is the resistance of the blank insert with media alone and A is the membrane area (cm2) of the insert.

4.7. SEM Observation

SEM was used to observe the ultrastructure of cell surface, as previously reported [56]. Briefly, RPE cells were seeded on a sterile glass slide in a 24-well plate. The slides were fixed with 2.5% glutaraldehyde (Solarbio) for 2 h at room temperature and washed gently with PBS three times. For post-fix, cells were transferred into 1% OsO4 (Ted Pella, Redding, CA, USA) for 1 h at room temperature and rinsed three times with PBS, and then dehydrated with a gradient concentration of ethanol (30%, 50%, 70%, 80%, 90%, 95%, 100%, 100%) and isoamyl acetate (Sigma) for 15 min each time. Finally, the samples were critical point dried, conductive metal coated and observed under a scanning electron microscope (SU8100; Hitachi, Tokyo, Japan).

4.8. ELISA

The media samples were collected from the upper and lower transwell chambers. The secretion levels of VEGF and PEDF protein were measured with ELISA kits (VEGF: Novus, CO, USA) (PEDF: CUSABIO, Wuhan, China) according to the manufacturer’s protocols.

4.9. Permeability Assay

Permeability assay was conducted by measuring the apical-to-basal movements of FITC (MedChemExpress) dextran as reported previously [57]. Briefly, cells were seeded in 24-transwell inserts. A 200 μL medium containing 100 μg/mL FITC dextran was added to the upper chamber and 1 mL medium alone in the lower chamber. In total, 200 μL of FITC dextran-treated medium was collected from the lower chamber of a 96-well plate at 30, 60, 90 and 120 min after adding the molecule; meanwhile, the same volume of fresh medium was supplemented. The fluorescence intensity of all samples at each time point was measured by a multifunctional microplate reader (Synergy HTX; BioTek, Winooski, VT, USA).

4.10. Phagocytosis Assay

POS were isolated from fresh porcine eyes, labeled with FITC and then applied for phagocytosis capacity of RPE as reported previously [58,59]. Briefly, POS were resuspended in 0.1 M sodium bicarbonate and incubated with FITC (MedChemExpress) in DMEM for 1 h at room temperature in the dark. After being labeled with FITC, POS were washed three times with PBS and resuspended in DMEM medium. RPE cells were incubated with FITC-labeled POS for 5 h. Then, the medium was sucked out, and the cells were washed four times with PBS. After fixing, permeabilizing and blocking, the samples were incubated with mouse anti-ZO-1 overnight at 4 °C. Cells were washed three times with PBS and incubated with goat anti-mouse Alexa Fluor 594 secondary antibody for 1 h at room temperature. After washing with PBS three times, cell nuclei were stained with DAPI for 10 min. Finally, sample images were acquired and analyzed quantitatively using a confocal microscope.

4.11. RNA-Sequencing Analyses

Total RNA of samples from the NC-iRPE and RP-iRPE groups were extracted using TRIzol reagent. RNA-sequencing was conducted by BGI Biotech Co., Ltd. (Wuhan, China). Raw data were filtered with SOAP [60] to remove the reads containing sequencing adaptors, low-quality and unknown bases. Next, the clean reads were mapped to the reference transcriptome sequence using Hisat2 [61] as previously described, and Bowtie2 [62] was applied to align the clean reads to the reference coding gene set. To obtain normalized gene expression levels, the reads per kilobase of exon model per million mapped reads values were calculated. The DEGs between the NC-iRPE group and RP-iRPE group were analyzed using the DESeq2 [63] with the parameters of adjusted p < 0.05 and fold change > 2. To gain insight into the functional enrichment of all DEGs, the GO terms and KEGG signaling pathways were performed, and the significant levels were corrected with an adjusted p < 0.05.

4.12. Statistical Analysis

Statistical analysis was performed using SPSS 26.0 software (SPSS Inc., Chicago, IL, USA) and GraphPad Prism 9.3 software (GraphPad Inc., Bethesda, MD, USA). The data were presented as mean ± SD obtained from at least three independent experiments. For a comparison between two different groups, an unpaired Student’s t-test was applied; comparisons among multiple groups were determined by one-way ANOVA. p-value < 0.05 was considered to be statistically significant.

5. Conclusions

In conclusion, our study confirms that the splicing factor PRPF6 mutation affects the morphological characteristic, polarity, daily phagocytosis and barrier function of RP-iRPE cells. Long-term dysregulation of RPE functions under such conditions can cause RPE degeneration and atrophy. Our findings are helpful for understanding PRPF6-related RPE cells, and this study may provide a basis for gene therapy and other therapies in these patients.

Author Contributions

Conceptualization, S.T., J.C. and Y.L.; methodology, Y.L., F.T., X.S., J.G. and S.M.; software, Y.L.; validation, Y.L., F.T. and X.S.; formal analysis, Y.L. and J.C.; investigation, Y.L. and X.S.; resources, S.T. and J.C.; data curation, Y.L., F.T., X.S., J.G., Z.C. and S.M.; writing—original draft preparation, J.C. and Y.L.; writing—review and editing, S.T., J.C., Y.L., Z.C. and H.F.C.; visualization, Y.L. and Z.C.; supervision, S.T., J.C. and Y.L.; project administration, S.T., J.C. and Y.L.; funding acquisition, S.T. and J.C. All authors have read and agreed to the published version of the manuscript.

Funding

This study was funded by the National Natural Science Foundation of China (NSFC-RGC, 32061160469, N_CUHK432/20), the Science and Technology Project of Guangdong Province (2021A0505110005) and the Science Research Grant of Aier Eye Institute (02-202105).

Institutional Review Board Statement

The study was conducted according to the guidelines of the Declaration of Helsinki, and approved by the Ethics Committee of Changsha Aier Eye Hospital (KYPJ005).

Informed Consent Statement

Informed consent was obtained from all subjects involved in the study.

Data Availability Statement

The data presented in this study are all contained within the main body of this article.

Acknowledgments

We thank Yalan Zhou (Affiliated Hospital of Jining Medical College), Yonglong Guo and Liying liang (Jinan University) for their technical advice. We also thank the authors of a book (Life science illustrations drawing) for providing substantial support in preparing the diagrams.

Conflicts of Interest

The authors declare no conflict of interest.

Appendix A

Figure A1. Fundus photographs of both eyes of the proband (A,B).
Ijms 23 09049 g0a1
Figure A2. Quantitative real-time PCR results of the expression levels of pluripotency-related genes (KLF4, OCT4, NANOG) in the NC-iRPE group and the RP-iRPE group. Mean ± SD (**** p < 0.0001; n = 3~6).
Ijms 23 09049 g0a2
Figure A3. SEM showed the ultrastructural change in apical microvilli in RP-iRPE cells. Scale bar 100 μm (A,B), 10 μm (C,D), 5 μm (E,F).
Ijms 23 09049 g0a3

Appendix B

Table A1. List of primary antibodies.
AntibodiesSpeciesSupplierCatalog Number
ZO-1mouseInvitrogen33-9100
PRPF6rabbitInvitrogenPA5-61428
MITFrabbitInvitrogenMA5-32554
CRALBPrabbitProteintech15356-1-AP
RPE65mouseAbcamab13826
TyrosinaserabbitAbcamab170905
EzrinrabbitGeneTexGTX111709
Na+/K+-ATPasemouseSanta Cruzsc-48345
Collagen IVmouseAbcamab86042
Table A2. The top 20 KEGG signaling pathways.
IDPathwayGene NumRatioQ Value
Downregulated
ko04512ECM-receptor interaction240.0384.90 × 10−8
ko05414Dilated cardiomyopathy (DCM)220.0354.40 × 10−6
ko04925Aldosterone synthesis and secretion220.0356.31 × 10−6
ko04270Vascular smooth muscle contraction260.0411.19 × 10−5
ko04540Gap junction200.0321.36 × 10−5
ko04510Focal adhesion340.0541.50 × 10−5
ko04713Circadian entrainment210.0331.85 × 10−5
ko04020Calcium signaling pathway330.0521.96 × 10−5
ko04926Relaxin signaling pathway250.0402.34 × 10−5
ko04921Oxytocin signaling pathway280.0442.34 × 10−5
Upregulated
ko04390Hippo signaling pathway200.0435.85 × 10−4
ko04115p53 signaling pathway120.0268.29 × 10−4
ko05210Colorectal cancer130.0281.31 × 10−3
ko05213Endometrial cancer100.0221.70 × 10−3
ko05205Proteoglycans in cancer230.0501.70 × 10−3
ko05225Hepatocellular carcinoma200.0431.75 × 10−3
ko04061Viral protein interaction with cytokine and cytokine receptor140.0301.85 × 10−3
ko04060Cytokine-cytokine receptor interaction290.0633.58 × 10−3
ko04014Ras signaling pathway240.0524.27 × 10−3
ko05134Legionellosis90.0204.67 × 10−3
Table A3. The top 15 GO biological process terms.
IDTermGene NumRatioQ Value
GO:0007155cell adhesion1830.27 5.70 × 10⁻²¹
GO:0007156homophilic cell adhesion via plasma membrane adhesion molecules580.35 3.99 × 10⁻¹²
GO:0030198extracellular matrix organization750.30 7.64 × 10⁻¹²
GO:0001525angiogenesis790.29 5.73 × 10⁻¹¹
GO:0045766positive regulation of angiogenesis510.34 2.41 × 10⁻¹⁰
GO:0007399nervous system development1300.23 4.43 × 10⁻¹⁰
GO:0007411axon guidance670.28 1.02 × 10⁻⁸
GO:0030335positive regulation of cell migration680.27 1.71 × 10⁻⁸
GO:0006811ion transport1420.21 2.33 × 10⁻⁸
GO:0031290retinal ganglion cell axon guidance130.65 1.88 × 10⁻⁷
GO:0007417central nervous system development460.29 4.51 × 10⁻⁷
GO:0008284positive regulation of cell proliferation1190.21 4.83 × 10⁻⁷
GO:0070374positive regulation of ERK1 and ERK2 cascade590.26 6.81 × 10⁻⁷
GO:0007275multicellular organism development2220.19 1.10 × 10⁻⁶
GO:0001501skeletal system development450.281.17 × 10−6

References

  1. Liu, W.; Liu, S.; Li, P.; Yao, K. Retinitis Pigmentosa: Progress in Molecular Pathology and Biotherapeutical Strategies. Int. J. Mol. Sci. 2022, 23, 4883. [Google Scholar] [CrossRef]
  2. Sun, X.; Sun, P.; Liu, L.; Jiang, P.; Li, Y. Ferulic acid attenuates microglia-mediated neuroinflammation in retinal degeneration. BMC Ophthalmol. 2021, 21, 13. [Google Scholar] [CrossRef] [PubMed]
  3. Zhang, X.; Girardot, P.E.; Sellers, J.T.; Li, Y.; Wang, J.; Chrenek, M.A.; Wu, W.; Skelton, H.; Nickerson, J.M.; Pardue, M.T.; et al. Wheel running exercise protects against retinal degeneration in the I307N rhodopsin mouse model of inducible autosomal dominant retinitis pigmentosa. Mol. Vis. 2019, 25, 462–476. [Google Scholar]
  4. Ballios, B.G.; Place, E.M.; Martinez-Velazquez, L.; Pierce, E.A.; Comander, J.I.; Huckfeldt, R.M. Beyond Sector Retinitis Pigmentosa: Expanding the Phenotype and Natural History of the Rhodopsin Gene Codon 106 Mutation (Gly-to-Arg) in Autosomal Dominant Retinitis Pigmentosa. Genes 2021, 12, 1853. [Google Scholar] [CrossRef]
  5. Matera, A.G.; Wang, Z. A day in the life of the spliceosome. Nat. Rev. Mol. Cell Biol. 2014, 15, 108–121. [Google Scholar] [CrossRef] [PubMed]
  6. Will, C.L.; Luhrmann, R. Spliceosome structure and function. Cold Spring Harb. Perspect. Biol. 2011, 3, a003707. [Google Scholar] [CrossRef]
  7. Griffin, C.; Saint-Jeannet, J.P. Spliceosomopathies: Diseases and mechanisms. Dev. Dyn. 2020, 249, 1038–1046. [Google Scholar] [CrossRef] [PubMed]
  8. Arzalluz-Luque, A.; Cabrera, J.L.; Skottman, H.; Benguria, A.; Bolinches-Amoros, A.; Cuenca, N.; Lupo, V.; Dopazo, A.; Tarazona, S.; Delas, B.; et al. Mutant PRPF8 Causes Widespread Splicing Changes in Spliceosome Components in Retinitis Pigmentosa Patient iPSC-Derived RPE Cells. Front. Neurosci. 2021, 15, 636969. [Google Scholar] [CrossRef]
  9. Ruzickova, S.; Stanek, D. Mutations in spliceosomal proteins and retina degeneration. RNA Biol. 2017, 14, 544–552. [Google Scholar] [CrossRef]
  10. Klimesova, K.; Vojackova, J.; Radivojevic, N.; Vandermoere, F.; Bertrand, E.; Verheggen, C.; Stanek, D. TSSC4 is a component of U5 snRNP that promotes tri-snRNP formation. Nat. Commun. 2021, 12, 3646. [Google Scholar] [CrossRef] [PubMed]
  11. Wood, K.A.; Eadsforth, M.A.; Newman, W.G.; O’Keefe, R.T. The Role of the U5 snRNP in Genetic Disorders and Cancer. Front. Genet. 2021, 12, 636620. [Google Scholar] [CrossRef]
  12. Adler, A.S.; McCleland, M.L.; Yee, S.; Yaylaoglu, M.; Hussain, S.; Cosino, E.; Quinones, G.; Modrusan, Z.; Seshagiri, S.; Torres, E.; et al. An integrative analysis of colon cancer identifies an essential function for PRPF6 in tumor growth. Genes. Dev. 2014, 28, 1068–1084. [Google Scholar] [CrossRef]
  13. Song, H.; Sun, N.; Lin, L.; Wei, S.; Zeng, K.; Liu, W.; Wang, C.; Zhong, X.; Wang, M.; Wang, S.; et al. Splicing factor PRPF6 upregulates oncogenic androgen receptor signaling pathway in hepatocellular carcinoma. Cancer Sci. 2020, 111, 3665–3678. [Google Scholar] [CrossRef]
  14. Liu, W.; Wang, C.; Wang, S.; Zeng, K.; Wei, S.; Sun, N.; Sun, G.; Wang, M.; Zou, R.; Liu, W.; et al. PRPF6 promotes androgen receptor/androgen receptor-variant 7 actions in castration-resistant prostate cancer cells. Int. J. Biol. Sci. 2021, 17, 188–203. [Google Scholar] [CrossRef]
  15. Wang, J.; Xiao, X.; Li, S.; Jiang, H.; Sun, W.; Wang, P.; Zhang, Q. Landscape of pathogenic variants in six pre-mRNA processing factor genes for retinitis pigmentosa based on large in-house data sets and database comparisons. Acta Ophthalmol. 2022. [Google Scholar] [CrossRef]
  16. Huang, X.F.; Huang, F.; Wu, K.C.; Wu, J.; Chen, J.; Pang, C.P.; Lu, F.; Qu, J.; Jin, Z.B. Genotype-phenotype correlation and mutation spectrum in a large cohort of patients with inherited retinal dystrophy revealed by next-generation sequencing. Genet. Med. 2015, 17, 271–278. [Google Scholar] [CrossRef]
  17. Tanackovic, G.; Ransijn, A.; Ayuso, C.; Harper, S.; Berson, E.L.; Rivolta, C. A missense mutation in PRPF6 causes impairment of pre-mRNA splicing and autosomal-dominant retinitis pigmentosa. Am. J. Hum. Genet. 2011, 88, 643–649. [Google Scholar] [CrossRef]
  18. O’Neill, A.C.; Uzbas, F.; Antognolli, G.; Merino, F.; Draganova, K.; Jack, A.; Zhang, S.; Pedini, G.; Schessner, J.P.; Cramer, K.; et al. Spatial centrosome proteome of human neural cells uncovers disease-relevant heterogeneity. Science 2022, 376, eabf9088. [Google Scholar] [CrossRef]
  19. Fields, M.A.; Del Priore, L.V.; Adelman, R.A.; Rizzolo, L.J. Interactions of the choroid, Bruch’s membrane, retinal pigment epithelium, and neurosensory retina collaborate to form the outer blood-retinal-barrier. Prog. Retin. Eye Res. 2020, 76, 100803. [Google Scholar] [CrossRef]
  20. Lakkaraju, A.; Umapathy, A.; Tan, L.X.; Daniele, L.; Philp, N.J.; Boesze-Battaglia, K.; Williams, D.S. The cell biology of the retinal pigment epithelium. Prog. Retin. Eye Res. 2020, 78, 100846. [Google Scholar] [CrossRef]
  21. Ao, J.; Wood, J.P.; Chidlow, G.; Gillies, M.C.; Casson, R.J. Retinal pigment epithelium in the pathogenesis of age-related macular degeneration and photobiomodulation as a potential therapy? Clin. Exp. Ophthalmol. 2018, 46, 670–686. [Google Scholar] [CrossRef]
  22. Chakrabarty, K.; Shetty, R.; Ghosh, A. Corneal cell therapy: With iPSCs, it is no more a far-sight. Stem Cell Res. Ther. 2018, 9, 287. [Google Scholar] [CrossRef]
  23. Liu, S.; Xie, B.; Song, X.; Zheng, D.; He, L.; Li, G.; Gao, G.; Peng, F.; Yu, M.; Ge, J.; et al. Self-Formation of RPE Spheroids Facilitates Enrichment and Expansion of hiPSC-Derived RPE Generated on Retinal Organoid Induction Platform. Investig. Ophthalmol. Vis. Sci. 2018, 59, 5659–5669. [Google Scholar] [CrossRef]
  24. Reichman, S.; Slembrouck, A.; Gagliardi, G.; Chaffiol, A.; Terray, A.; Nanteau, C.; Potey, A.; Belle, M.; Rabesandratana, O.; Duebel, J.; et al. Generation of Storable Retinal Organoids and Retinal Pigmented Epithelium from Adherent Human iPS Cells in Xeno-Free and Feeder-Free Conditions. Stem Cells 2017, 35, 1176–1188. [Google Scholar] [CrossRef]
  25. Shrestha, R.; Wen, Y.T.; Tsai, R.K. Effective Differentiation and Biological Characterization of Retinal Pigment Epithelium Derived from Human Induced Pluripotent Stem Cells. Curr. Eye Res. 2020, 45, 1155–1167. [Google Scholar] [CrossRef]
  26. Regent, F.; Morizur, L.; Lesueur, L.; Habeler, W.; Plancheron, A.; Ben M’Barek, K.; Monville, C. Automation of human pluripotent stem cell differentiation toward retinal pigment epithelial cells for large-scale productions. Sci. Rep. 2019, 9, 10646. [Google Scholar] [CrossRef]
  27. Yang, C.; Georgiou, M.; Atkinson, R.; Collin, J.; Al-Aama, J.; Nagaraja-Grellscheid, S.; Johnson, C.; Ali, R.; Armstrong, L.; Mozaffari-Jovin, S.; et al. Pre-mRNA Processing Factors and Retinitis Pigmentosa: RNA Splicing and Beyond. Front. Cell Dev. Biol. 2021, 9, 700276. [Google Scholar] [CrossRef]
  28. Zhou, Y.; Jing, Y.; Mao, S.; Liu, J.; Cui, Z.; Wang, Y.; Chen, J.; Chan, H.f.; Tang, S.; Chen, J. Establishment of induced pluripotent stem cell line CSUASOi004-A by reprogramming peripheral blood mononuclear cells of a PRPF6-related dominant retinitis pigmentosa patient. Stem Cell Res. 2020, 45, 101793. [Google Scholar] [CrossRef]
  29. Reichman, S.; Terray, A.; Slembrouck, A.; Nanteau, C.; Orieux, G.; Habeler, W.; Nandrot, E.F.; Sahel, J.A.; Monville, C.; Goureau, O. From confluent human iPS cells to self-forming neural retina and retinal pigmented epithelium. Proc. Natl. Acad. Sci. USA 2014, 111, 8518–8523. [Google Scholar] [CrossRef]
  30. Marmorstein, A.D. The polarity of the retinal pigment epithelium. Traffic 2001, 2, 867–872. [Google Scholar] [CrossRef]
  31. Kim, Y.J.; Kim, Y.N.; Yoon, Y.H.; Seo, E.J.; Seo, G.H.; Keum, C.; Lee, B.H.; Lee, J.Y. Diverse Genetic Landscape of Suspected Retinitis Pigmentosa in a Large Korean Cohort. Genes 2021, 12, 675. [Google Scholar] [CrossRef]
  32. Farkas, M.H.; Lew, D.S.; Sousa, M.E.; Bujakowska, K.; Chatagnon, J.; Bhattacharya, S.S.; Pierce, E.A.; Nandrot, E.F. Mutations in pre-mRNA processing factors 3, 8, and 31 cause dysfunction of the retinal pigment epithelium. Am. J. Pathol. 2014, 184, 2641–2652. [Google Scholar] [CrossRef]
  33. Valdes-Sanchez, L.; Calado, S.M.; de la Cerda, B.; Aramburu, A.; Garcia-Delgado, A.B.; Massalini, S.; Montero-Sanchez, A.; Bhatia, V.; Rodriguez-Bocanegra, E.; Diez-Lloret, A.; et al. Retinal pigment epithelium degeneration caused by aggregation of PRPF31 and the role of HSP70 family of proteins. Mol. Med. 2019, 26, 1. [Google Scholar] [CrossRef]
  34. Penney, J.; Ralvenius, W.T.; Tsai, L.H. Modeling Alzheimer’s disease with iPSC-derived brain cells. Mol. Psychiatry 2020, 25, 148–167. [Google Scholar] [CrossRef]
  35. O’Hara-Wright, M.; Mobini, S.; Gonzalez-Cordero, A. Bioelectric Potential in Next-Generation Organoids: Electrical Stimulation to Enhance 3D Structures of the Central Nervous System. Front. Cell Dev. Biol. 2022, 10, 901652. [Google Scholar] [CrossRef]
  36. Graziotto, J.J.; Farkas, M.H.; Bujakowska, K.; Deramaudt, B.M.; Zhang, Q.; Nandrot, E.F.; Inglehearn, C.F.; Bhattacharya, S.S.; Pierce, E.A. Three gene-targeted mouse models of RNA splicing factor RP show late-onset RPE and retinal degeneration. Investig. Ophthalmol. Vis. Sci. 2011, 52, 190–198. [Google Scholar] [CrossRef]
  37. Bujakowska, K.; Maubaret, C.; Chakarova, C.F.; Tanimoto, N.; Beck, S.C.; Fahl, E.; Humphries, M.M.; Kenna, P.F.; Makarov, E.; Makarova, O.; et al. Study of gene-targeted mouse models of splicing factor gene Prpf31 implicated in human autosomal dominant retinitis pigmentosa (RP). Investig. Ophthalmol. Vis. Sci. 2009, 50, 5927–5933. [Google Scholar] [CrossRef]
  38. Buskin, A.; Zhu, L.; Chichagova, V.; Basu, B.; Mozaffari-Jovin, S.; Dolan, D.; Droop, A.; Collin, J.; Bronstein, R.; Mehrotra, S.; et al. Disrupted alternative splicing for genes implicated in splicing and ciliogenesis causes PRPF31 retinitis pigmentosa. Nat. Commun. 2018, 9, 4234. [Google Scholar] [CrossRef]
  39. Georgiou, M.; Yang, C.; Atkinson, R.; Pan, K.T.; Buskin, A.; Molina, M.M.; Collin, J.; Al-Aama, J.; Goertler, F.; Ludwig, S.E.J.; et al. Activation of autophagy reverses progressive and deleterious protein aggregation in PRPF31 patient-induced pluripotent stem cell-derived retinal pigment epithelium cells. Clin. Transl. Med. 2022, 12, e759. [Google Scholar] [CrossRef]
  40. Foltz, L.P.; Howden, S.E.; Thomson, J.A.; Clegg, D.O. Functional Assessment of Patient-Derived Retinal Pigment Epithelial Cells Edited by CRISPR/Cas9. Int. J. Mol. Sci. 2018, 19, 4127. [Google Scholar] [CrossRef]
  41. Booij, J.C.; Baas, D.C.; Beisekeeva, J.; Gorgels, T.G.; Bergen, A.A. The dynamic nature of Bruch’s membrane. Prog. Retin. Eye Res. 2010, 29, 1–18. [Google Scholar] [CrossRef]
  42. Zhu, X.Y.; Chen, Y.H.; Zhang, T.; Liu, S.J.; Bai, X.Y.; Huang, X.Y.; Jiang, M.; Sun, X.D. Improvement of human embryonic stem cell-derived retinal pigment epithelium cell adhesion, maturation, and function through coating with truncated recombinant human vitronectin. Int. J. Ophthalmol. 2021, 14, 1160–1167. [Google Scholar] [CrossRef]
  43. da Cruz, L.; Fynes, K.; Georgiadis, O.; Kerby, J.; Luo, Y.H.; Ahmado, A.; Vernon, A.; Daniels, J.T.; Nommiste, B.; Hasan, S.M.; et al. Phase 1 clinical study of an embryonic stem cell-derived retinal pigment epithelium patch in age-related macular degeneration. Nat. Biotechnol. 2018, 36, 328–337. [Google Scholar] [CrossRef]
  44. Scimone, C.; Bramanti, P.; Ruggeri, A.; Katsarou, Z.; Donato, L.; Sidoti, A.; D’Angelo, R. Detection of Novel Mutation in Ccm3 Causes Familial Cerebral Cavernous Malformations. J. Mol. Neurosci. 2015, 57, 400–403. [Google Scholar] [CrossRef]
  45. Scimone, C.; Bramanti, P.; Ruggeri, A.; Donato, L.; Alafaci, C.; Crisafulli, C.; Mucciardi, M.; Rinaldi, C.; Sidoti, A.; D’Angelo, R. CCM3/SERPINI1 bidirectional promoter variants in patients with cerebral cavernous malformations: A molecular and functional study. BMC Med. Genet. 2016, 17, 74. [Google Scholar] [CrossRef]
  46. Scimone, C.; Donato, L.; Alibrandi, S.; Esposito, T.; Alafaci, C.; D’Angelo, R.; Sidoti, A. Transcriptome analysis provides new molecular signatures in sporadic Cerebral Cavernous Malformation endothelial cells. Biochim. Biophys. Acta Mol. Bas. Dis. 2020, 1866, 165956. [Google Scholar] [CrossRef]
  47. Wimmers, S.; Karl, M.O.; Strauss, O. Ion channels in the RPE. Prog. Retin. Eye Res. 2007, 26, 263–301. [Google Scholar] [CrossRef]
  48. Viheriala, T.; Sorvari, J.; Ihalainen, T.O.; Moro, A.; Gronroos, P.; Schlie-Wolter, S.; Chichkov, B.; Skottman, H.; Nymark, S.; Ilmarinen, T. Culture surface protein coatings affect the barrier properties and calcium signalling of hESC-RPE. Sci. Rep. 2021, 11, 933. [Google Scholar] [CrossRef]
  49. El Ghaleb, Y.; Schneeberger, P.E.; Fernandez-Quintero, M.L.; Geisler, S.M.; Pelizzari, S.; Polstra, A.M.; van Hagen, J.M.; Denecke, J.; Campiglio, M.; Liedl, K.R.; et al. CACNA1I gain-of-function mutations differentially affect channel gating and cause neurodevelopmental disorders. Brain 2021, 144, 2092–2106. [Google Scholar] [CrossRef]
  50. Zech, M.; Bardakjian, T.M.; Stoklosa, M.; Ploski, R.; Jech, R.; Gonzalez-Alegre, P.; Winkelmann, J. A Neurodevelopmental Disorder With Dystonia and Chorea Resulting From Clustering CAMK4 Variants. Mov. Disord. 2021, 36, 520–521. [Google Scholar] [CrossRef]
  51. Rizzolo, L.J. Development and Role of Tight Junctions in the Retinal Pigment Epithelium. Int. Rev. Cytol. 2007, 258, 195–234. [Google Scholar]
  52. Ovando-Roche, P.; Georgiadis, A.; Smith, A.J.; Pearson, R.A.; Ali, R.R. Harnessing the Potential of Human Pluripotent Stem Cells and Gene Editing for the Treatment of Retinal Degeneration. Curr. Stem Cell Rep. 2017, 3, 112–123. [Google Scholar] [CrossRef]
  53. Achberger, K.; Probst, C.; Haderspeck, J.; Bolz, S.; Rogal, J.; Chuchuy, J.; Nikolova, M.; Cora, V.; Antkowiak, L.; Haq, W.; et al. Merging organoid and organ-on-a-chip technology to generate complex multi-layer tissue models in a human retina-on-a-chip platform. eLife 2019, 8, e46188. [Google Scholar] [CrossRef] [PubMed]
  54. Abdayem, R.; Callejon, S.; Portes, P.; Kirilov, P.; Demarne, F.; Pirot, F.; Jannin, V.; Haftek, M. Modulation of transepithelial electric resistance (TEER) in reconstructed human epidermis by excipients known to permeate intestinal tight junctions. Exp. Dermatol. 2015, 24, 686–691. [Google Scholar] [CrossRef] [PubMed]
  55. Zhu, D.; Xie, M.; Gademann, F.; Cao, J.; Wang, P.; Guo, Y.; Zhang, L.; Su, T.; Zhang, J.; Chen, J. Protective effects of human iPS-derived retinal pigmented epithelial cells on retinal degenerative disease. Stem Cell Res. Ther. 2020, 11, 98. [Google Scholar] [CrossRef] [PubMed]
  56. Gu, J.; Wang, Y.; Cui, Z.; Li, H.; Li, S.; Yang, X.; Yan, X.; Ding, C.; Tang, S.; Chen, J. The Construction of Retinal Pigment Epithelium Sheets with Enhanced Characteristics and Cilium Assembly Using iPS Conditioned Medium and Small Incision Lenticule Extraction Derived Lenticules. Acta Biomater. 2019, 92, 115–131. [Google Scholar] [CrossRef]
  57. Trudeau, K.; Roy, S.; Guo, W.; Hernandez, C.; Villarroel, M.; Simo, R.; Roy, S. Fenofibric acid reduces fibronectin and collagen type IV overexpression in human retinal pigment epithelial cells grown in conditions mimicking the diabetic milieu: Functional implications in retinal permeability. Investig. Ophthalmol. Vis. Sci. 2011, 52, 6348–6354. [Google Scholar] [CrossRef] [PubMed]
  58. Parinot, C.; Rieu, Q.; Chatagnon, J.; Finnemann, S.C.; Nandrot, E.F. Large-scale purification of porcine or bovine photoreceptor outer segments for phagocytosis assays on retinal pigment epithelial cells. J. Vis. Exp. 2014, 94, e52100. [Google Scholar] [CrossRef] [PubMed]
  59. Mazzoni, F.; Mao, Y.; Finnemann, S.C. Advanced Analysis of Photoreceptor Outer Segment Phagocytosis by RPE Cells in Culture. Methods Mol. Biol. 2019, 1834, 95–108. [Google Scholar] [PubMed]
  60. Li, R.; Li, Y.; Kristiansen, K.; Wang, J. SOAP: Short oligonucleotide alignment program. Bioinformatics 2008, 24, 713–714. [Google Scholar] [CrossRef]
  61. Kim, D.; Langmead, B.; Salzberg, S.L. HISAT: A fast spliced aligner with low memory requirements. Nat. Methods 2015, 12, 357–360. [Google Scholar] [CrossRef]
  62. Langmead, B.; Salzberg, S.L. Fast gapped-read alignment with Bowtie 2. Nat. Methods 2012, 9, 357–359. [Google Scholar] [CrossRef] [PubMed]
  63. Love, M.I.; Huber, W.; Anders, S. Moderated estimation of fold change and dispersion for RNA-seq data with DESeq2. Genome Biol. 2014, 15, 550. [Google Scholar] [CrossRef]
Figure 1. Retinal pigment epithelial (RPE) cells modeling retinitis pigmentosa (RP) from induced pluripotent stem cells (iPSCs) with PRPF6 mutation. (A) Schematic diagram of differentiation procedure from normal and patient iPSCs into RPE cells (NC-iRPE; RP-iRPE). (B) Morphological observation of RPE cells in both groups. Scale bar 50 μm. (C) Immunofluorescence staining of tight junction marker ZO-1. Scale bar 20 μm. (D,E) Western blotting analysis of PRPF6 expression. GAPDH was set as the loading control. Mean ± SD (** p < 0.01; n = 3~6).
Ijms 23 09049 g001
Figure 2. Characterization of RPE-specific gene and protein expression. (A) Immunofluorescence staining of MITF, CRALBP, RPE65 and tyrosinase in the NC-iRPE and RP-iRPE groups. Scale bar 20 μm. (B) Quantitative real-time polymerase chain reaction (PCR) results of mRNA expression for RPE65, TYR and CRALBP. (C,D) Western blotting analysis of RPE65, tyrosinase and CRALBP expression in both groups. GAPDH and β-Actin were set as the loading control, respectively. Mean ± SD (* p < 0.05; ** p < 0.01; n = 3~6).
Ijms 23 09049 g002
Figure 3. The change in polarity in RP-iRPE cells. (A) Immunofluorescence staining of the apical markers Na+/K+-ATPase and EZRIN. (B) Representative confocal z-stack micrographs showed apical Na+/K+-ATPase and EZRIN and basal collagen IV distribution in the NC-iRPE group and the RP-iRPE group. (C) A schematic of RPE cells seeded in a 24-transwell insert in both groups. Enzyme-linked immunosorbent assay (ELISA) assay for the apical PEDF (D) and basal VEGF (E) secretion levels, respectively. Mean ± SD (* p < 0.05; ** p < 0.01; n = 3~6).
Ijms 23 09049 g003
Figure 4. Aberrant barrier function in RP-iRPE cells. (A) Measurements of transepithelial electrical resistance (TEER) value showed a significant difference between the NC-iRPE group and the RP-iRPE group. (B) Permeability assay of the apical-to-basolateral movements at 30 min, 60 min, 90 min and 120 min after the addition of fluorescein isothiocyanate (FITC) dextran in both groups. (C,D) The phagocytosis assay shows the internalization of FITC-labeled photoreceptor outer segments (POS) (arrows) and reduced POS phagocytosis in RP-iRPE cells. Scale bar 20 μm. Mean ± SD (** p < 0.01; *** p < 0.001; **** p < 0.0001; n = 3~6).
Ijms 23 09049 g004
Figure 5. Preliminary bioinformatic analyses results of the NC-iRPE group and the RP-iRPE group. (A) Principal component analysis showed significant differences between the two groups of samples. (B) Pearson’s correlation heatmap presented high correlations within each group of samples. (C) The volcano plot showed the number of differentially expressed genes (DEGs) based on fold change > 2 and p-value < 0.05. There were 1460 downregulated genes and 1226 upregulated genes.
Ijms 23 09049 g005
Figure 6. Function enrichment analysis of DEGs. (A) The top 20 significantly enriched signaling pathways in the RP-iRPE group from the Kyoto Encyclopedia of Genes and Genomes (KEGG) enrichment analysis were selected. (B) The top 15 Gene Ontology (GO) biological process terms with the largest differences between the NC-iRPE group and the RP-iRPE group.
Ijms 23 09049 g006
Figure 7. Analysis of three major signaling pathways. (AC) The heatmaps showed the DEGs of ECM–receptor interaction, calcium signaling pathway and gap junction. (DF) Quantitative real-time PCR results of the expressions for LAMA1, VTN, CACNA1I, CAMK4, ADY2 and DRD2. (G,H) Immunofluorescence staining of collagen IV expression in the NC-iRPE and RP-iRPE groups. Scale bar 20 μm. Mean ± SD (* p < 0.05; ** p < 0.01; *** p < 0.001; **** p < 0.0001; n = 3).
Ijms 23 09049 g007
Publisher’s Note: MDPI stays neutral with regard to jurisdictional claims in published maps and institutional affiliations.

