
N-Octyl Caffeamide, a Caffeic Acid Amide Derivative, Prevents Progression of Diabetes and Hepatic Steatosis in High-Fat Diet Induced Obese Mice

 ,
,  and
and 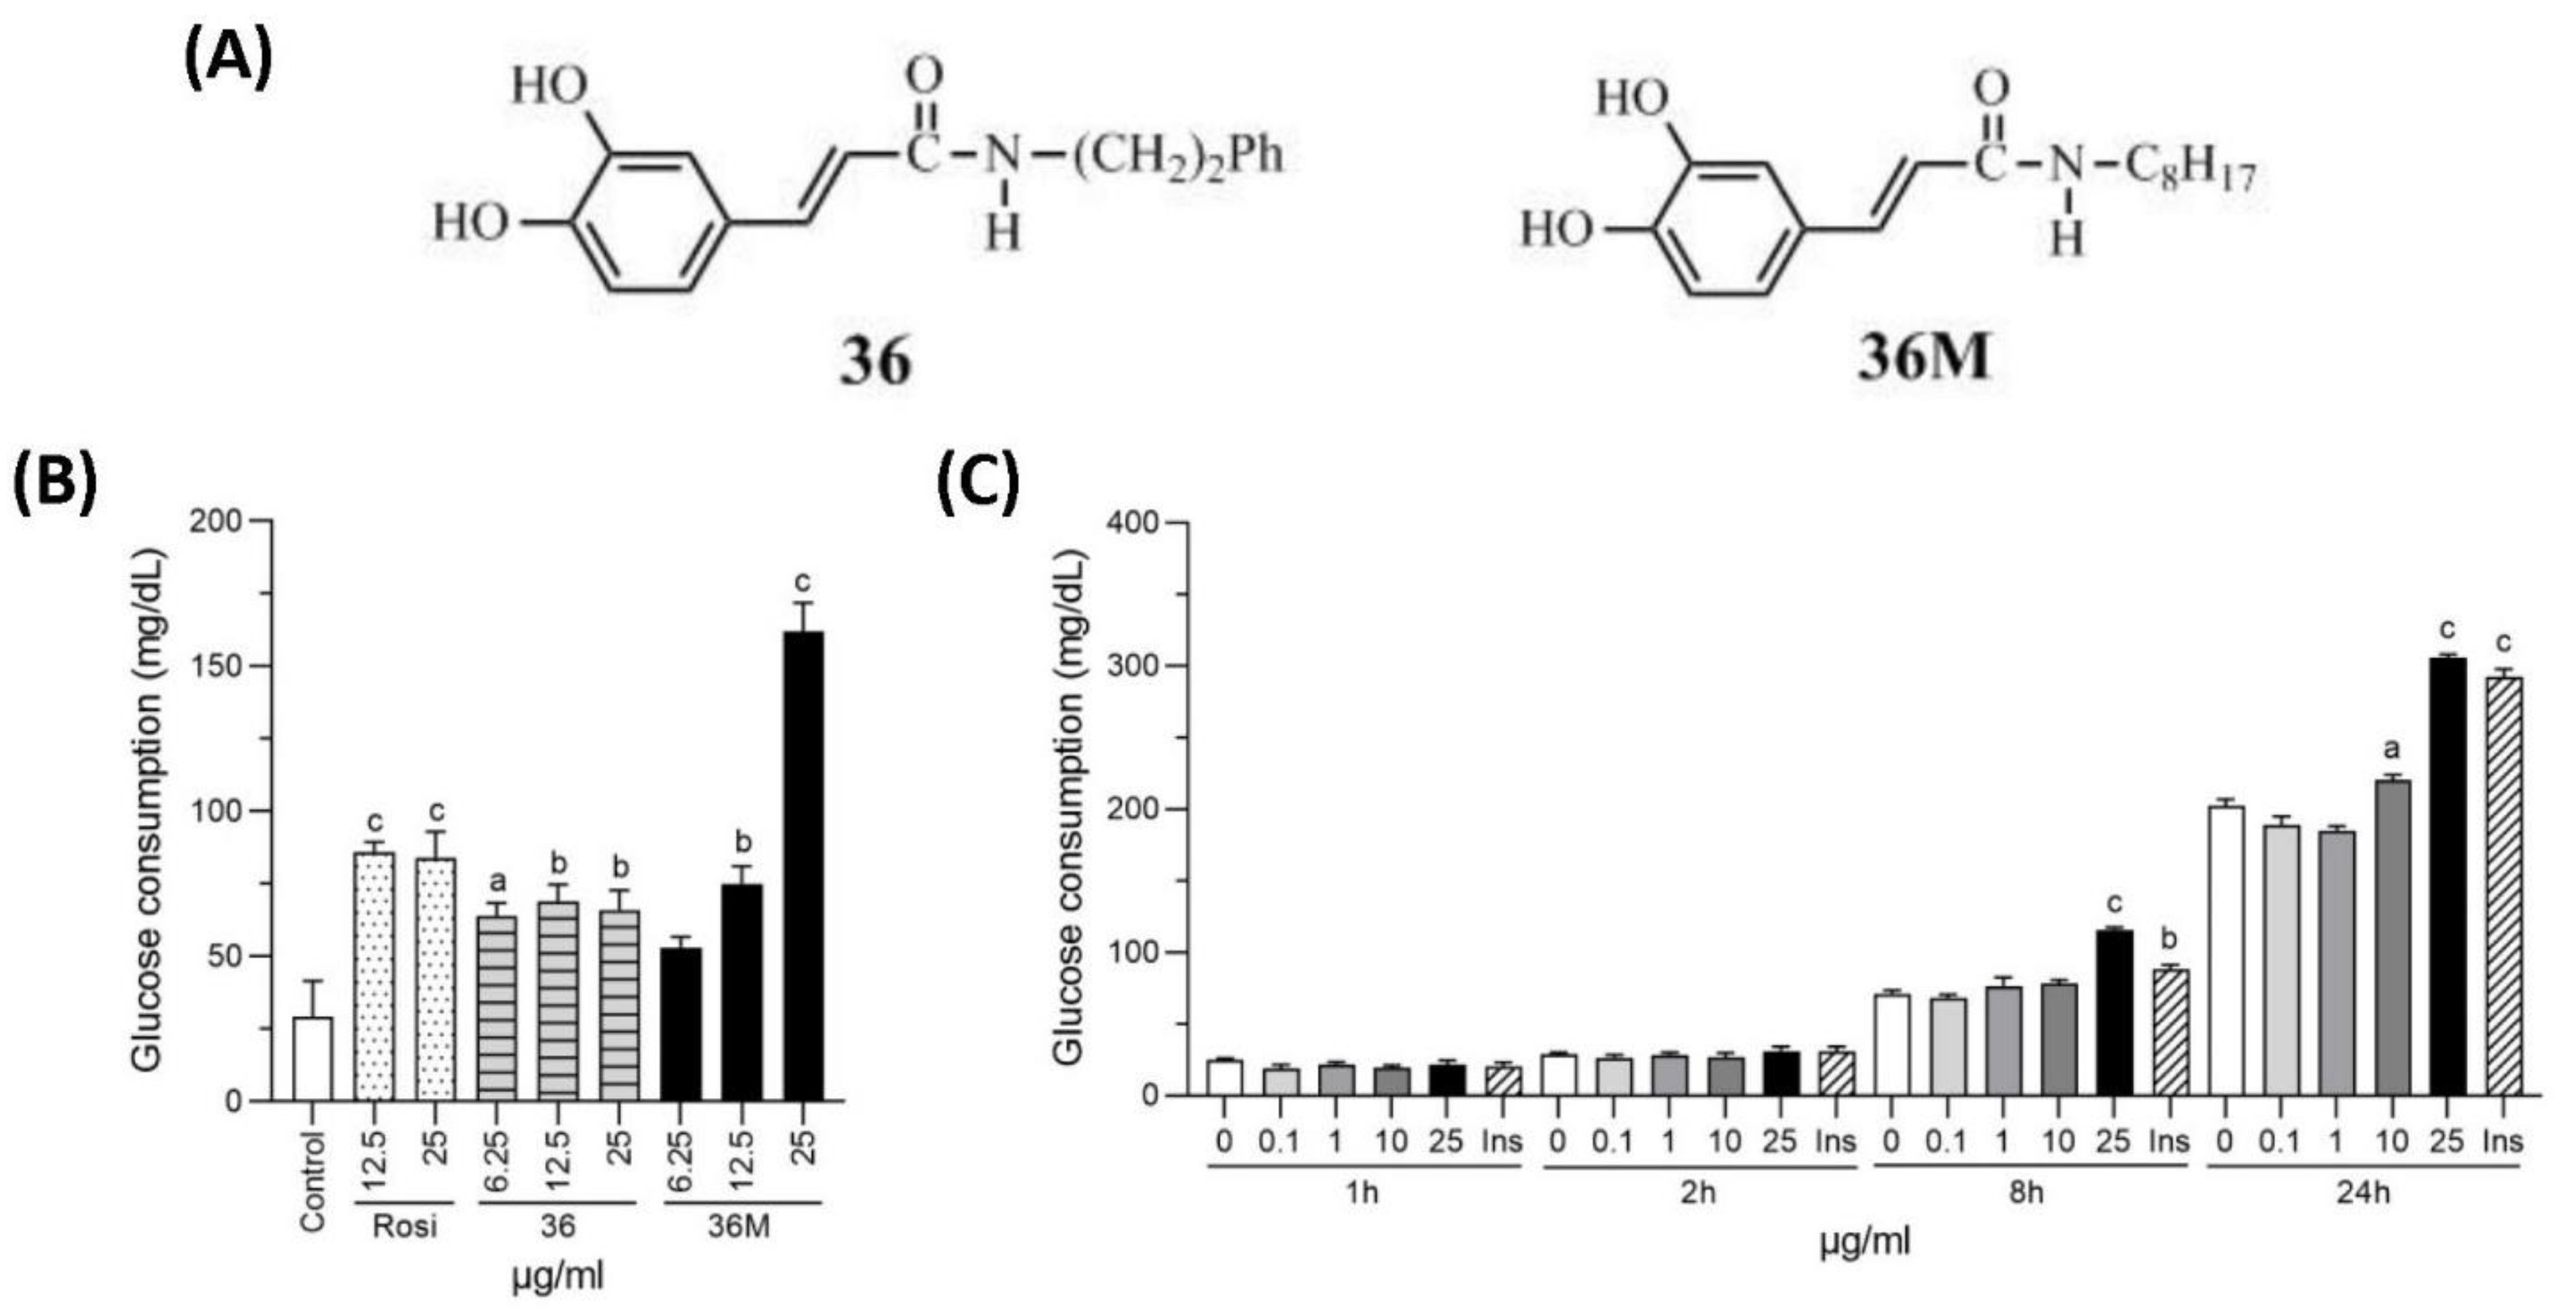
Abstract
:1. Introduction
2. Results
2.1. N-Octyl Caffeamide (36M) Increases Glucose Consumption in 3T3-L1 Adipocytes and C2C12 Myotubes
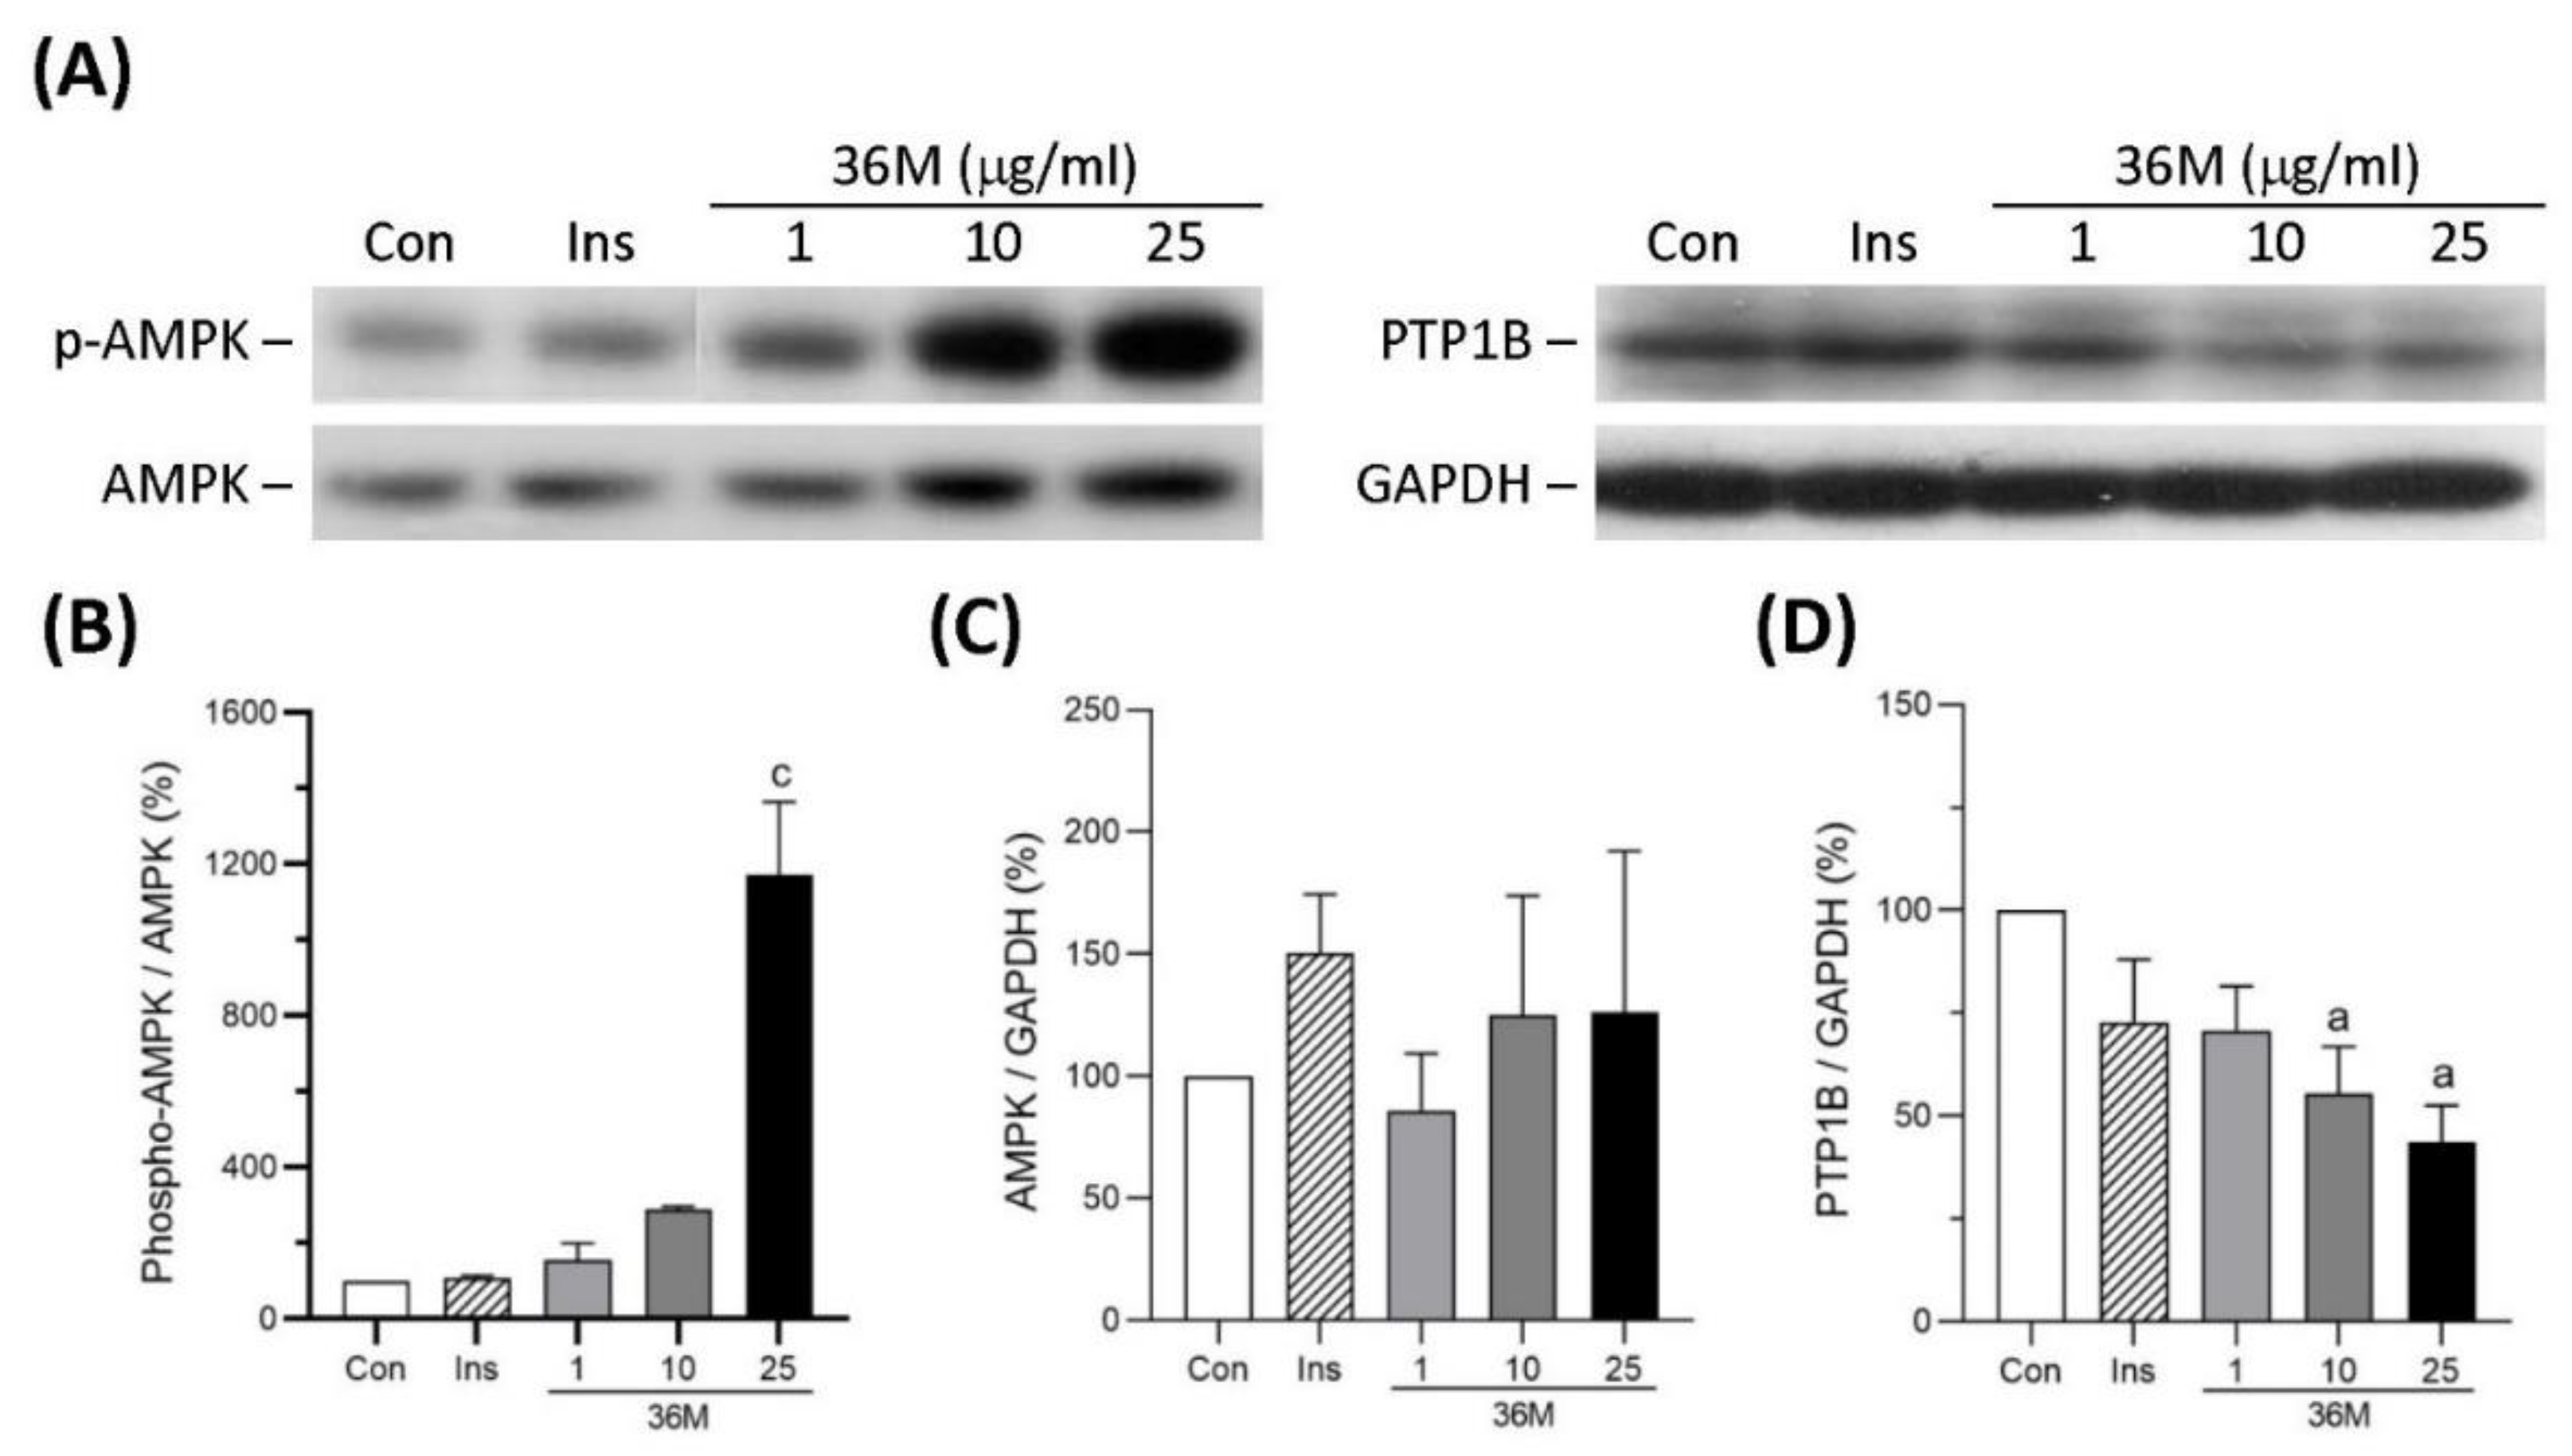
2.2. 36M Is an AMPK Activator and a PTP1B Inhibitor
2.3. 36M Prevents Progression of Diabetes in HF-Induced Obese Mice
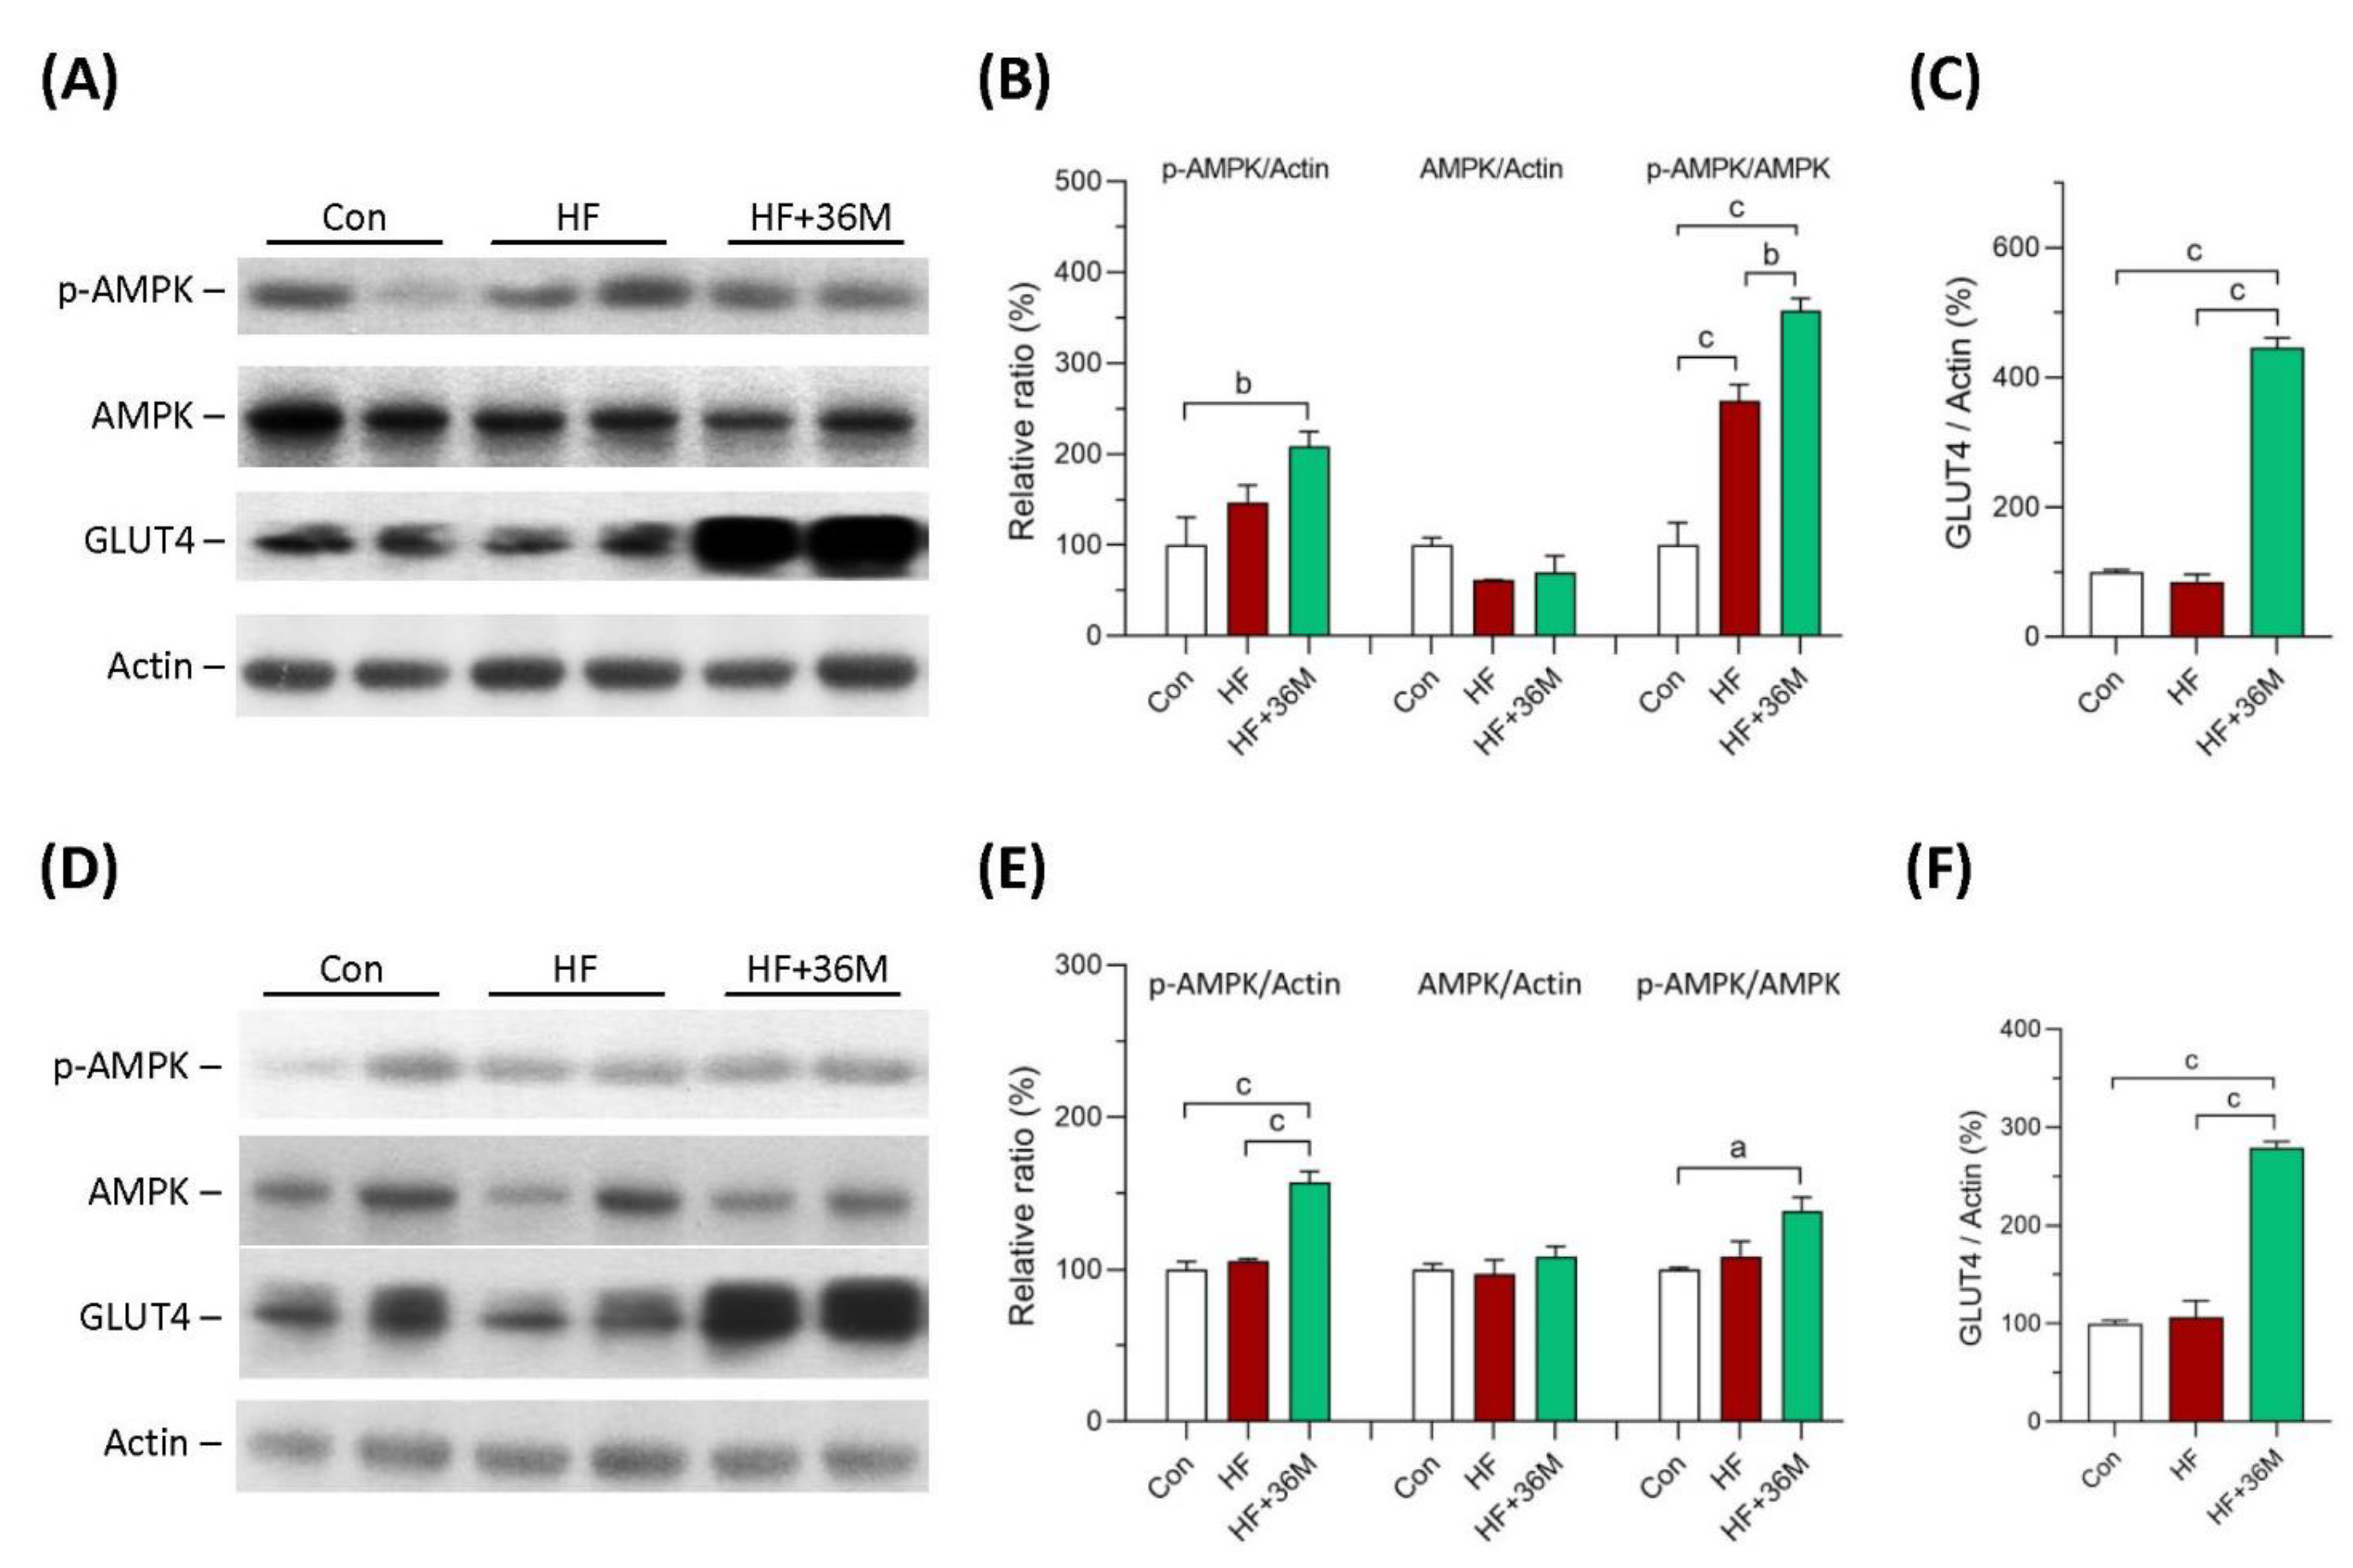
2.4. 36M Increases AMPK Activation and GLUT4 Expression in Skeletal Muscle of HF Fed Mice
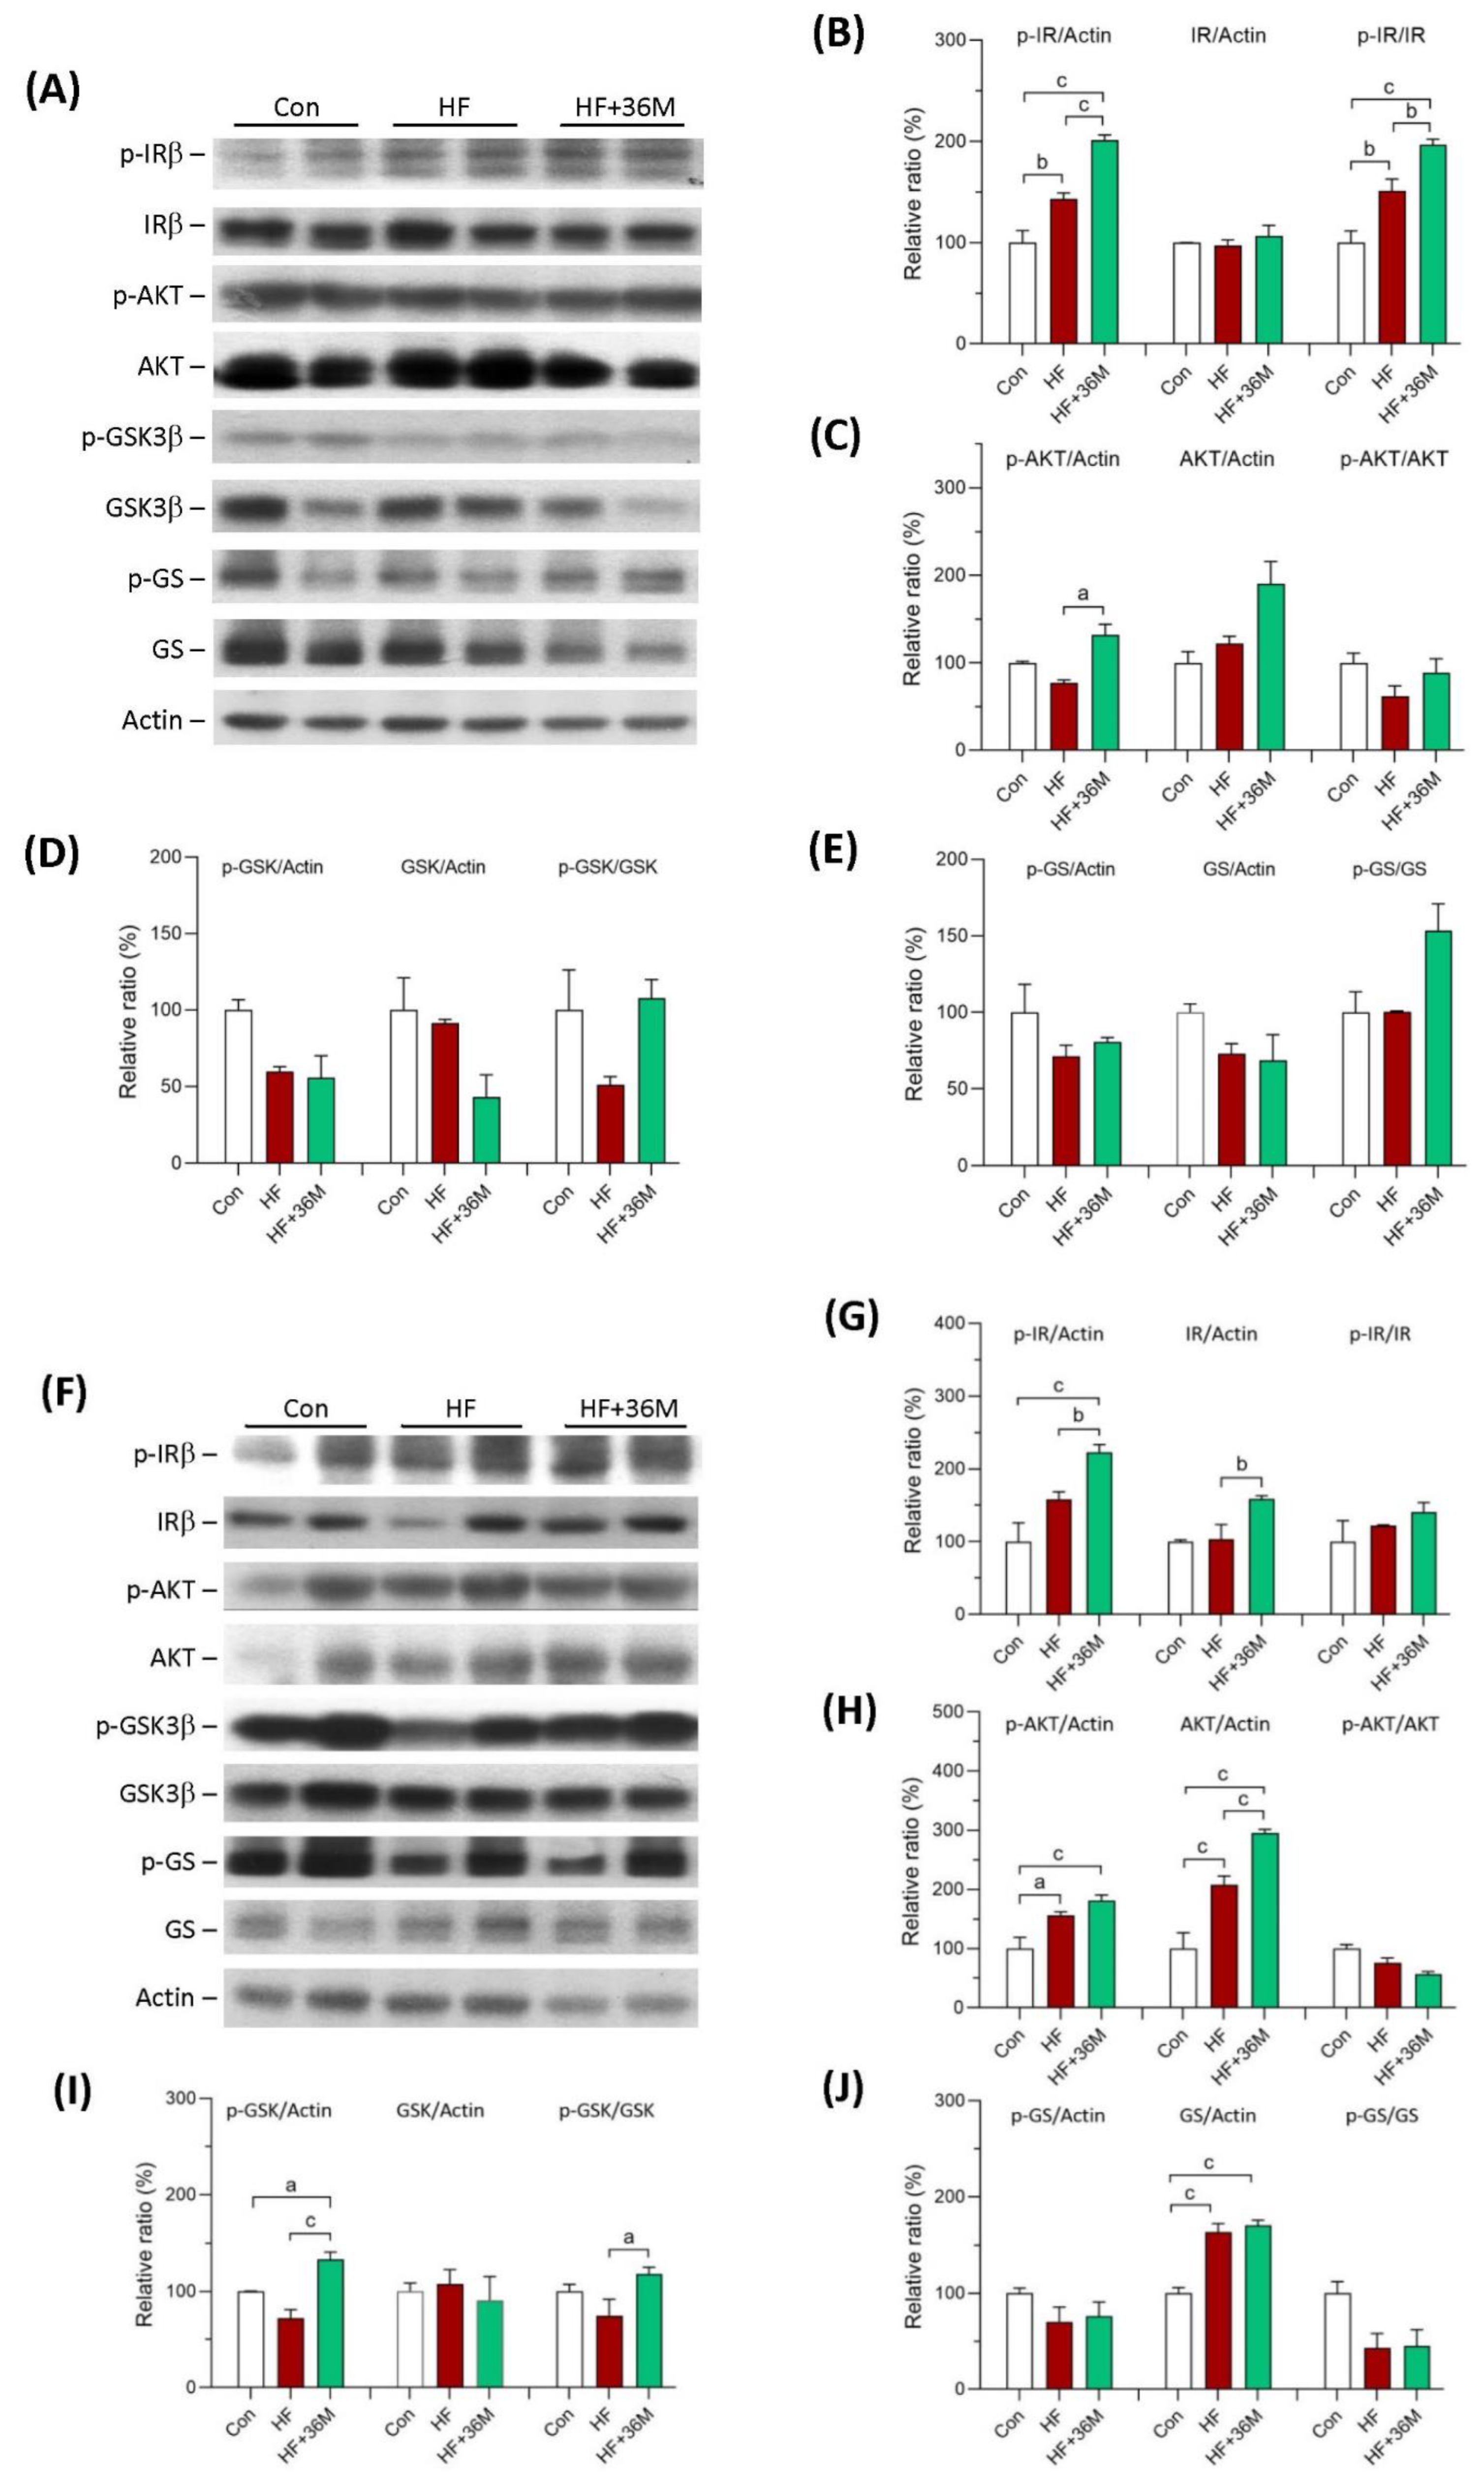
2.5. 36M Preserves Insulin Signaling in Skeletal Muscle of HF-Fed Mice
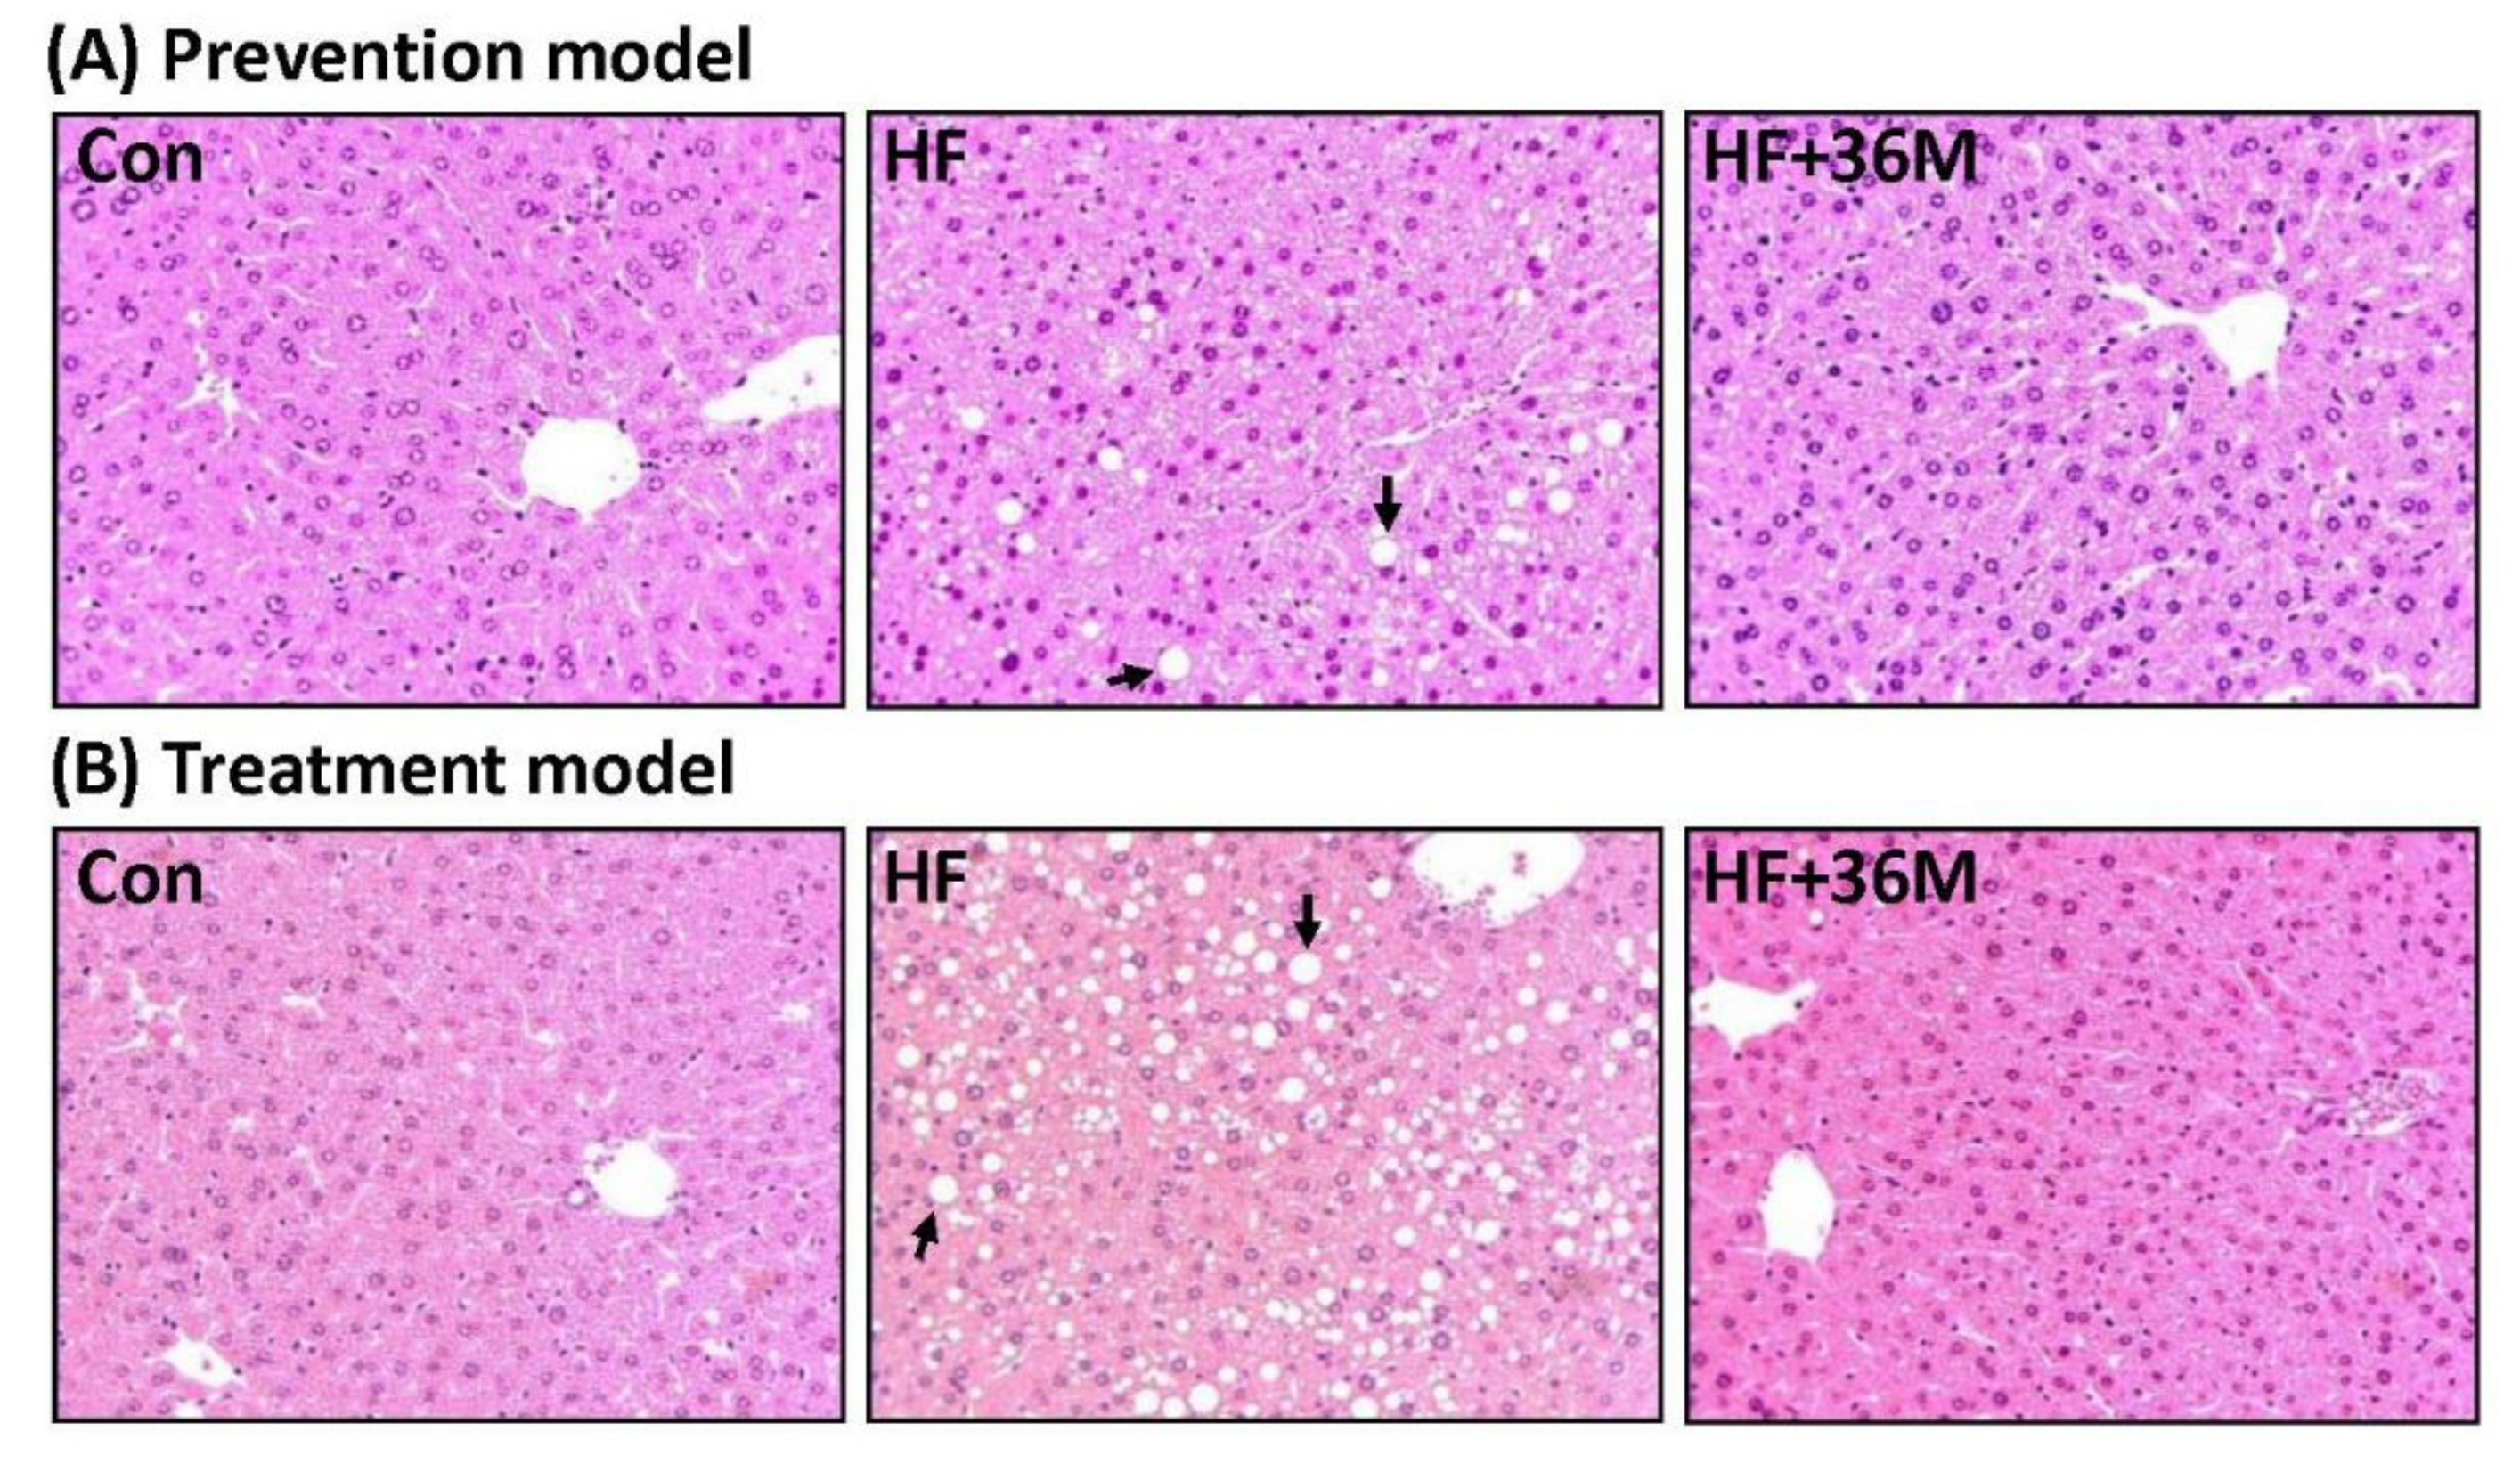
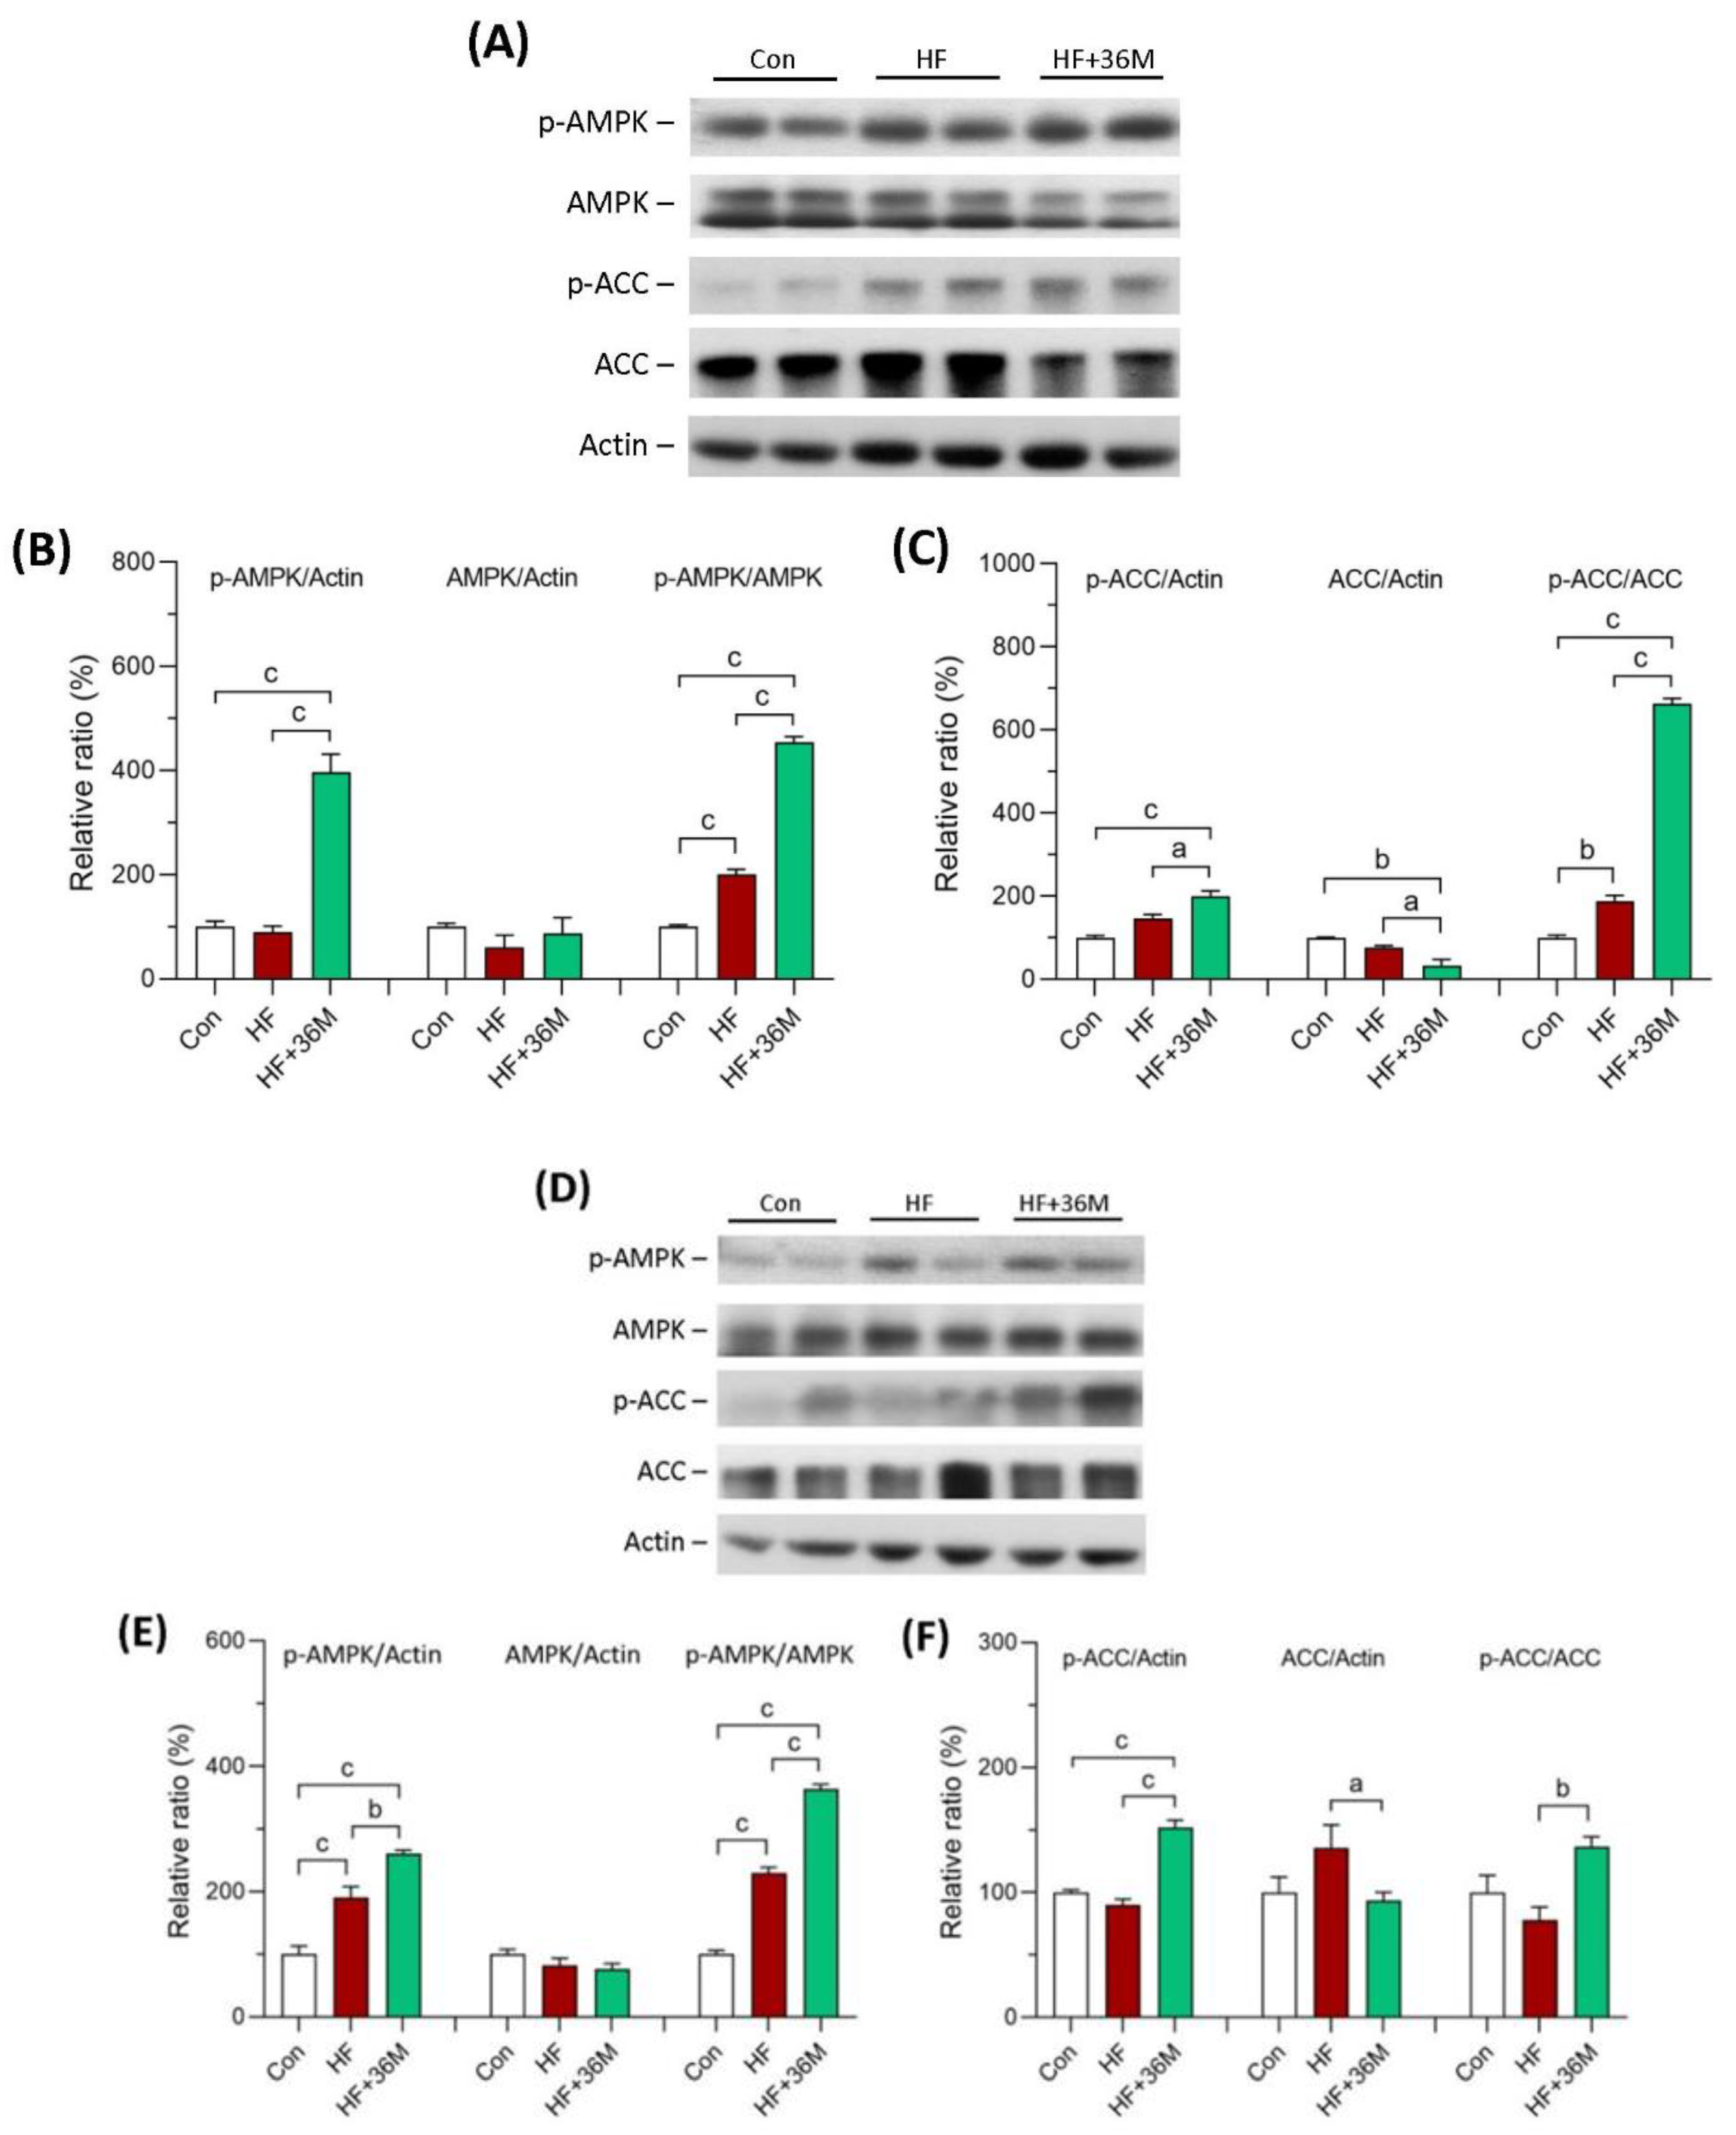
2.6. 36M Prevents Lipid Droplet Accumulation and Activates AMPK in Liver of HF-Fed Mice
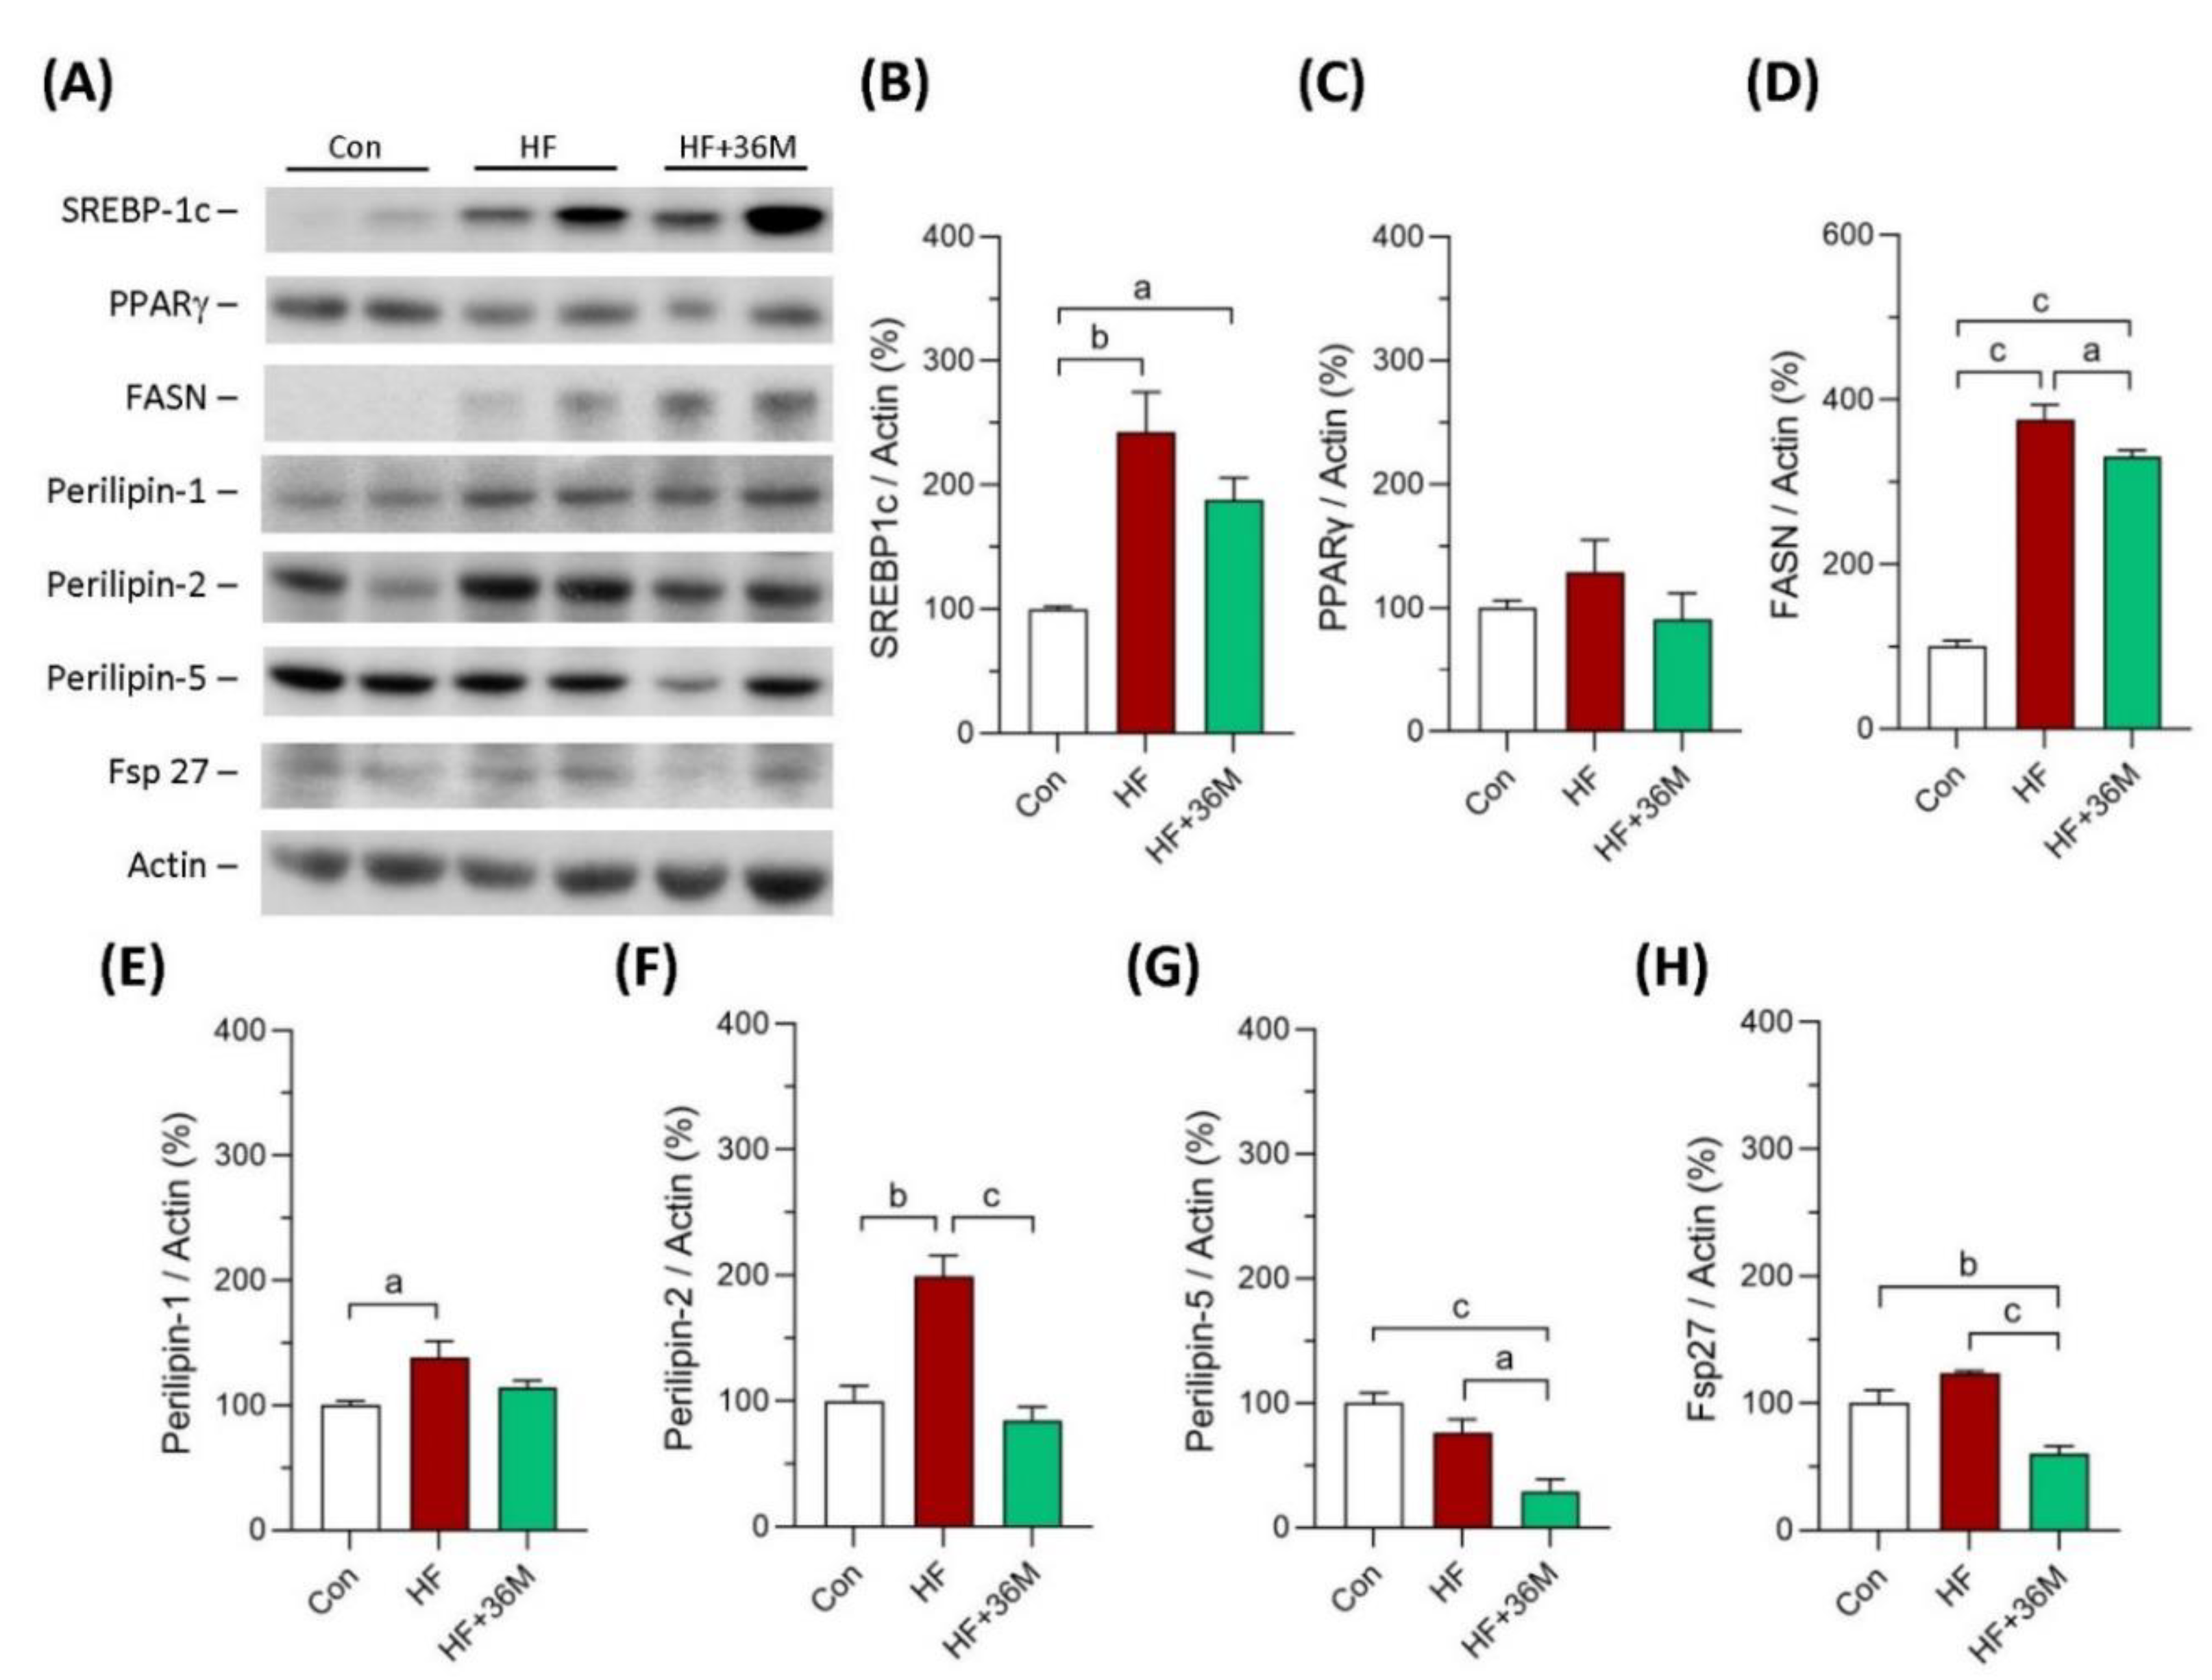
2.7. 36M Decreases Fatty Acid Synthase and Lipid Droplet Proteins in Liver of HF-Fed Mice
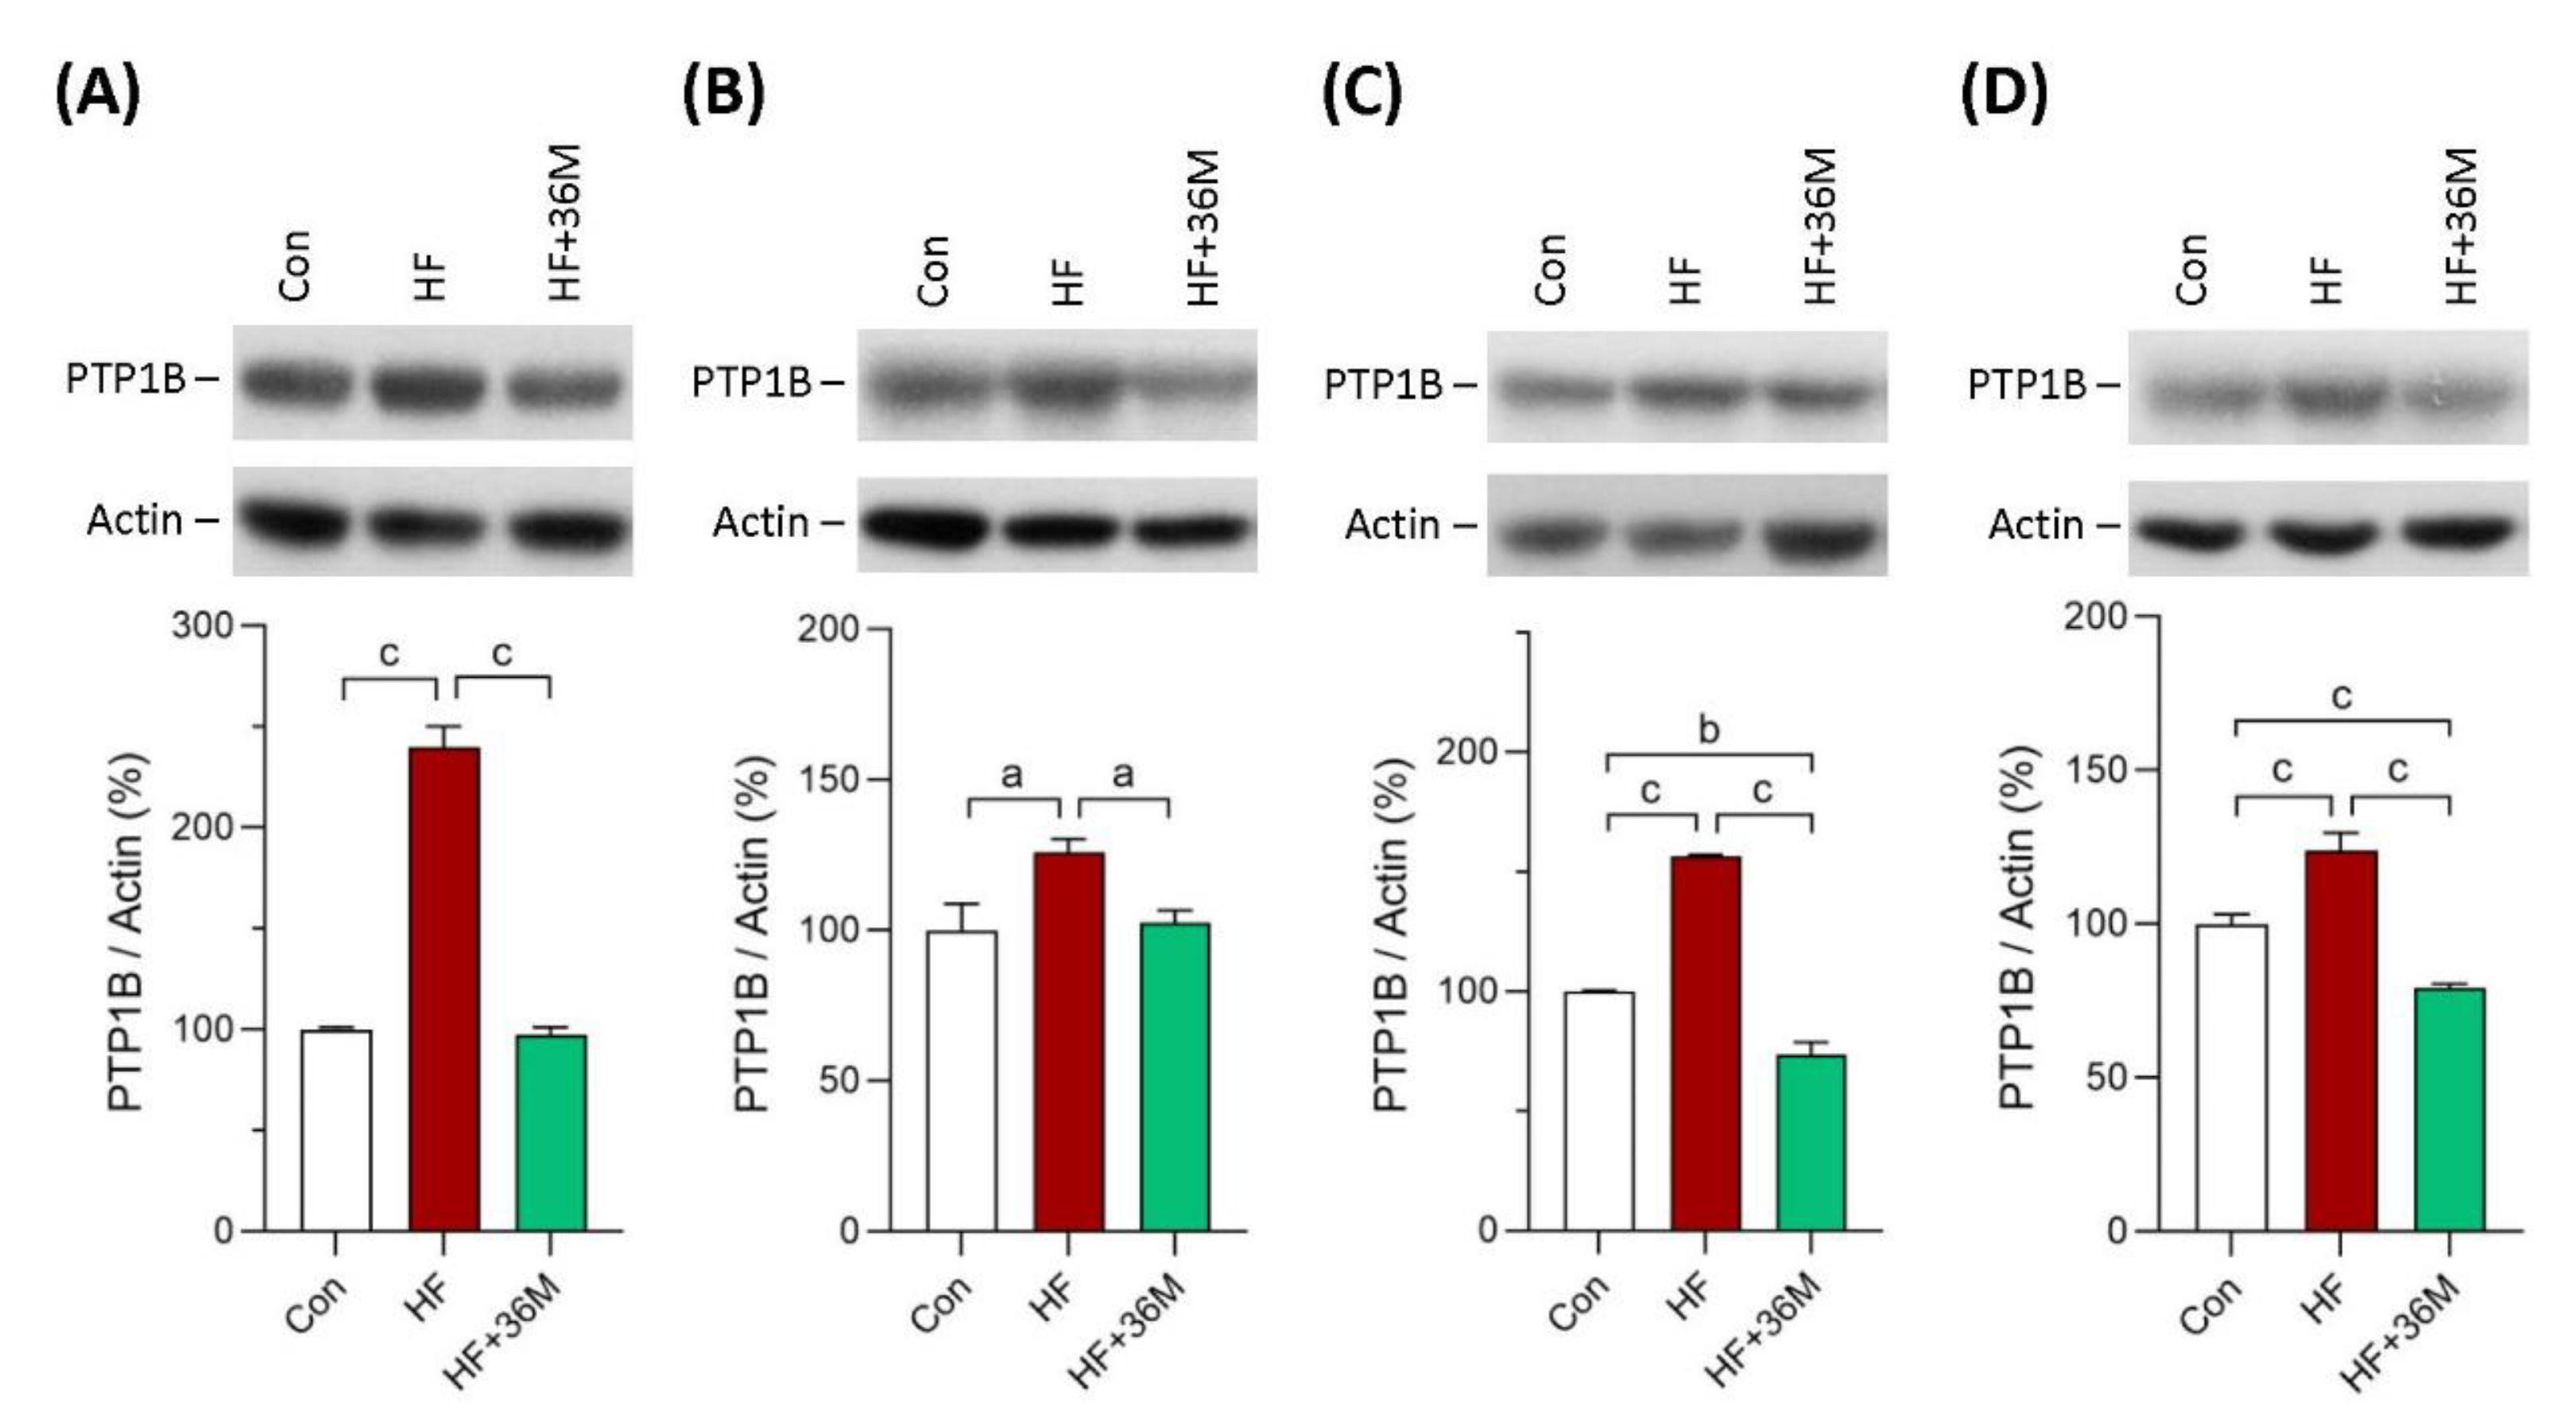
2.8. 36M Inhibits PTP1B Expression in Skeletal Muscle and Liver of HF-Fed Mice
3. Discussion
4. Materials and Methods
4.1. Reagents
4.2. Preparation of N-Octyl Caffeamide
4.3. Cell Culture and Differentiation
4.4. Detection of Glucose Consumption
4.5. Animal Studies
4.6. Oral Glucose Tolerance Test
4.7. Protein Extraction and Western Blotting
4.8. Statistical Analysis
5. Conclusions
Supplementary Materials
Author Contributions
Funding
Institutional Review Board Statement
Informed Consent Statement
Data Availability Statement
Conflicts of Interest
References
- Hamilton, M.T.; Hamilton, D.G.; Zderic, T.W. Role of low energy expenditure and sitting in obesity, metabolic syndrome, type 2 diabetes, and cardiovascular disease. Diabetes 2007, 56, 2655–2667. [Google Scholar] [CrossRef] [PubMed]
- Hossain, P.; Kawar, B.; El Nahas, M. Obesity and diabetes in the developing world-a growing challenge. N. Engl. J. Med. 2007, 356, 213–215. [Google Scholar] [CrossRef] [PubMed]
- Mesinovic, J.; Zengin, A.; De Courten, B.; Ebeling, P.R.; Scott, D. Sarcopenia and type 2 diabetes mellitus: A bidirectional relationship. Diabetes Metab. Syndr. Obes. 2019, 8, 1057–1072. [Google Scholar] [CrossRef] [PubMed]
- IDF Diabetes Atlas, 10th ed. Available online: https://diabetesatlas.org/atlas/tenth-edition/ (accessed on 18 February 2022).
- Momtaz, S.; Salek-Maghsoudi, A.; Abdolghaffari, A.H.; Jasemi, E.; Rezazadeh, S.; Hassani, S.; Ziaee, M.; Abdollahi, M.; Behzad, S.; Nabavi, S.M. Polyphenols targeting diabetes via the AMP-activated protein kinase pathway: Future approach to drug discovery. Crit. Rev. Clin. Lab. Sci. 2019, 56, 472–492. [Google Scholar] [CrossRef] [PubMed]
- Kahn, S.E.; Hull, R.L.; Utzschneider, K.M. Mechanisms linking obesity to insulin resistance and type 2 diabetes. Nature 2006, 444, 840–846. [Google Scholar] [CrossRef] [PubMed]
- Prasad, M.; Rajagopal, P.; Devarajan, N.; Veeraraghavan, V.P.; Palanisamy, C.P.; Cui, B.; Patil, S.; Jayaraman, S. A comprehensive review on high-fat diet-induced diabetes mellitus: An epigenetic view. J. Nutr. Biochem. 2022, 107, 109037. [Google Scholar] [CrossRef]
- Rosqvist, F.; Iggman, D.; Kullberg, J.; Cedernaes, J.; Johansson, H.E.; Larsson, A.; Johansson, L.; Ahlström, H.; Arner, P.; Dahlman, I.; et al. Overfeeding polyunsaturated and saturated fat causes distinct effects on liver and visceral fat accumulation in humans. Diabetes 2014, 63, 2356–2368. [Google Scholar] [CrossRef]
- Baribault, H. Mouse models of type 2 diabetes mellitus in drug discovery. Methods Mol. Biol. 2016, 1438, 153–175. [Google Scholar] [CrossRef]
- Heydemann, A. An overview of murine high fat diet as a model for type 2 diabetes mellitus. J. Diabetes Res. 2016, 2016, 2902351. [Google Scholar] [CrossRef]
- Gheibi, S.; Kashfi, K.; Ghasemi, A. A practical guide for induction of type-2 diabetes in rat: Incorporating a high-fat diet and streptozotocin. Biomed. Pharmacother. 2017, 95, 605–613. [Google Scholar] [CrossRef]
- Stott, N.L.; Marino, J.S. High fat rodent models of type 2 diabetes: From rodent to human. Nutrients 2020, 12, 3650. [Google Scholar] [CrossRef] [PubMed]
- Friedrichsen, M.; Mortensen, B.; Pehmoller, C.; Birk, J.B.; Wojtaszewski, J.F. Exercise-induced AMPK activity in skeletal muscle: Role in glucose uptake and insulin sensitivity. Mol. Cell. Endocrinol. 2013, 366, 204–214. [Google Scholar] [CrossRef] [PubMed]
- O’Neill, H.M. AMPK and exercise: Glucose uptake and insulin sensitivity. Diabetes Metab. J. 2013, 37, 1–21. [Google Scholar] [CrossRef] [PubMed]
- von Loeffelholz, C.; Coldewey, S.M.; Birkenfeld, A.L. A narrative review on the role of AMPK on de novo lipogenesis in non-alcoholic fatty liver disease: Evidence from human studies. Cells 2021, 10, 1822. [Google Scholar] [CrossRef]
- Inzucchi, S.E.; Bergenstal, R.M.; Buse, J.B.; Diamant, M.; Ferrannini, E.; Nauck, M.; Peters, A.L.; Tsapas, A.; Wender, R.; Matthews, D.R. American Diabetes Association (ADA); European Association for the Study of Diabetes (EASD). Management of hyperglycemia in type 2 diabetes: A patient-centered approach: Position statement of the American Diabetes Association (ADA) and the European Association for the Study of Diabetes (EASD). Diabetes Care 2012, 35, 1364–1379. [Google Scholar] [CrossRef]
- Hsieh, C.T.; Chang, F.R.; Tsai, Y.H.; Wu, Y.C.; Hsieh, T.J. 2-Bromo-4′-methoxychalcone and 2-Iodo-4′-methoxychalcone prevent progression of hyperglycemia and obesity via 5′-adenosine-monophosphate-activated protein kinase in diet-induced obese mice. Int. J. Mol. Sci. 2018, 19, 2763. [Google Scholar] [CrossRef]
- Behl, T.; Gupta, A.; Sehgal, A.; Sharma, S.; Singh, S.; Sharma, N.; Diaconu, C.C.; Rahdar, A.; Hafeez, A.; Bhatia, S.; et al. A spotlight on underlying the mechanism of AMPK in diabetes complications. Inflamm. Res. 2021, 70, 939–957. [Google Scholar] [CrossRef]
- Nie, T.; Cooper, G.J.S. Mechanisms underlying the antidiabetic activities of polyphenolic compounds: A review. Front. Pharmacol. 2021, 12, 798329. [Google Scholar] [CrossRef]
- Manach, C.; Scalbert, A.; Morand, C.; Rémésy, C.; Jiménez, L. Polyphenols: Food sources and bioavailability. Am. J. Clin. Nutr. 2004, 79, 727–747. [Google Scholar] [CrossRef]
- Pandey, K.B.; Rizvi, S.I. Plant polyphenols as dietary antioxidants in human health and disease. Oxid. Med. Cell. Longev. 2009, 2, 270–278. [Google Scholar] [CrossRef]
- Weng, Y.C.; Chiu, H.L.; Lin, Y.C.; Chi, T.C.; Kuo, Y.H.; Su, M.J. Antihyperglycemic effect of a caffeamide derivative, KS370G, in normal and diabetic mice. J. Agric. Food. Chem. 2010, 58, 10033–10038. [Google Scholar] [CrossRef] [PubMed]
- Ho, Y.J.; Chen, W.P.; Chi, T.C.; Chang Chien, C.C.; Lee, A.S.; Chiu, H.L.; Kuo, Y.H.; Su, M.J. Caffeic acid phenethyl amide improves glucose homeostasis and attenuates the progression of vascular dysfunction in streptozotocin-induced diabetic rats. Cardiovasc. Diabetol. 2013, 12, 99. [Google Scholar] [CrossRef] [PubMed]
- Ho, Y.J.; Lee, A.S.; Chen, W.P.; Chang, W.L.; Tsai, Y.K.; Chiu, H.L.; Kuo, Y.H.; Su, M.J. Caffeic acid phenethyl amide ameliorates ischemia/reperfusion injury and cardiac dysfunction in streptozotocin-induced diabetic rats. Cardiovasc. Diabetol. 2014, 13, 98. [Google Scholar] [CrossRef] [PubMed]
- Lu, D.Y.; Huang, B.R.; Yeh, W.L.; Lin, H.Y.; Huang, S.S.; Liu, Y.S.; Kuo, Y.H. Anti-neuroinflammatory effect of a novel caffeamide derivative, KS370G, in microglial cells. Mol. Neurobiol. 2013, 48, 863–874. [Google Scholar] [CrossRef] [PubMed]
- Chuang, S.T.; Kuo, Y.H.; Su, M.J. Antifibrotic effects of KS370G, a caffeamide derivative, in renal ischemia-reperfusion injured mice and renal tubular epithelial cells. Sci. Rep. 2014, 4, 5814. [Google Scholar] [CrossRef]
- Kuo, Y.H.; Lin, C.H.; Shih, C.C. Caffeamide 36-13 regulates the antidiabetic and hypolipidemic signs of high-fat-fed mice on glucose transporter 4, AMPK phosphorylation, and regulated hepatic glucose production. Evid. Based. Complement. Alternat. Med. 2014, 2014, 821569. [Google Scholar] [CrossRef]
- Weng, Y.C.; Chuang, S.T.; Lin, Y.C.; Chuang, C.F.; Chi, T.C.; Chiu, H.L.; Kuo, Y.H.; Su, M.J. Caffeic acid phenylethyl amide protects against the metabolic consequences in diabetes mellitus induced by diet and streptozocin. Evid. Based. Complement. Alternat. Med. 2012, 2012, 984780. [Google Scholar] [CrossRef]
- Berretta, M.; Quagliariello, V.; Maurea, N.; Di Francia, R.; Sharifi, S.; Facchini, G.; Rinaldi, L.; Piezzo, M.; Manuela, C.; Nunnari, G.; et al. Multiple effects of ascorbic acid against chronic diseases: Updated evidence from preclinical and clinical studies. Antioxidants 2020, 9, 1182. [Google Scholar] [CrossRef]
- Teimouri, M.; Hosseini, H.; ArabSadeghabadi, Z.; Babaei-Khorzoughi, R.; Gorgani-Firuzjaee, S.; Meshkani, R. The role of protein tyrosine phosphatase 1B (PTP1B) in the pathogenesis of type 2 diabetes mellitus and its complications. J. Physiol. Biochem. 2022, 78, 307–322. [Google Scholar] [CrossRef]
- Hardie, D.G.; Ross, F.A.; Hawley, S.A. AMPK: A nutrient and energy sensor that maintains energy homeostasis. Nat. Rev. Mol. Cell Biol. 2012, 13, 251–262. [Google Scholar] [CrossRef]
- Drewe, J.; Küsters, E.; Hammann, F.; Kreuter, M.; Boss, P.; Schöning, V. Modeling structure-activity relationship of AMPK activation. Molecules 2021, 26, 6508. [Google Scholar] [CrossRef] [PubMed]
- Hardie, D.G. Adenosine monophosphate-activated protein kinase: A central regulator of metabolism with roles in diabetes, cancer, and viral infection. Cold Spring Harb. Symp. Quant. Biol. 2011, 76, 155–164. [Google Scholar] [CrossRef] [PubMed]
- Habegger, K.M.; Hoffman, N.J.; Ridenour, C.M.; Brozinick, J.T.; Elmendorf, J.S. AMPK enhances insulin-stimulated GLUT4 regulation via lowering membrane cholesterol. Endocrinology 2012, 153, 2130–2141. [Google Scholar] [CrossRef] [PubMed]
- McGee, S.L.; van Denderen, B.J.; Howlett, K.F.; Mollica, J.; Schertzer, J.D.; Kemp, B.E.; Hargreaves, M. AMP-activated protein kinase regulates GLUT4 transcription by phosphorylating histone deacetylase 5. Diabetes 2008, 57, 860–867. [Google Scholar] [CrossRef]
- Ren, J.M.; Marshall, B.A.; Mueckler, M.M.; McCaleb, M.; Amatruda, J.M.; Shulman, G.I. Overexpression of Glut4 protein in muscle increases basal and insulin-stimulated whole body glucose disposal in conscious mice. J. Clin. Investig. 1995, 95, 429–432. [Google Scholar] [CrossRef] [PubMed]
- Leturque, A.; Loizeau, M.; Vaulont, S.; Salminen, M.; Girard, J. Improvement of insulin action in diabetic transgenic mice selectively overexpressing GLUT4 in skeletal muscle. Diabetes 1996, 45, 23–27. [Google Scholar] [CrossRef]
- Tsao, T.S.; Burcelin, R.; Katz, E.B.; Huang, L.; Charron, M.J. Enhanced insulin action due to targeted GLUT4 overexpression exclusively in muscle. Diabetes 1996, 45, 28–36. [Google Scholar] [CrossRef]
- Tremblay, F.; Lavigne, C.; Jacques, H.; Marette, A. Defective insulin-induced GLUT4 translocation in skeletal muscle of high fat-fed rats is associated with alterations in both Akt/protein kinase B and atypical protein kinase C (zeta/lambda) activities. Diabetes 2001, 50, 1901–1910. [Google Scholar] [CrossRef]
- Mirzoev, T.M.; Sharlo, K.A.; Shenkman, B.S. The role of GSK-3β in the regulation of protein turnover, myosin phenotype, and oxidative capacity in skeletal muscle under disuse conditions. Int. J. Mol. Sci. 2021, 22, 5081. [Google Scholar] [CrossRef]
- Wang, L.; Li, J.; Di, L.J. Glycogen synthesis and beyond, a comprehensive review of GSK3 as a key regulator of metabolic pathways and a therapeutic target for treating metabolic diseases. Med. Res. Rev. 2022, 42, 946–982. [Google Scholar] [CrossRef]
- Egerman, M.A.; Glass, D.J. Signaling pathways controlling skeletal muscle mass. Crit. Rev. Biochem. Mol. Biol. 2014, 49, 59–68. [Google Scholar] [CrossRef] [PubMed]
- Ota, T.; Takamura, T.; Kurita, S.; Matsuzawa, N.; Kita, Y.; Uno, M.; Akahori, H.; Misu, H.; Sakurai, M.; Zen, Y.; et al. Insulin resistance accelerates a dietary rat model of nonalcoholic steatohepatitis. Gastroenterology 2007, 132, 282–293. [Google Scholar] [CrossRef] [PubMed]
- Bourebaba, N.; Marycz, K. Hepatic stellate cells role in the course of metabolic disorders development—A molecular overview. Pharmacol. Res. 2021, 170, 105739. [Google Scholar] [CrossRef] [PubMed]
- Subramanian, P.; Hampe, J.; Tacke, F.; Chavakis, T. Fibrogenic pathways in metabolic dysfunction associated fatty liver disease (MAFLD). Int. J. Mol. Sci. 2022, 23, 6996. [Google Scholar] [CrossRef] [PubMed]
- Petersen, K.F.; Dufour, S.; Savage, D.B.; Bilz, S.; Solomon, G.; Yonemitsu, S.; Cline, G.W.; Befroy, D.; Zemany, L.; Kahn, B.B.; et al. The role of skeletal muscle insulin resistance in the pathogenesis of the metabolic syndrome. Proc. Natl. Acad. Sci. USA 2007, 104, 12587–12594. [Google Scholar] [CrossRef]
- Mu, W.; Cheng, X.F.; Liu, Y.; Lv, Q.Z.; Liu, G.L.; Zhang, J.G.; Li, X.Y. Potential nexus of non-alcoholic fatty liver disease and type 2 diabetes mellitus: Insulin resistance between hepatic and peripheral tissues. Front. Pharmacol. 2019, 9, 1566. [Google Scholar] [CrossRef]
- Smith, B.K.; Marcinko, K.; Desjardins, E.M.; Lally, J.S.; Ford, R.J.; Steinberg, G.R. Treatment of nonalcoholic fatty liver disease: Role of AMPK. Am. J. Physiol. Endocrinol. Metab. 2016, 311, E730–E740. [Google Scholar] [CrossRef]
- Foretz, M.; Even, P.C.; Viollet, B. AMPK activation reduces hepatic lipid content by increasing fat oxidation in vivo. Int. J. Mol. Sci. 2018, 19, 2826. [Google Scholar] [CrossRef]
- Dorn, C.; Riener, M.O.; Kirovski, G.; Saugspier, M.; Steib, K.; Weiss, T.S.; Gäbele, E.; Kristiansen, G.; Hartmann, A.; Hellerbrand, C. Expression of fatty acid synthase in nonalcoholic fatty liver disease. Int. J. Clin. Exp. Pathol. 2010, 3, 505–514. [Google Scholar]
- Liss, K.H.; Finck, B.N. PPARs and nonalcoholic fatty liver disease. Biochimie 2017, 136, 65–74. [Google Scholar] [CrossRef]
- Carr, R.M.; Ahima, R.S. Pathophysiology of lipid droplet proteins in liver diseases. Exp. Cell. Res. 2016, 340, 187–192. [Google Scholar] [CrossRef] [PubMed]
- Orlicky, D.J.; Libby, A.E.; Bales, E.S.; McMahan, R.H.; Monks, J.; La Rosa, F.G.; McManaman, J.L. Perilipin-2 promotes obesity and progressive fatty liver disease in mice through mechanistically distinct hepatocyte and extra-hepatocyte actions. J. Physiol. 2019, 597, 1565–1584. [Google Scholar] [CrossRef] [PubMed]
- Schott, M.B.; Weller, S.G.; Schulze, R.J.; Krueger, E.W.; Drizyte-Miller, K.; Casey, C.A.; McNiven, M.A. Lipid droplet size directs lipolysis and lipophagy catabolism in hepatocytes. J. Cell Biol. 2019, 218, 3320–3335. [Google Scholar] [CrossRef]
- Schulze, R.J.; McNiven, M.A. Lipid droplet formation and lipophagy in fatty liver disease. Semin. Liver Dis. 2019, 39, 283–290. [Google Scholar] [CrossRef] [PubMed]
- Sztalryd, C.; Brasaemle, D.L. The perilipin family of lipid droplet proteins: Gatekeepers of intracellular lipolysis. Biochim. Biophys. Acta Mol. Cell Biol. Lipids 2017, 1862, 1221–1232. [Google Scholar] [CrossRef]
- Straub, B.K.; Stoeffel, P.; Heid, H.; Zimbelmann, R.; Schirmacher, P. Differential pattern of lipid droplet-associated proteins and de novo perilipin expression in hepatocyte steatogenesis. Hepatology 2008, 47, 1936–1946. [Google Scholar] [CrossRef]
- Fujii, H.; Ikura, Y.; Arimoto, J.; Sugioka, K.; Iezzoni, J.C.; Park, S.H.; Naruko, T.; Itabe, H.; Kawada, N.; Caldwell, S.H.; et al. Expression of perilipin and adipophilin in nonalcoholic fatty liver disease: Relevance to oxidative injury and hepatocyte ballooning. J. Atheroscler. Thromb. 2009, 16, 893–901. [Google Scholar] [CrossRef]
- Hall, A.M.; Brunt, E.M.; Chen, Z.; Viswakarma, N.; Reddy, J.K.; Wolins, N.E.; Finck, B.N. Dynamic and differential regulation of proteins that coat lipid droplets in fatty liver dystrophic mice. J. Lipid Res. 2010, 51, 554–563. [Google Scholar] [CrossRef]
- Sans, A.; Bonnafous, S.; Rousseau, D.; Patouraux, S.; Canivet, C.M.; Leclere, P.S.; Tran-Van-Nhieu, J.; Luci, C.; Bailly-Maitre, B.; Xu, X.; et al. The differential expression of Cide family members is associated with Nafld progression from steatosis to steatohepatitis. Sci. Rep. 2019, 9, 7501. [Google Scholar] [CrossRef]
- Yip, S.-C.; Saha, S.; Chernoff, J. PTP1B: A double agent in metabolism and oncogenesis. Trends Biochem. Sci. 2010, 35, 442–449. [Google Scholar] [CrossRef]
- Egawa, K.; Maegawa, H.; Shimizu, S.; Morino, K.; Nishio, Y.; Bryer-Ash, M.; Cheung, A.T.; Kolls, J.K.; Kikkawa, R.; Kashiwagi, A. Protein-tyrosine phosphatase-1B negatively regulates insulin signaling in l6 myocytes and Fao hepatoma cells. J. Biol. Chem. 2001, 276, 10207–10211. [Google Scholar] [CrossRef] [PubMed]
- Rajala, R.V.; Tanito, M.; Neel, B.G.; Rajala, A. Enhanced retinal insulin receptor-activated neuroprotective survival signal in mice lacking the proteintyrosine phosphatase-1B gene. J. Biol. Chem. 2010, 285, 8894–8904. [Google Scholar] [CrossRef]
- Elchebly, M.; Payette, P.; Michaliszyn, E.; Cromlish, W.; Collins, S.; Loy, A.L.; Normandin, D.; Cheng, A.; Himms-Hagen, J.; Chan, C.C.; et al. Increased insulin sensitivity and obesity resistance in mice lacking the protein tyrosine phosphatase-1B gene. Science 1999, 283, 1544–1548. [Google Scholar] [CrossRef] [PubMed]
- Liu, M.; Li, F.; Huang, Y.; Zhou, T.; Chen, S.; Li, G.; Shi, J.; Dong, N.; Xu, K. Caffeic acid phenethyl ester ameliorates calcification by inhibiting activation of the AKT/NF-κB/NLRP3 inflammasome pathway in human aortic valve interstitial cells. Front. Pharmacol. 2020, 11, 826. [Google Scholar] [CrossRef] [PubMed]
- Chuang, S.T.; Kuo, Y.H.; Su, M.J. KS370G, a caffeamide derivative, attenuates unilateral ureteral obstruction-induced renal fibrosis by the reduction of inflammation and oxidative stress in mice. Eur. J. Pharmacol. 2015, 750, 1–7. [Google Scholar] [CrossRef]
- Hsieh, T.J.; Tsai, Y.H.; Liao, M.C.; Du, Y.C.; Lien, P.J.; Sun, C.C.; Chang, F.R.; Wu, Y.C. Anti-diabetic properties of non-polar Toona sinensis Roem extract prepared by supercritical-CO2 fluid. Food. Chem. Toxicol. 2012, 50, 779–789. [Google Scholar] [CrossRef]
- Wei, C.K.; Tsai, Y.H.; Korinek, M.; Hung, P.H.; El-Shazly, M.; Cheng, Y.B.; Wu, Y.C.; Hsieh, T.J.; Chang, F.R. 6-Paradol and 6-Shogaol, the pungent compounds of ginger, promote glucose utilization in adipocytes and myotubes, and 6-Paradol reduces blood glucose in high-fat diet-fed mice. Int. J. Mol. Sci. 2017, 18, 168. [Google Scholar] [CrossRef]
- Nair, A.B.; Jacob, S. A simple practice guide for dose conversion between animals and human. J. Basic Clin. Pharm. 2016, 7, 27–31. [Google Scholar] [CrossRef]


Publisher’s Note: MDPI stays neutral with regard to jurisdictional claims in published maps and institutional affiliations. |
© 2022 by the authors. Licensee MDPI, Basel, Switzerland. This article is an open access article distributed under the terms and conditions of the Creative Commons Attribution (CC BY) license (https://creativecommons.org/licenses/by/4.0/).
Share and Cite
Wu, M.-Y.; Liu, C.-C.; Lee, S.-C.; Kuo, Y.-H.; Hsieh, T.-J. N-Octyl Caffeamide, a Caffeic Acid Amide Derivative, Prevents Progression of Diabetes and Hepatic Steatosis in High-Fat Diet Induced Obese Mice. Int. J. Mol. Sci. 2022, 23, 8948. https://doi.org/10.3390/ijms23168948
Wu M-Y, Liu C-C, Lee S-C, Kuo Y-H, Hsieh T-J. N-Octyl Caffeamide, a Caffeic Acid Amide Derivative, Prevents Progression of Diabetes and Hepatic Steatosis in High-Fat Diet Induced Obese Mice. International Journal of Molecular Sciences. 2022; 23(16):8948. https://doi.org/10.3390/ijms23168948
Chicago/Turabian StyleWu, Miao-Yi, Chia-Chu Liu, Su-Chu Lee, Yueh-Hsiung Kuo, and Tusty-Jiuan Hsieh. 2022. "N-Octyl Caffeamide, a Caffeic Acid Amide Derivative, Prevents Progression of Diabetes and Hepatic Steatosis in High-Fat Diet Induced Obese Mice" International Journal of Molecular Sciences 23, no. 16: 8948. https://doi.org/10.3390/ijms23168948
APA StyleWu, M.-Y., Liu, C.-C., Lee, S.-C., Kuo, Y.-H., & Hsieh, T.-J. (2022). N-Octyl Caffeamide, a Caffeic Acid Amide Derivative, Prevents Progression of Diabetes and Hepatic Steatosis in High-Fat Diet Induced Obese Mice. International Journal of Molecular Sciences, 23(16), 8948. https://doi.org/10.3390/ijms23168948