
Molecular Biomarkers in Glioblastoma: A Systematic Review and Meta-Analysis

 , ,
, ,  , ,
, ,
Abstract
1. Introduction
2. Materials and Methods
2.1. Protocol and Registration
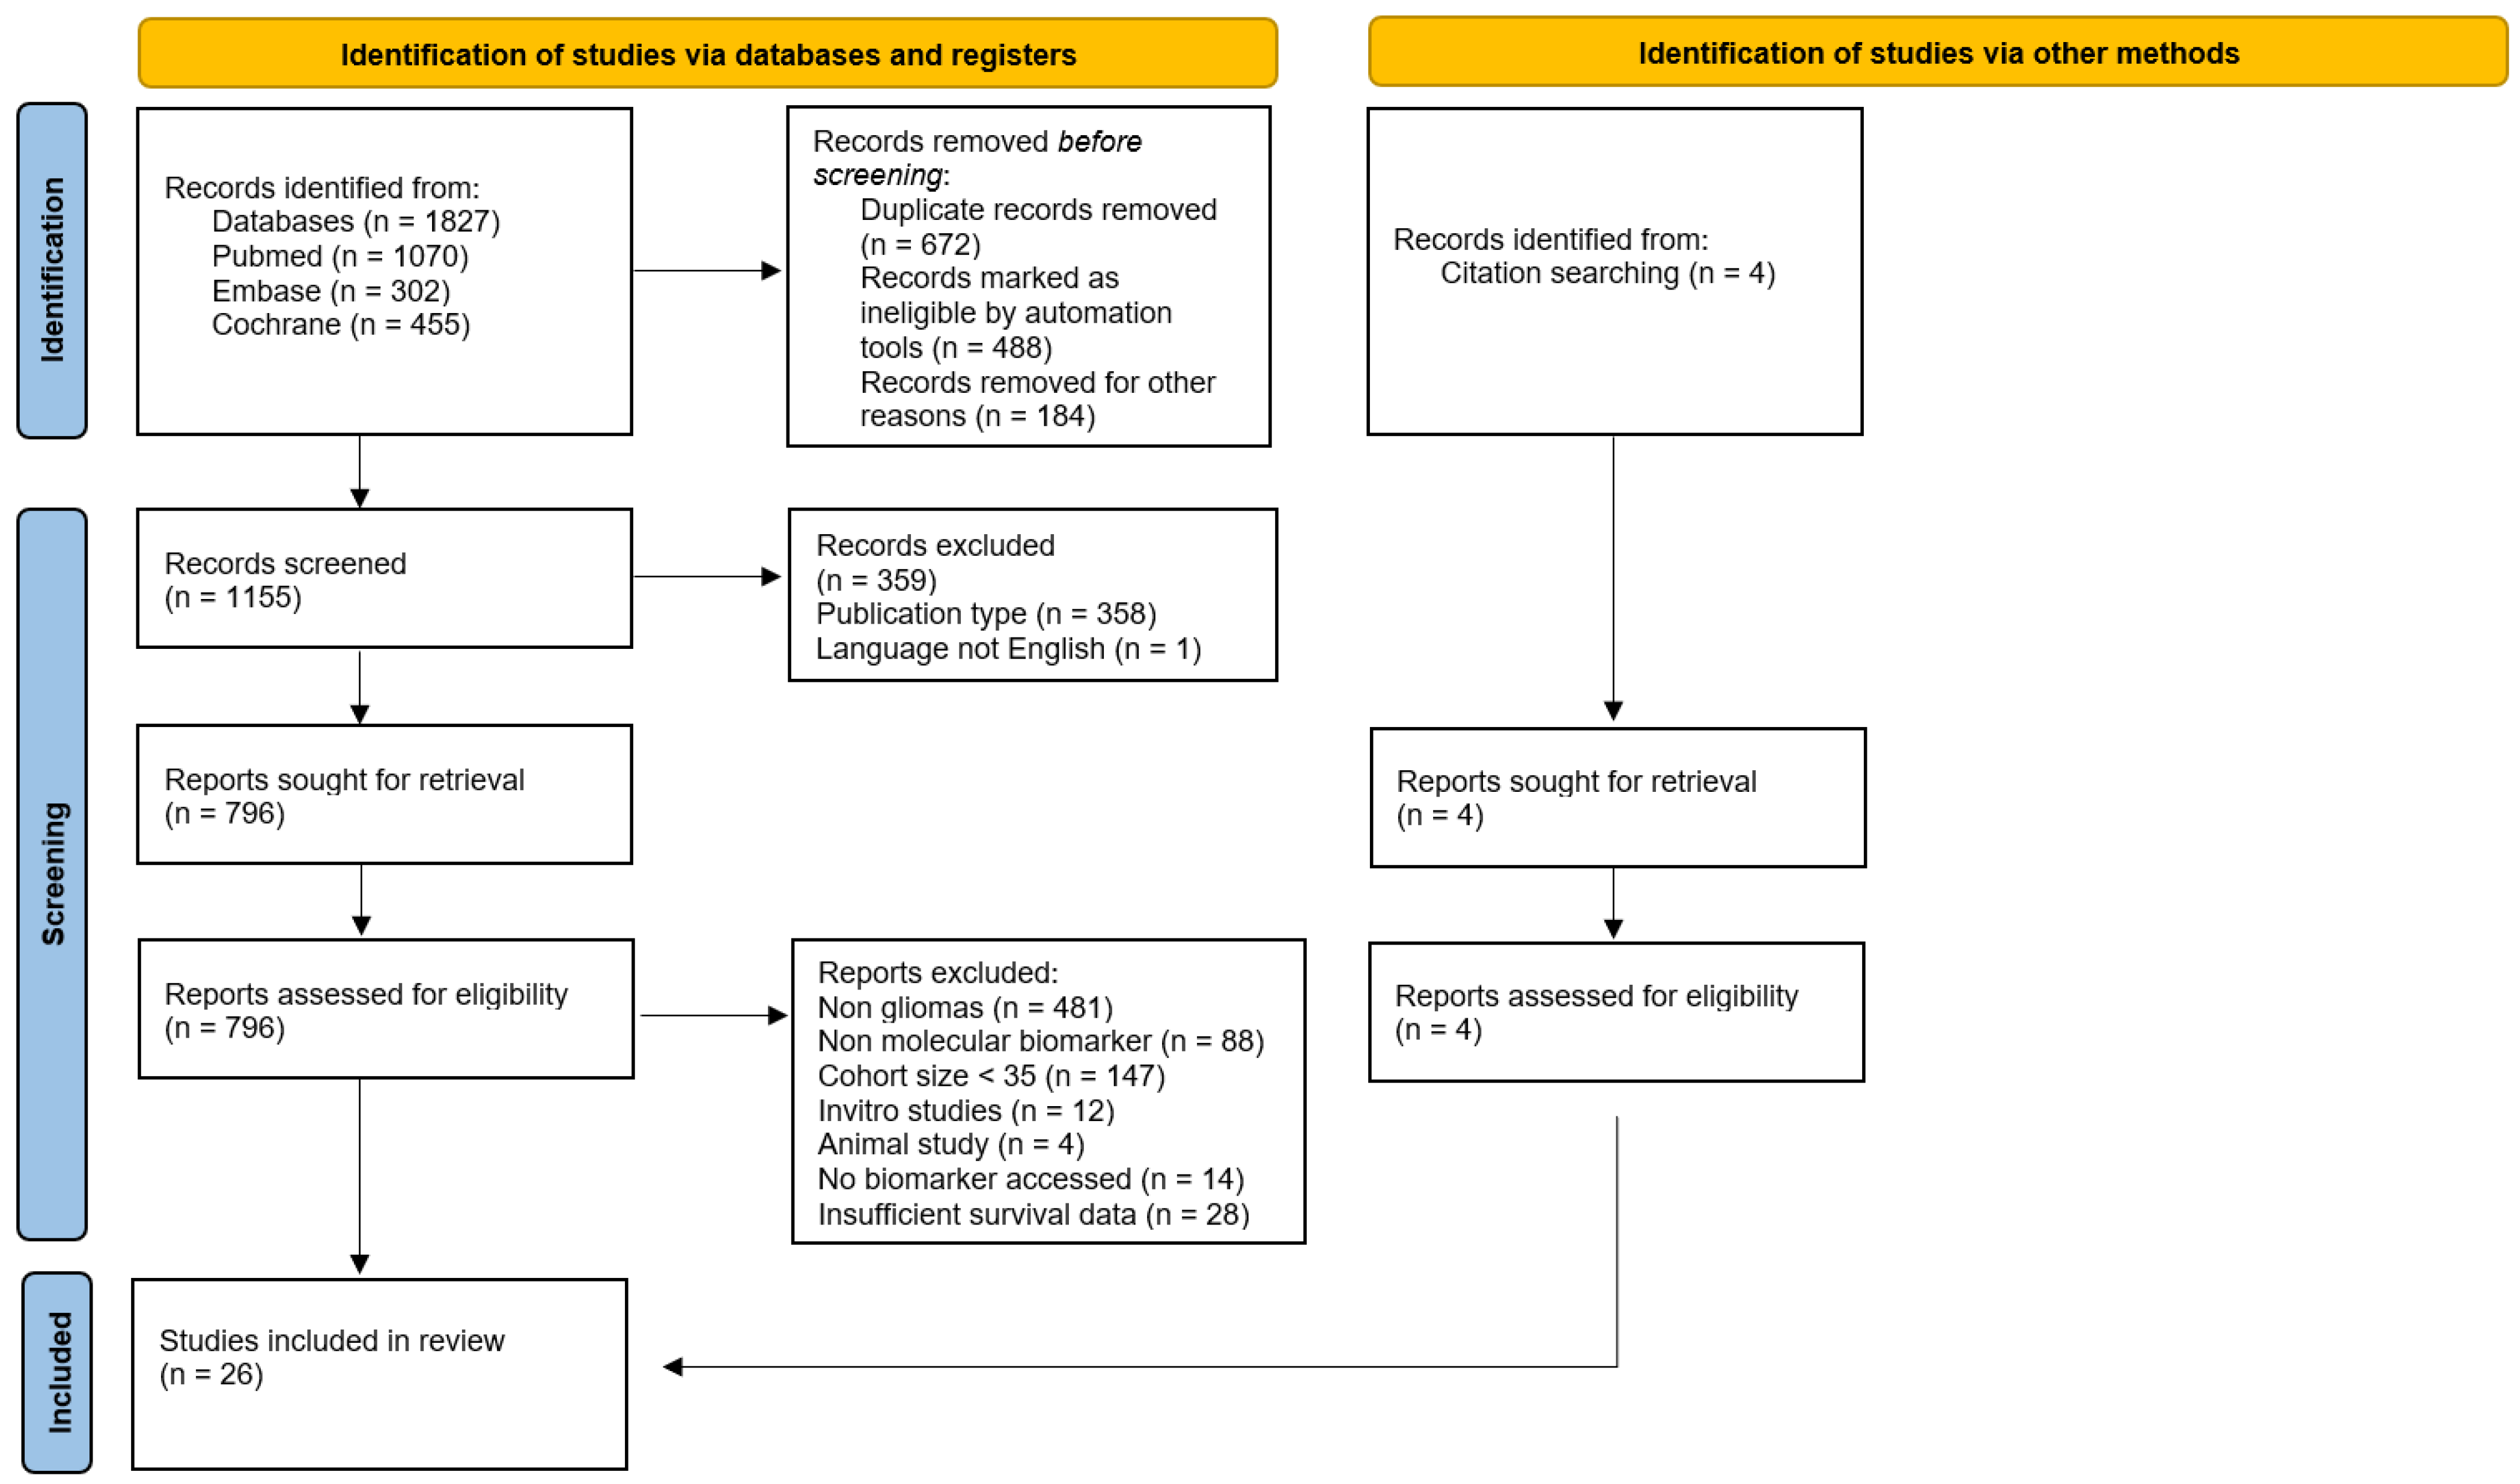
2.2. Study Design and Search Strategy
2.3. Study Selection and Criteria
2.4. Data Extraction
2.5. Quality Assessment
2.6. Statistical Analysis and Data Analysis
3. Results
3.1. Risk of Bias Assessment and Sensitivity Analysis
3.1.1. Quantitative Analysis
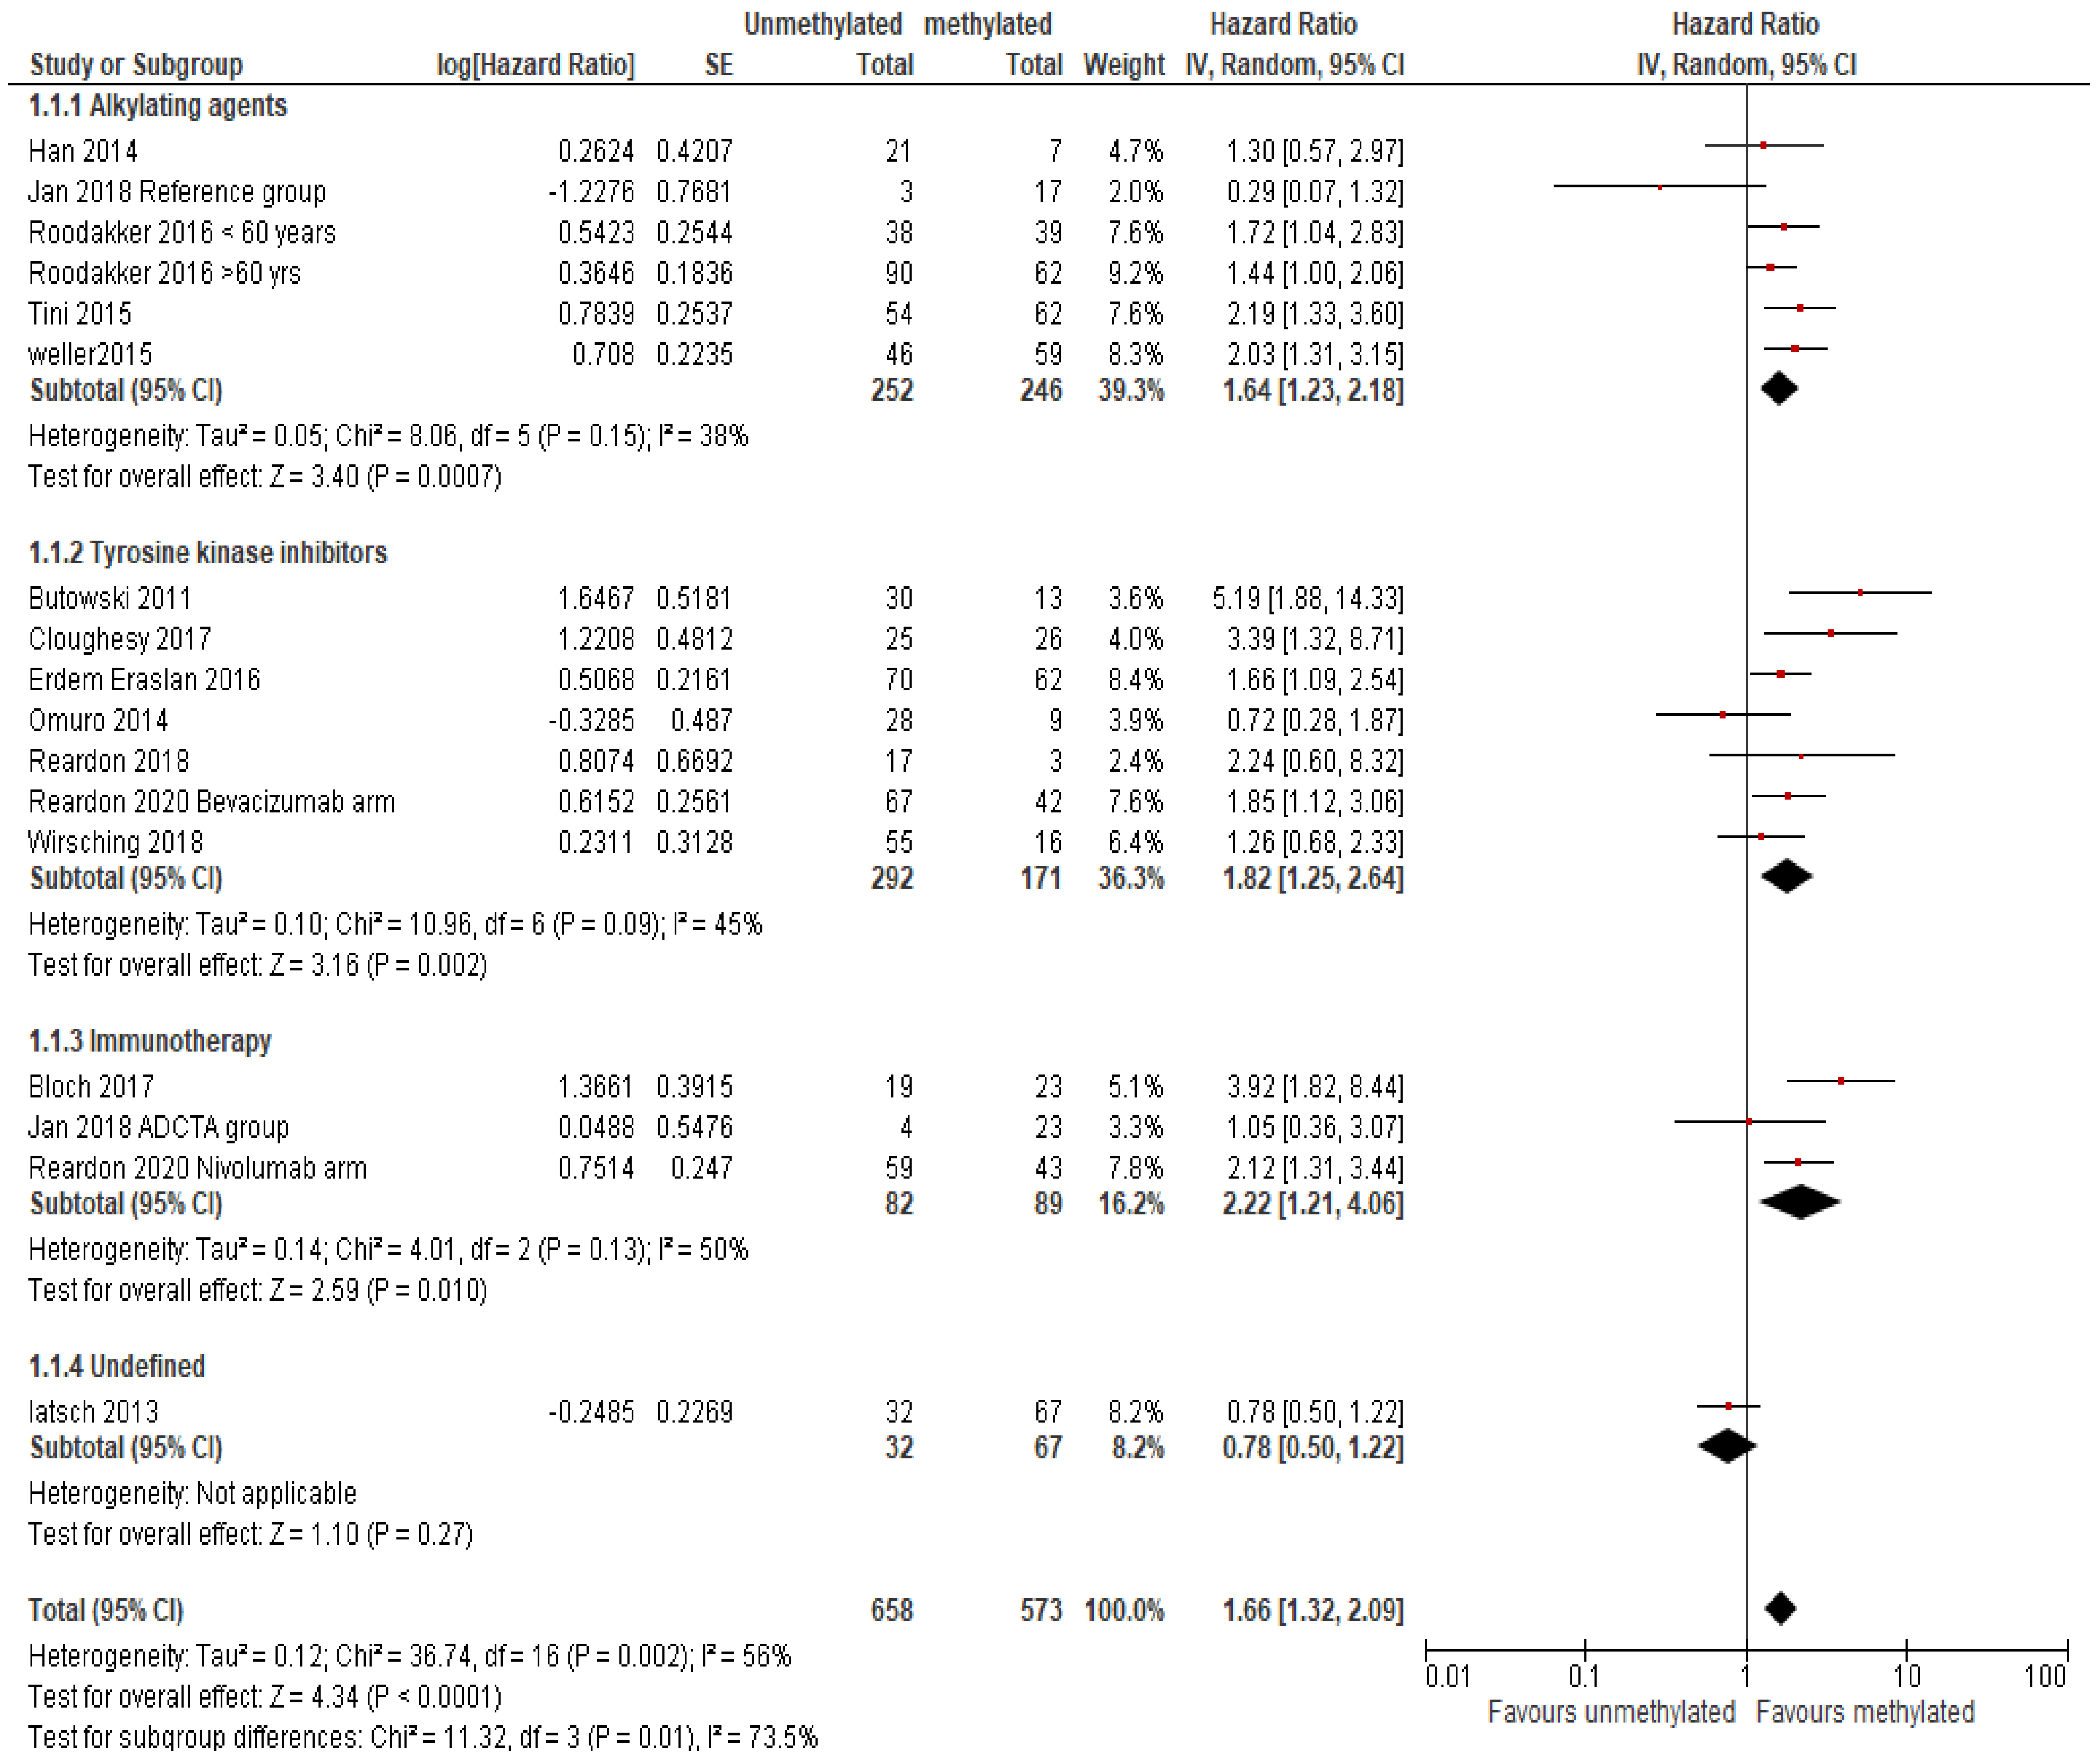
MGMT Methylation
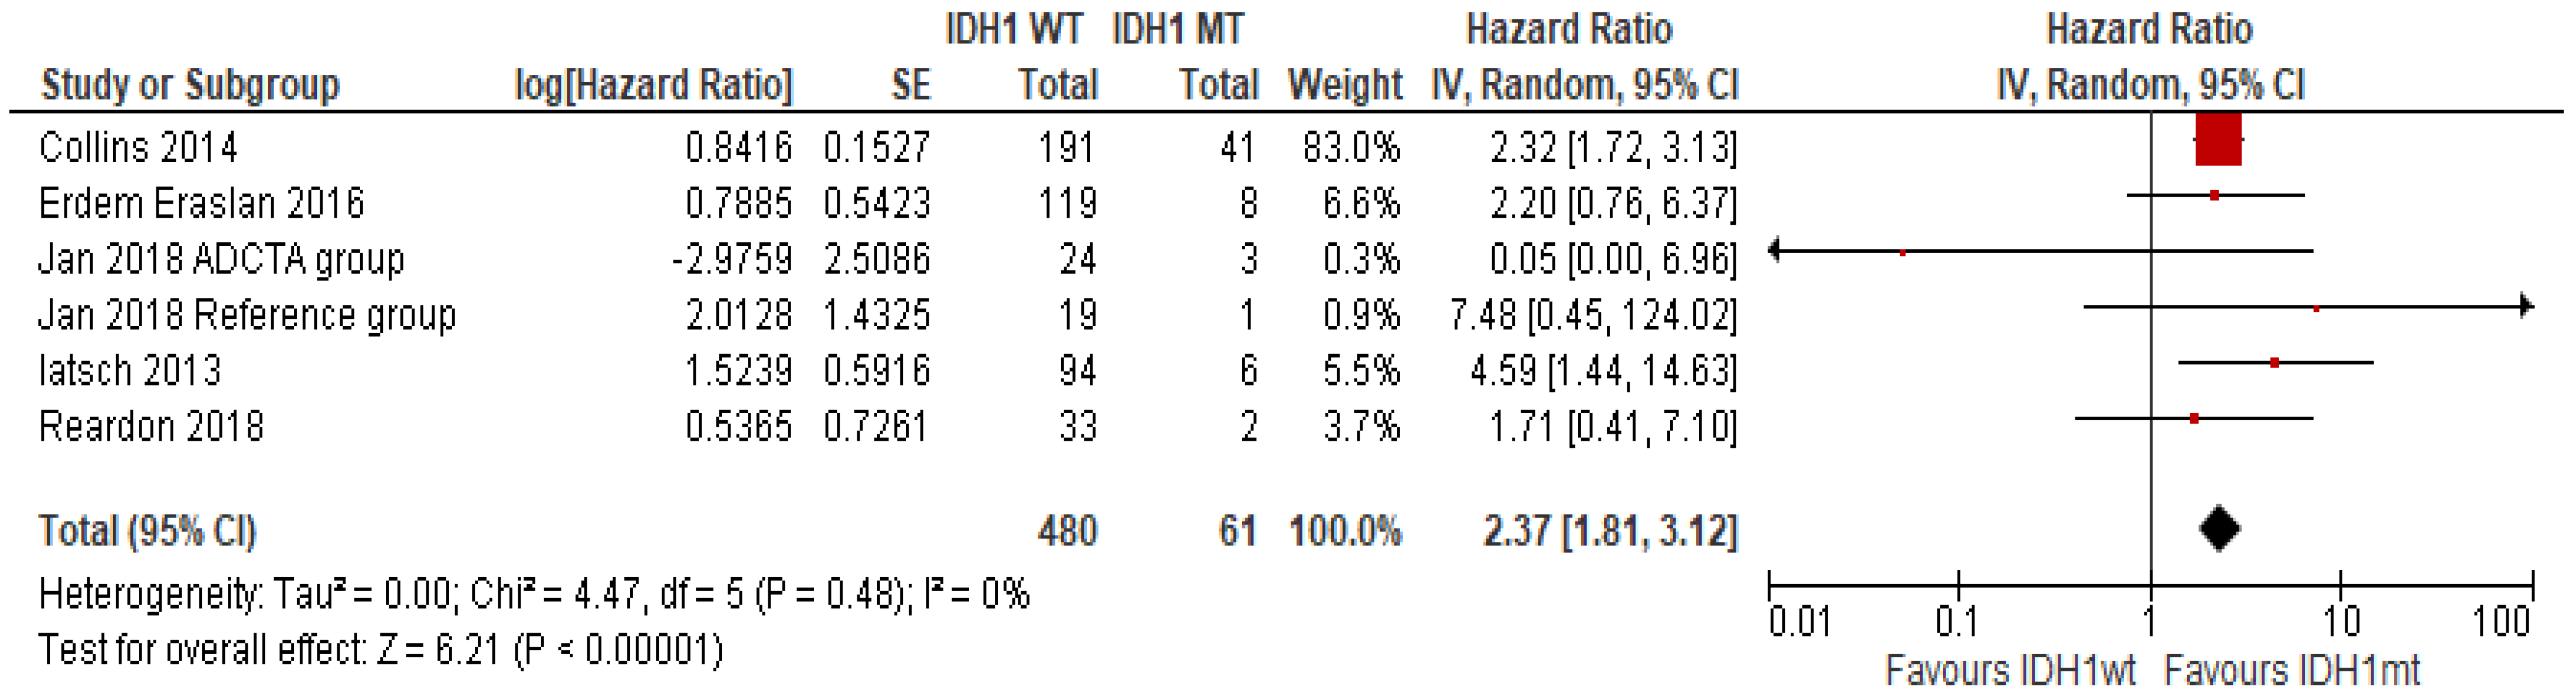
IDH1 Mutation
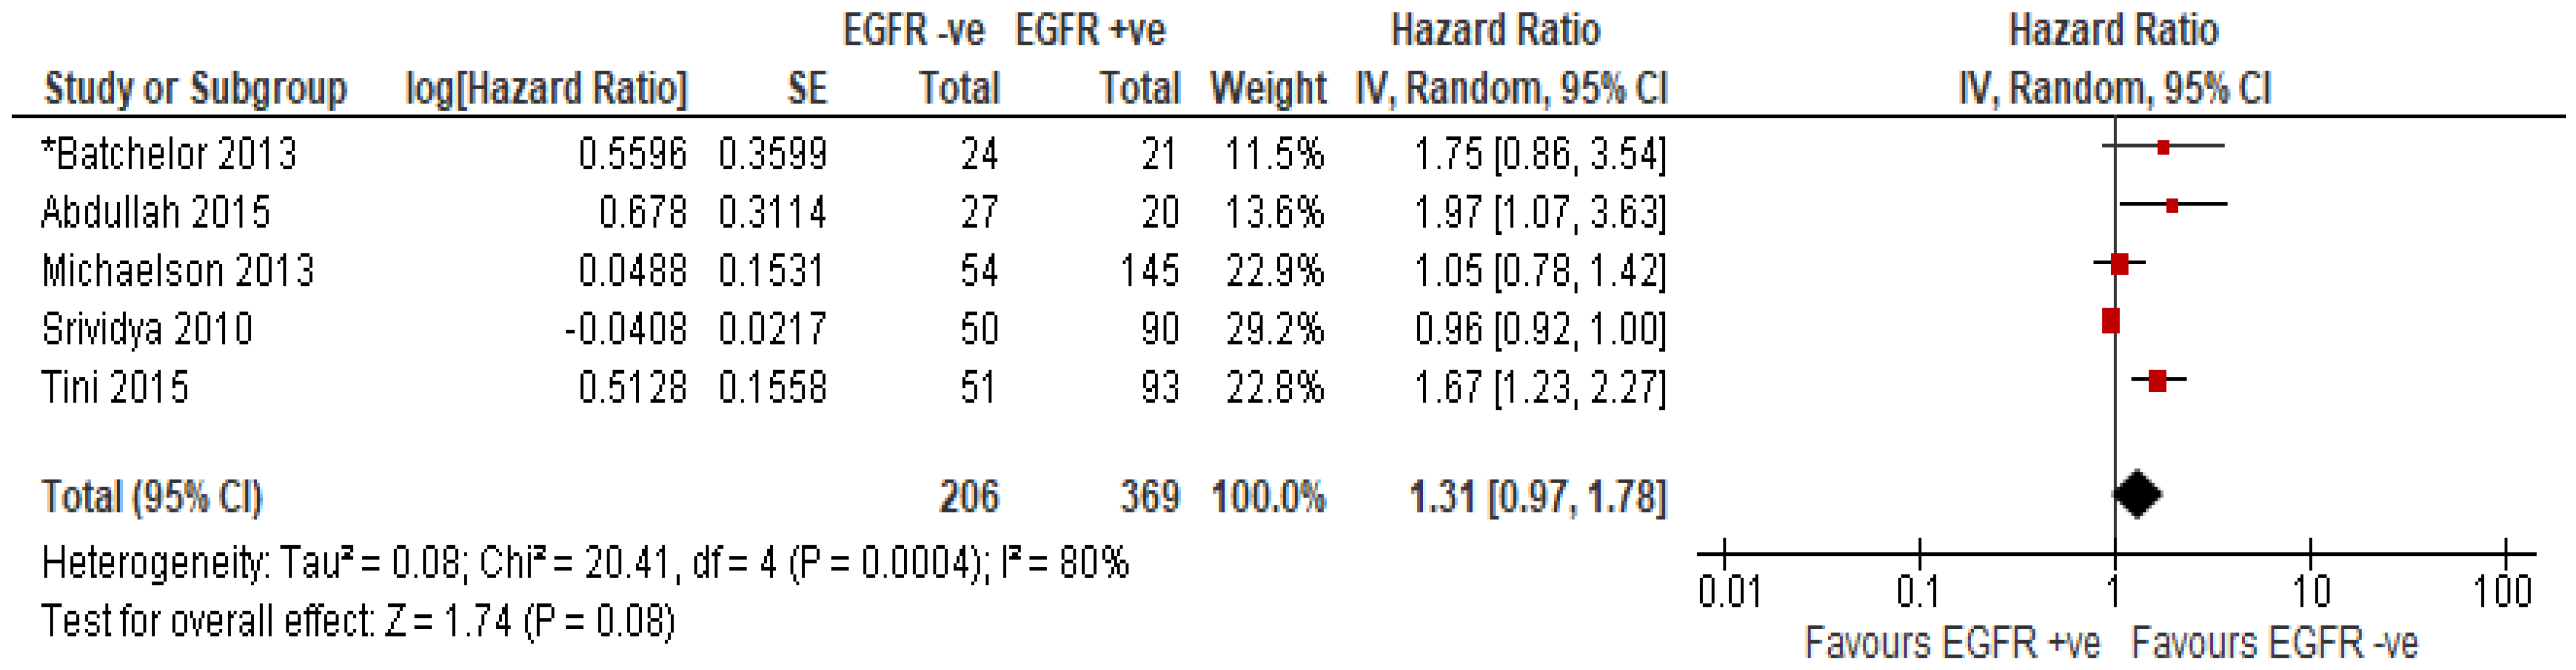
EGFR Amplification or Overexpression of EGFR Protein
3.1.2. Qualitative Analysis
Tumour Immune Signature and Cytokine Signature
Circulatory Biomarkers
4. Discussion
5. Conclusions
6. Limitations
Supplementary Materials
Author Contributions
Funding
Institutional Review Board Statement
Informed Consent Statement
Data Availability Statement
Conflicts of Interest
References
- Miller, K.D.; Ostrom, Q.T.; Kruchko, C.; Patil, N.; Tihan, T.; Cioffi, G.; Fuchs, H.E.; Waite, K.A.; Jemal, A.; Siegel, R.L.; et al. Brain and other central nervous system tumor statistics, 2021. CA A Cancer J. Clin. 2021, 71, 381–406. [Google Scholar] [CrossRef] [PubMed]
- Ohgaki, H.; Kleihues, P. The definition of primary and secondary glioblastoma. Clin. Cancer Res. 2013, 19, 764–772. [Google Scholar] [CrossRef] [PubMed]
- Stupp, R.; Mason, W.P.; van den Bent, M.J.; Weller, M.; Fisher, B.; Taphoorn, M.J.; Belanger, K.; Brandes, A.A.; Marosi, C.; Bogdahn, U.; et al. Radiotherapy plus concomitant and adjuvant temozolomide for glioblastoma. N. Engl. J. Med. 2005, 352, 987–996. [Google Scholar] [CrossRef] [PubMed]
- Roy, S.; Lahiri, D.; Maji, T.; Biswas, J. Recurrent Glioblastoma: Where we stand. S. Asian J. Cancer 2015, 4, 163–173. [Google Scholar] [CrossRef] [PubMed]
- Zhang, K.; Wang, X.-Q.; Zhou, B.; Zhang, L. The prognostic value of MGMT promoter methylation in Glioblastoma multiforme: A meta-analysis. Fam. Cancer 2013, 12, 449–458. [Google Scholar] [CrossRef]
- Christians, A.; Adel-Horowski, A.; Banan, R.; Lehmann, U.; Bartels, S.; Behling, F.; Barrantes-Freer, A.; Stadelmann, C.; Rohde, V.; Stockhammer, F.; et al. The prognostic role of IDH mutations in homogeneously treated patients with anaplastic astrocytomas and glioblastomas. Acta Neuropathol. Commun. 2019, 7, 156. [Google Scholar] [CrossRef] [PubMed]
- Powter, B.; Jeffreys, S.A.; Sareen, H.; Cooper, A.; Brungs, D.; Po, J.; Roberts, T.; Koh, E.-S.; Scott, K.F.; Sajinovic, M.; et al. Human TERT promoter mutations as a prognostic biomarker in glioma. J. Cancer Res. Clin. Oncol. 2021, 147, 1007–1017. [Google Scholar] [CrossRef] [PubMed]
- Li, J.; Liang, R.; Song, C.; Xiang, Y.; Liu, Y. Prognostic significance of epidermal growth factor receptor expression in glioma patients. Onco Targets Ther. 2018, 11, 731–742. [Google Scholar] [CrossRef]
- Feldheim, J.; Kessler, A.F.; Monoranu, C.M.; Ernestus, R.-I.; Löhr, M.; Hagemann, C. Changes of O(6)-Methylguanine DNA Methyltransferase (MGMT) Promoter Methylation in Glioblastoma Relapse-A Meta-Analysis Type Literature Review. Cancers 2019, 11, 1837. [Google Scholar] [CrossRef] [PubMed]
- Han, S.; Liu, Y.; Cai, S.J.; Qian, M.; Ding, J.; Larion, M.; Gilbert, M.R.; Yang, C. IDH mutation in glioma: Molecular mechanisms and potential therapeutic targets. Br. J. Cancer 2020, 122, 1580–1589. [Google Scholar] [CrossRef]
- Ferguson, S.D.; Xiu, J.; Weathers, S.-P.; Zhou, S.; Kesari, S.; Weiss, S.E.; Verhaak, R.G.; Hohl, R.J.; Barger, G.R.; Reddy, S.K.; et al. GBM-associated mutations and altered protein expression are more common in young patients. Oncotarget 2016, 7, 69466–69478. [Google Scholar] [CrossRef] [PubMed]
- An, Z.; Aksoy, O.; Zheng, T.; Fan, Q.-W.; Weiss, W.A. Epidermal growth factor receptor and EGFRvIII in glioblastoma: Signaling pathways and targeted therapies. Oncogene 2018, 37, 1561–1575. [Google Scholar] [CrossRef] [PubMed]
- Xu, C.; Wu, X.; Zhu, J. VEGF promotes proliferation of human glioblastoma multiforme stem-like cells through VEGF receptor 2. Sci. World J. 2013, 2013, 417413. [Google Scholar] [CrossRef]
- Chinot, O.L.; Wick, W.; Mason, W.; Henriksson, R.; Saran, F.; Nishikawa, R.; Carpentier, A.F.; Hoang-Xuan, K.; Kavan, P.; Cernea, D.; et al. Bevacizumab plus Radiotherapy–Temozolomide for Newly Diagnosed Glioblastoma. N. Engl. J. Med. 2014, 370, 709–722. [Google Scholar] [CrossRef] [PubMed]
- Reardon, D.A.; Lassman, A.B.; Schiff, D.; Yunus, S.A.; Gerstner, E.R.; Cloughesy, T.F.; Lee, E.Q.; Gaffey, S.C.; Barrs, J.; Bruno, J.; et al. Phase 2 and biomarker study of trebananib, an angiopoietin-blocking peptibody, with and without bevacizumab for patients with recurrent glioblastoma. Cancer 2018, 124, 1438–1448. [Google Scholar] [CrossRef] [PubMed]
- Page, M.J.; McKenzie, J.E.; Bossuyt, P.M.; Boutron, I.; Hoffmann, T.C.; Mulrow, C.D.; Shamseer, L.; Tetzlaff, J.M.; Akl, E.A.; Brennan, S.E.; et al. The PRISMA 2020 statement: An updated guideline for reporting systematic reviews. BMJ 2021, 10, 89. [Google Scholar] [CrossRef]
- Ouzzani, M.; Hammady, H.; Fedorowicz, Z.; Elmagarmid, A. Rayyan—a web and mobile app for systematic reviews. Syst. Rev. 2016, 5, 210. [Google Scholar] [CrossRef] [PubMed]
- Hayden, J.A.; van der Windt, D.A.; Cartwright, J.L.; Côté, P.; Bombardier, C. Assessing bias in studies of prognostic factors. Ann. Intern. Med. 2013, 158, 280–286. [Google Scholar] [CrossRef]
- Tierney, J.F.; Stewart, L.A.; Ghersi, D.; Burdett, S.; Sydes, M.R. Practical methods for incorporating summary time-to-event data into meta-analysis. Trials 2007, 8, 16. [Google Scholar] [CrossRef] [PubMed]
- Abdullah, K.G.; Ramayya, A.; Thawani, J.P.; Macyszyn, L.; Martinez-Lage, M.; O’Rourke, D.M.; Brem, S. Factors Associated with Increased Survival after Surgical Resection of Glioblastoma in Octogenarians. PLoS ONE 2015, 10, e0127202. [Google Scholar] [CrossRef]
- Accomando, W.P.; Rao, A.R.; Hogan, D.J.; Newman, A.M.; Nakao, A.; Alizadeh, A.A.; Diehn, M.; Diago, O.R.; Gammon, D.; Haghighi, A.; et al. Molecular and Immunologic Signatures are Related to Clinical Benefit from Treatment with Vocimagene Amiretrorepvec (Toca 511) and 5-Fluorocytosine (Toca FC) in Patients with Glioma. Clin. Cancer Res. 2020, 26, 6176–6186. [Google Scholar] [CrossRef] [PubMed]
- Batchelor, T.T.; Gerstner, E.R.; Emblem, K.E.; Duda, D.G.; Kalpathy-Cramer, J.; Snuderl, M.; Ancukiewicz, M.; Polaskova, P.; Pinho, M.C.; Jennings, D.; et al. Improved tumor oxygenation and survival in glioblastoma patients who show increased blood perfusion after cediranib and chemoradiation. Proc. Natl. Acad. Sci. USA 2013, 110, 19059–19064. [Google Scholar] [CrossRef] [PubMed]
- Batchelor, T.T.; Gerstner, E.R.; Ye, X.; Desideri, S.; Duda, D.G.; Peereboom, D.; Lesser, G.J.; Chowdhary, S.; Wen, P.Y.; Grossman, S.; et al. Feasibility, phase I, and phase II studies of tandutinib, an oral platelet-derived growth factor receptor-β tyrosine kinase inhibitor, in patients with recurrent glioblastoma. Neuro Oncol. 2017, 19, 567–575. [Google Scholar] [CrossRef] [PubMed]
- Beije, N.; Kraan, J.; Taal, W.; van der Holt, B.; Oosterkamp, H.M.; Walenkamp, A.M.; Beerepoot, L.; Hanse, M.; van Linde, M.E.; Otten, A.; et al. Prognostic value and kinetics of circulating endothelial cells in patients with recurrent glioblastoma randomised to bevacizumab plus lomustine, bevacizumab single agent or lomustine single agent. A report from the Dutch Neuro-Oncology Group BELOB trial. Br. J. Cancer 2015, 113, 226–231. [Google Scholar] [CrossRef] [PubMed][Green Version]
- Bloch, O.; Lim, M.; Sughrue, M.E.; Komotar, R.J.; Abrahams, J.M.; O’Rourke, D.M.; D’Ambrosio, A.; Bruce, J.N.; Parsa, A.T. Autologous Heat Shock Protein Peptide Vaccination for Newly Diagnosed Glioblastoma: Impact of Peripheral PD-L1 Expression on Response to Therapy. Clin. Cancer Res. Off. J. Am. Assoc. Cancer Res. 2017, 23, 3575–3584. [Google Scholar] [CrossRef]
- Butowski, N.; Chang, S.M.; Lamborn, K.R.; Polley, M.-Y.; Pieper, R.; Costello, J.F.; Vandenberg, S.; Parvataneni, R.; Nicole, A.; Sneed, P.K.; et al. Phase II and pharmacogenomics study of enzastaurin plus temozolomide during and following radiation therapy in patients with newly diagnosed glioblastoma multiforme and gliosarcoma. Neuro Oncol. 2011, 13, 1331–1338. [Google Scholar] [CrossRef]
- Carvalho, B.; Lopes, J.M.; Silva, R.; Peixoto, J.; Leitão, D.; Soares, P.; Fernandes, A.C.; Linhares, P.; Vaz, R.; Lima, J. The role of c-Met and VEGFR2 in glioblastoma resistance to bevacizumab. Sci. Rep. 2021, 11, 6067. [Google Scholar] [CrossRef] [PubMed]
- Cloughesy, T.; Finocchiaro, G.; Belda-Iniesta, C.; Recht, L.; Brandes, A.A.; Pineda, E.; Mikkelsen, T.; Chinot, O.L.; Balana, C.; Macdonald, D.R.; et al. Randomized, Double-Blind, Placebo-Controlled, Multicenter Phase II Study of Onartuzumab Plus Bevacizumab Versus Placebo Plus Bevacizumab in Patients With Recurrent Glioblastoma: Efficacy, Safety, and Hepatocyte Growth Factor and O6-Methylguanine–DNA Methyltransferase Biomarker Analyses. J. Clin. Oncol. 2017, 35, 343–351. [Google Scholar] [CrossRef] [PubMed]
- Collins, V.P.; Ichimura, K.; Di, Y.; Pearson, D.; Chan, R.; Thompson, L.C.; Gabe, R.; Brada, M.; Stenning, S.P. Prognostic and predictive markers in recurrent high grade glioma; results from the BR12 randomised trial. Acta Neuropathol. Commun. 2014, 2, 68. [Google Scholar] [CrossRef] [PubMed]
- Erdem-Eraslan, L.; van den Bent, M.J.; Hoogstrate, Y.; Naz-Khan, H.; Stubbs, A.; van der Spek, P.; Böttcher, R.; Gao, Y.; de Wit, M.; Taal, W.; et al. Identification of Patients with Recurrent Glioblastoma Who May Benefit from Combined Bevacizumab and CCNU Therapy: A Report from the BELOB Trial. Cancer Res. 2016, 76, 525–534. [Google Scholar] [CrossRef] [PubMed]
- Galanis, E.; Anderson, S.K.; Lafky, J.M.; Uhm, J.H.; Giannini, C.; Kumar, S.K.; Kimlinger, T.K.; Northfelt, D.W.; Flynn, P.J.; Jaeckle, K.A.; et al. Phase II study of bevacizumab in combination with sorafenib in recurrent glioblastoma (N0776): A north central cancer treatment group trial. Clin. Cancer Res. Off. J. Am. Assoc. Cancer Res. 2013, 19, 4816–4823. [Google Scholar] [CrossRef] [PubMed]
- Gerstner, E.R.; Ye, X.; Duda, D.G.; Levine, M.A.; Mikkelsen, T.; Kaley, T.J.; Olson, J.J.; Nabors, B.L.; Ahluwalia, M.S.; Wen, P.Y.; et al. A phase I study of cediranib in combination with cilengitide in patients with recurrent glioblastoma. Neuro Oncol. 2015, 17, 1386–1392. [Google Scholar] [CrossRef] [PubMed]
- Han, S.J.; Rolston, J.D.; Molinaro, A.M.; Clarke, J.L.; Prados, M.D.; Chang, S.M.; Berger, M.S.; DeSilva, A.; Butowski, N.A. Phase II trial of 7 days on/7 days off temozolmide for recurrent high-grade glioma. Neuro Oncol. 2014, 16, 1255–1262. [Google Scholar] [CrossRef]
- Jan, C.-I.; Tsai, W.C.; Harn, H.J.; Shyu, W.C.; Liu, M.C.; Lu, H.M.; Chiu, S.C.; Cho, D.Y. Predictors of Response to Autologous Dendritic Cell Therapy in Glioblastoma Multiforme. Front. Immunol. 2018, 9, 727. [Google Scholar] [CrossRef]
- Lötsch, D.D.; Ghanim, B.; Laaber, M.; Wurm, G.; Weis, S.; Lenz, S.; Webersinke, G.; Pichler, J.; Berger, W.; Spiegl-Kreinecker, S. Prognostic significance of telomerase-associated parameters in glioblastoma: Effect of patient age. Neuro Oncol. 2013, 15, 423–432. [Google Scholar] [CrossRef] [PubMed]
- Lee, E.Q.; Kaley, T.J.; Duda, D.G.; Schiff, D.; Lassman, A.B.; Wong, E.T.; Mikkelsen, T.; Purow, B.W.; Muzikansky, A.; Ancukiewicz, M.; et al. A Multicenter, Phase II, Randomized, Noncomparative Clinical Trial of Radiation and Temozolomide with or without Vandetanib in Newly Diagnosed Glioblastoma Patients. Clin. Cancer Res. 2015, 21, 3610–3618. [Google Scholar] [CrossRef] [PubMed]
- Michaelsen, S.R.; Christensen, I.J.; Grunnet, K.; Stockhausen, M.-T.; Broholm, H.; Kosteljanetz, M.; Poulsen, H.S. Clinical variables serve as prognostic factors in a model for survival from glioblastoma multiforme: An observational study of a cohort of consecutive non-selected patients from a single institution. BMC Cancer 2013, 13, 402. [Google Scholar] [CrossRef]
- Omuro, A.A.; Beal, K.; Gutin, P.; Karimi, S.; Correa, D.D.; Kaley, T.J.; DeAngelis, L.M.; Chan, T.A.; Gavrilovic, I.T.; Nolan, C.; et al. Phase II study of bevacizumab, temozolomide, and hypofractionated stereotactic radiotherapy for newly diagnosed glioblastoma. Clin. Cancer Res. 2014, 20, 5023–5031. [Google Scholar] [CrossRef]
- Reardon, D.A.; Brandes, A.A.; Omuro, A.; Mulholland, P.; Lim, M.; Wick, A.; Baehring, J.; Ahluwalia, M.S.; Roth, P.; Bähr, O.; et al. Effect of Nivolumab vs. Bevacizumab in Patients With Recurrent Glioblastoma: The CheckMate 143 Phase 3 Randomized Clinical Trial. JAMA Oncol. 2020, 6, 1003–1010. [Google Scholar] [CrossRef]
- Roodakker, K.R.; Elsir, T.; Edqvist, P.H.D.; Hagerstrand, D.; Carison, J.; Lysiak, M.; Henriksson, R.; Ponten, F.; Rosell, J.; Soderkvist, P.; et al. PROX1 is a novel pathway-specific prognostic biomarker for high-grade astrocytomas; results from independent glioblastoma cohorts stratified by age and IDH mutation status. Oncotarget 2016, 7, 72431–72442. [Google Scholar] [CrossRef]
- Srividya, M.R.; Thota, B.; Arivazhagan, A.; Thennarasu, K.; Balasubramaniam, A.; Chandramouli, B.A.; Hegde, A.S.; Santosh, V. Age-dependent prognostic effects of EGFR/p53 alterations in glioblastoma: Study on a prospective cohort of 140 uniformly treated adult patients. J. Clin. Pathol. 2010, 63, 687. [Google Scholar] [CrossRef]
- Tini, P.; Cerase, A.; Cevenini, G.; Carbone, S.F.; Miracco, C.; Pirtoli, L. Epidermal Growth Factor Receptor Expression May Correlate with Survival Through Clinical and Radiological Features of Aggressiveness in Glioblastoma Treated with Radiochemotherapy. Anticancer Res. 2015, 35, 4117. [Google Scholar] [PubMed]
- Weller, M.; Tabatabai, G.; Kästner, B.; Felsberg, J.; Steinbach, J.P.; Wick, A.; Schnell, O.; Hau, P.; Herrlinger, U.; Sabel, M.C.; et al. MGMT Promoter Methylation Is a Strong Prognostic Biomarker for Benefit from Dose-Intensified Temozolomide Rechallenge in Progressive Glioblastoma: The DIRECTOR Trial. Clin. Cancer Res. 2015, 21, 2057–2064. [Google Scholar] [CrossRef] [PubMed]
- Wirsching, H.G.; Tabatabai, G.; Roelcke, U.; Hottinger, A.F.; Jörger, F.; Schmid, A.; Plasswilm, L.; Schrimpf, D.; Mancao, C.; Capper, D.; et al. Bevacizumab plus hypofractionated radiotherapy versus radiotherapy alone in elderly patients with glioblastoma: The randomized, open-label, phase II ARTE trial. Ann. Oncol. 2018, 29, 1423–1430. [Google Scholar] [CrossRef] [PubMed]
- Miletic, H.; Niclou, S.P.; Johansson, M.; Bjerkvig, R. Anti-VEGF therapies for malignant glioma: Treatment effects and escape mechanisms. Expert Opin. Ther. Targets 2009, 13, 455–468. [Google Scholar] [CrossRef]
- Duda, D.G.; Willett, C.G.; Ancukiewicz, M.; Tomaso, E.; Shah, M.; Czito, B.G.; Bentley, R.; Poleski, M.; Lauwers, G.Y.; Carroll, M.; et al. Plasma Soluble VEGFR-1 Is a Potential Dual Biomarker of Response and Toxicity for Bevacizumab with Chemoradiation in Locally Advanced Rectal Cancer. Oncologist 2010, 15, 577–583. [Google Scholar] [CrossRef]
- Jain, R.K.; Duda, D.G.; Willett, C.G.; Sahani, D.V.; Zhu, A.X.; Loeffler, J.S.; Batchelor, T.T.; Sorensen, A.G. Biomarkers of response and resistance to antiangiogenic therapy. Nat. Rev. Clin. Oncol. 2009, 6, 327–338. [Google Scholar] [CrossRef]
- Groot, J.F.D.; Lamborn, K.R.; Chang, S.M.; Gilbert, M.R.; Cloughesy, T.F.; Aldape, K.; Yao, J.; Jackson, E.F.; Lieberman, F.; Robins, H.I.; et al. Phase II Study of Aflibercept in Recurrent Malignant Glioma: A North American Brain Tumor Consortium Study. J. Clin. Oncol. 2011, 29, 2689–2695. [Google Scholar] [CrossRef]
- de Groot, J.F.; Piao, Y.; Tran, H.; Gilbert, M.; Wu, H.-K.; Liu, J.; Bekele, B.N.; Cloughesy, T.; Mehta, M.; Robins, H.I.; et al. Myeloid Biomarkers Associated with Glioblastoma Response to Anti-VEGF Therapy with Aflibercept. Clin. Cancer Res. 2011, 17, 4872–4881. [Google Scholar] [CrossRef]
- Michael, A.; Relph, K.; Pandha, H. Emergence of potential biomarkers of response to anti-angiogenic anti-tumour agents. Int. J. Cancer 2010, 127, 1251–1258. [Google Scholar] [CrossRef]
- Hao, C.; Chen, G.; Zhao, H.; Li, Y.; Chen, J.; Zhang, H.; Li, S.; Zhao, Y.; Chen, F.; Li, W.; et al. PD-L1 Expression in Glioblastoma, the Clinical and Prognostic Significance: A Systematic Literature Review and Meta-Analysis. Front. Oncol. 2020, 10, 1015. [Google Scholar] [CrossRef] [PubMed]
- Wu, C.; Zhu, Y.; Jiang, J.; Zhao, J.; Zhang, X.-G.; Xu, N. Immunohistochemical localization of programmed death-1 ligand-1 (PD-L1) in gastric carcinoma and its clinical significance. Acta Histochem. 2006, 108, 19–24. [Google Scholar] [CrossRef] [PubMed]
- Faghfuri, E.; Faramarzi, M.A.; Nikfar, S.; Abdollahi, M. Nivolumab and pembrolizumab as immune-modulating monoclonal antibodies targeting the PD-1 receptor to treat melanoma. Expert Rev. Anticancer Ther. 2015, 15, 981–993. [Google Scholar] [CrossRef] [PubMed]
- Reck, M.; Rodríguez-Abreu, D.; Robinson, A.G.; Hui, R.; Csőszi, T.; Fülöp, A.; Gottfried, M.; Peled, N.; Tafreshi, A.; Cuffe, S. Pembrolizumab versus chemotherapy for PD-L1–positive non–small-cell lung cancer. N. Engl. J. Med. 2016, 375, 1823–1833. [Google Scholar] [CrossRef]
- Yang, T.; Kong, Z.; Ma, W. PD-1/PD-L1 immune checkpoint inhibitors in glioblastoma: Clinical studies, challenges and potential. Hum. Vaccines Immunother. 2021, 17, 546–553. [Google Scholar] [CrossRef] [PubMed]
- Lee, K.S.; Lee, K.; Yun, S.; Moon, S.; Park, Y.; Han, J.H.; Kim, C.-Y.; Lee, H.S.; Choe, G. Prognostic relevance of programmed cell death ligand 1 expression in glioblastoma. J. Neuro-Oncol. 2018, 136, 453–461. [Google Scholar] [CrossRef]
- Zeng, J.; Zhang, X.-K.; Chen, H.-D.; Zhong, Z.-H.; Wu, Q.-L.; Lin, S.-X. Expression of programmed cell death-ligand 1 and its correlation with clinical outcomes in gliomas. Oncotarget 2016, 7, 8944–8955. [Google Scholar] [CrossRef]
- Kim, Y.S.; Kim, S.H.; Cho, J.; Kim, J.W.; Chang, J.H.; Kim, D.S.; Lee, K.S.; Suh, C.-O. MGMT Gene Promoter Methylation as a Potent Prognostic Factor in Glioblastoma Treated with Temozolomide-Based Chemoradiotherapy: A Single-Institution Study. Int. J. Radiat. Oncol. Biol. Phys. 2012, 84, 661–667. [Google Scholar] [CrossRef]
- Hegi, M.E.; Diserens, A.C.; Gorlia, T.; Hamou, M.F.; de Tribolet, N.; Weller, M.; Kros, J.M.; Hainfellner, J.A.; Mason, W.; Mariani, L.; et al. MGMT gene silencing and benefit from temozolomide in glioblastoma. N. Engl. J. Med. 2005, 352, 997–1003. [Google Scholar] [CrossRef]
- Wick, W.; Gorlia, T.; Bendszus, M.; Taphoorn, M.; Sahm, F.; Harting, I.; Brandes, A.A.; Taal, W.; Domont, J.; Idbaih, A.; et al. Lomustine and Bevacizumab in Progressive Glioblastoma. N. Engl. J. Med. 2017, 377, 1954–1963. [Google Scholar] [CrossRef]
- Gleeson, J.P.; Keane, F.; Keegan, N.M.; Mammadov, E.; Harrold, E.; Alhusaini, A.; Harte, J.; Eakin-Love, A.; O’Halloran, P.J.; MacNally, S.; et al. Similar overall survival with reduced vs. standard dose bevacizumab monotherapy in progressive glioblastoma. Cancer Med. 2020, 9, 469–475. [Google Scholar] [CrossRef] [PubMed]
- Lee, S.M.; Koh, H.-J.; Park, D.-C.; Song, B.J.; Huh, T.-L.; Park, J.-W. Cytosolic NADP+-dependent isocitrate dehydrogenase status modulates oxidative damage to cells. Free Radic. Biol. Med. 2002, 32, 1185–1196. [Google Scholar] [CrossRef]
- Cheng, H.-B.; Yue, W.; Xie, C.; Zhang, R.-Y.; Hu, S.-S.; Wang, Z. IDH1 mutation is associated with improved overall survival in patients with glioblastoma: A meta-analysis. Tumor Biol. 2013, 34, 3555–3559. [Google Scholar] [CrossRef] [PubMed]
- Seshacharyulu, P.; Ponnusamy, M.P.; Haridas, D.; Jain, M.; Ganti, A.K.; Batra, S.K. Targeting the EGFR signaling pathway in cancer therapy. Expert Opin. Ther. Targets 2012, 16, 15–31. [Google Scholar] [CrossRef] [PubMed]
- Muñoz-Hidalgo, L.; San-Miguel, T.; Megías, J.; Monleón, D.; Navarro, L.; Roldán, P.; Cerdá-Nicolás, M.; López-Ginés, C. Somatic copy number alterations are associated with EGFR amplification and shortened survival in patients with primary glioblastoma. Neoplasia 2020, 22, 10–21. [Google Scholar] [CrossRef]
- López-Ginés, C.; Muñoz-Hidalgo, L.; San-Miguel, T.; Megías, J.; Triviño, J.C.; Calabuig, S.; Roldán, P.; Cerdá-Nicolás, M.; Monleón, D. Whole-exome sequencing, EGFR amplification and infiltration patterns in human glioblastoma. Am. J. Cancer Res. 2021, 11, 5543–5558. [Google Scholar]
- Shinojima, N.; Tada, K.; Shiraishi, S.; Kamiryo, T.; Kochi, M.; Nakamura, H.; Makino, K.; Saya, H.; Hirano, H.; Kuratsu, J.-I.; et al. Prognostic Value of Epidermal Growth Factor Receptor in Patients with Glioblastoma Multiforme. Cancer Res. 2003, 63, 6962–6970. [Google Scholar]
- Hatanpaa, K.J.; Burma, S.; Zhao, D.; Habib, A.A. Epidermal growth factor receptor in glioma: Signal transduction, neuropathology, imaging, and radioresistance. Neoplasia 2010, 12, 675–684. [Google Scholar] [CrossRef]
- Chen, J.-R.; Xu, H.-Z.; Yao, Y.; Qin, Z.-Y. Prognostic value of epidermal growth factor receptor amplification and EGFRvIII in glioblastoma: Meta-analysis. Acta Neurol. Scand. 2015, 132, 310–322. [Google Scholar] [CrossRef]
- Tripathy, K.; Das, B.; Singh, A.K.; Misra, A.; Misra, S.; Misra, S.S. Prognostic Significance of Epidermal Growth Factor Receptor in Patients of Glioblastoma Multiforme. J. Clin. Diagn. Res. 2017, 11, EC05–EC08. [Google Scholar] [CrossRef]
- Quan, A.L.; Barnett, G.H.; Lee, S.-Y.; Vogelbaum, M.A.; Toms, S.A.; Staugaitis, S.M.; Prayson, R.A.; Peereboom, D.M.; Stevens, G.H.J.; Cohen, B.H.; et al. Epidermal growth factor receptor amplification does not have prognostic significance in patients with glioblastoma multiforme. Int. J. Radiat. Oncol. Biol. Phys. 2005, 63, 695–703. [Google Scholar] [CrossRef] [PubMed]
- Westphal, M.; Maire, C.L.; Lamszus, K. EGFR as a Target for Glioblastoma Treatment: An Unfulfilled Promise. CNS Drugs 2017, 31, 723–735. [Google Scholar] [CrossRef] [PubMed]


| Study | Published Year | Histology | Study Design | Treatment | Median Age | No. of Patients | Endpoint/ Outcome | Biomarker Analysed |
|---|---|---|---|---|---|---|---|---|
| Abdullah et al. [20] | 2015 | Newly diagnosed GBM | R | Adjuvant chemotherapy α + Radiotherapy | 83 | 58 | OS | EGFR, TP53 |
| Accomando et al. [21] | 2020 | Recurrent GBM | R | Retroviral treatment Toca 511 + Toca FC | 55 | 56 | OS | Tumour immune signature and cytokine signature |
| Batchelor et al. [22] | 2013 | Newly diagnosed GBM | RCT | TKI (cediranib) + chemoradiotherapy | 57 | 46 | OS | EGFR, PDGFRA, MET and circulatory biomarkers |
| Batchelor et al. [23] | 2017 | Recurrent GBM | Clinical trial | TKI (tandutinib) | 56 | 56 | OS | circulatory biomarkers |
| Beije et al. [24] | 2015 | Recurrent GBM | P | TKI (bev/lomustine) | 57 | 141 | OS | CECs (circulatory epithelial cells) |
| Bloch et al. [25] | 2017 | Newly diagnosed GBM | RCT | Immunotherapy (HSPPC-96Prophage) + chemoradiotherapy | 58 | 46 | OS | MGMT, PDL1 |
| Butowski et al. [26] | 2011 | Newly diagnosed GBM | RCT | TKI (enzastaurin) + chemoradiotherapy | 57 | 66 | OS | MGMT |
| Carvalho et al. [27] | 2021 | Recurrent GBM | R | TKI (bev + irinotecan) | 59 | 40 | OS | c-MET, VEGFR2 |
| Cloughesy et al. [28] | 2017 | Recurrent GBM | RCT | TKI Arm 1 = (onartuzumab + bev) Arm 2 = (Pla + bev) | Arm1 = 57 Arm2 = 55 | Arm1 = 64 Arm 2 = 65 | OS | MGMT |
| Collins et al. [29] | 2014 | Recurrent GBM | R | Alkylating agents (TMZ/PVC) | 53 | 309 | OS | IDH1 |
| Erdem-Eraslan et al. [30] | 2016 | Recurrent GBM | R | TKI (lomustine/bev) | 57 | 148 | OS | MGMT, IDH1 |
| Galanis et al. [31] | 2013 | Recurrent GBM | Clinical trial | TKI (bev/sorafenib) | 55 | 54 | OS | Circulatory biomarkers, CECS |
| Gerstner et al. [32] | 2015 | Recurrent GBM | Cohort study | TKI (cediranib maleate + cilengitide) | 54 | 45 | OS | Circulatory Biomarkers |
| Han et al. [33] | 2014 | Recurrent GBM | Cohort study | Alkylating agents (TMZ) | 53 | 60 | OS | MGMT |
| Jan et al. [34] | 2018 | Newly diagnosed GBM | Cohort study | Immunotherapy (ADCTA vaccine) + chemoradiotherapy | 51.8 * | ADCTA = 27 Reference = 20 | OS | MGMT, IDH1 |
| Lotsch et al. [35] | 2013 | Newly diagnosed GBM | R | NA | 60 * | 100 | OS | MGMT, IDH1 |
| Lee et al. [36] | 2015 | Newly diagnosed GBM | RCT | TKI (vandatinib) + chemoradiotherapy | Arm1 = 55 Arm2 = 59 | Arm1 = 36 Arm 2 = 70 | OS | Circulatory biomarkers |
| Michaelsen et al. [37] | 2013 | Newly diagnosed GBM | P | chemoradiotherapy | 59.2 | 225 | OS | MGMT, EGFR, TP53 |
| Omuro et al. [38] | 2014 | Newly diagnosed GBM | Clinical trial | TKI (bev)+ chemoradiotherapy | 55 | 40 | OS | MGMT |
| Reardon et al. [15] | 2018 | Recurrent GBM | Cohort study | TKI (trebananib/bev) | Cohort 1 = 61.9 Cohort 2 = 63.1 | Cohort1 = 11 Cohort 2 = 37 | OS | Circulatory biomarkers, MGMT, IDH1 |
| Reardon et al. [39] | 2020 | Recurrent GBM | RCT | TKI (nivolumab/bev) | Arm 1 = 55.5 Arm 2 = 55 | Arm1 = 184 Arm 2 = 185 | OS | MGMT |
| Roodakker et al. [40] | 2016 | Newly diagnosed GBM | R | Chemoradiotherapy | N1 = 57 * N2 ≥ 60 N3 ≤ 60 | N1 = 86 N2 = 174 N3 = 80 | OS | MGMT |
| Srividya et al. [41] | 2010 | Newly diagnosed GBM | P | Chemoradiotherapy | 47 | 140 | OS | EGFR |
| Tini et al. [42] | 2015 | NA | R | Chemoradiotherapy | 63 | 144 | OS | EGFR, MGMT |
| Weller et al. [43] | 2015 | Recurrent GBM | RCT | Alkylating agents (TMZ) | Arm 1 = 58 Arm 2 = 56 | Arm1 = 52 Arm 2 = 53 | OS | MGMT |
| Wirsching et al. [44] | 2018 | Newly diagnosed GBM | Clinical trial | TKI (bev) + rad | 70 | 75 | OS | MGMT |
| Study ID | 1.5 Summary of Study Participation | 2.4 Summary Study Attrition | 3.4 Summary of Prognostic Factor Measurement | 4.4 Outcome Measurement Summary | 5.3 Summary of Confounding Factors | 6.4 Statistical Analysis and Reporting Summary |
|---|---|---|---|---|---|---|
| Abdullah 2015 [20] | Low | NA | Low | High | Moderate | Low |
| Accomando 2020 [21] | Low | NA | High | High | High | High |
| Batchelor 2013 [22] | Low | Low | Low | High | Low | Low |
| Batchelor 2017 [23] | Low | Unclear | Low | High | High | Low |
| Beije 2015 [24] | Low | Unclear | Low | Low | High | Low |
| Bloch 2017 [25] | Low | Low | Low | Low | Low | Low |
| Butowski 2011 [26] | Low | Low | Unclear | Low | Low | Low |
| Carvalho 2021 [27] | Low | NA | Low | Low | Low | Low |
| Cloughesy 2017 [28] | Low | Low | Low | High | Low | Low |
| Collins 2014 [29] | Low | NA | Low | Low | Low | Low |
| Erdem-Eraslan 2016 [30] | Low | NA | Low | Low | Low | Low |
| Galanis 2013 [31] | Low | Low | Low | Low | Low | Low |
| Gerstner 2015 [32] | Low | Low | Low | Low | Low | Low |
| Han 2014 [33] | Low | High | Low | Low | Low | Low |
| Jan-18 [34] | Low | Low | Low | Low | Low | Low |
| Lötsch 2013 [35] | High | NA | Low | Low | Low | Low |
| Lee 2015 [36] | Low | Low | Low | High | Low | Low |
| Michaelsen 2013 [37] | Low | Low | Low | Low | Low | Low |
| Omuro 2014 [38] | Low | Low | Low | High | Low | Low |
| Reardon 2018 [15] | Low | Low | Low | Low | Low | Low |
| Reardon 2020 [39] | Low | Low | High | Low | Low | Low |
| Roodakker 2016 [40] | Low | NA | Low | High | Low | Low |
| Srividya 2010 [41] | Low | Low | Low | Low | Low | Low |
| Tini 2015 [42] | Low | NA | Low | High | Low | Low |
| Weller 2015 [43] | Low | Low | Low | Low | Low | Low |
| Wirsching 2018 [44] | Low | Low | Unclear | High | Low | Low |
| Study | Treatment | Biomarker | Outcome |
|---|---|---|---|
| Batchelor et al. 2013 [22] | Chemoradiation + cediranib | sVEGFR1 | High plasma sVEGFR1 at treatment cycle 2/day 1: poor PFS & OS (p < 0.05) |
| Batchelor et al. 2017 [23] | tanutinib | sVEGFR1, plasma PlGF | 1. Decrease in sVEGFR1 at treatment cycle 2/day 1: longer PFS & OS (p = 0.05; 0.01 respectively) 2. Decrease in plasma PlGF at day 10: longer PFS (p = 0.04) |
| Lee et al. 2015 [36] | Chemoradiation + vandatinib | sVEGFR1, plasma PlGF | 1. Longitudinal sVEGFR1 increase: poor OS (p < 0.05) 2. Longitudinal PlGF increase: poor OS (p <0.05) |
| Gerstner et al. 2015 [32] | cediranib maleate + cilengitide | Plasma PlGF | Early PIGF increase (at day 2): longer PFS (p = 0.03) |
| Reardon2018 [15] | trebananib/bevacizumab | Plasma VEGF and Interleukin-8 (IL-8) levels | 1. High plasma VEGF: poor PFS & OS (p < 0.005) 2. High plasma IL-8: shorter OS (p < 0.05) |
| Beije et al. 2015 [24] | bevacizumab (avastin)/bevacizumab and lomustine/lomustine. | Circulatory endothelial cells (CECs) | For single agent lomustine treated patients with higher absolute CEC numbers after 4 and 6 weeks of treatment: longer OS (p = 0.03, p = 0.004 respectively) Absolute CEC numbers in patients receiving bevacizumab plus lomustine or bevacizumab single agent: no OS effect |
| Galanis et al. 2013 [31] | bevacizumab/sorafenib | Circulatory endothelial cells (CECs) | No correlation of baseline CEC values and 6 months PFS |
| Carvalho et al. [27] | bevacizumab | c-Met, VEGFR2 | 1. c-MET overexpression: TTP (p = 0.05) 2. VEGFR2 overexpression: Shorter TTP (p = 0.009) 3. Concomitant overexpression of c-Met and VEGFR2: worse TTP (p = 0.001) 4. Concomitant overexpression of c-Met and VEGFR2: worse OS (p = 0.025) |
| Accomando et al. [21] | Retroviral treatment Toca 511 + Toca FC | Pre-treatment tumour immune signature (in tumour microenvironment), post treatment Cytokine signature (in plasma) | 1. Tumour immune signature was found to be higher in responders than non-responders (p < 0.001) 2. High cytokine signature: improved survival (p < 0.05) |
Publisher’s Note: MDPI stays neutral with regard to jurisdictional claims in published maps and institutional affiliations. |
© 2022 by the authors. Licensee MDPI, Basel, Switzerland. This article is an open access article distributed under the terms and conditions of the Creative Commons Attribution (CC BY) license (https://creativecommons.org/licenses/by/4.0/).
Share and Cite
Sareen, H.; Ma, Y.; Becker, T.M.; Roberts, T.L.; de Souza, P.; Powter, B. Molecular Biomarkers in Glioblastoma: A Systematic Review and Meta-Analysis. Int. J. Mol. Sci. 2022, 23, 8835. https://doi.org/10.3390/ijms23168835
Sareen H, Ma Y, Becker TM, Roberts TL, de Souza P, Powter B. Molecular Biomarkers in Glioblastoma: A Systematic Review and Meta-Analysis. International Journal of Molecular Sciences. 2022; 23(16):8835. https://doi.org/10.3390/ijms23168835
Chicago/Turabian StyleSareen, Heena, Yafeng Ma, Therese M. Becker, Tara L. Roberts, Paul de Souza, and Branka Powter. 2022. "Molecular Biomarkers in Glioblastoma: A Systematic Review and Meta-Analysis" International Journal of Molecular Sciences 23, no. 16: 8835. https://doi.org/10.3390/ijms23168835
APA StyleSareen, H., Ma, Y., Becker, T. M., Roberts, T. L., de Souza, P., & Powter, B. (2022). Molecular Biomarkers in Glioblastoma: A Systematic Review and Meta-Analysis. International Journal of Molecular Sciences, 23(16), 8835. https://doi.org/10.3390/ijms23168835