Article

Pan-Cancer Analysis Identifies CHD5 as a Potential Biomarker for Glioma

1
Laboratory Animal Center, Chongqing Medical University, Chongqing 400016, China
2
The Ministry of Education Key Laboratory of Laboratory Medical Diagnostics, The College of Laboratory Medicine, Chongqing Medical University, Chongqing 400016, China
*
Author to whom correspondence should be addressed.
Int. J. Mol. Sci. 2022, 23(15), 8489; https://doi.org/10.3390/ijms23158489
Submission received: 30 June 2022 / Revised: 19 July 2022 / Accepted: 27 July 2022 / Published: 30 July 2022
(This article belongs to the Section Molecular Oncology)

Abstract

:
The chromodomain helicase DNA binding domain 5 (CHD5) is required for neural development and plays an important role in the regulation of gene expression. Although CHD5 exerts a broad tumor suppressor effect in many tumor types, its specific functions regarding its expression levels, and impact on immune cell infiltration, proliferation and migration in glioma remain unclear. Here, we evaluated the role of CHD5 in tumor immunity in a pan-cancer multi-database using the R language. The Cancer Genome Atlas (TCGA), Genotype Tissue Expression (GTEx), and Cancer Cell Lines Encyclopedia (CCLE) datasets were utilized to determine the role of CHD5 in 33 types of cancers, including the expression level, prognosis, tumor progression, and immune microenvironment. Furthermore, we explored the effect of CHD5 on glioma proliferation and migration using the cell counting kit 8 (CCK-8) assay, transwell assays and western blot analysis. The findings from our pan-cancer analysis showed that CHD5 was differentially expressed in the tumor tissues as compared to the normal tissues. Survival analysis showed that CHD5 was generally associated with the prognosis of glioblastoma (GBM), low Grade Glioma (LGG) and neuroblastoma, where the low expression of CHD5 was associated with a worse prognosis in glioma patients. Then, we confirmed that the expression level of CHD5 was associated with tumor immune infiltration and tumor microenvironment, especially in glioma. Moreover, si-RNA mediated knockdown of CHD5 promoted the proliferation and migration of glioma cells in vitro. In conclusion, CHD5 was found to be differentially expressed in the pan-cancer analysis and might play an important role in antitumor immunity. CHD5 is expected to be a potential tumor prognostic marker, especially in glioma.

1. Introduction

CHD5, a member of the chromatin remodeling family, consists of nine proteins (CHD1-9) defined by a dual chromatin domain and a SWI/SNF-like ATP-dependent helical motif. As its closest members CHD3 and CHD4, CHD5 have a tandem PHD structure and are involved in the regulation of chromatin structure and transcription. Previous studies have suggested that PHD might be a “reader for specific modified or unmodified histones” [1,2,3,4,5].
Previous experimental data reported that CHD5 was closely associated with various types of malignancy. Downregulation of CHD5 has been shown to stimulate DNA damage response and predict poor prognosis in pancreatic cancer patients [6]. CHD5 shows low expression levels and exerts inhibitory effects in gastric cancer and leukemia [7,8]. CHD5 inhibits the progression in NSCLC, and inhibits the migration and invasion in colorectal cancer cells in vitro [9,10]. Moreover, low expression of CHD5 is known to be associated with adverse clinical and pathological features such as shorter overall and disease-free survival [11,12]. Although CHD5 is currently recognized as a potential biomarker and key mediator in multiple human malignancies, the potential mechanism underlying its antitumor function related to tumor immunity remain unclear.
In this study, we analyzed the expression of CHD5 and its relationship with the prognosis, TMB and MSI in 33 cancer types. In addition, we examined the correlation between CHD5 and the immune microenvironment, immune-related antigens, and immune checkpoint genes. The results from our pan-cancer analysis revealed CHD5 was a tumor suppressor in multiple cancer types, and low expression of CHD5 may reduce the survival time of cancer patients. Furthermore, the knockdown of CHD5 promoted glioma cancer cell proliferation and migration in vitro. In conclusion, CHD5 is a promising therapeutic target in cancer and is a prognostic marker that is associated with immune infiltration in glioma.

2. Results

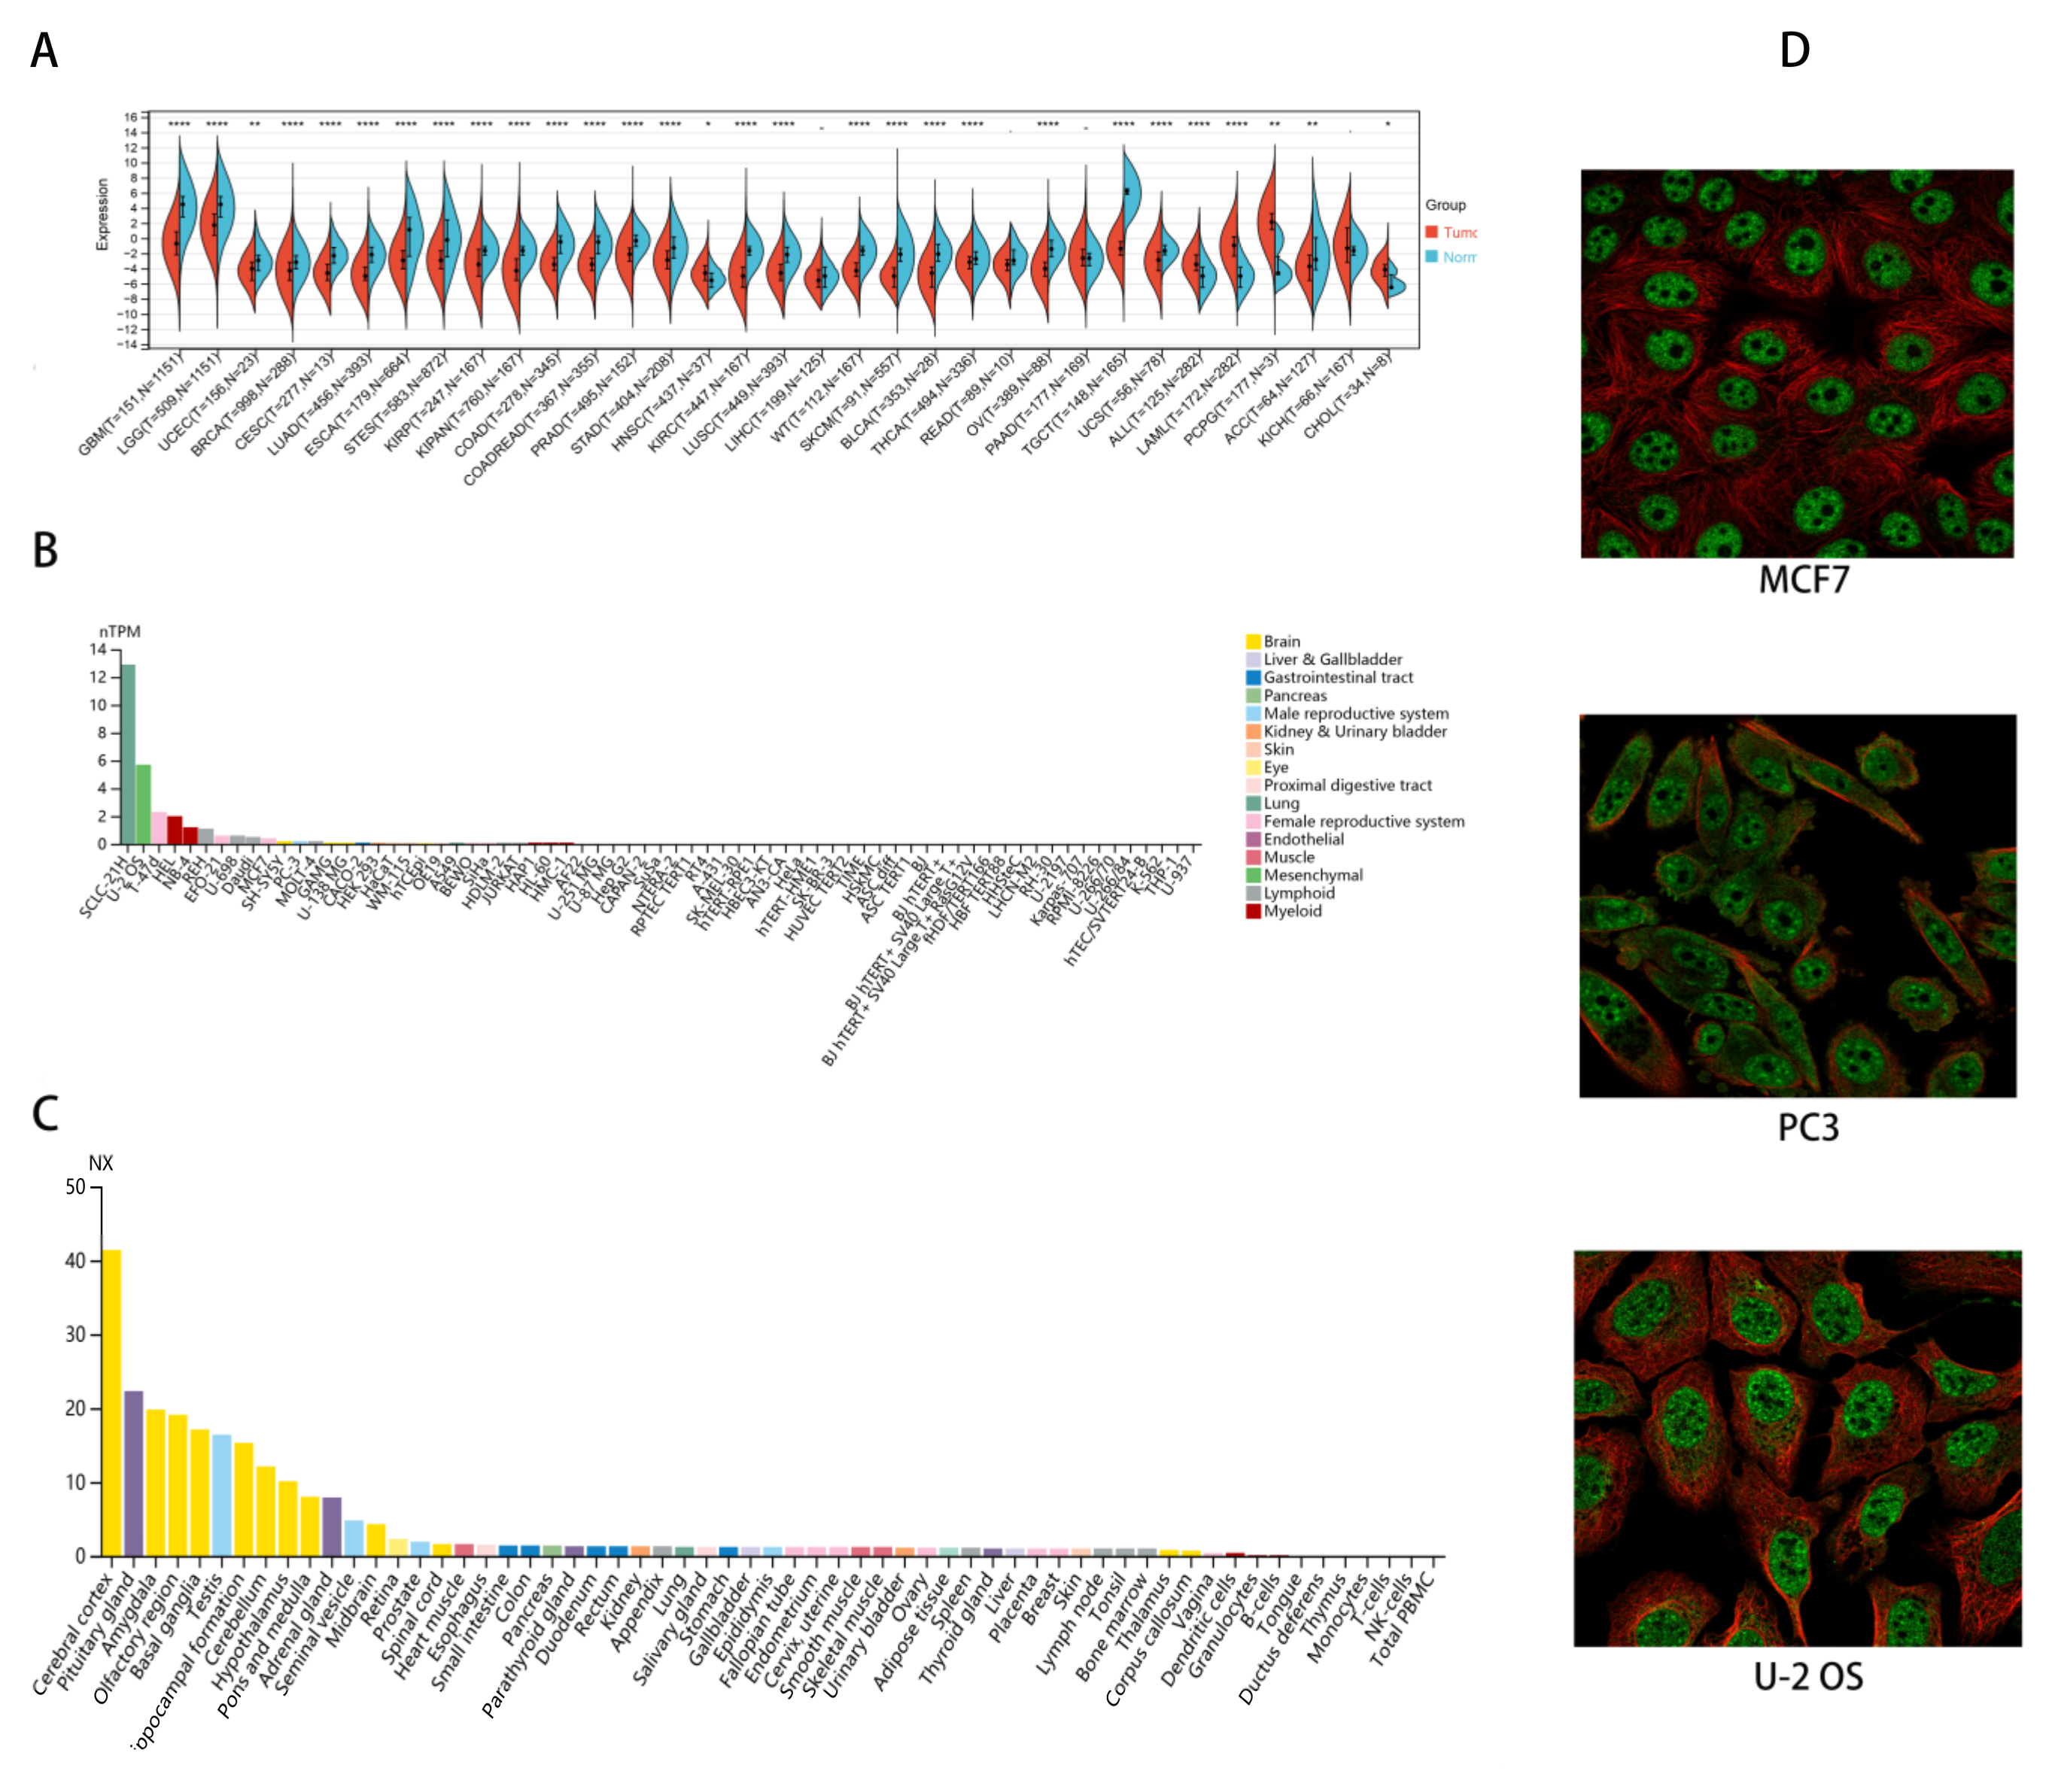
2.1. CHD5 Is Differentially Expressed between Tumor and Normal Tissues

We obtained CHD5 expression data for 33 types of cancers. Differences in the expression of CHD5 between the normal and tumor samples in each tumor type were then calculated. We observed significant down regulation of CHD5 in 25 tumor types, including GBM, Glioma, LGG, UCEC, BRCA, CESC, LUAD, ESCA, STES, KIRP, KIPAN, COAD, COADREAD, PRAD, STAD, KIRC, LUSC, WT, SKCM, BLCA, THCA, OV, TGCT, UCS, and ACC, while there was a significant upregulation in 5 tumor types including HNSC, ALL, LAML, PCPG, and CHOL (p < 0.05) (Figure 1A). It was further found that CHD5 was downregulated in most cancer cells, with higher expression mainly in SCLC-21H (lung), U-2 OS (bone) and T-47d (breast) cancer cell lines (Figure 1B). Interestingly, histopathological studies showed that CHD5 was mainly expressed in the brain (Figure 1C), and it was mainly localized to the nucleoplasm and nuclear speckles within the cells (Figure 1D). Overall, our results showed that CHD5 expression was significantly downregulated in 25 types of cancers relative to the normal tissue and its expression levels were associated with neurological tumors.

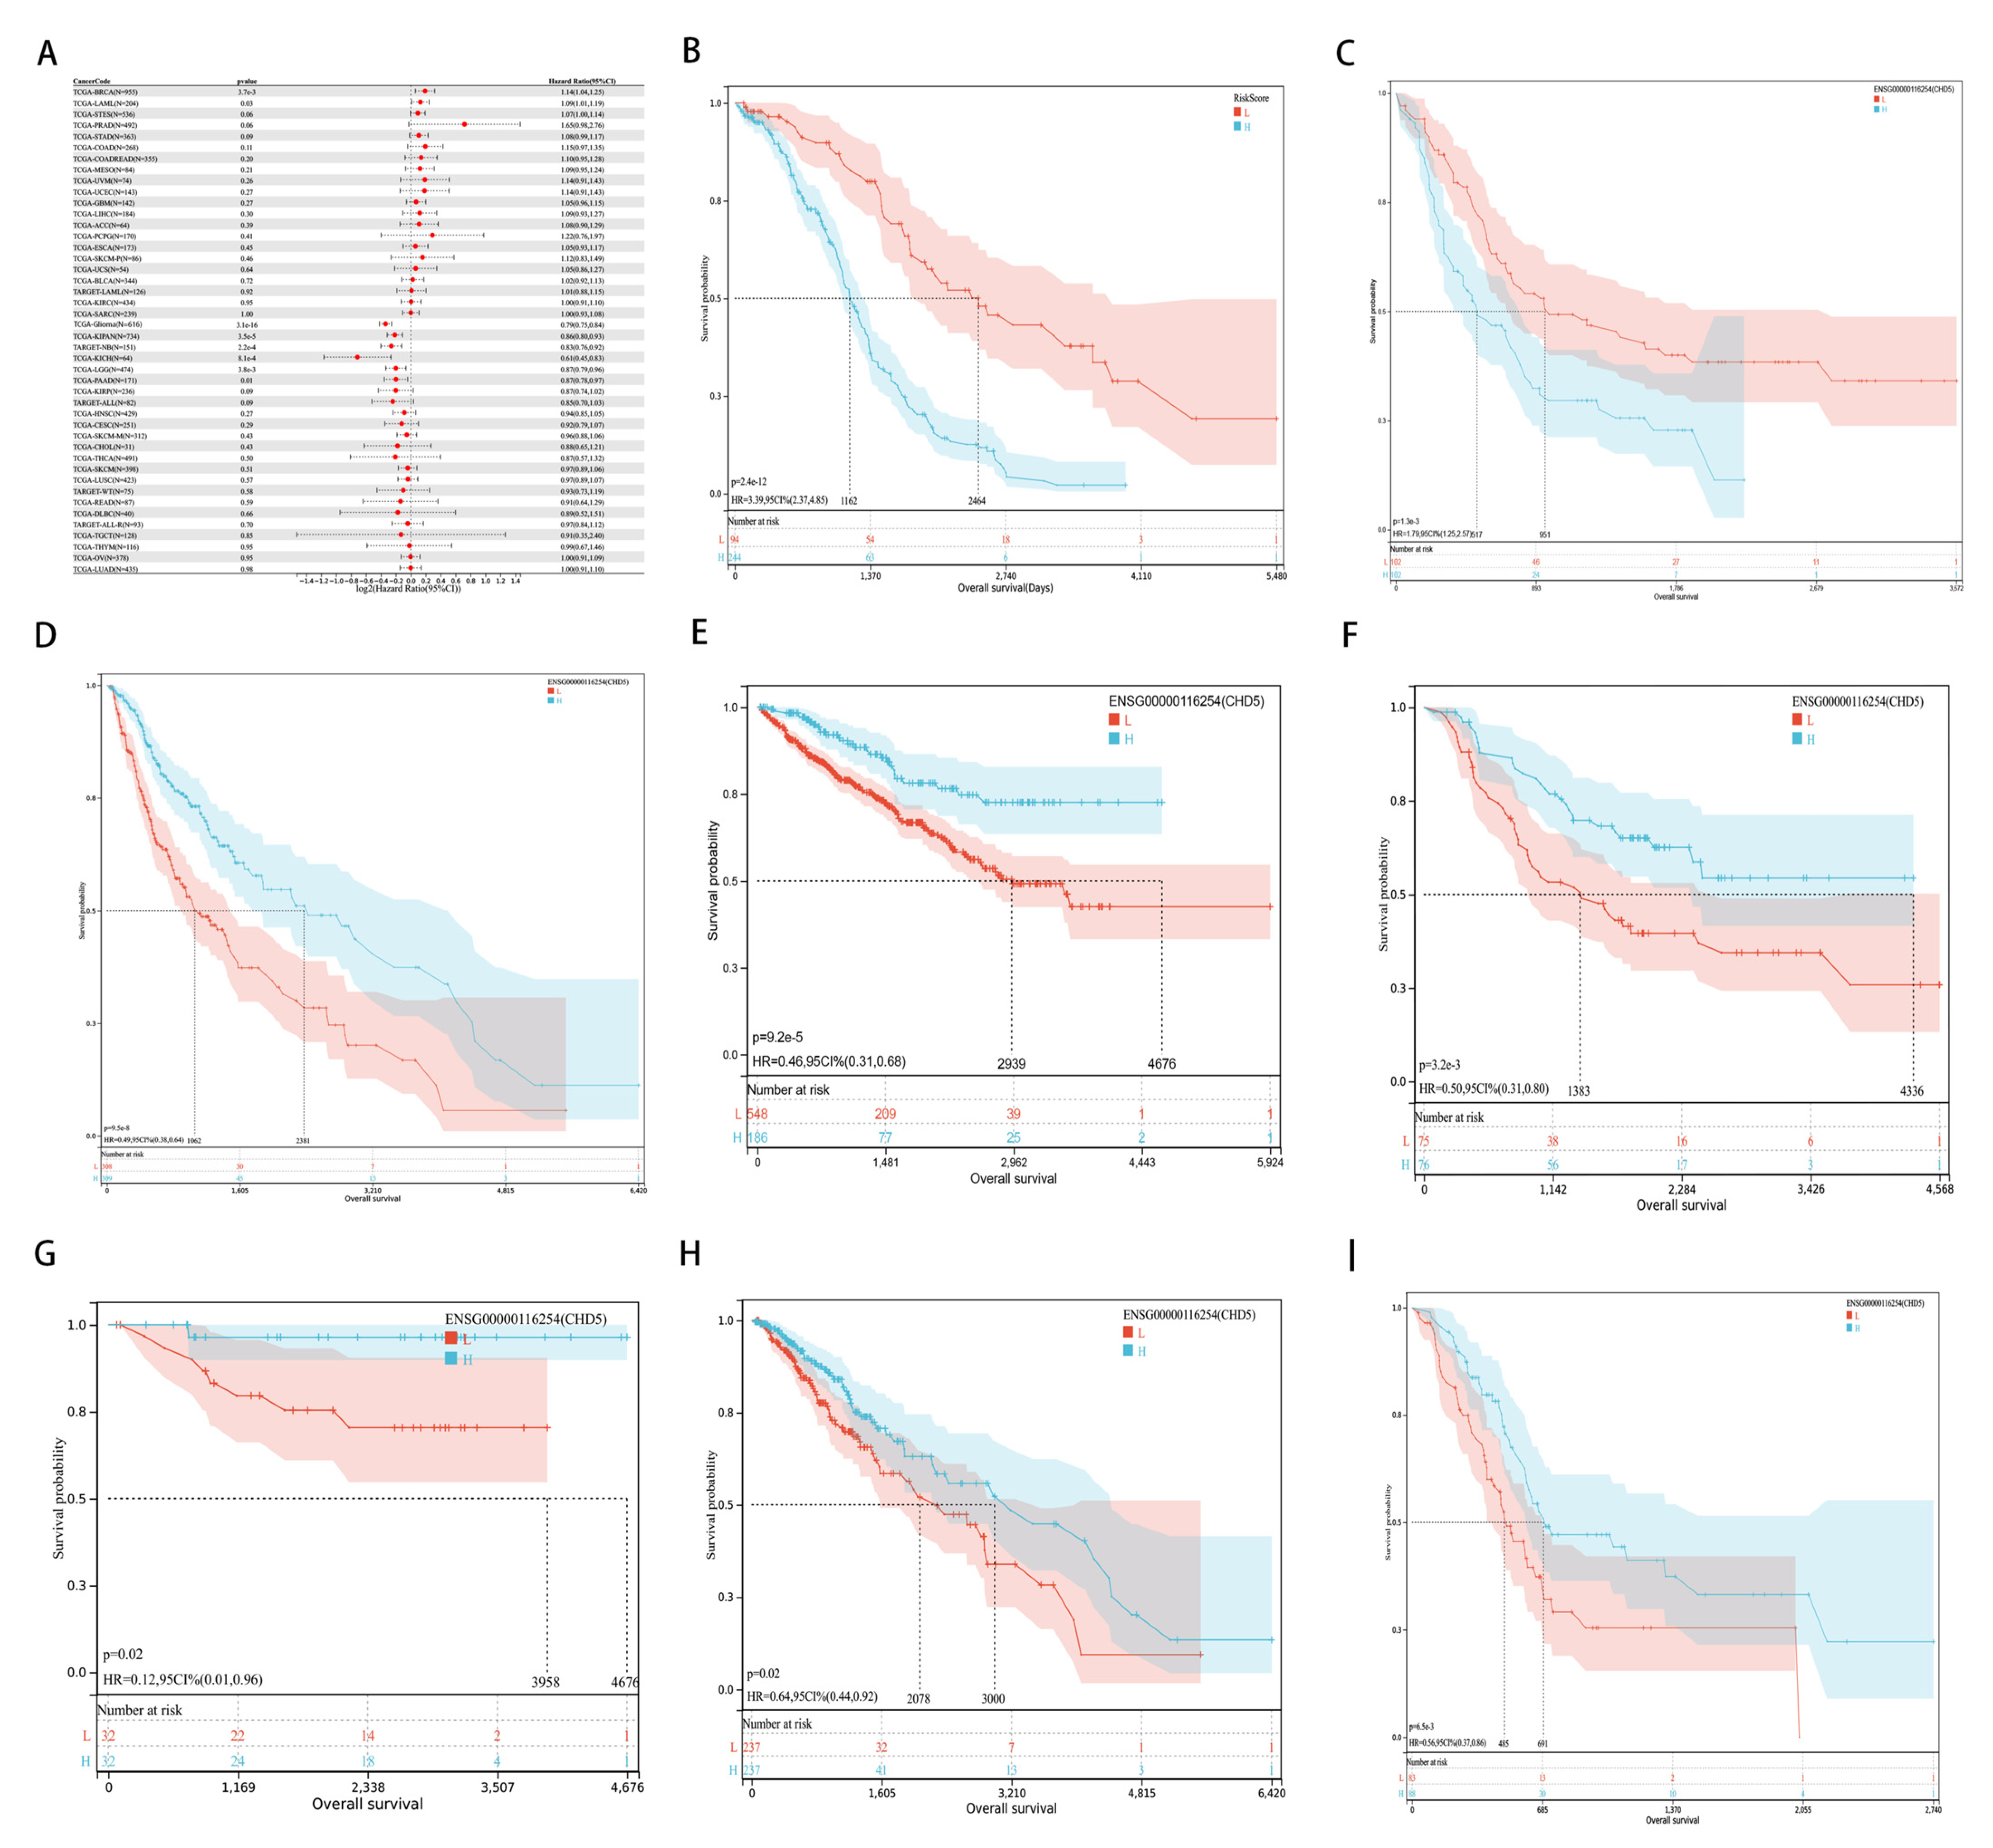
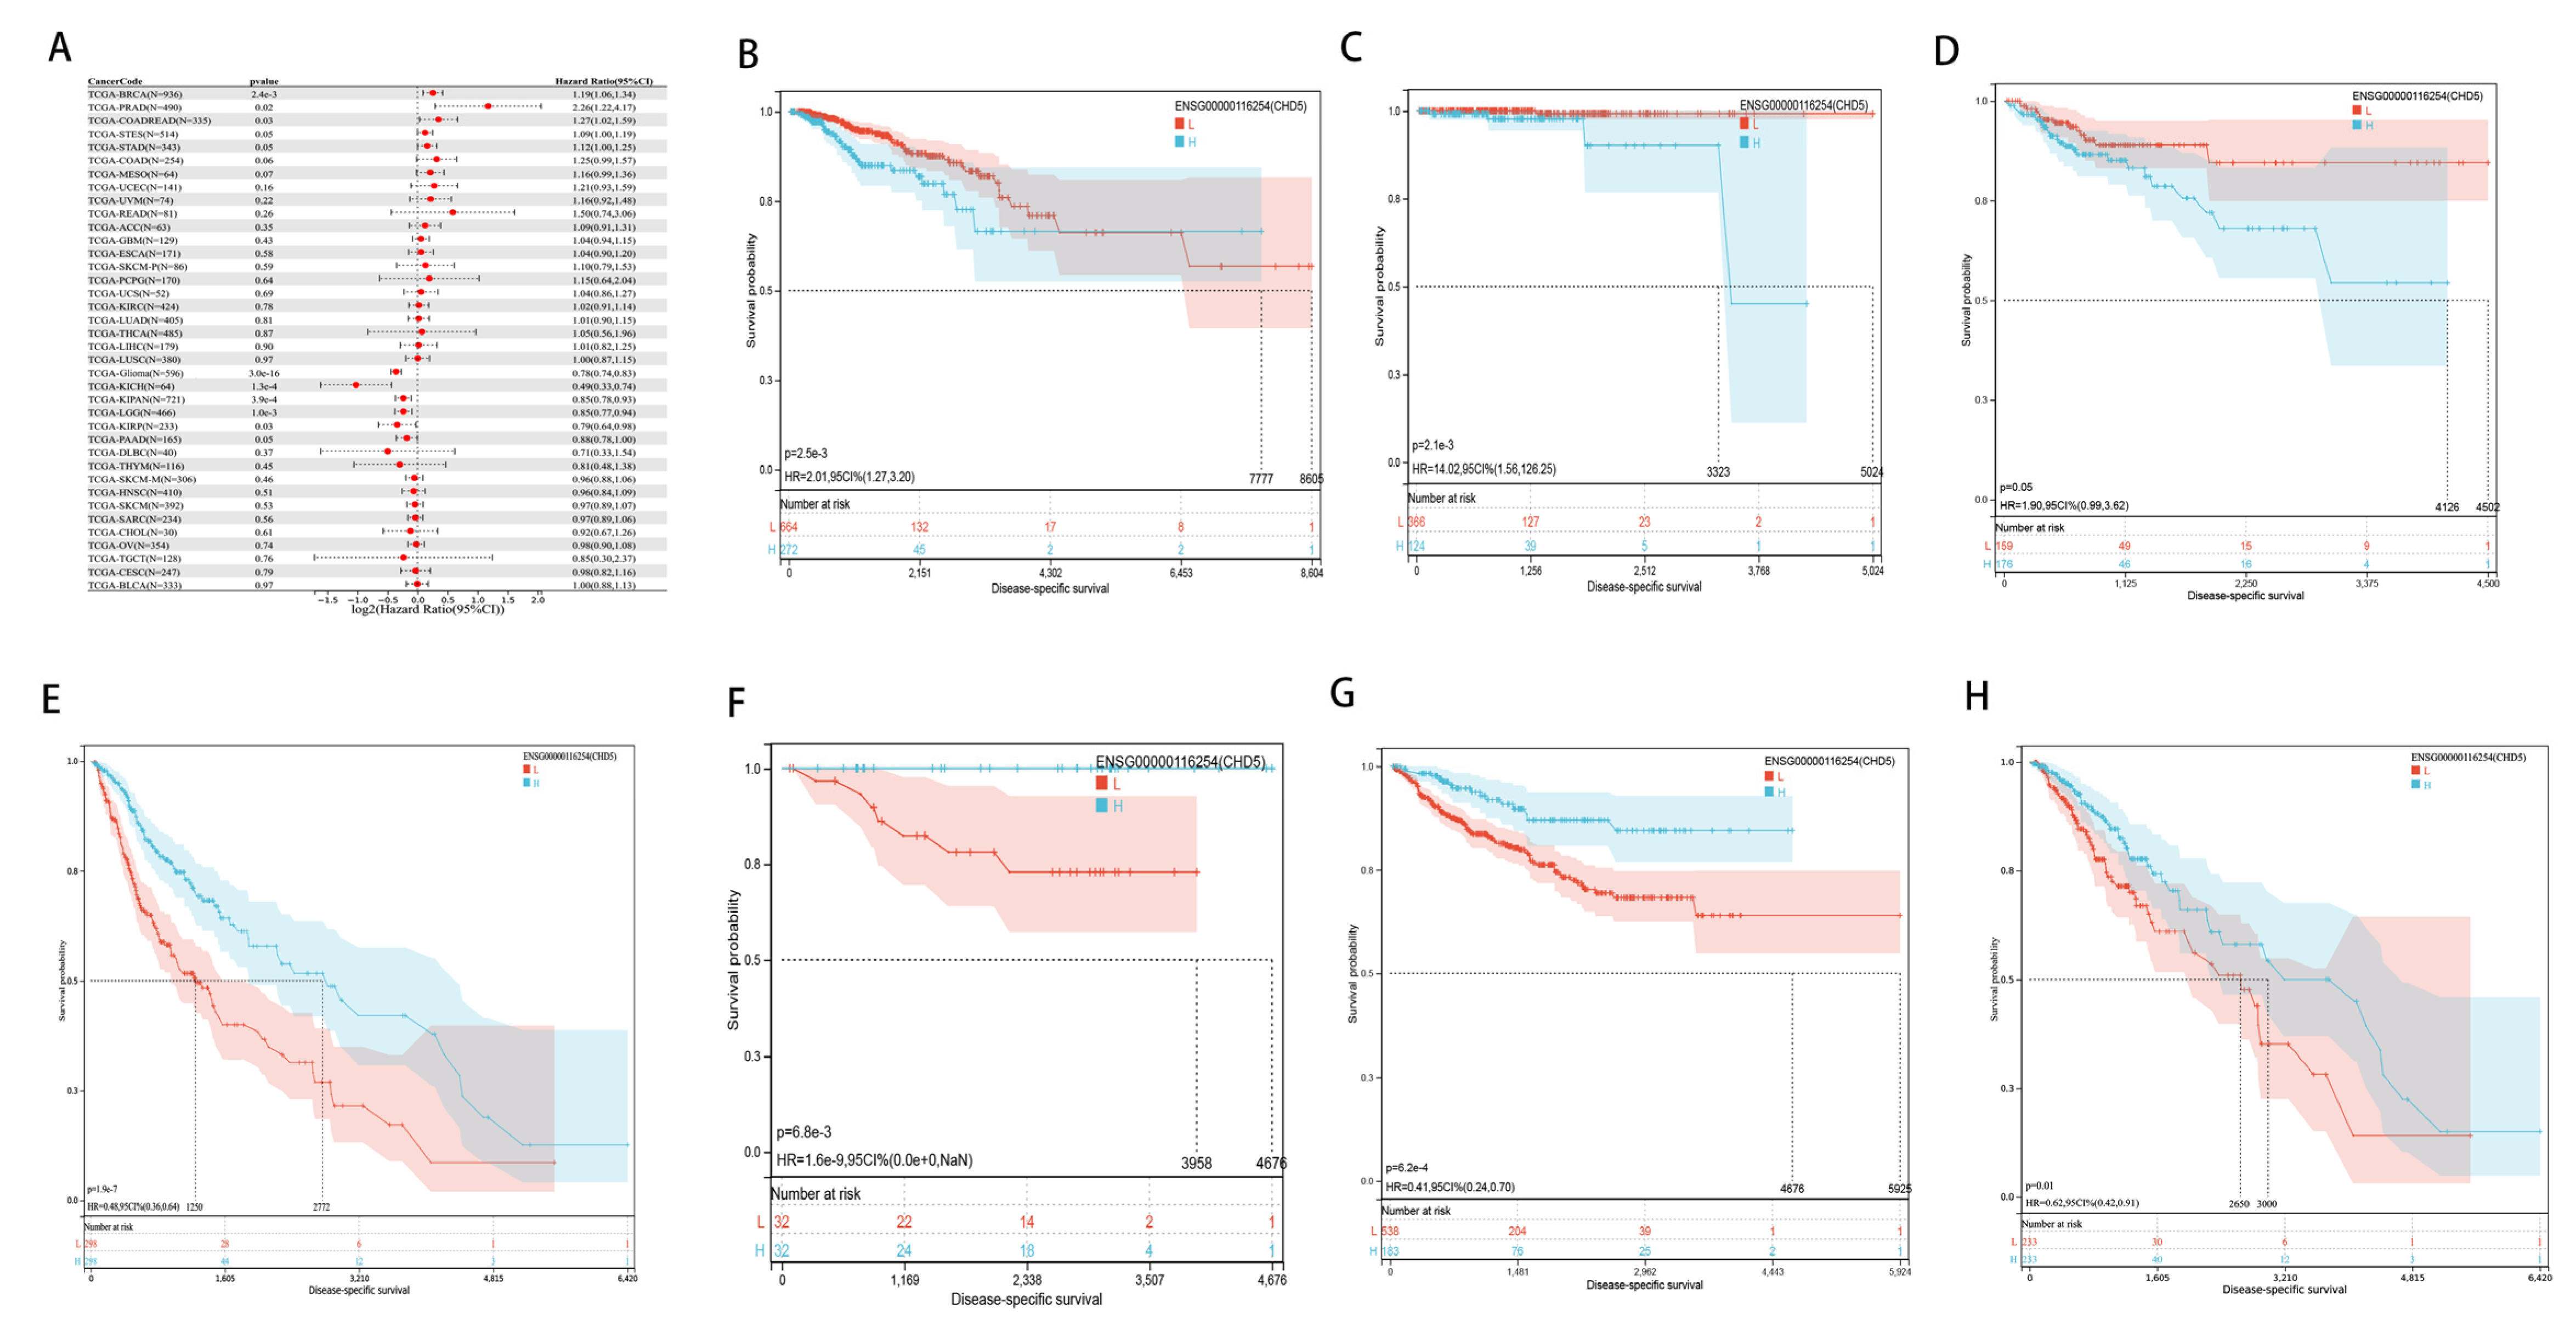
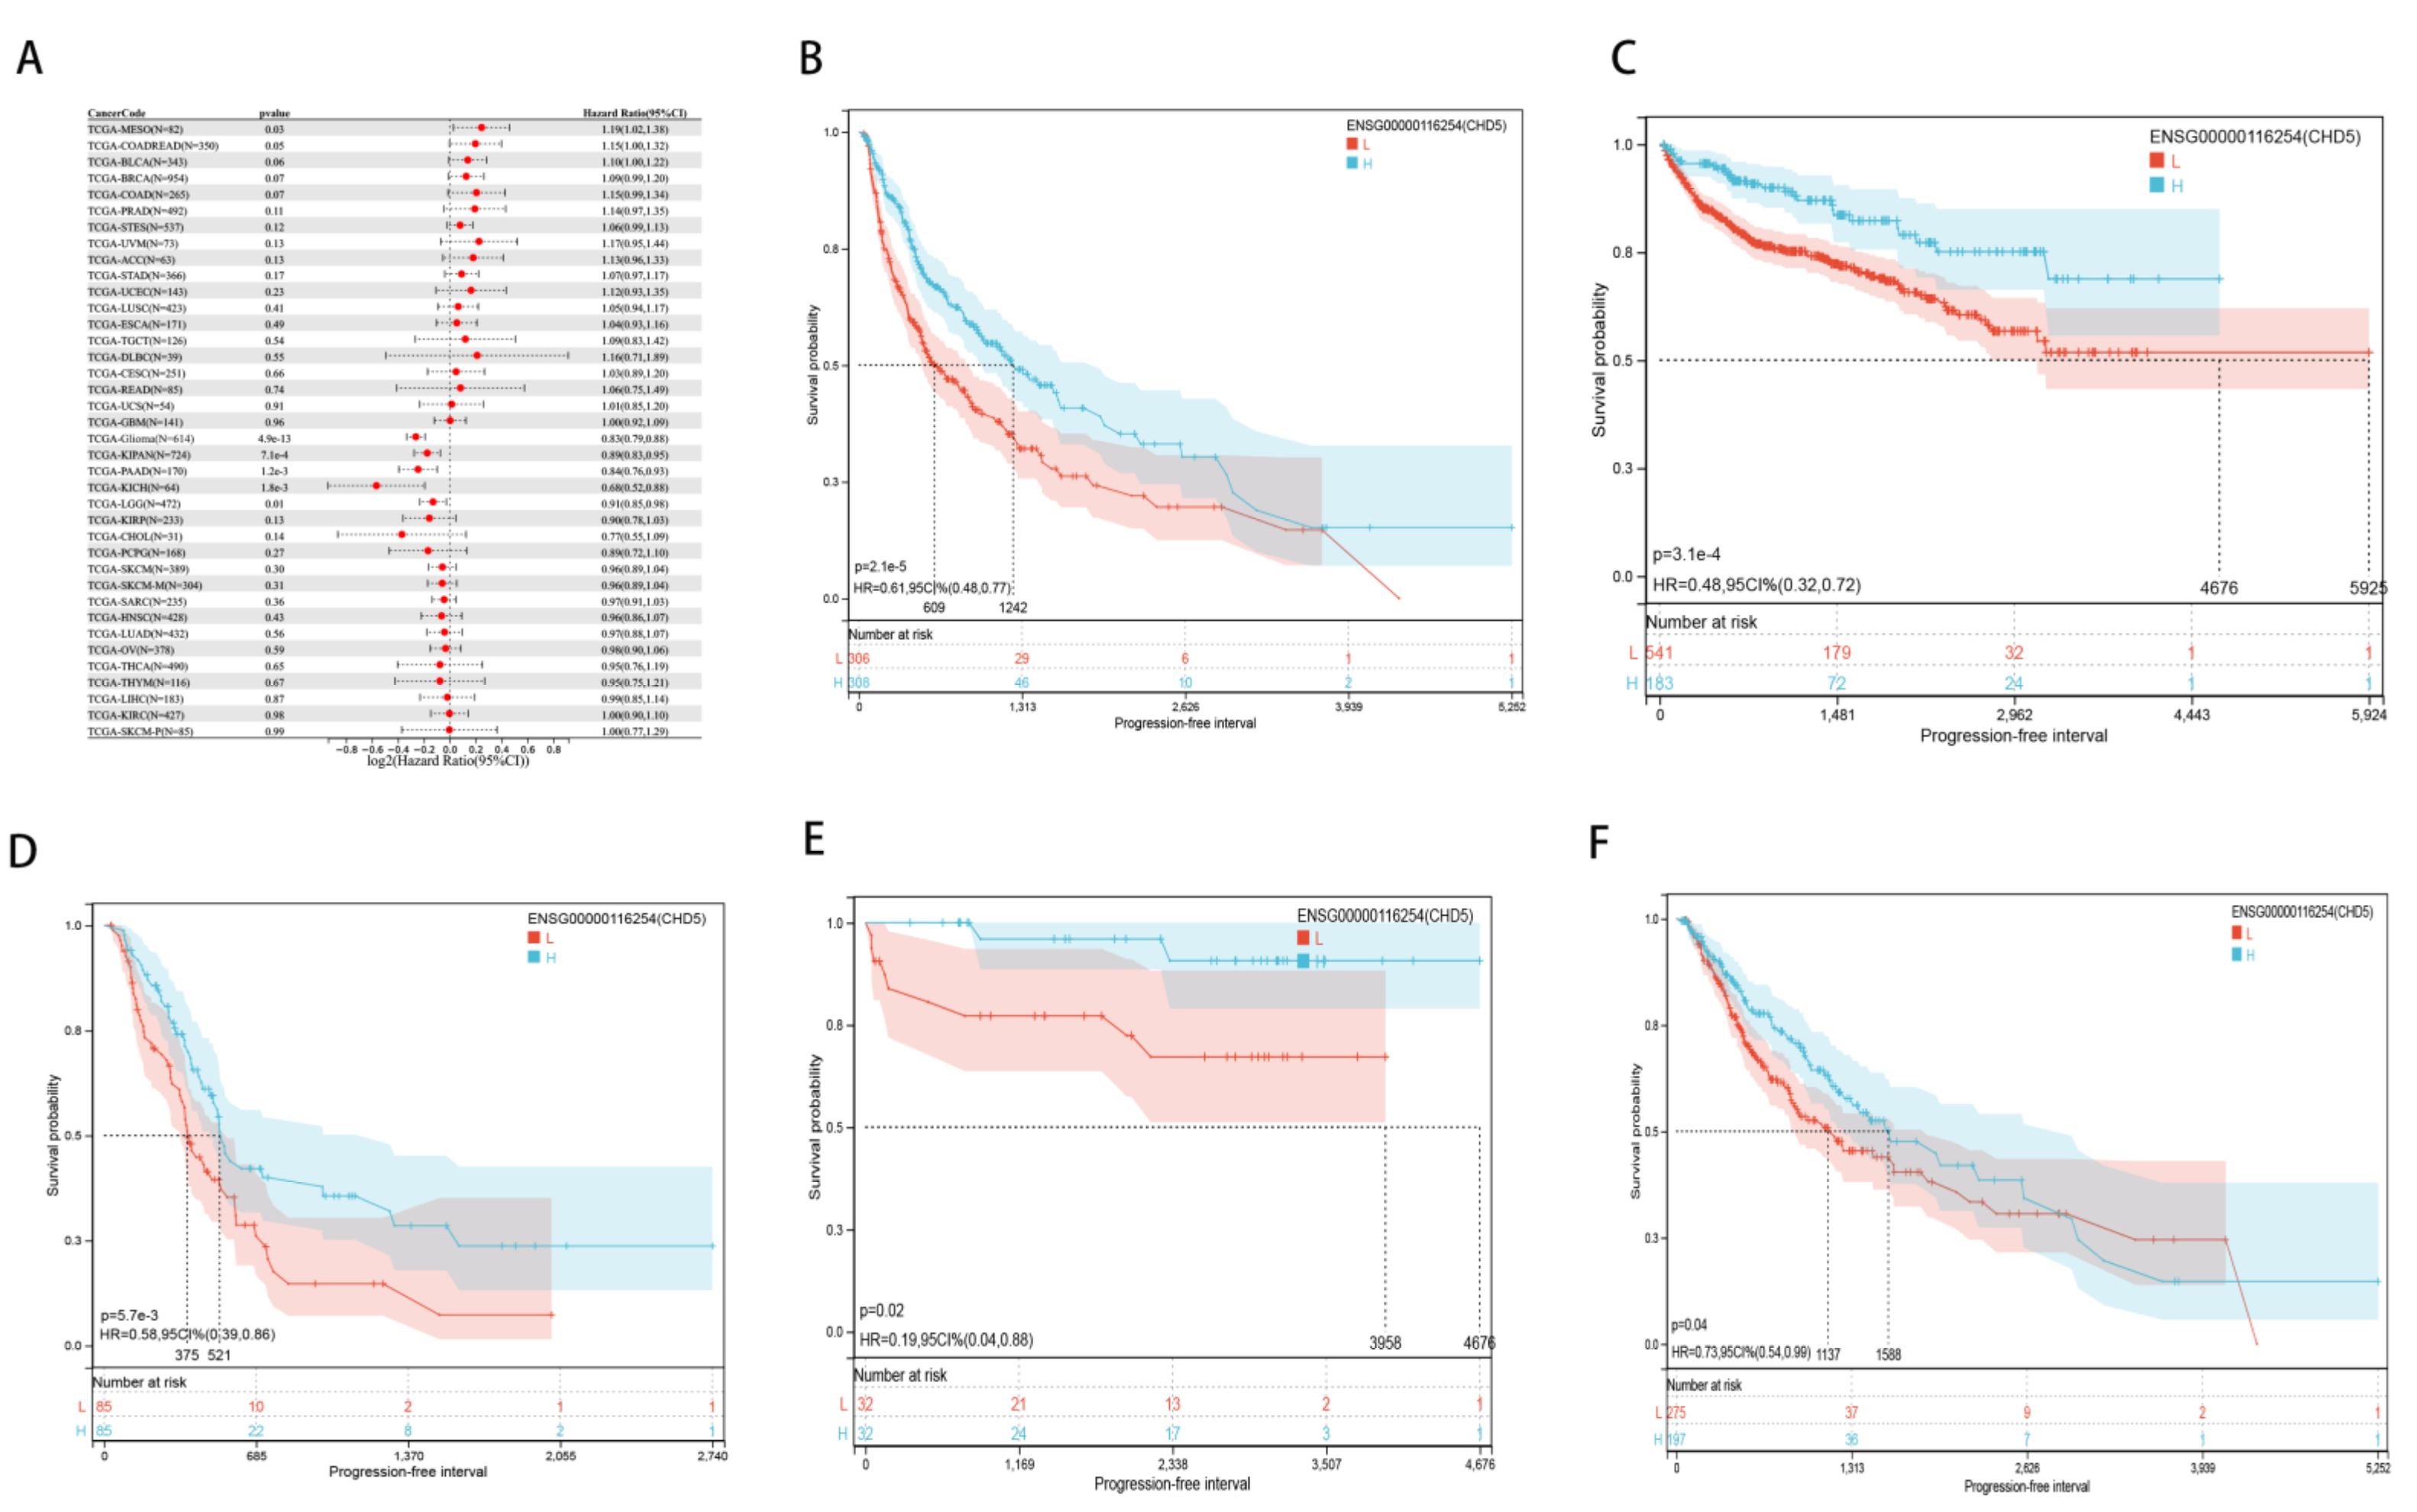
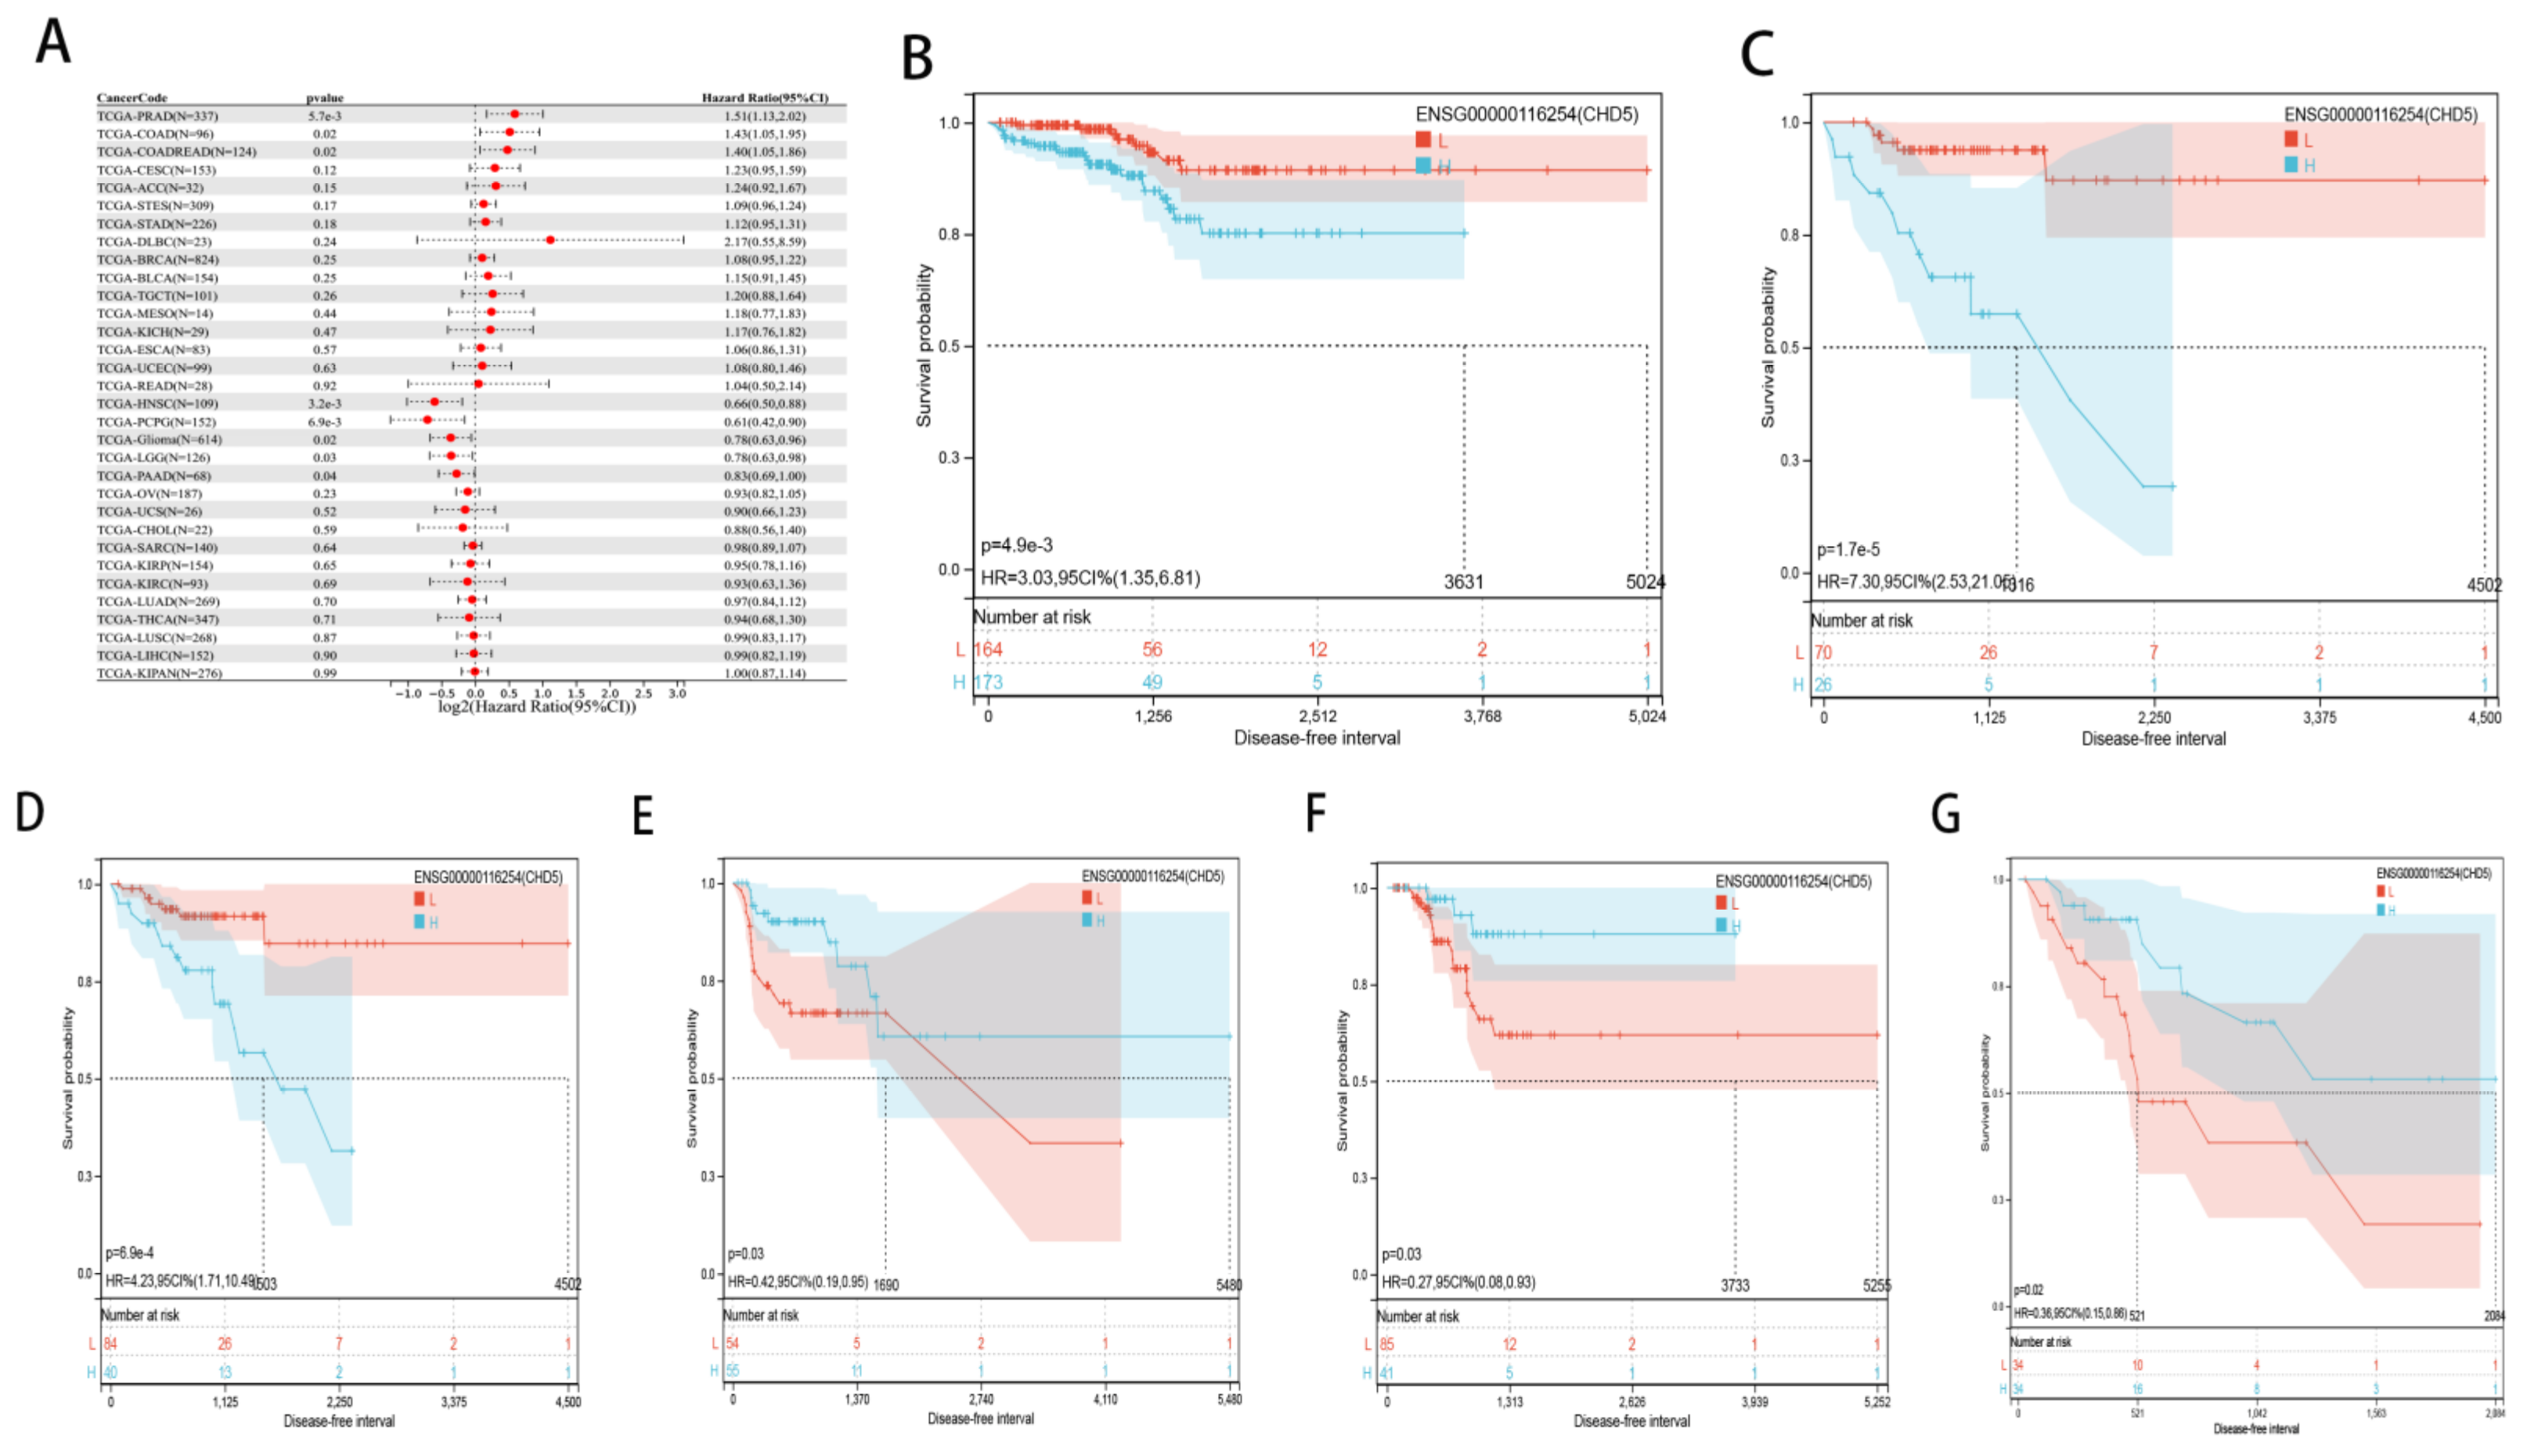
2.2. Pan-Cancer Analysis of the Prognostic Value of CHD5

To further investigate the correlation between CHD5 expression and prognosis, we performed a survival analysis for 33 types of cancers using the following metrics: overall survival (OS), disease-free survival (DSS), disease-free interval (DFI) and progression-free interval (PFI). Univariate Cox analysis showed that CHD5 expression was associated with overall survival (p < 0.05) in BRCA, LAML, Glioma, KIPAN, NB, KICH, LGG, and PAAD (Figure 2A). Furthermore, Kaplan-Meier analysis indicated that the expression of CHD5 was negatively correlated with the survival time in BRCA (Figure 2B, p < 0.01), and LAML (Figure 2C, p = 0.03). However, in Glioma (Figure 2D, p < 0.001), KIPAN (Figure 2E, p < 0.001), NB (Figure 2F, p < 0.001), KICH (Figure 2G, p < 0.001), LGG (Figure 2H, p < 0.05 (p = 0.02) and PAAD (Figure 2P, p <= 0.01) patients, the expression of CHD5 was positively correlated with the survival time. In particular, when the optimal cut-off value was used for grouping, CHD5 could effectively distinguish the high-risk and low-risk groups in KIPAN.
In addition, DSS analysis showed that CHD5 expression was associated with the prognosis of BRCA, PRAD, COADREAD, Glioma, KICH, KIPAN, LGG and KIRP (p < 0.05) (Figure A1A). Among these analyses, the KICH group showed the lowest hazard ratio (HR = 0.49). Kaplan-Meier analysis also showed that high CHD5 expression was associated with poor prognosis in BRCA (Figure A1B, p < 0.01), PRAD (Figure A1C, p < 0.01) and COADREAD (Figure A1D, p = 0.05). However, the opposite association was observed in Glioma (Figure A1E, p < 0.001), KICH (Figure A1F, p < 0.01), KIPAN (Figure A1G, p < 0.001) and LGG (Figure A1H, p= 0.01) patients. Among the BRCA, KIRP, KIPAN and PRAD cancers, the optimal cut-off value had to be taken to obtain effective risk group differentiation. We further detected a correlation between high CHD5 expression and lower DFI in MESO (p = 0.03) and COADREAD (p = 0.05), while in Glioma (p < 0.001), KIPAN (p < 0.001), PAAD (p < 0.01), KICH (p < 0.01) and LGG (p = 0.01), high CHD5 expression was correlated with a higher DFI (Figure A2A). Kaplan-Meier analysis also showed that high CHD5 expression was significantly associated with increased DFI in Glioma (Figure A2B, p < 0.001), KIPAN (Figure A2C, p < 0.001), PAAD (Figure A2D, p < 0.01), KICH (Figure A2E, p = 0.02) and LGG (Figure A2F, p = 0.04).
Forest plots indicated that the expression of CHD5 was significantly correlated with PFI in PRAD (p < 0.001), COAD (p = 0.02), COADREAD (p = 0.02), HNSC (p < 0.01), PCPG (p < 0.01), Glioma (p = 0.02), LGG (p = 0.03), and PAAD (p < 0.04) (Figure A3A). KM survival analysis also revealed that CHD5 expression was associated with reduced PFI in PRAD (Figure A3B, p < 0.01), COAD (Figure A3C, p < 0.001) and COADREAD (Figure A3D, p < 0.001) patients. Meanwhile, increased CHD5 expression was associated with better PFI in individuals with HNSC (Figure A3E, p = 0.03), LGG (Figure A3F, p = 0.03) and PAAD (Figure A3G, p = 0.02). Finally, we summarized and intersected the results from the analysis of these four prognostic data, and found that CHD5 showed strong prognostic correlation in CNS tumors, especially Glioma. Overall, we observed that CHD5 expression might be strongly associated with the prognosis of patients with neurological tumors.

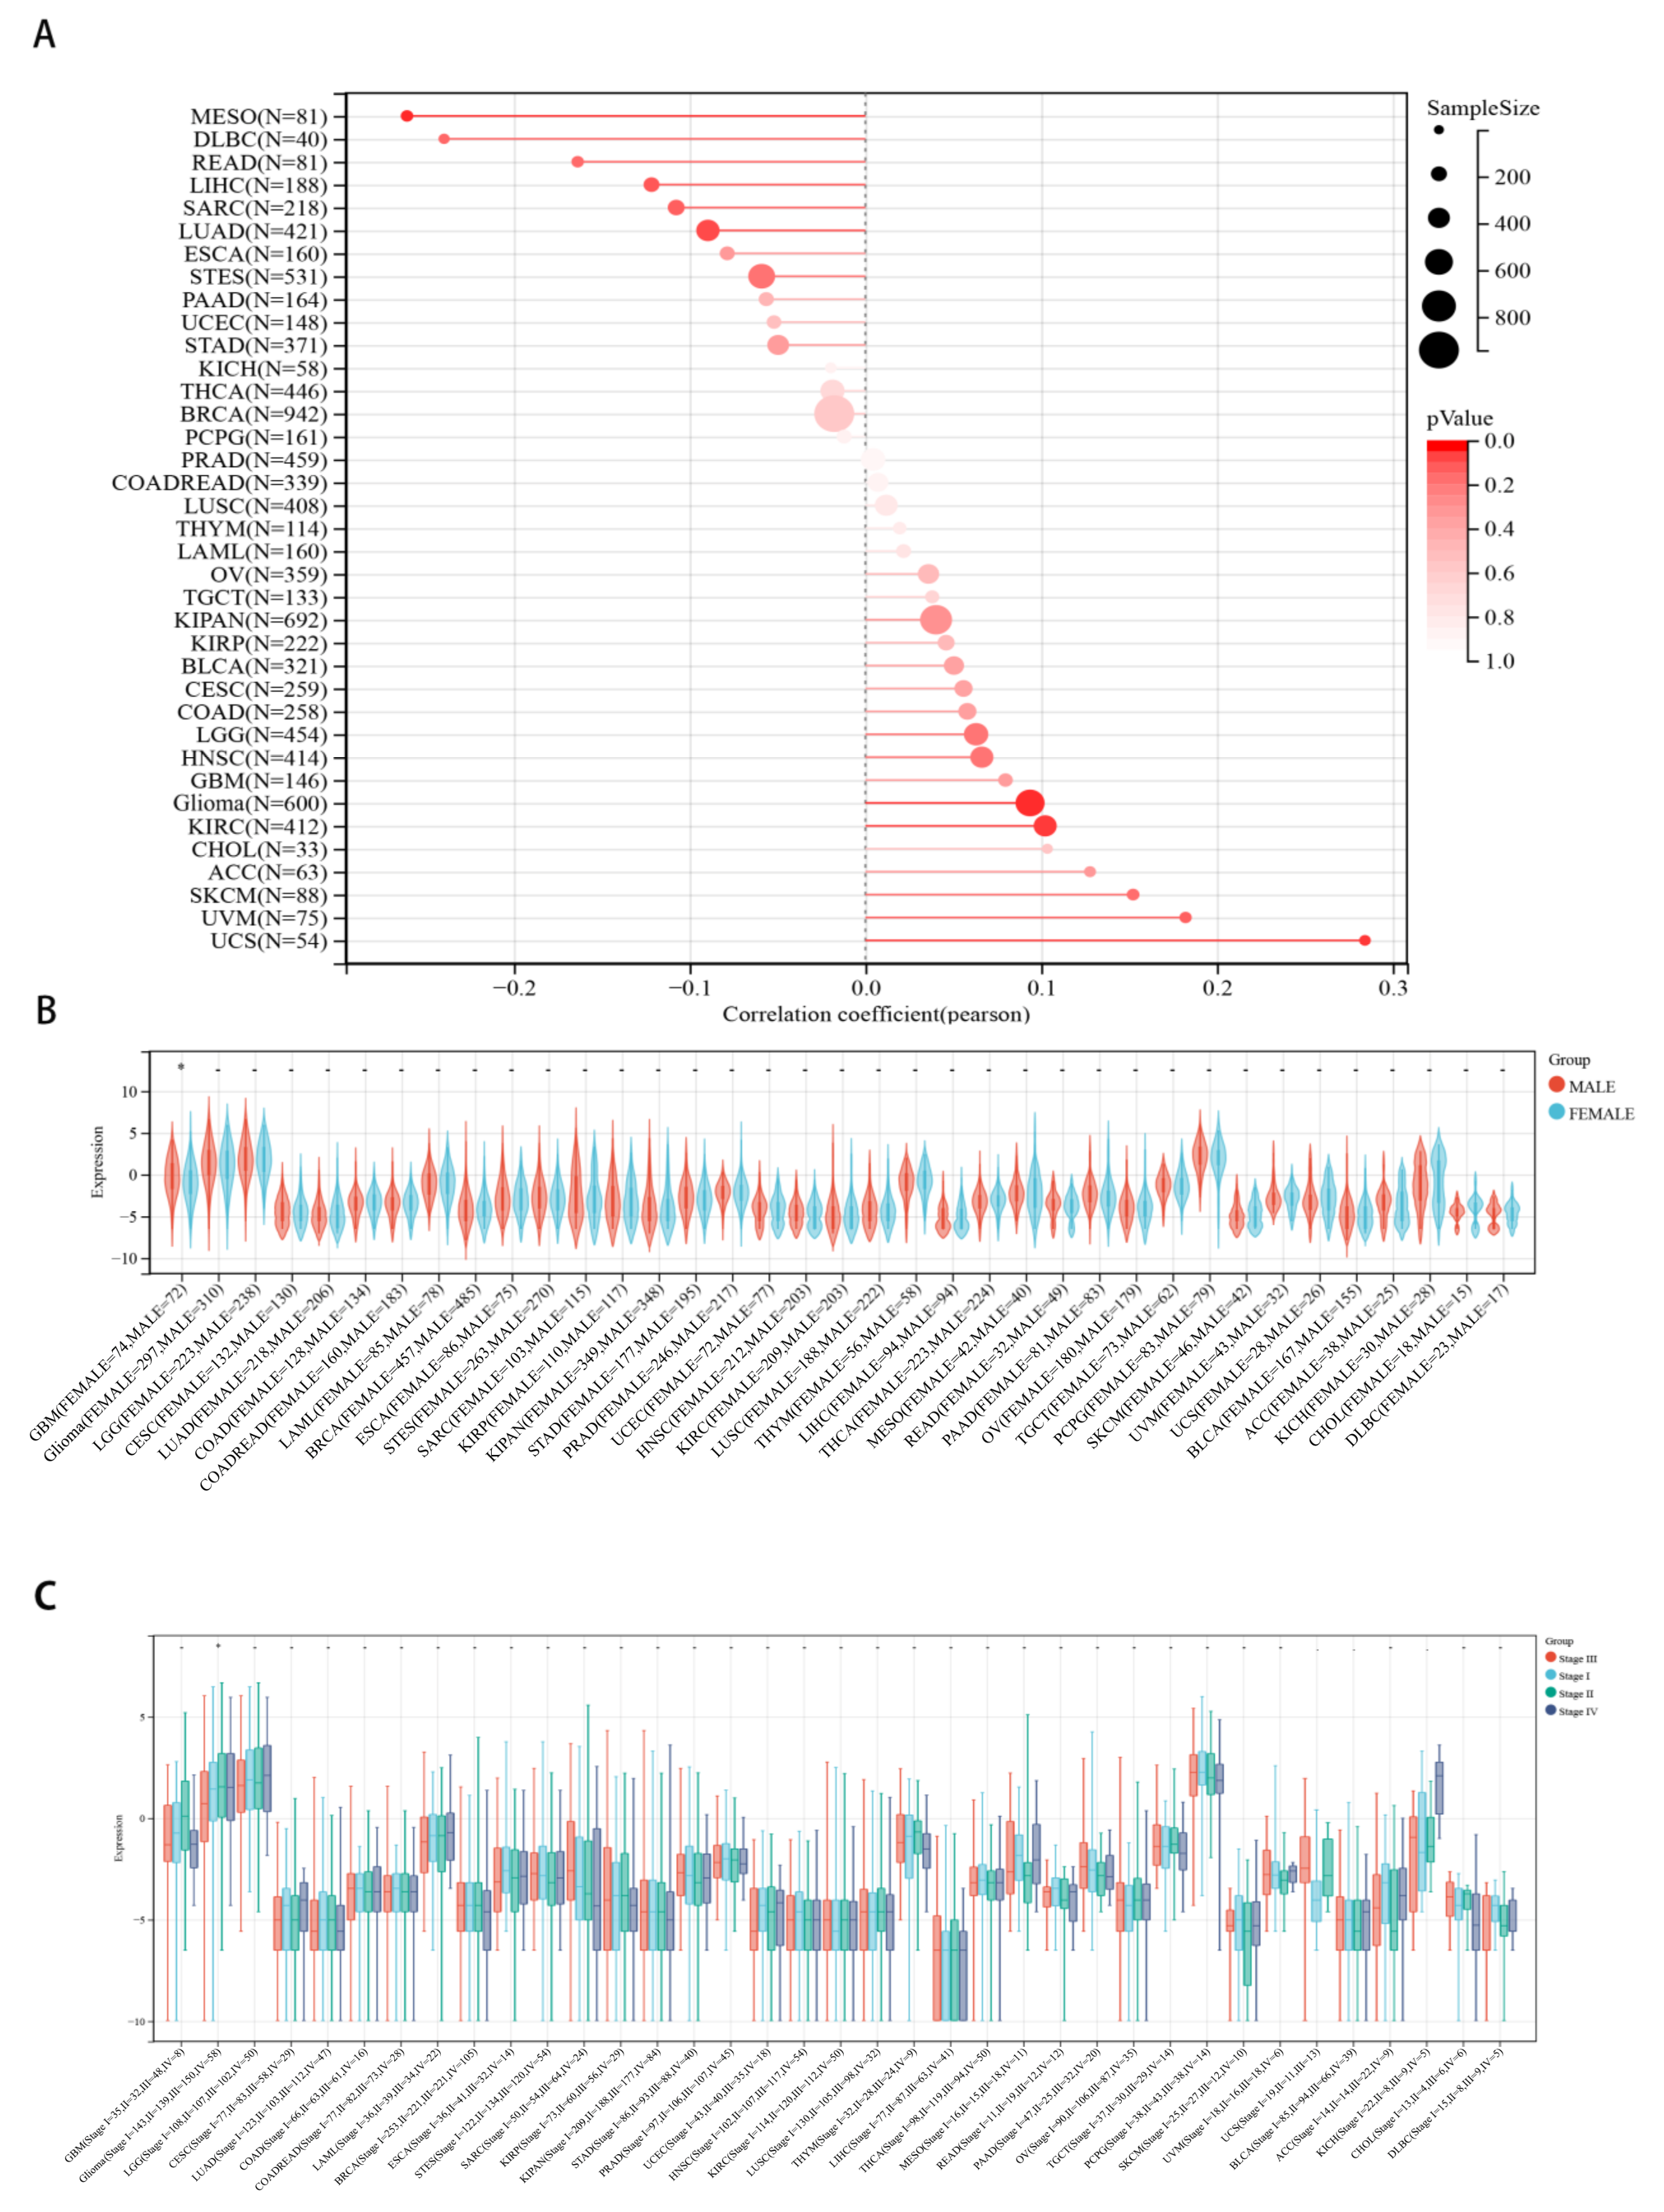
2.3. Correlations between CHD5 Expression and Pan-Cancer Clinicopathological Characteristics

Next, we evaluated the differences in the expression of CHD5 in patients with different tumor types. The results showed that the expression of CHD5 was significantly positively correlated with the age in three tumor types, namely, Glioma (p = 0.02), KIRC (p = 0.03), and UCS (p = 0.03), and was significantly negatively correlated in MESO (p = 0.01) (Figure 3A). In addition, we also observed that the expression of CHD5 in GBM was sex dependent (p < 0.05) (Figure 3B), and significantly differentially expressed (p = 0.04) during different stages of Glioma (Figure 3C). No statistical differences were found in the other cancer types.

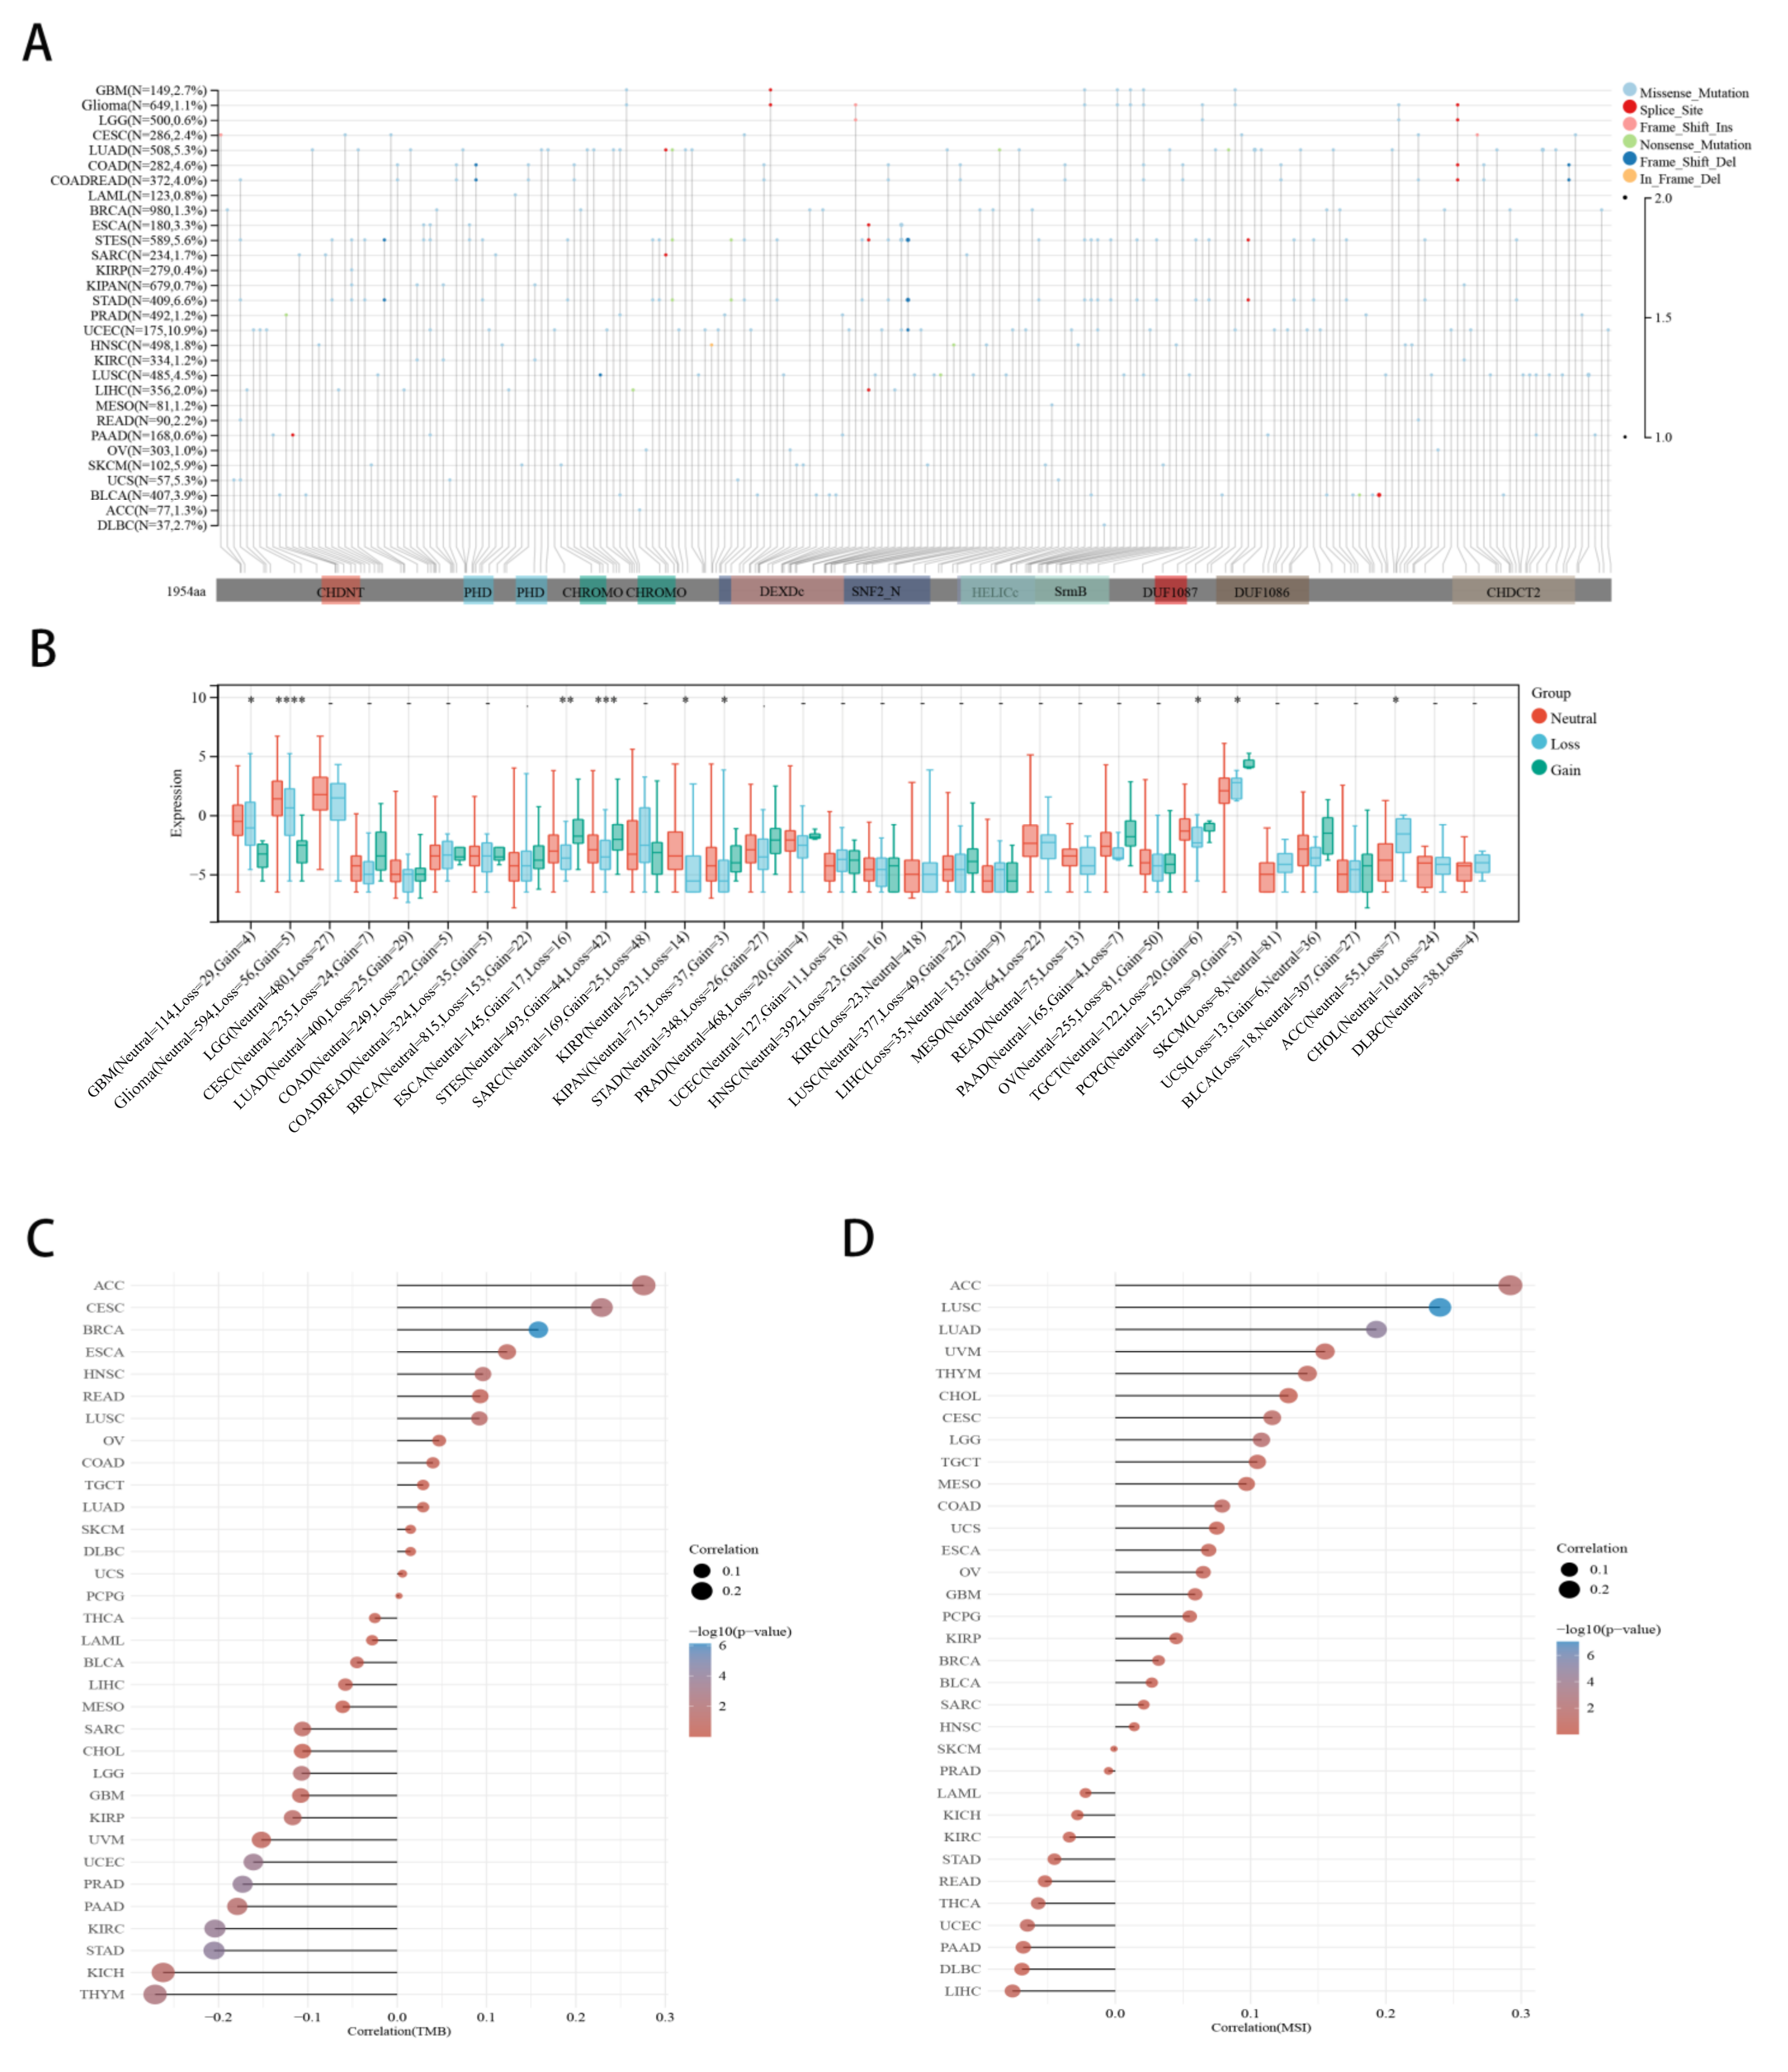
2.4. Correlation between CHD5 Expression and CNV, TMB, MSI in Various Cancer Types

We mapped the mutational profiles of CHD5 across 30 types of cancers (Figure 4A). The results showed that UCEC (10.9%) cancer had the highest mutation rate, while LUAD (5.3%), COAD (4.6%), STES (5.6%), STAD (6.6%), SKCM (N = 102, 5.9%) and UCS (N = 57, 5.3%) had considerable mutations as well. We further explored whether CHD5 expression was dependent on the CNV status in the 32 types of cancers, and found statistically significant differences in 9 types of cancers (Figure 4B), including GBM (p = 0.02), Glioma (p = 5.1 × 10⁻⁵, ESCA (p = 4.6 × 10⁻³), STES (p = 5.6 × 10⁻⁴), KIRP (p = 0.02), KIPAN (p = 0.04), TGCT (p = 0.03), PCPG (p = 0.05) and ACC (p = 0.04). Notably, the loss of CHD5 occurred frequently in the genome, which affected the copy number of CHD5 in glioma (Loss = 56, Gain = 5), and was one of the reasons for the low expression of CHD5 in Glioma. This was also the case with GBM (Loss = 29, Gain = 4). Furthermore, the expression of CHD5 was correlated with TMB in 12 types of cancers (Figure 4C). That is, it was positively correlated with the TMB for BRCA, CESC, ACC, and HNSC, and negatively correlated with STAD, PRAD, KIRC, UCEC, THYM, LGG, PAAD, and KICH. We further found that CHD5 expression was positively correlated with MSI in 5 types of cancers, including LUSC, LUAD, ACC, LGG, and CESC (Figure 4D), but not negatively correlated with MSI in other types of cancers. These results also suggested that CHD5 expression was closely associated with Glioma.

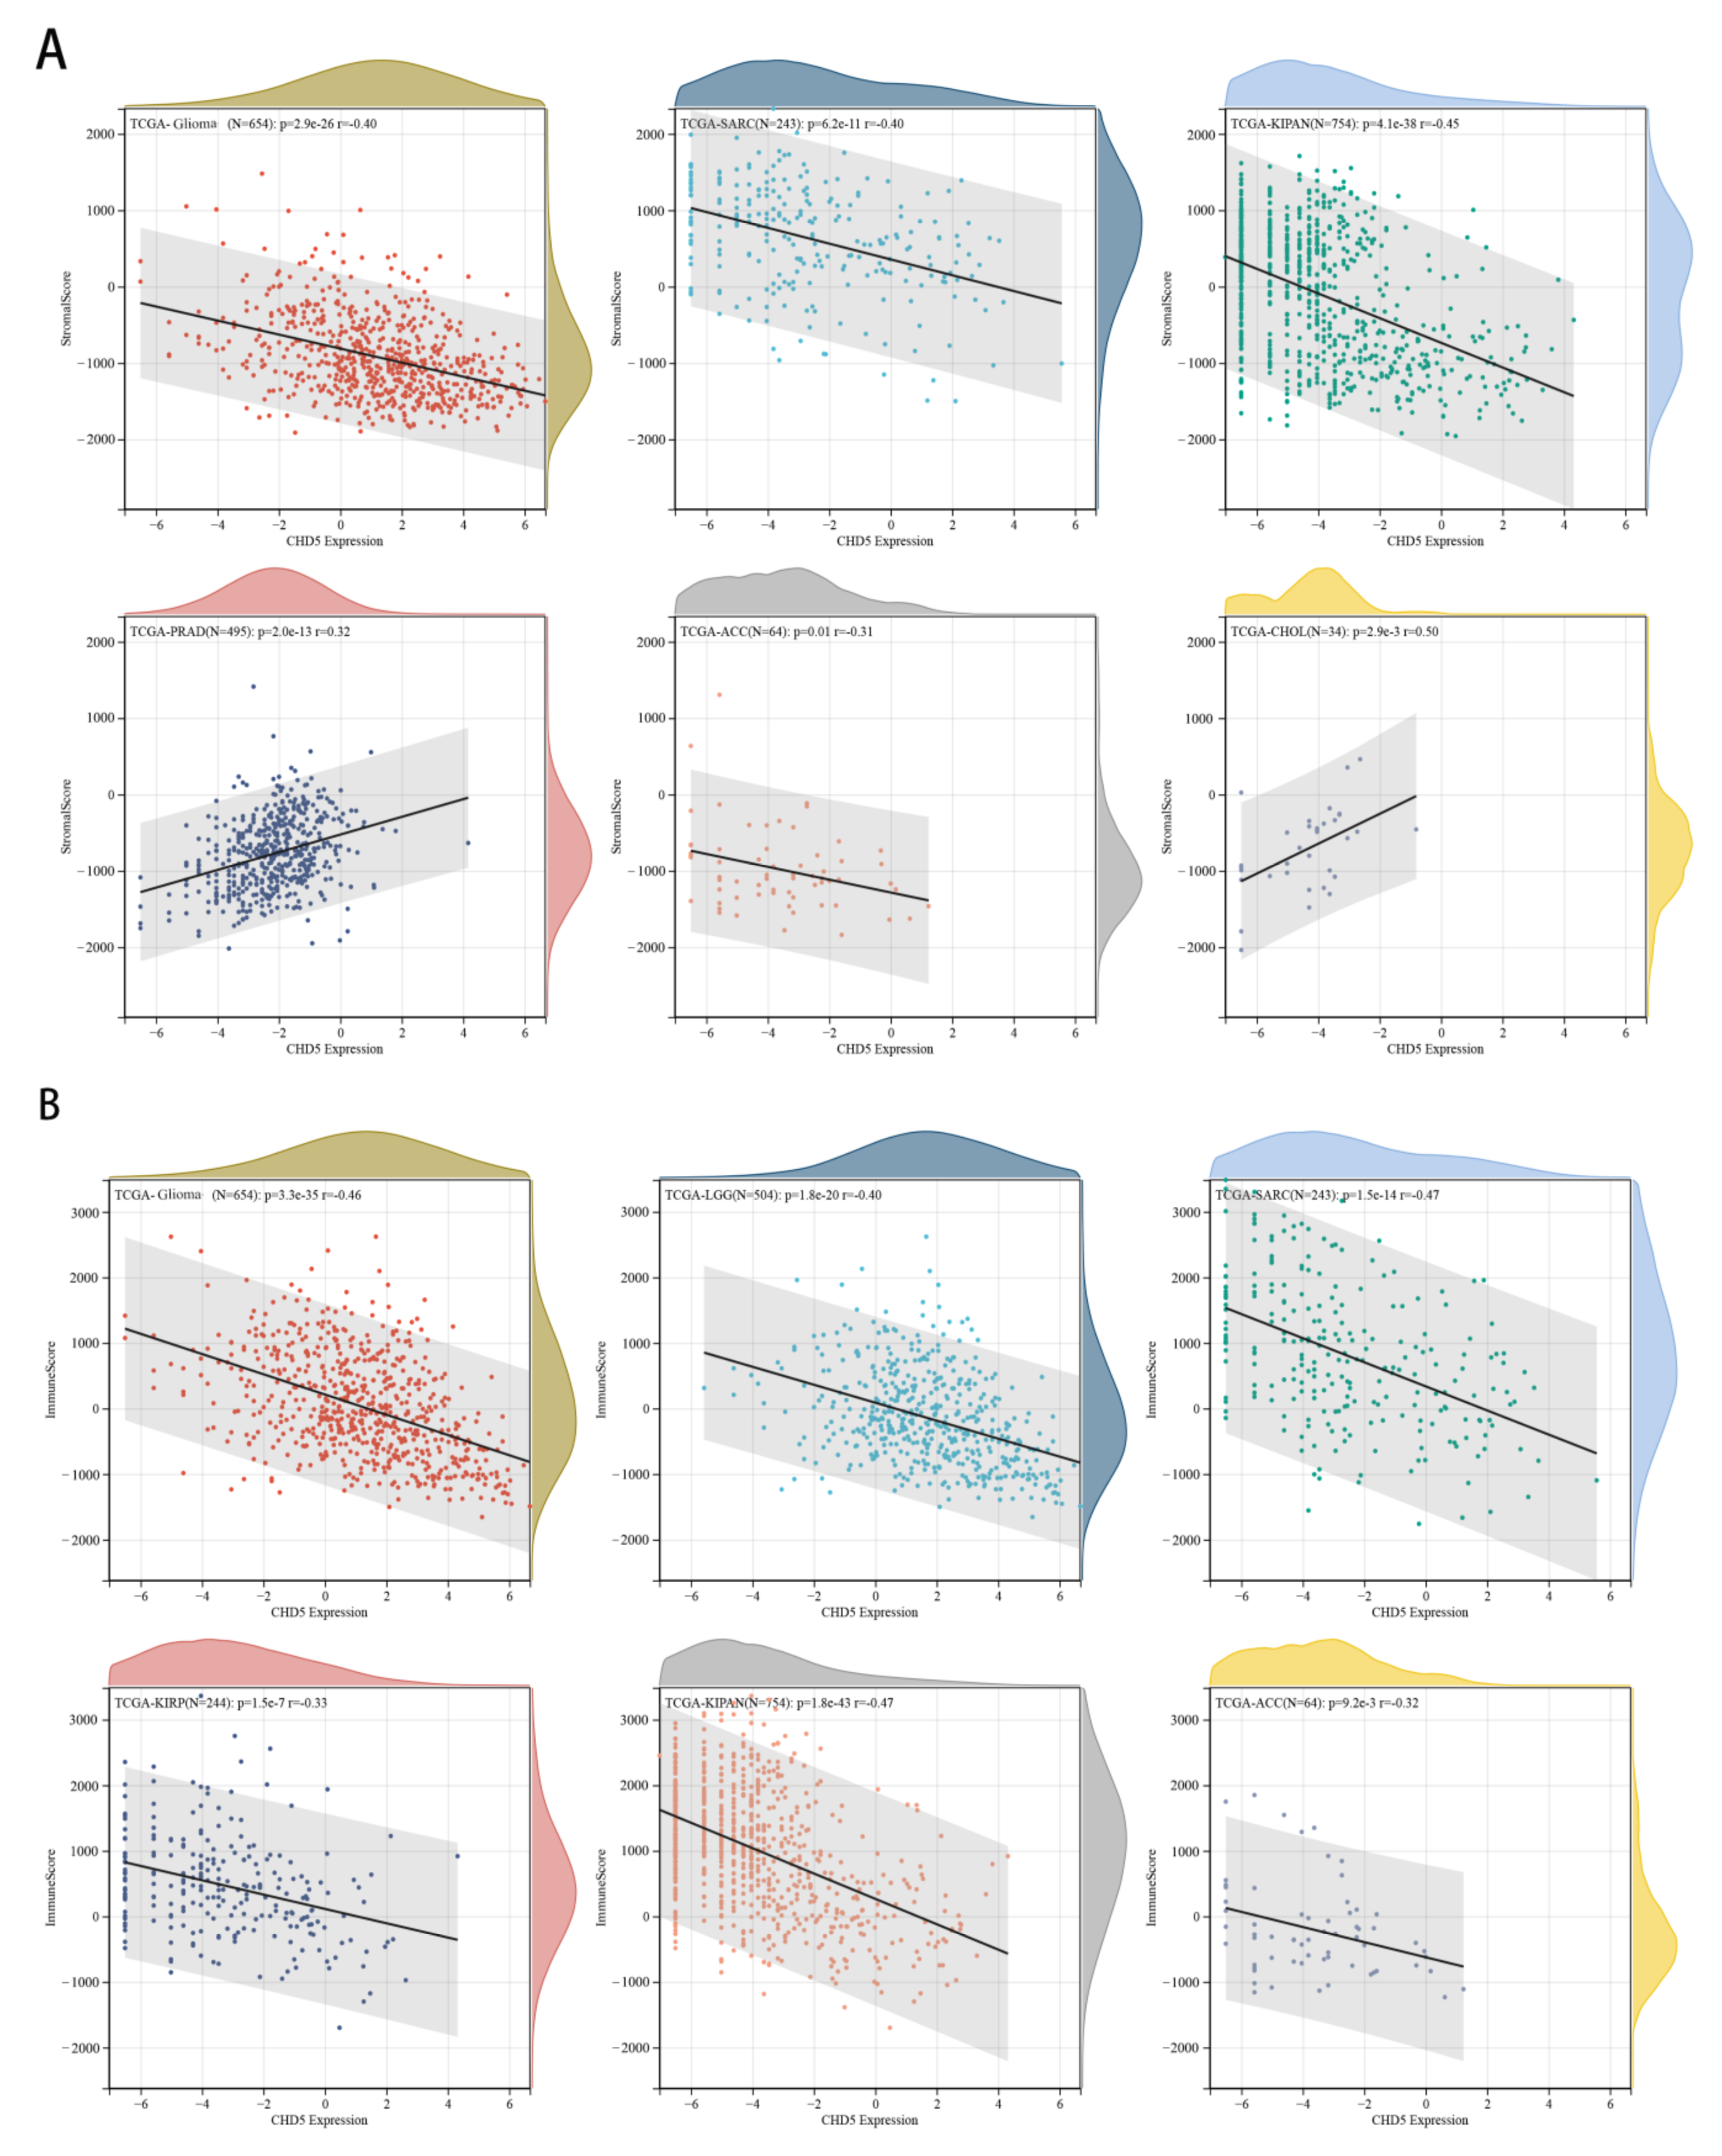
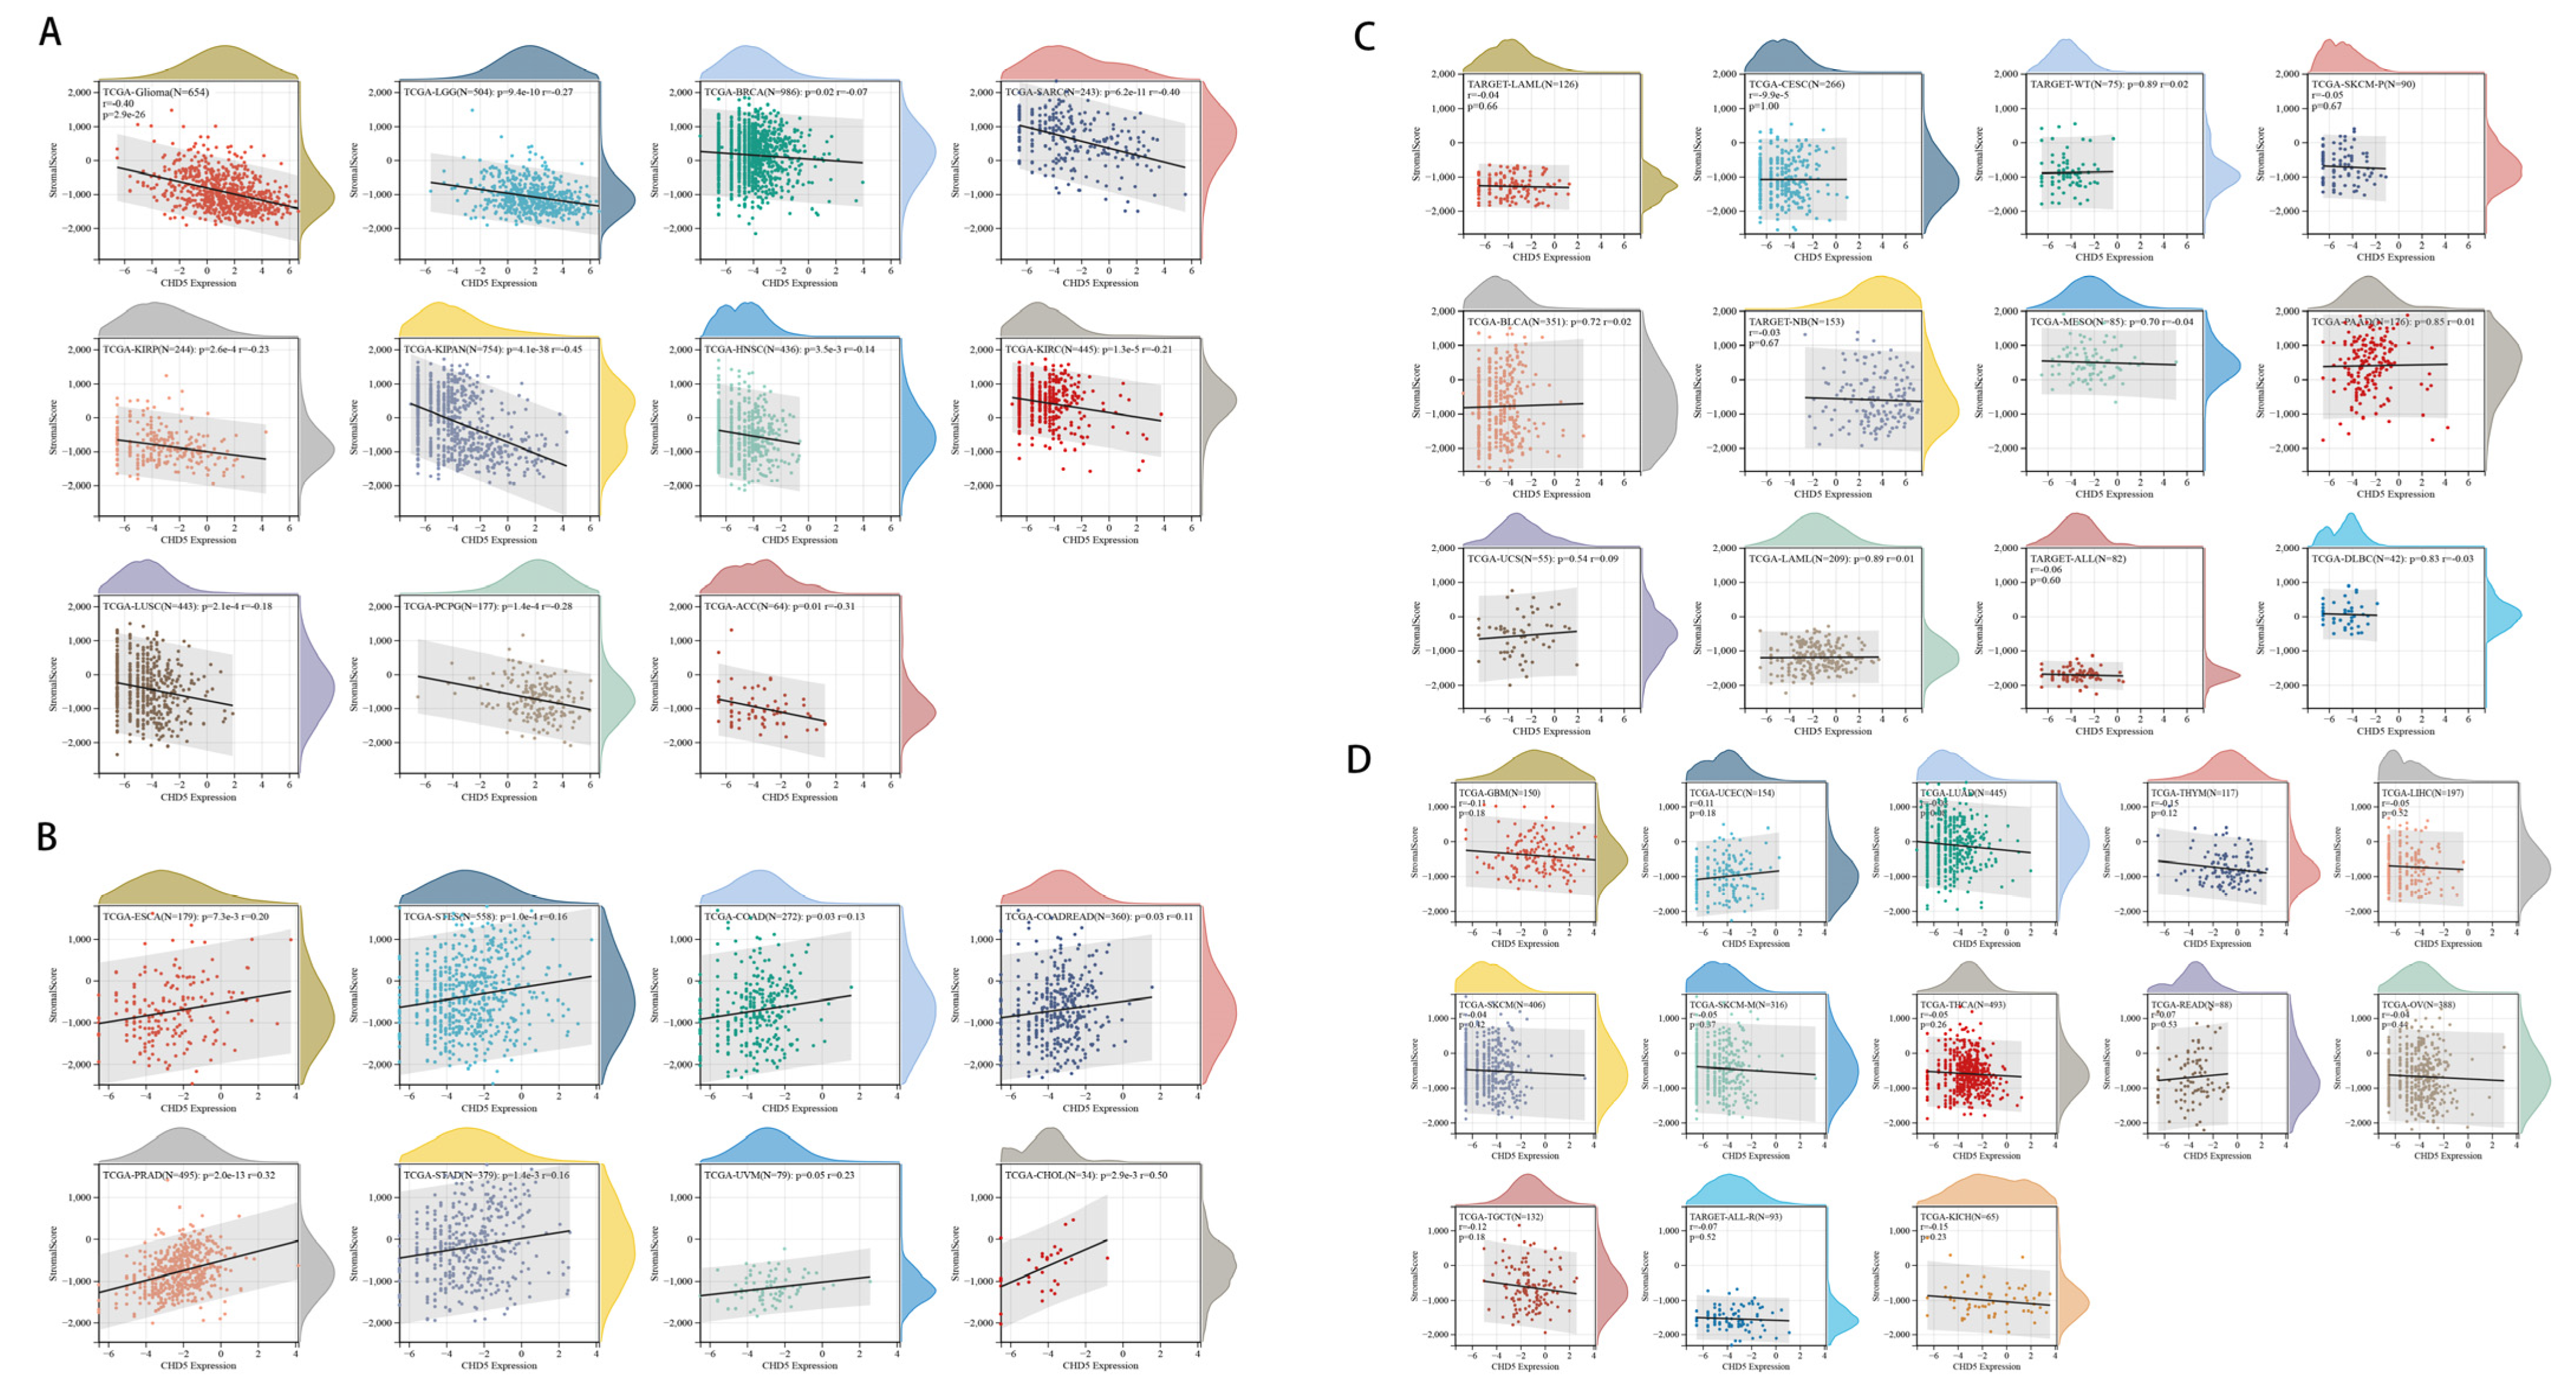
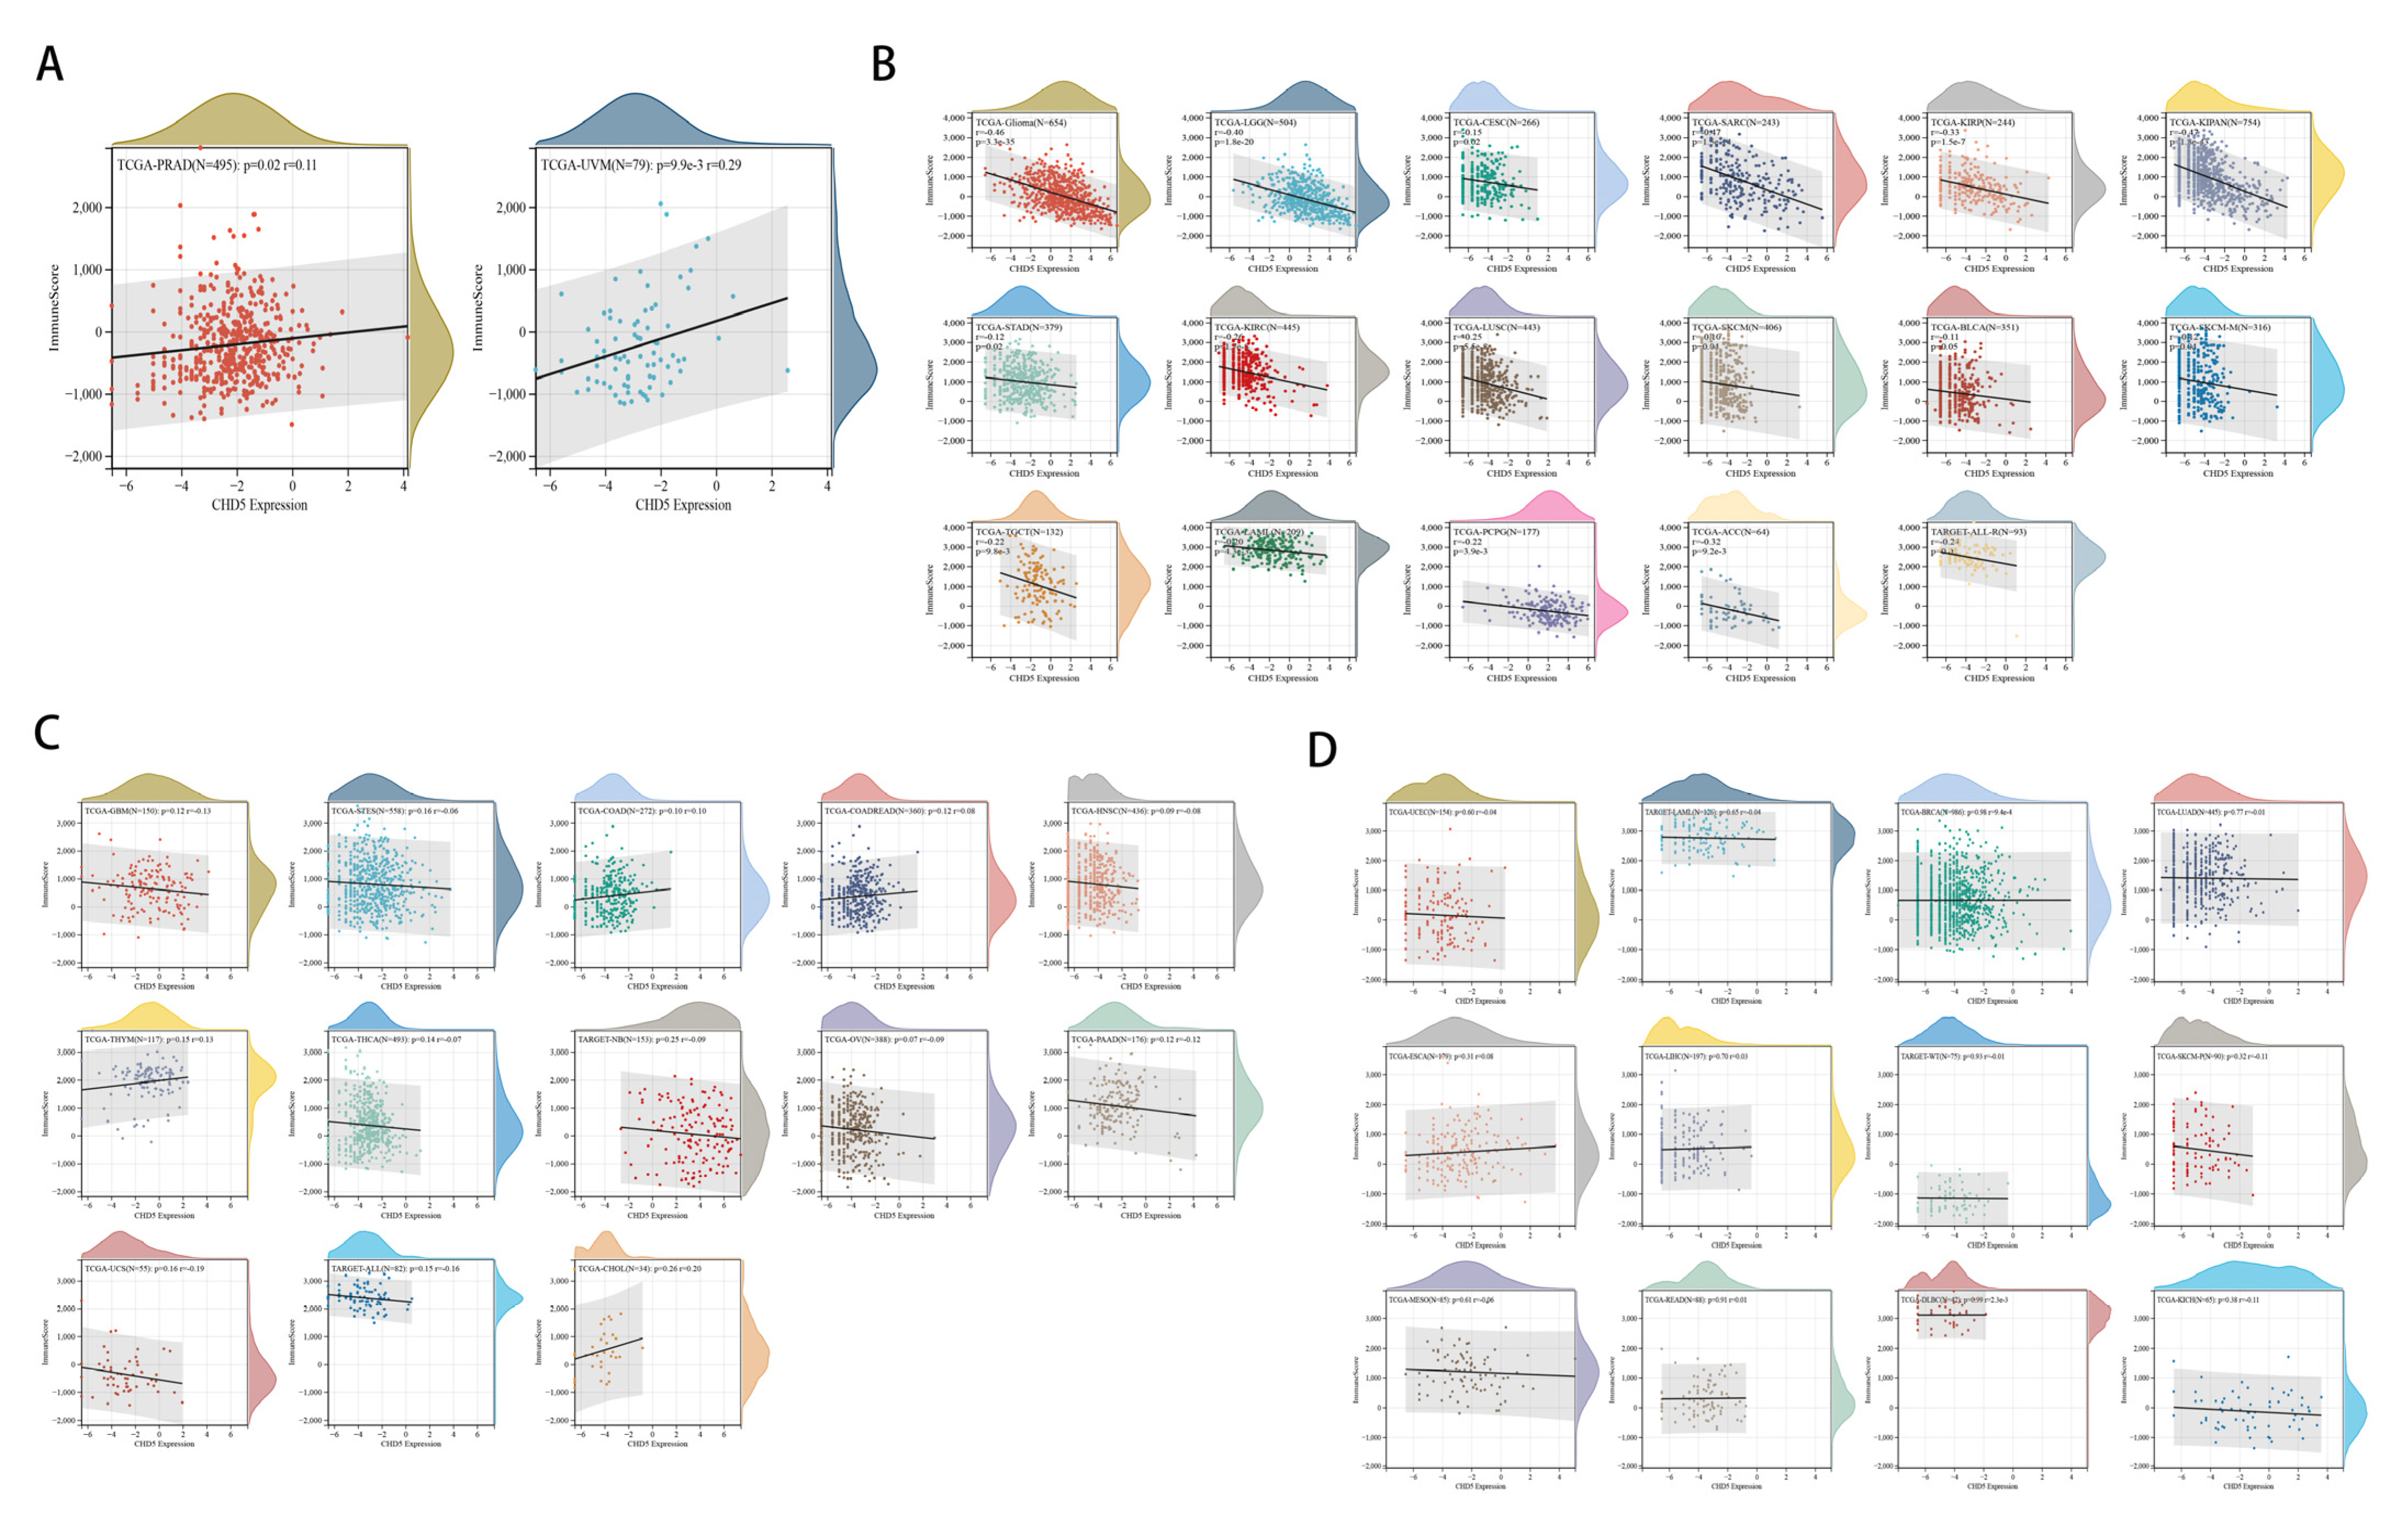
2.5. Correlation between CHD5 Expression and the TME in Different Types of Cancers

The role of the tumor microenvironment (TME) in the occurrence and development of tumors has been demonstrated before [13,14]. Genetic alterations in the cancer cells are the primary cause for their uncontrolled growth, resistance to apoptosis, and metabolic shift to anaerobic glycolysis (Warburg effect). These events trigger a series of metabolic, and immune events, which ultimately cause cancer progression and metastasis [15]. Therefore, in our pan-cancer analysis, we evaluated the association between CHD5 expression and the TME. The stroma score is a method to evaluate the content of stromal cells in the tumor tissue, and the content of stromal cells often reflects the malignancy of the tumor [16]. Our results showed that CHD5 expression was negatively correlated with the stroma score in KIPAN, SARC, Glioma, ACC, PCPG, LGG, KIRP, KIRC, LUSC, HNSC, and BRCA (Figure A4A), and it was significantly positively correlated with the stroma score in COADREAD, STES, STAD, ESCA, UVM, PRAD and CHOL (Figure A4B). No significant differences were found in other cancers (Figure A4C,D). The tumor microenvironment is composed of fibroblasts, endothelial cells, tumor cells, immune cells, and vasculature, which play important roles in tumor progression. Immune score is a method to evaluate the tumor immune microenvironment, which has been demonstrated to be superior to the AJCC/UICC TNM-classification in colorectal cancer [17,18]. Furthermore, CHD5 expression found to be negatively associated with the immune scores in KIPAN, SARC, Glioma, LGG, KIRP, ACC, KIRC, LUSC, ALL, TGCG, PCPG, LAML, CESC, STAD, SKCM-M, BLAC and SKCM (Figure A5A). There was a significant positive correlation between CHD5 expression and the immune score in PRAD and UVM (Figure A5B). No significant differences were found in other cancers (Figure A5C,D). The 6 types of cancers with the highest correlation coefficient between the TME and CHD5 expression are shown in Figure 5A,B.

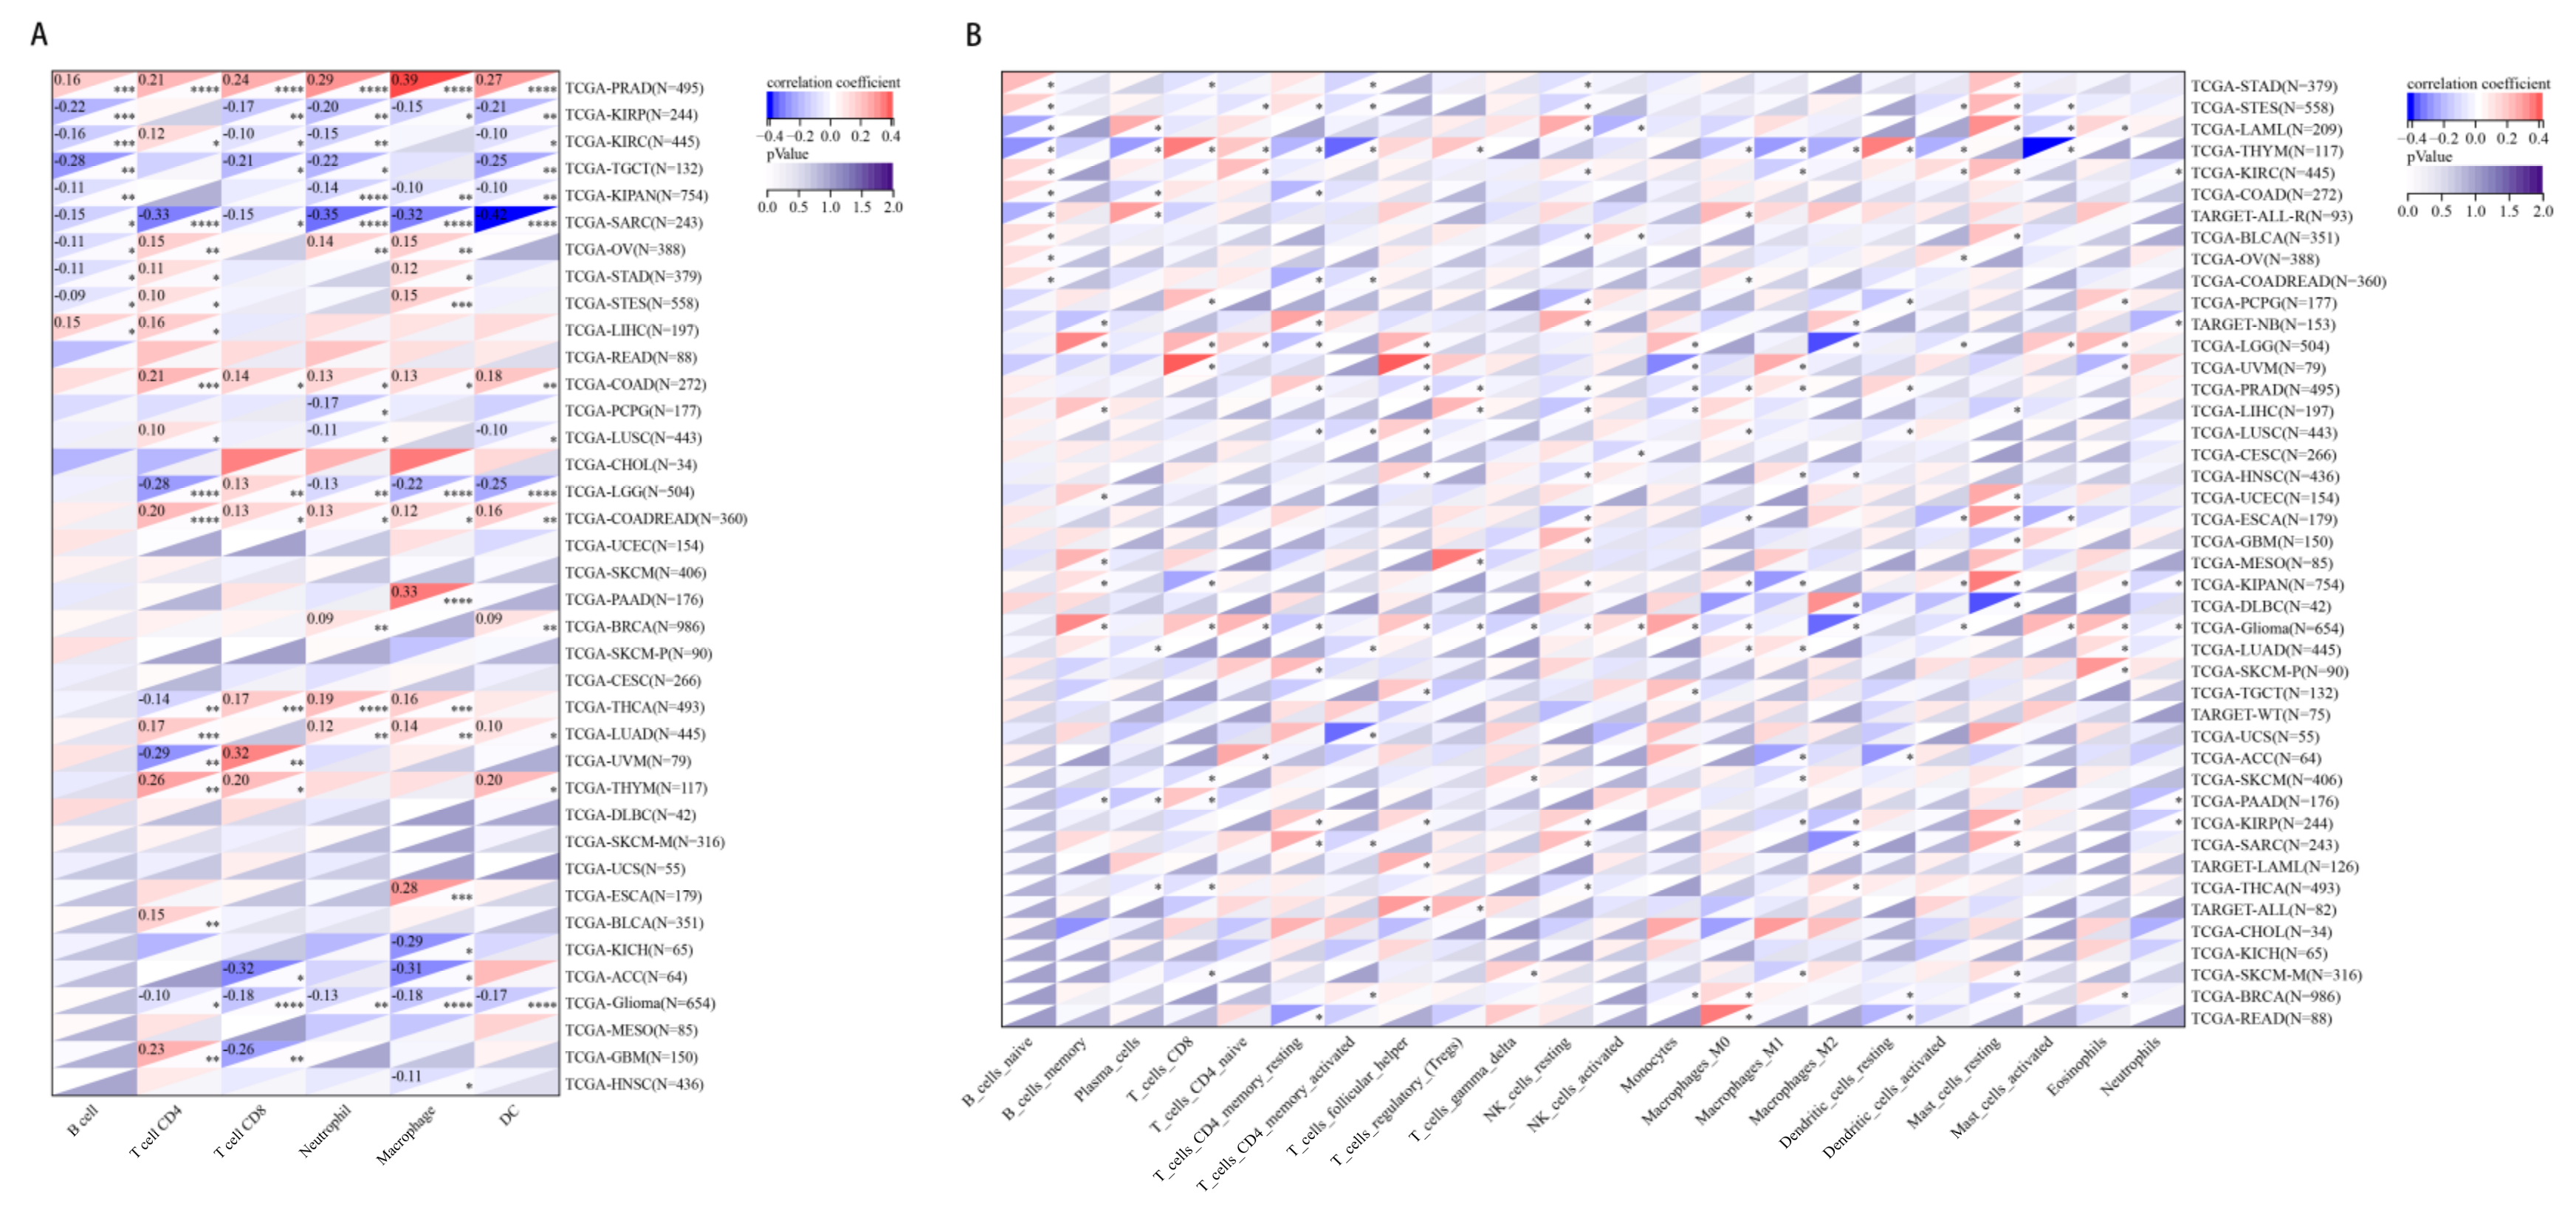
2.6. The Relationship between CHD5 Expression and Immune Cell Infiltration in Various Cancer Types

Finally, we obtained six immune cell infiltration types from 8590 tumor samples across 38 tumor types, and showed that CHD5 gene expression was significantly correlated with immune infiltration in 28 types of cancers (Figure 6A). Notably, CHD5 expression was significantly positively correlated with the six immune cell infiltration types in PRAD and was negatively correlated with the same in SARC. Consistent with previous studies, the expression of CHD5 gene in Glioma was significantly negatively correlated with the 5 immune cells types, except B cells. Next, we examined the relationship between CHD5 expression and the infiltration of 22 immune cell subtypes. The findings showed that in most cancer types (41/44), the level of immune cell infiltration was significantly positively correlated with the expression of CHD5 (Figure 6B). In Glioma, up to 16 types of immune cells were associated with CHD5 expression. The above results implied that there was an association between CHD5 expression and the degree of immune cell infiltration in different types of tumors.

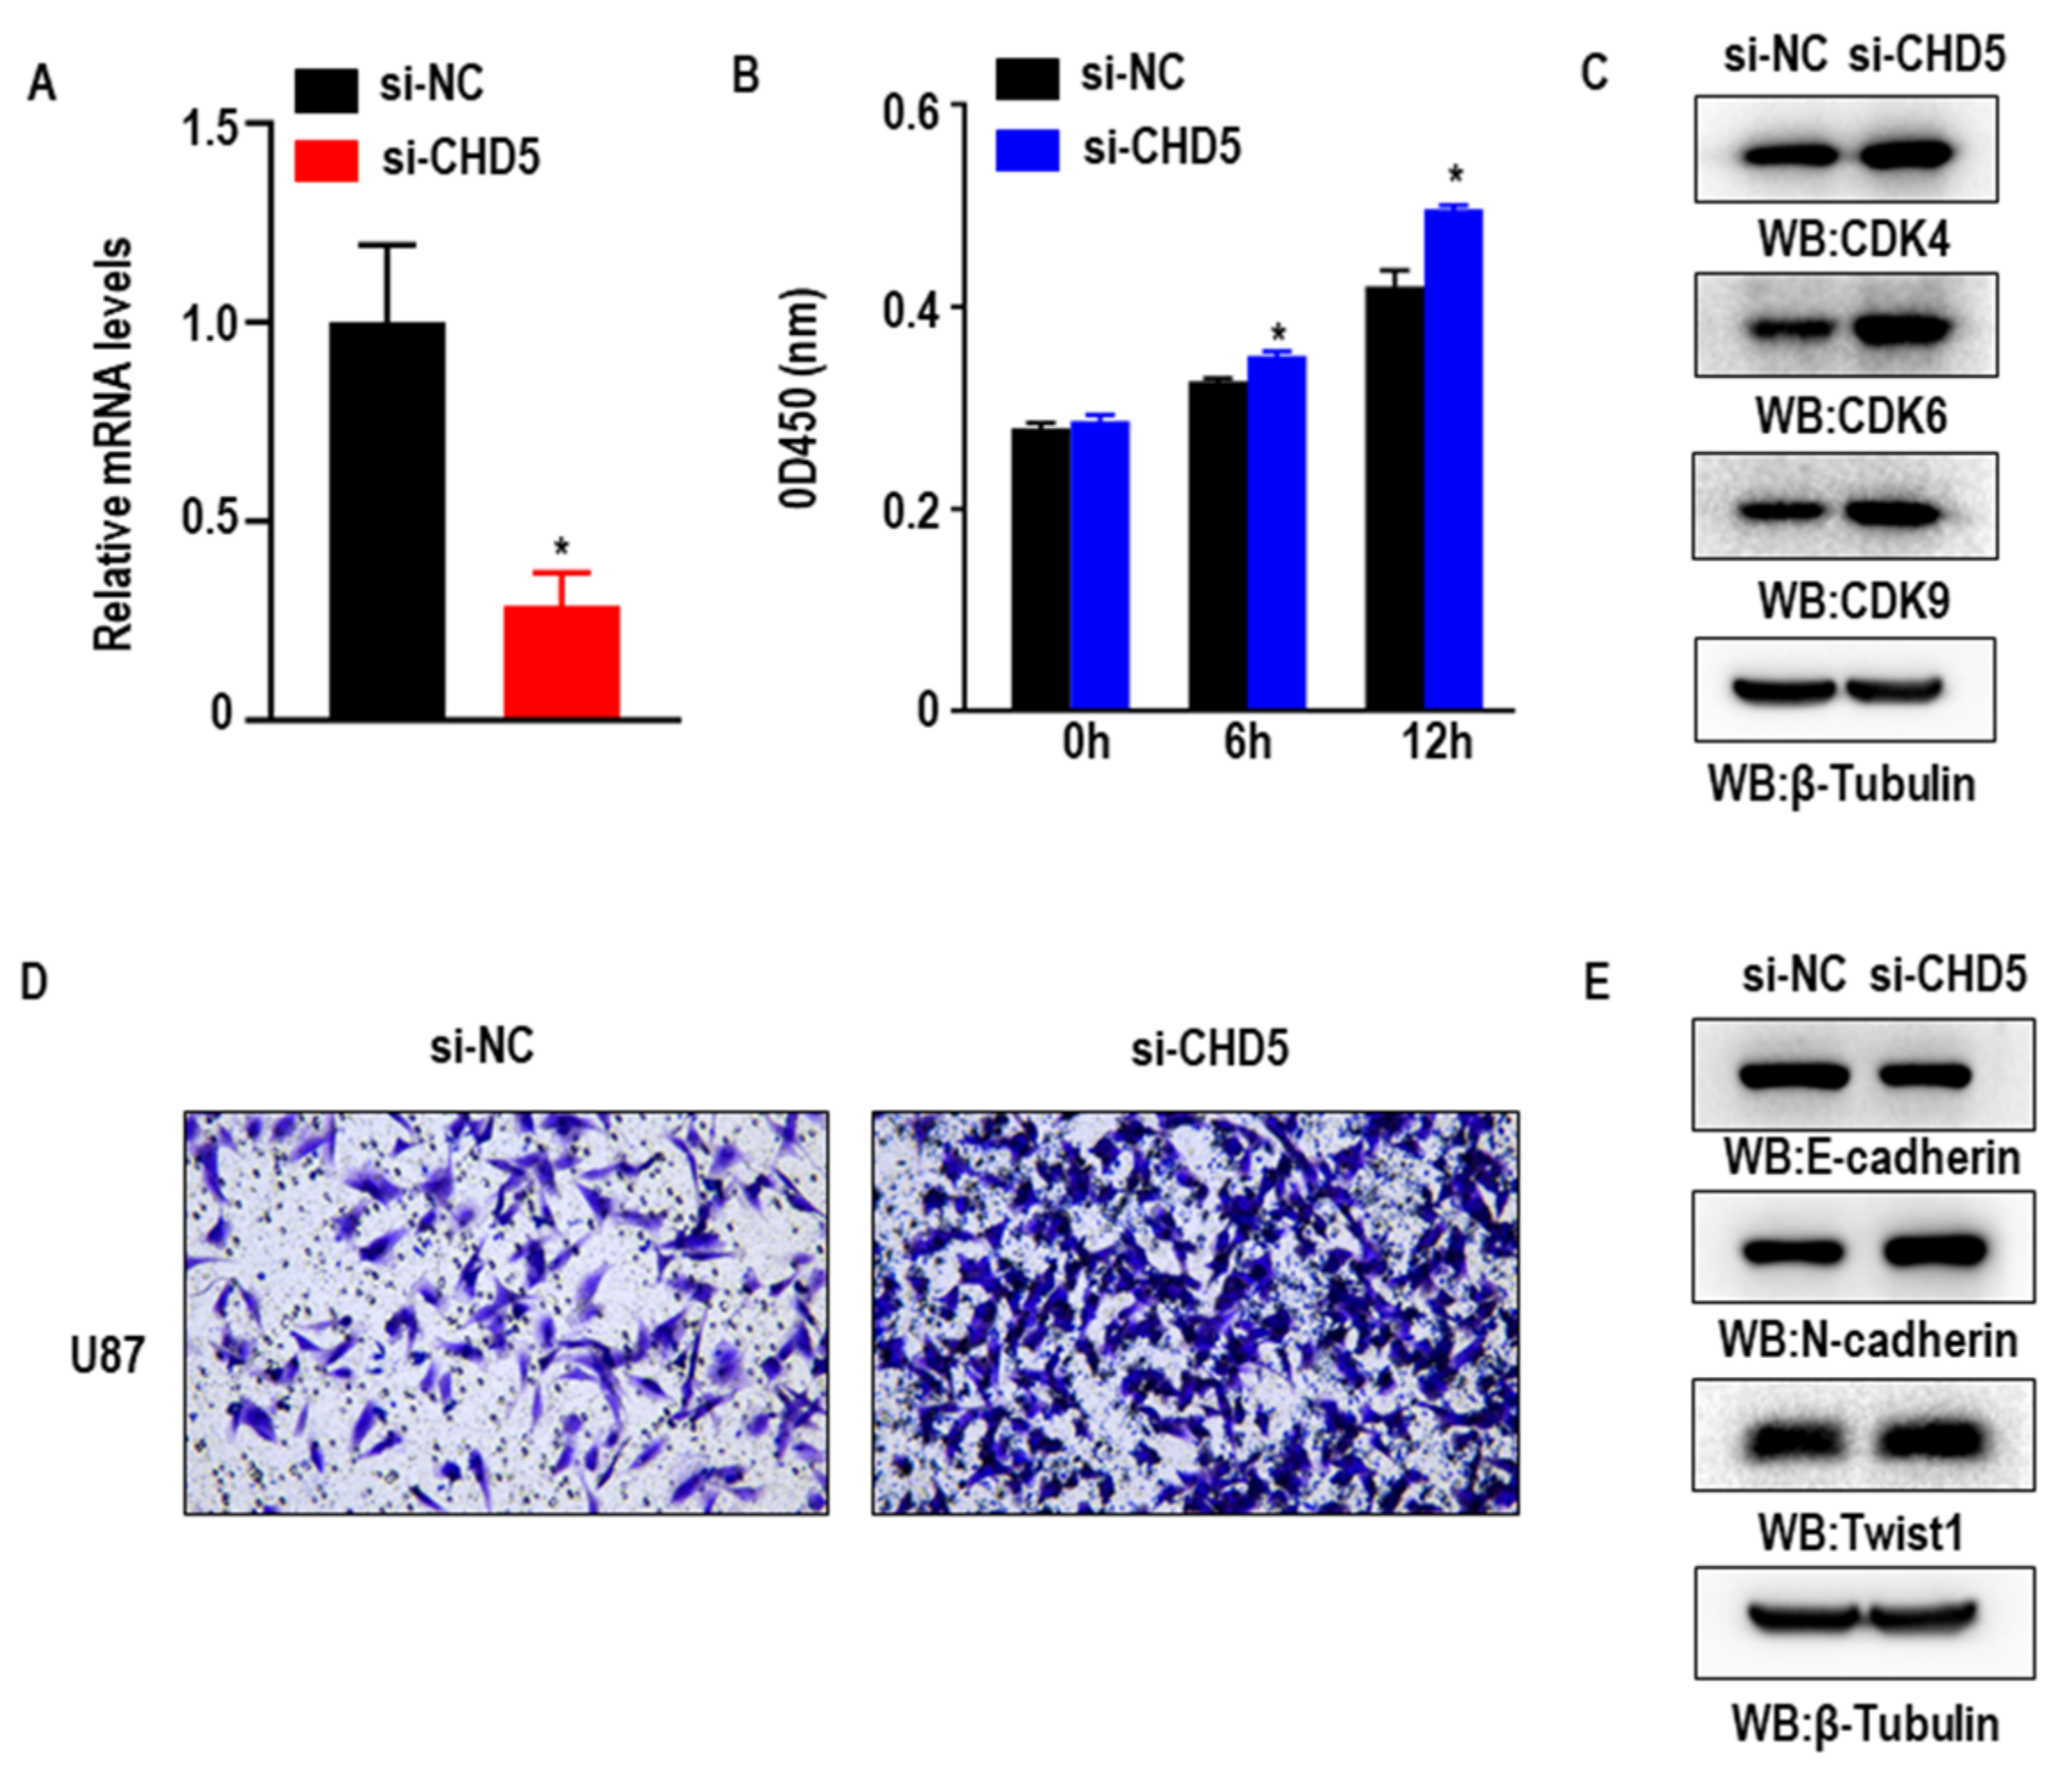
2.7. Knockdown of CHD5 Promotes the Proliferation, Migration and EMT in GBM Cells In Vitro

To investigate the biological function of CHD5 in glioblastoma progression, we subsequently performed loss-of-function experiments and silenced the expression of CHD5 in the human GBM cell line U87. RT-qPCR confirmed the efficiency of siRNA knockdown of CHD5 (Figure 7A). CCK8 assay for cell viability showed that the knockdown of CHD5 increased the viability of U87 cells in vitro (Figure 7B). Consistent with this, the expression of cell cycle-related proteins CDK4, CDK6, and CDK9 were also found to be increased (Figure 7C). Moreover, results from the transwell migration assay also showed that the knockdown of CHD5 significantly promoted the migration and EMT process in GBM cells (Figure 7D,E).

3. Discussion

CHD5 has previously been reported to be a potential tumor suppressor gene in various solid tumors [19]. Nonetheless, few systematic studies have evaluated the roles of CHD5 through pan-cancer analysis using bioinformatics approaches. This study aimed to systematically determine the expression pattern, prognostic value and potential function of CHD5 in different types of cancers.
In the present study, we first demonstrated that CHD5 was differentially expressed between most cancer tissues and the adjacent normal tissues, which suggested that CHD5 was a potential tumor suppressor gene in most cancers. The above finding was consistent with previously reported results regarding the differential expression of CHD5 in different cancers, including neuroblastoma, melanoma, hepatocellular carcinoma, non-small cell lung cancer, and head and neck squamous cell carcinoma [20,21,22,23,24]. Our results also showed that the expression of CHD5 was upregulated in some cancer types. Given the expression of CHD5 was restricted to the transcriptional level, and its function at the protein level might have a major impact on cancer progression, it is critical to further explore the effect of the protein expression of CHD5 across different types of cancers. In other studies, CHD5 was reported to be more preferentially expressed in tumors in the nervous system [25], especially in neuroblastoma with a deletion of the 1p36.3 region [26], and was shown to be a potential tumor suppressor gene in neuroblastoma [27]. However, the role of CHD5 in glioma remains unclear. Therefore, it is necessary to further explore the function of CHD5 in apoptosis, proliferation and tumor migration using various cell biology experimental approaches in the future.
In the pan-cancer survival analysis, although CHD5 expression was associated with the prognosis of various cancers, it appeared to be strongly associated with the prognosis of neurological tumors (Glioma, LGG, and NB). However, several of the previous studies have demonstrated that CHD5 was a tumor suppressor gene in neuroblastoma, and was associated with a poor prognosis [27,28,29]. Interestingly, in this study, we revealed the biological role of CHD5 in glioma cells, wherein we found that the knockdown of CHD5 enhanced the proliferation and migration of glioma cells in vitro.
To further explore the mutational landscape of CHD5 in different cancers, we analyzed the data from 30 cancers in the TCGA database. The results showed that the highest mutation rate was observed in UCEC (10.9%), and there was also a high mutation rate in GBM (p = 0.02), Glioma (p = 5.1 × 10⁻⁵), ESCA (p = 4.6 × 10⁻³), STES (p = 5.6 × 10⁻⁴), KIRP (p = 0.02), KIPAN (p = 0.04), TGCT (p = 0.03), PCPG (p = 0.05), and ACC (p = 0.04). TMB is a potential biomarker for multiple cancers, which is measured by the total amount of somatically encoded mutations [30,31]. Previous evidence has shown that tumors with high TMB were sensitive to immunotherapy and were associated with improved survival [32,33]. In this study, we found a positive correlation between CHD5 expression and TMB of BRCA, CESC, ACC, and HNSC, and a negative correlation with that of TMB in STAD, PRAD, KIRC, UCEC, THYM, LGG, PAAD, and KICH. MSI, defined as a phenotype of altered microsatellite sequences caused by defects in DNA mismatch repair, is associated with increased susceptibility to cancer [34]. In recent years, MSI has been recognized as the primary biomarker for immune checkpoint blockade therapy [35]. Our findings showed that CHD5 expression was positively correlated with MSI in 5 types of cancers, including LUSC, LUAD, ACC, LGG, and CESC, but was not negatively correlated with any of the cancer types. Currently, the CNV, TMB and MSI of CHD5 are less reported in these cancers, and our study provides new insights into the mutational landscape in these cancers. Additionally, CHD5 was found to be strongly associated with tumors of Glioma. Notably, we found that the expression of CHD5 was positively correlated with the MSI in LUSC, LUAD, ACC, LGG, and CESC, however, the MSI rate in LUAD and LGG was not high. At the same time, the expression of CHD5 was not found to correlate with their TMB. CHD5, which has been speculated in past studies to function as a NuRD-type chromatin remodeling complex (transcriptional repressor), may also contribute to transcriptional activation, as well as transcriptional elongation, termination, RNA processing and DNA damage response [19,36]. Whether this suggests that CHD5 dominates DNA damage repair in LUAD and LGG leading to MSI is worthy of further investigation.
Tumorigenesis is highly correlated with the tumor microenvironment (TME), and in recent years strategies to therapeutically target the TME have emerged as a promising cancer therapy [37]. Glioma tumor immune microenvironment plays an important role in the progression of glioma. Our results showed that CHD5 expression was positively correlated with the stromal scores in 18 types of cancers, was correlated with the immune scores in 19 types of cancers, and was especially significantly negatively correlated with the immune scores in Glioma. Moreover, we observed that CHD5 expression was significantly associated with immune infiltration in 28 types of cancers. Notably, CHD5 expression was significantly positively correlated with six immune cell infiltration types in PRAD and was negatively correlated in SARC. Recent studies have shown that B cells were associated with patient survival in sarcoma and their response to immunotherapy [38,39]. The expression of CHD5 in Glioma was significantly negatively correlated with 5 types of immune cells, except B cells. However, myeloid-derived suppressor cells promote B cell-mediated immunosuppression through PD-L1 transfer in glioblastoma [40], which indicated that the tumor suppressor effect of CHD5 may not be through B cell immune function. Next, we examined the relationship between CHD5 expression and the infiltration of 22 immune cell subtypes. The findings showed that in most cancer types, the level of immune cell infiltration was significantly correlated with the expression of CHD5. To our surprise, as many as 16 immune cell subtypes were associated with the expression of the CHD5 in Glioma. This was not only consistent with our previous results, but also suggested that the way CHD5 functioned in tumors might be related to other non-B cell immune pathways. Moreover, as glioma-associated microglia and macrophages (GAMs) are known to be the major components in the TME, a switch from a pro-tumorigenic M2 phenotype to tumoricidal M1 phenotype may offer an opportunity to improve the efficacy of existing cancer therapy. Previous studies have reported the presence of many cellular factors, which were potentially involved in the cross-talk between GBM cells and the microglia including chemokines, cytokines, and miRNAs [41]. However, the mechanisms underlying the crosstalk between CHD5 and the microglia need to be explored at greater depth in future studies. Our first pan-cancer analysis of CHD5 revealed that the gene was lowly expressed in most tumor tissues compared with adjacent normal tissues and that there was an association between CHD5 expression and clinical prognosis. Our findings also suggested that CHD5 might be an independent prognostic factor in multiple cancers and that the low expression of CHD5 was associated with poor prognosis in major tumor types. Although bioinformatics analysis provided us with some important insights about the role of CHD5 in malignancies, we further validated the tumor suppressor role of CHD5 in glioma using molecular biology methods. Further in vitro and in vivo experiments are required to confirm our findings. Although we analyzed and integrated information from multiple databases, there were some limitations to our study. For example, the TCGA database mainly included the data from Caucasian patients, while data from patients belonging to other ethnicities was relatively scarce. In conclusion, the present study demonstrates that CHD5 expression affects glioma progression and migration. Therefore, CHD5 may be a promising biomarker for glioma to predict patient prognosis and efficacy of anticancer therapy. These findings may lead to personalized treatments for glioma patients and for other cancer patients harboring CHD5 variants.

4. Materials and Methods

4.1. Analysis of the Expression Level of CHD5 in the Pan-Cancer Datasets

We downloaded the unified and standardized pan-cancer datasets from the UCSC (https://xenabrowser.net/) database (accessed on 23 September 2021), including the TCGA, TARGET and GTEx databases [42,43,44]. A total of 19,131 samples and 60,499 gene expression data were included. Expression data of CHD5 (ENSG00000116254) gene in each sample was extracted. Subsequently, we utilized the Can SAR BLACK Tool (https://cansarblack.icr.ac.uk/ Version: 1.5.0; accessed on 23 September 2021) to study CHD5 mRNA expression in different cancer cell lines from the Cancer Cell Lines Encyclopedia (CCLE, https://portals.broadinstitute.org/ccle; accessed on 23 September 2021) Expression profile [45]. The Human Protein Atlas (HPA) was used to study the expression and cellular localization of CHD5 protein in different organs. The authors state clearly that we are unable to classify the cases in line with the 2021 WHO classification.

4.2. Identification of the Correlation between CHD5 Expression Levels and Clinicopathological Characteristics and Survival in Human Cancers

We extracted several metrics (overall survival [OS], disease-specific survival [DSS], disease-free [DFI], and progression-free [PFI]) from the TCGA, TARGET, and GTEx samples to investigate the association between CHD5 expression and patient outcomes. We also excluded samples with an expression level of 0 and a follow-up period of less than 30 days. Survival analysis was performed using the Kaplan-Meier method and ROC curves (p < 0.05), and then the R packages “survival” was used to draw the survival curves. The R packages “survival” and “forestplot” were used for Cox analysis to determine the correlation between CHD5 expression and survival. The R packages “ggpubr” and “limma” were used for analyzing the correlation between CHD5 expression and the clinicopathological characteristics.

4.3. Association between CHD5 Expression and Tumor Mutational Burden (TMB) or Microsatellite Instability (MSI) across Different Types of Cancers

We downloaded simple nucleotide variation and copy number variation data from GDC (https://portal.gdc.cancer.gov/) (accessed on 23 September 2021), and the data were then processed using the MuTect2 software and the GISTIC software [46,47]. The domain information of the protein was obtained using the R software package maftools (version version 2.2.10). The Simple Nucleotide Variation dataset was used to map the mutational landscape of CHD5 in 30 tumor types, the Copy Number Variation dataset was used to analyze the relationship between CHD5 expression and CNV in 32 types of cancers. TMB were obtained from Vesteinn Thorsson et al. and MSI values were obtained from Russell Bonneville et al. [48,49].

4.4. Correlation between CHD5 Expression and the TME across Different Types of Cancers

We downloaded and analyzed the immune cell infiltration score from the TCGA Im muCellAI Database (http://bioinfo.life.hust.edu.cn/web/ImmuCellAI/) (accessed on 23 September 2021), and the TIMER2 database (http://timer.cistrome.org/) (accessed on 23 September 2021) [50]. Patients within each tumor type in the TCGA datasets were divided into two groups based on their median CHD5 expression levels to compare the extent of immune cell infiltration [51]. Finally, we analyzed the tumor purity and stromal/immune cell infiltration and classified them into tumor tissues of various tumor types (n = 44) based on CHD5 expression data using CIBERSORT, which was used to estimate the abundance of specific cells in hybrid cell populations using gene expression dataset [52].

4.5. Cell Culture and CHD5 Targeted siRNA Transfection

The U87 (human glioma cell line) cells were cultured in RPMI 1640 medium (Gibco, Carls bad, CA, USA) supplemented with 10% fetal bovine serum (Biological Industries, Kibbutz Beit Haemek, Israel) and 1% penicillin/streptomycin (Invitrogen, Grand Island, NY, USA). The cells were cultured at 37 °C in a 5% CO2 incubator. The si-NC and si-CHD5 small interfering RNA (siRNA) were transfected into U87 cells with Lipofectamine 2000 transfection reagent (Invitrogen, Carlsbad, CA, USA), respectively. Briefly, U87 cells were randomly divided into two groups: the si-NC group transfected with the scrambled siRNA was considered as the negative control, the si-CHD5 group was transfected with the siRNA specific for CHD5 (target sequence AGAAGGTATTCCGTATGAA) (RiboBio, Guangzhou, China). Transfection experiments were performed when cells were 50% confluent in 6 well plates. Once the cells reached the desired confluence, the culture medium was aspirated and 1.5 mL complete medium was added to each well again. siRNA(30 nM) and lipo2000(5 μL) were added to 0.5 mL of serum-free medium, mixed and incubated at room temperature for 30 min. The siRNA-lipo2000 mixture was carefully added to each well. Then the cells were cultured at 37 °C in a humidified atmosphere with 5% CO2.

4.6. RNA Isolation and qPCR

After the cells were transfected for 48 h, the mRNA levels of CHD5 were analyzed by qPCR assay. Briefly, total RNA was extracted from the cells using the total RNA extraction kit (Bioflux, Tokyo, Japan). 1.5 µg of RNA was reverse transcribed into cDNA and the mRNA level was analyzed by UltraSYBR Master (CWBIO, Guangzhou, China). The qPCR primers for CHD5 were as follows: F-CCCCATGTCCAAAATGATGACC, and R-GTGACCGTCTCTACAGCCG. The data were normalized to 18 s and the relative gene expression was obtained using Prism 7 (GraphPad Software, lnc., La Jolla, CA, USA).

4.7. Cell Viability Assay

After the cells were transfected for 48 h, the effect of CHD5 knockdown on the viability of U87 cells was assessed using the cell counting kit-8 (CCK-8) assay (MedChem Express, Shanghai, China). In brief, the cells were seeded in 96-well plates at a density of 2 × 10⁴ cells per well and cultured for 0 h, 6 h, 12 h. Following this, RPMI 1640 medium (100 μL) and CCK8 solution (10 μL) were added to each well, and incubated for 1 h. Finally, the absorbance of each well was measured at 450 nm using a microplate reader (Thermo Scientific, Waltham, MA, USA). The data was analyzed using the ImageJ2x Software (Rawak Software Inc., Stuttgart, Germany).

4.8. Transwell Assay

To evaluate the effect of CHD5 knockdown on U87 cells migration, U87 cells were transfected with si-NC and si-CHD5 siRNAs, respectively, according to the manufacturer’s instructions. After the cells were transfected for 48 h, a total of 1 × 10⁴ cells were diluted in RPMI 1640 medium without FBS and were plated into the transwell chamber (Corning, Kennebunk, ME, USA). The chambers were placed in 24 well plates containing 600 μL complete medium. After 24 h, the cells that migrated to the bottom of the membrane were fixed with 4% paraformaldehyde for 30 min. Then, the membranes were stained with 0.1% crystal violet (Sangon Biotech, Shanghai, China). Eight fields were captured randomly under a microscope (DMI8, Leica, Wetzlar, Germany).

4.9. Western Blot Analysis

The si-NC and si-CHD5 siRNA were transfected into U87 cells with Lipofectamine 2000 reagent. After the cells were transfected for 48 h, Western blot analysis was performed as previously described [53]. Briefly, the cells were lysed with 1% SDS lysing buffer containing protease inhibitor cocktail and phosphatase inhibitor cocktail (Apexbio, Houston, TX, USA). The protein concentration was determined using the BCA protein assay reagent kit (Thermo Scientific, Waltham, MA, USA). All the blots were incubated with the respective primary antibodies, namely, anti-β-Tubulin (1:5000, TRANSGEN, Beijing, China), anti-CDK4, anti-CDK6, anti-CDK9 (1:800, Cell Signaling Technology, Boston, MA, USA), anti-E-cadherin, anti-N-cadherin, and anti-Twist1 (1:1000, Bioworld, Nanjing, China) antibodies. The protein bands were visualized with ECL Reagents (Smart-Lifesciences, Nanjing, China).

5. Conclusions

In summary, our pan-cancer analysis revealed that CHD5 was abnormally expressed in cancer samples across different types of cancers, and the abnormal expression of CHD5 correlated with the clinicopathological features and patient prognosis, especially in tumors related to the nervous system. In addition, the TME, TMB, MSI, and immune infiltration might contribute to the dysregulation of CHD5 expression in cancer, and CHD5 may be a potential therapeutic target for glioma immunotherapy.

Author Contributions

L.X. and T.L. performed cell biology experiments. F.S. and L.X. performed bioinformatics analysis. Q.L. was in charge of data collection. D.T. was in charge of project administration. Y.T. conceived and designed this article, were responsible for syntax modification and the article revised. All authors have read and agreed to the published version of the manuscript.

Funding

This work was supported by the National Natural Science Foundation of China, Grant/Award Number:31601206, Chongqing Yuzhong District Commission on Science & Technology, Grant/Award Number: 20190137, Chongqing Medical University Postdoctoral Science Foundation, Grant/Award Number: R16002.

Institutional Review Board Statement

Not applicable.

Informed Consent Statement

Not applicable.

Data Availability Statement

Data used in this study can be downloaded from TCGA (https://tcga-data.nci.nih.gov/tcga/), Ucsc Xena (https://xenabrowser.net/datapages/), CellMiner (https://discover.nci.nih.gov/cellminer/home.do), and Harmonizome (https://maayanlab.cloud/Harmonizome/) (accessed on 23 September 2021).

Acknowledgments

Thanks to all the staff who contributed to the TCGA and GEO databases. Thanks to the reviewers and editors for their sincere comments.

Conflicts of Interest

The authors declare that the research was conducted in the absence of any commercial or financial relationships that could be construed as a potential conflict of interest.

Abbreviations

ACC  Adrenocortical carcinoma
BLCA  Bladder urothelial carcinoma
BRCA  Breast invasive carcinoma
CESC  Cervical squamous cell carcinoma and endocervical adenocarcinoma
CHOL  Cholangiocarcinoma
COAD  Colon adenocarcinoma
COADREAD  Colon adenocarcinoma/Rectum adenocarcinoma esophageal carcinoma
DLBC  Lymphoid neoplasm diffuse large B-cell lymphoma
ESCA  Esophageal carcinoma
FPPP  FFPE pilot phase II
GBM  Glioblastoma
HNSC  Head and neck squamous cell carcinoma
KICH  Kidney chromophobe
KIPAN  Pan-kidney cohort (KICH+KIRC+KIRP)
KIRC  Kidney renal clear cell carcinoma
KIRP  Kidney renal papillary cell carcinoma
LAML  Acute myeloid leukemia
LGG  Low grade glioma
LIHC  Liver hepatocellular carcinoma
LUAD  Lung adenocarcinoma
LUSC  Lung squamous cell carcinoma
MESO  Mesothelioma
OV  Ovarian serous cystadenocarcinoma
PAAD  Pancreatic adenocarcinoma
PCPG  Pheochromocytoma and paraganglioma
PRAD  Prostate adenocarcinoma
READ  Rectum adenocarcinoma
SARC  Sarcoma
STAD  Stomach adenocarcinoma
SKCM  Skin cutaneous melanoma
STES  Stomach and esophageal carcinoma
TGCT  Testicular germ cell tumors
THCA  Thyroid carcinoma
THYM  Thymoma
UCEC  Uterine corpus endometrial carcinoma
UCS  Uterine carcinosarcoma
UVM  Uveal melanoma
OS  Osteosarcoma
ALL  Acute lymphoblastic leukemia
NB  Neuroblastoma
WT  High-risk wilms tumor
TCGA  The Cancer Genome Atlas
GEO  Gene Expression Omnibus
OS  Overall survival
DFI  Disease free interval
DFS  Disease free survival

Appendix A

Figure A1. Correlation between CHD5 expression and disease-specific survival (DSS). (A) Forest plots showing correlations between DSS and CHD5 expression in 44 tumor types. Kaplan-Meier analyses of the association between CHD5 expression and DSS in (B) Breast invasive carcinoma (BRCA), (C) prostate cancer (PRAD), (D) Colon adenocarcinoma/Rectum adenocarcinoma Esophageal carcinoma (COADREAD), (E) Glioma, (F) Kidney Chromophobe (KICH), (G) Pan-kidney cohort (KICH+KIRC+KIRP) (KIPAN), (H) low grade glioma (LGG).
Ijms 23 08489 g0a1
Figure A2. Correlation between CHD5 expression and disease-free interval (DFI). (A) Forest plots showing the relationship between CHD5 expression and DFI in 44 tumor types. Kaplan-Meier analyses of the association between CHD5 expression and DFI in (B) Glioma, (C) Pan-kidney cohort (KICH+KIRC+KIRP) (KIPAN), (D) Pancreatic adenocarcinoma (PAAD), (E) Kidney Chromophobe (KICH), (F) low grade glioma (LGG).
Ijms 23 08489 g0a2
Figure A3. Correlation between CHD5 expression and progression-free interval (PFI). (A) Forest plots showing the association between CHD5 expression and PFI in 44 tumor types. Kaplan-Meier analyses of the association between CHD5 expression and PFI in (B) Glioma, (C) Pan-kidney cohort (KICH+KIRC+KIRP) (KIPAN), (D) Pancreatic adenocarcinoma (PAAD), (E) Kidney Chromophobe (KICH), (F) low grade glioma (LGG), (G) Pancreatic adenocarcinoma (PAAD).
Ijms 23 08489 g0a3
Figure A4. Correlation between CHD5 expression and pan-cancer stromal score. (A) CHD5 expression was negatively correlated with stroma scores for KIPAN, SARC, Glioma, ACC, PCPG, LGG, KIRP, KIRC, LUSC, HNSC, and BRCA. (B) The expression of CHD5 was significantly positively correlated with the stromal scores of COADREAD, STES, STAD, ESCA, UVM, PRAD and CHOL. (C,D) No significant differences were found in other cancers.
Ijms 23 08489 g0a4
Figure A5. Correlation between CHD5 expression and pan-cancer immune score. (A) CHD5 expression was negatively correlated with immune scores in KIPAN, SARC, Glioma, LGG, KIRP, ACC, KIRC, LUSC, ALL, TGCG, PCPG, LAML, CESC, STAD, SKCM-M, BLAC and SKCM, (B) CHD5 expression was significantly positively correlated with the immune scores in PRAD and UVM. (C,D) No significant differences were found in other cancers.
Ijms 23 08489 g0a5

References

  1. Paul, S.; Kuo, A.; Schalch, T.; Vogel, H.; Joshua-Tor, L.; McCombie, W.; Gozani, O.; Hammell, M.; Mills, A. Chd5 requires PHD-mediated histone 3 binding for tumor suppression. Cell Rep. 2013, 3, 92–102. [Google Scholar] [CrossRef] [PubMed] [Green Version]
  2. Godfried, M.; Veenstra, M.; Valent, A.; Sluis, P.; Voûte, P.; Versteeg, R.; Caron, H. Lack of interstitial chromosome 1p deletions in clinically-detected neuroblastoma. Eur. J. Cancer 2002, 38, 1513–1519. [Google Scholar] [CrossRef]
  3. Mansfield, R.; Musselman, C.; Kwan, A.; Oliver, S.; Garske, A.; Davrazou, F.; Denu, J.; Kutateladze, T.; Mackay, J. Plant homeodomain (PHD) fingers of CHD4 are histone H3-binding modules with preference for unmodified H3K4 and methylated H3K9. J. Biol. Chem. 2011, 286, 11779–11791. [Google Scholar] [CrossRef] [Green Version]
  4. Rajakumara, E.; Wang, Z.; Ma, H.; Hu, L.; Chen, H.; Lin, Y.; Guo, R.; Wu, F.; Li, H.; Lan, F.; et al. PHD finger recognition of unmodified histone H3R2 links UHRF1 to regulation of euchromatic gene expression. Mol. Cell 2011, 43, 275–284. [Google Scholar] [CrossRef] [Green Version]
  5. Wysocka, J.; Swigut, T.; Xiao, H.; Milne, T.; Kwon, S.; Landry, J.; Kauer, M.; Tackett, A.; Chait, B.; Badenhorst, P.; et al. A PHD finger of NURF couples histone H3 lysine 4 trimethylation with chromatin remodelling. Nature 2006, 442, 86–90. [Google Scholar] [CrossRef] [PubMed]
  6. Hall, W.; Petrova, A.; Colbert, L.; Hardy, C.; Fisher, S.; Saka, B.; Shelton, J.; Warren, M.; Pantazides, B.; Gandhi, K.; et al. Low CHD5 expression activates the DNA damage response and predicts poor outcome in patients undergoing adjuvant therapy for resected pancreatic cancer. Oncogene 2014, 33, 5450–5456. [Google Scholar] [CrossRef] [PubMed]
  7. Wang, X.; Lau, K.; So, L.; Lam, Y. CHD5 is down-regulated through promoter hypermethylation in gastric cancer. J. Biomed. Sci. 2009, 16, 95. [Google Scholar] [CrossRef] [Green Version]
  8. Zhao, R.; Meng, F.; Wang, N.; Ma, W.; Yan, Q. Silencing of CHD5 gene by promoter methylation in leukemia. PLoS ONE 2014, 9, e85172. [Google Scholar] [CrossRef]
  9. Baykara, O.; Tansarikaya, M.; Bulut, P.; Demirkaya, A.; Buyru, N. CHD5 is a potential tumor suppressor in non small cell lung cancer (NSCLC). Gene 2017, 618, 65–68. [Google Scholar] [CrossRef]
  10. Fatemi, M.; Paul, T.; Brodeur, G.; Shokrani, B.; Brim, H.; Ashktorab, H. Epigenetic silencing of CHD5, a novel tumor-suppressor gene, occurs in early colorectal cancer stages. Cancer 2014, 120, 172–180. [Google Scholar] [CrossRef] [Green Version]
  11. Du, X.; Wu, T.; Lu, J.; Zang, L.; Song, N.; Yang, T.; Zhao, H.; Wang, S. Decreased expression of chromodomain helicase DNA-binding protein 5 is an unfavorable prognostic marker in patients with primary gallbladder carcinoma. Clin. Transl. Oncol. Off. Publ. Fed. Span. Oncol. Soc. Natl. Cancer Inst. Mex. 2013, 15, 198–204. [Google Scholar] [CrossRef]
  12. Wong, R.; Chan, L.; Tsang, T.; Lee, C.; Cheung, T.; Yim, S.; Siu, N.; Lee, S.; Yu, M.; Chim, S.; et al. CHD5 Downregulation Associated with Poor Prognosis in Epithelial Ovarian Cancer. Gynecol. Obstet. Investig. 2011, 72, 203–207. [Google Scholar] [CrossRef]
  13. Greten, F.; Grivennikov, S. Inflammation and Cancer: Triggers, Mechanisms, and Consequences. Immunity 2019, 51, 27–41. [Google Scholar] [CrossRef]
  14. Petitprez, F.; Meylan, M.; de Reyniès, A.; Sautès-Fridman, C.; Fridman, W. The Tumor Microenvironment in the Response to Immune Checkpoint Blockade Therapies. Front. Immunol. 2020, 11, 784. [Google Scholar] [CrossRef]
  15. Liu, Q.; Aminu, B.; Roscow, O.; Zhang, W. Targeting the Ubiquitin Signaling Cascade in Tumor Microenvironment for Cancer Therapy. Int. J. Mol. Sci. 2021, 22, 791. [Google Scholar] [CrossRef]
  16. Turley, S.; Cremasco, V.; Astarita, J. Immunological hallmarks of stromal cells in the tumour microenvironment. Nat. Rev. Immunol. 2015, 15, 669–682. [Google Scholar] [CrossRef]
  17. Galon, J.; Pagès, F.; Marincola, F.; Angell, H.; Thurin, M.; Lugli, A.; Zlobec, I.; Berger, A.; Bifulco, C.; Botti, G.; et al. Cancer classification using the Immunoscore: A worldwide task force. J. Transl. Med. 2012, 10, 205. [Google Scholar] [CrossRef]
  18. Angell, H.; Bruni, D.; Barrett, J.; Herbst, R.; Galon, J. The Immunoscore: Colon Cancer and Beyond. Clin. Cancer Res. Off. J. Am. Assoc. Cancer Res. 2020, 26, 332–339. [Google Scholar] [CrossRef] [Green Version]
  19. Kolla, V.; Zhuang, T.; Higashi, M.; Naraparaju, K.; Brodeur, G. Role of CHD5 in human cancers: 10 years later. Cancer Res. 2014, 74, 652–658. [Google Scholar] [CrossRef] [Green Version]
  20. Laut, A.; Dorneburg, C.; Fürstberger, A.; Barth, T.; Kestler, H.; Debatin, K.; Beltinger, C. CHD5 inhibits metastasis of neuroblastoma. Oncogene 2022, 41, 622–633. [Google Scholar] [CrossRef]
  21. Lang, J.; Tobias, E.; Mackie, R. Preliminary evidence for involvement of the tumour suppressor gene CHD5 in a family with cutaneous melanoma. Br. J. Dermatol. 2011, 164, 1010–1016. [Google Scholar] [CrossRef] [PubMed]
  22. Pei, S.; Chen, Z.; Tan, H.; Fan, L.; Zhang, B.; Zhao, C. SLC16A1-AS1 enhances radiosensitivity and represses cell proliferation and invasion by regulating the miR-301b-3p/CHD5 axis in hepatocellular carcinoma. Environ. Sci. Pollut. Res. Int. 2020, 27, 42778–42790. [Google Scholar] [CrossRef] [PubMed]
  23. Xiao, Q.; Chen, L.; Luo, H.; Li, H.; Kong, Q.; Jiao, F.; Pang, S.; Zhang, M.; Lan, F.; Fan, W.; et al. A rare CHD5 haplotype and its interactions with environmental factors predicting hepatocellular carcinoma risk. BMC Cancer 2018, 18, 658. [Google Scholar] [CrossRef] [PubMed]
  24. Sun, X.; Xiao, D.; Xu, T.; Yuan, Y. miRNA-24-3p promotes cell proliferation and regulates chemosensitivity in head and neck squamous cell carcinoma by targeting CHD5. Future Oncol. 2016, 12, 2701–2712. [Google Scholar] [CrossRef]
  25. Thompson, P.; Gotoh, T.; Kok, M.; White, P.; Brodeur, G. CHD5, a new member of the chromodomain gene family, is preferentially expressed in the nervous system. Oncogene 2003, 22, 1002–1011. [Google Scholar] [CrossRef] [Green Version]
  26. White, P.; Thompson, P.; Gotoh, T.; Okawa, E.; Igarashi, J.; Kok, M.; Winter, C.; Gregory, S.; Hogarty, M.; Maris, J.; et al. Definition and characterization of a region of 1p36.3 consistently deleted in neuroblastoma. Oncogene 2005, 24, 2684–2694. [Google Scholar] [CrossRef] [Green Version]
  27. Fujita, T.; Igarashi, J.; Okawa, E.; Gotoh, T.; Manne, J.; Kolla, V.; Kim, J.; Zhao, H.; Pawel, B.; London, W.; et al. CHD5, a tumor suppressor gene deleted from 1p36.31 in neuroblastomas. J. Natl. Cancer Inst. 2008, 100, 940–949. [Google Scholar] [CrossRef] [Green Version]
  28. Okawa, E.; Gotoh, T.; Manne, J.; Igarashi, J.; Fujita, T.; Silverman, K.; Xhao, H.; Mosse, Y.; White, P.; Brodeur, G. Expression and sequence analysis of candidates for the 1p36.31 tumor suppressor gene deleted in neuroblastomas. Oncogene 2008, 27, 803–810. [Google Scholar] [CrossRef] [Green Version]
  29. Garcia, I.; Mayol, G.; Rodríguez, E.; Suñol, M.; Gershon, T.; Ríos, J.; Cheung, N.; Kieran, M.; George, R.; Perez-Atayde, A.; et al. Expression of the neuron-specific protein CHD5 is an independent marker of outcome in neuroblastoma. Mol. Cancer 2010, 9, 277. [Google Scholar] [CrossRef] [Green Version]
  30. Fancello, L.; Gandini, S.; Pelicci, P.; Mazzarella, L. Tumor mutational burden quantification from targeted gene panels: Major advancements and challenges. J. Immunother. Cancer 2019, 7, 183. [Google Scholar] [CrossRef] [Green Version]
  31. Goodman, A.; Kato, S.; Bazhenova, L.; Patel, S.; Frampton, G.; Miller, V.; Stephens, P.; Daniels, G.; Kurzrock, R. Tumor Mutational Burden as an Independent Predictor of Response to Immunotherapy in Diverse Cancers. Mol. Cancer Ther. 2017, 16, 2598–2608. [Google Scholar] [CrossRef] [Green Version]
  32. Janjigian, Y.; Bendell, J.; Calvo, E.; Kim, J.; Ascierto, P.; Sharma, P.; Ott, P.; Peltola, K.; Jaeger, D.; Evans, J.; et al. CheckMate-032 Study: Efficacy and Safety of Nivolumab and Nivolumab Plus Ipilimumab in Patients with Metastatic Esophagogastric Cancer. J. Clin. Oncol.: Off. J. Am. Soc. Clin. Oncol. 2018, 36, 2836–2844. [Google Scholar] [CrossRef]
  33. Klempner, S.; Fabrizio, D.; Bane, S.; Reinhart, M.; Peoples, T.; Ali, S.; Sokol, E.; Frampton, G.; Schrock, A.; Anhorn, R.; et al. Tumor Mutational Burden as a Predictive Biomarker for Response to Immune Checkpoint Inhibitors: A Review of Current Evidence. Oncol. 2020, 25, e147–e159. [Google Scholar] [CrossRef] [Green Version]
  34. Kim, T.; Laird, P.; Park, P. The landscape of microsatellite instability in colorectal and endometrial cancer genomes. Cell 2013, 155, 858–868. [Google Scholar] [CrossRef] [Green Version]
  35. Picard, E.; Verschoor, C.; Ma, G.; Pawelec, G. Relationships Between Immune Landscapes, Genetic Subtypes and Responses to Immunotherapy in Colorectal Cancer. Front. Immunol. 2020, 11, 369. [Google Scholar] [CrossRef]
  36. Stanley, F.; Moore, S.; Goodarzi, A. CHD chromatin remodelling enzymes and the DNA damage response. Mutat. Res. 2013, 750, 31–44. [Google Scholar] [CrossRef]
  37. Bejarano, L.; Jordāo, M.; Joyce, J. Therapeutic Targeting of the Tumor Microenvironment. Cancer Discov. 2021, 11, 933–959. [Google Scholar] [CrossRef]
  38. Petitprez, F.; de Reyniès, A.; Keung, E.; Chen, T.; Sun, C.; Calderaro, J.; Jeng, Y.; Hsiao, L.; Lacroix, L.; Bougoüin, A.; et al. B cells are associated with survival and immunotherapy response in sarcoma. Nature 2020, 577, 556–560. [Google Scholar] [CrossRef]
  39. Klaver, Y.; Rijnders, M.; Oostvogels, A.; Wijers, R.; Smid, M.; Grünhagen, D.; Verhoef, C.; Sleijfer, S.; Lamers, C.; Debets, R. Differential quantities of immune checkpoint-expressing CD8 T cells in soft tissue sarcoma subtypes. J. Immunother. Cancer 2020, 8. [Google Scholar] [CrossRef]
  40. Lee-Chang, C.; Rashidi, A.; Miska, J.; Zhang, P.; Pituch, K.; Hou, D.; Xiao, T.; Fischietti, M.; Kang, S.; Appin, C.; et al. Myeloid-Derived Suppressive Cells Promote B cell-Mediated Immunosuppression via Transfer of PD-L1 in Glioblastoma. Cancer Immunol. Res. 2019, 7, 1928–1943. [Google Scholar] [CrossRef]
  41. Altieri, R.; Barbagallo, D.; Certo, F.; Broggi, G.; Ragusa, M.; Di Pietro, C.; Caltabiano, R.; Magro, G.; Peschillo, S.; Purrello, M.; et al. Peritumoral Microenvironment in High-Grade Gliomas: From FLAIRectomy to Microglia-Glioma Cross-Talk. Brain Sci. 2021, 11, 200. [Google Scholar] [CrossRef]
  42. Goldman, M.; Craft, B.; Hastie, M.; Repečka, K.; McDade, F.; Kamath, A.; Banerjee, A.; Luo, Y.; Rogers, D.; Brooks, A.; et al. Visualizing and interpreting cancer genomics data via the Xena platform. Nat. Biotechnol. 2020, 38, 675–678. [Google Scholar] [CrossRef]
  43. Blum, A.; Wang, P.; Zenklusen, J. SnapShot: TCGA-Analyzed Tumors. Cell 2018, 173, 530. [Google Scholar] [CrossRef]
  44. The Genotype-Tissue Expression (GTEx) project. Nat. Genet. 2013, 45, 580–585. [CrossRef]
  45. Nusinow, D.; Szpyt, J.; Ghandi, M.; Rose, C.; McDonald, E.; Kalocsay, M.; Jané-Valbuena, J.; Gelfand, E.; Schweppe, D.; Jedrychowski, M.; et al. Quantitative Proteomics of the Cancer Cell Line Encyclopedia. Cell 2020, 180, 387–402.e16. [Google Scholar] [CrossRef]
  46. Beroukhim, R.; Mermel, C.; Porter, D.; Wei, G.; Raychaudhuri, S.; Donovan, J.; Barretina, J.; Boehm, J.; Dobson, J.; Urashima, M.; et al. The landscape of somatic copy-number alteration across human cancers. Nature 2010, 463, 899–905. [Google Scholar] [CrossRef]
  47. Mermel, C.; Schumacher, S.; Hill, B.; Meyerson, M.; Beroukhim, R.; Getz, G. GISTIC2.0 facilitates sensitive and confident localization of the targets of focal somatic copy-number alteration in human cancers. Genome Biol. 2011, 12, R41. [Google Scholar] [CrossRef] [Green Version]
  48. Thorsson, V.; Gibbs, D.; Brown, S.; Wolf, D.; Bortone, D.; Ou Yang, T.; Porta-Pardo, E.; Gao, G.; Plaisier, C.; Eddy, J.; et al. The Immune Landscape of Cancer. Immunity 2018, 48, 812–830.e14. [Google Scholar] [CrossRef] [Green Version]
  49. Bonneville, R.; Krook, M.; Kautto, E.; Miya, J.; Wing, M.; Chen, H.; Reeser, J.; Yu, L.; Roychowdhury, S. Landscape of Microsatellite Instability Across 39 Cancer Types. JCO Precis. Oncol. 2017, 2017, 1–15. [Google Scholar] [CrossRef]
  50. Yoshihara, K.; Shahmoradgoli, M.; Martínez, E.; Vegesna, R.; Kim, H.; Torres-Garcia, W.; Treviño, V.; Shen, H.; Laird, P.; Levine, D.; et al. Inferring tumour purity and stromal and immune cell admixture from expression data. Nat. Commun. 2013, 4, 2612. [Google Scholar] [CrossRef]
  51. Li, T.; Fan, J.; Wang, B.; Traugh, N.; Chen, Q.; Liu, J.; Li, B.; Liu, X. TIMER: A Web Server for Comprehensive Analysis of Tumor-Infiltrating Immune Cells. Cancer Res. 2017, 77, e108–e110. [Google Scholar] [CrossRef] [PubMed] [Green Version]
  52. Newman, A.; Liu, C.; Green, M.; Gentles, A.; Feng, W.; Xu, Y.; Hoang, C.; Diehn, M.; Alizadeh, A. Robust enumeration of cell subsets from tissue expression profiles. Nat. Methods 2015, 12, 453–457. [Google Scholar] [CrossRef] [PubMed] [Green Version]
  53. Xu, L.; Xia, H.; Ni, D.; Hu, Y.; Liu, J.; Qin, Y.; Zhou, Q.; Yi, Q.; Xie, Y. High-Dose Dexamethasone Manipulates the Tumor Microenvironment and Internal Metabolic Pathways in Anti-Tumor Progression. Int. J. Mol. Sci. 2020, 21, 1846. [Google Scholar] [CrossRef] [PubMed] [Green Version]
Figure 1. Pan-cancer analysis of CHD5 expression. (A) Differential expression of CHD5 between tumor and normal tissues in pan-cancer analysis. (B,C) Expression of CHD5 in various cancer cell lines. (D) Cellular localization of CHD5 (p < 0.05). * p < 0.05; ** p < 0.01, **** p < 0.0001.
Ijms 23 08489 g001
Figure 2. CHD5 expression correlates with overall survival time (OS). (A) Forest plots showing the correlations between OS and CHD5 expression across 44 types of cancers. Kaplan-Meier analyses of the association between CHD5 expression and OS in (B) Breast invasive carcinoma (BRCA), (C) Acute Myeloid Leukemia (LAML), (D) Glioma, (E) Pan-kidney cohort (KICH+KIRC+KIRP) (KIPAN), (F) Neuroblastoma (NB), (G) Kidney Chromophobe (KICH), (H) Low Grade Glioma (LGG), and (I) Pancreatic adenocarcinoma (PAAD).
Ijms 23 08489 g002
Figure 3. Correlations between CHD5 expression and pan-cancer clinicopathology. (A) The expression of CHD5 correlates with patient’s age in Glioma (p = 0.02), KIRC (p = 0.03), UCS (p = 0.03) and MESO (p = 0.01). (B) The expression of CHD5 was correlated with gender (p < 0.05). (C) CHD5 was significantly differentially expressed across different stages of Glioma (p = 0.04). * p < 0.05.
Ijms 23 08489 g003
Figure 4. Correlation between CHD5 expression and CNV, TMB, and MSI in various cancer types. (A) Landscape of CHD5 mutation in 30 cancer types, (B) The CNV landscape of CHD5 mutations in 32 types of cancers, (C,D) Spearman correlation analysis for TMB, MSI and CHD5 gene expression. In the figure, the horizontal axis represents the correlation coefficient between the genes and TMB, and the vertical axis represents the different tumors. The size of the dots in the figure represents the correlation coefficient, and the different colors represent the significance of the p value. The bluer the color in the diagram, the smaller the p value. * p < 0.05, ** p < 0.01, *** p < 0.001, **** p < 0.0001.
Ijms 23 08489 g004
Figure 5. Relationship between CHD5 expression and tumor microenvironment factors. (A) CHD5 expression was negatively correlated with the stroma scores in Glioma, SARC, KIPAN, and ACC, and was positively correlated with the stroma scores in PRAD and CHOL. (B) CHD5 expression was negatively correlated with the immune scores in Glioma, LGG, SARC, KIRP, KIPAN and ACC.
Ijms 23 08489 g005
Figure 6. Pan-cancer analysis of the relationship between CHD5 expression and immune cell infiltration. (A) Correlation between CHD5 expression and B cell, CD4+T cell, CD8+ T cell, neutrophil, macrophage, DC infiltration in each patient. (B) CHD5 expression was significantly associated with immune cell infiltration in 41 types of cancers. * p < 0.05; ** p < 0.01, *** p < 0.001, **** p < 0.0001.
Ijms 23 08489 g006
Figure 7. Cellular functions of CHD5. (A) Real-time quantitative PCR detection after siRNA mediated knockdown of CHD5 in U87 cells. (B,C) CCK-8 assay results showing the increase in the viability of U87 cells upon the knockdown of CHD5. (D,E) Transwell assay results showing the increase in the migration and EMT progression in U87 cells upon the knockdown of CHD5. * p < 0.05.
Ijms 23 08489 g007
Publisher’s Note: MDPI stays neutral with regard to jurisdictional claims in published maps and institutional affiliations.

