Article

Comparative Analysis of Chloroplast Genome in Saccharum spp. and Related Members of ‘Saccharum Complex’

1
Guangxi Key Laboratory of Sugarcane Biology, Guangxi University, Nanning 530004, China
2
State Key Laboratory of Conservation and Utilization of Subtropical Agro-Bioresources, Guangxi University, Nanning 530004, China
3
Sugarcane Research Institute, Guangxi Academy of Agricultural Sciences, Nanning 530007, China
4
Ruili Breeding Station of Sugarcane Research Institute, Yunnan Academy of Agricultural Sciences, Ruili 678600, China
*
Authors to whom correspondence should be addressed.
These authors contributed equally to this work.
Int. J. Mol. Sci. 2022, 23(14), 7661; https://doi.org/10.3390/ijms23147661
Submission received: 7 June 2022 / Revised: 5 July 2022 / Accepted: 5 July 2022 / Published: 11 July 2022
(This article belongs to the Special Issue Plastids)

Abstract

:
High ploids of the sugarcane nuclear genome limit its genomic studies, whereas its chloroplast genome is small and conserved, which is suitable for phylogenetic studies and molecular marker development. Here, we applied whole genome sequencing technology to sequence and assemble chloroplast genomes of eight species of the ‘Saccharum Complex’, and elucidated their sequence variations. In total, 19 accessions were sequenced, and 23 chloroplast genomes were assembled, including 6 species of Saccharum (among them, S. robustum, S. sinense, and S. barberi firstly reported in this study) and 2 sugarcane relative species, Tripidium arundinaceum and Narenga porphyrocoma. The plastid phylogenetic signal demonstrated that S. officinarum and S. robustum shared a common ancestor, and that the cytoplasmic origins of S. sinense and S. barberi were much more ancient than the S. offcinarum/S. robustum linage. Overall, 14 markers were developed, including 9 InDel markers for distinguishing Saccharum from its relative species, 4 dCAPS markers for distinguishing S. officinarum from S. robustum, and 1 dCAPS marker for distinguishing S. sinense and S. barberi from other species. The results obtained from our studies will contribute to the understanding of the classification and plastome evolution of Saccharinae, and the molecular markers developed have demonstrated their highly discriminatory power in Saccharum and relative species.

1. Introduction

Sugarcane (Saccharum spp.), belonging to Poaceae, Panicoideae, Andropogoneae, and Saccharinae, is widely cultivated in tropical and subtropical regions in more than 90 countries (http://www.fao.org, accessed on 1 March 2022). The Saccharum genus consists of two wild species, S. spontaneum and S. robustum, and two ancient cultivars, S. barberi for cultivars from India and S. sinense from China, along with “noble” sugarcane S. officinarum, which has been used for sugar production for hundreds of years. Modern sugarcane interspecific hybridization work was undertaken in Java during the 1920s [1]. Since then, several founder sugarcane cultivars/hybrids have been frequently used as parental material for breeding, resulting in a narrow genetic base for modern sugarcane cultivars, which limits the continued improvement of commercial traits of varieties.
The ‘Saccharum complex’ has some genera closely related to sugarcane that are divergent in a large number of biological and agronomic traits but capable of interbreeding with sugarcane. Among them, Tripidium arundinaceum (2n = 60) [2] and Narenga porphyrocoma (2n = 30) [3] have excellent field characteristics, such as a high biomass, barren and drought tolerance, early maturity, strong stems, strong tillering ability, and mosaic disease resistance [4]. In particular, considerable efforts had been made in introgressing robust traits from Tripidium species into sugarcane. Meanwhile, N. porphyrocoma has also been used for sugarcane breeding through distant hybridization [3]. The F1 and BC1 hybrid of sugarcane and N. porphyrocoma showed resistance to smut [5]. Since the Saccharum complex/Saccharinae comprises gene resources that are helpful for sugarcane variety improvement, it is necessary to obtain an accurate phylogenetic relationship between Saccharum and its purported relatives, particularly for those species from outside of the core Saccharum.
Chloroplasts (cp) are inherited maternally in most plants, and each of these organelles contains a quadripartite circular molecule of double-stranded DNA that comprises two inverted repeats (IRs), and single-copy regions, the large and small single-copy regions (LSC and SSC). Like most angiosperms, the chloroplasts of sugarcane are inherited maternally [6]. As a result of their relatively small size, simple structure, and conserved gene content, cpDNA sequences have been widely used for phylogenetic studies, and complete cp genome sequences could provide valuable datasets for resolving taxonomical complexes and/or DNA barcoding (e.g., matK and rbcL) [7]. In addition, the cp genomes have proven to be more informative than cp DNA fragments in revealing the phylogeny of land plants [8,9]. With the advent of next-generation sequencing technologies, the complete chloroplast genome sequences obtained by high throughput techniques could significantly increase the phylogenetic resolution and provide new insight into the taxonomic relationships of the Saccharum complex. Nevertheless, based on the results obtained recently, distinguishing closely related species using universal or specific DNA barcodes may be extremely difficult [10]. A comparative analysis of the complete sequences of chloroplast genomes was successfully used in the Aldama [11] and tPinus mugo complex [12], and their candidate barcode regions were potentially useful for genetic identification. Saccharum species have been restricted to being investigated in nuclear genomics because of their high ploids and large genome size, whereas their chloroplast genomes are much smaller and relatively simple. Therefore, a comparison of the complete cp genome sequences could reveal novel genome features such as single-nucleotide polymorphisms (SNPs), insertions/deletions (InDels), and microsatellites. Moreover, SNPs-based dCAPS markers have been utilized for genetic analysis and selective breeding in allopolyploid species such as oats [13], wheat [14], and Brassica napus [15].
In Saccharum, the complete cp genomes of Saccharum hybrid NCo310 [16], SP80-3280 [17], and RB867515 [18]; S. spontaneum SES205A, SES234B [19], and Yunnan 83-184 [20]; S. officinarum Badila and IJ76-514 were obtained in previous studies. More recently, the complete cp genomes of T. arundinaceum [21,22] and N. porphyrocoma [23] have been sequenced and assembled. The analysis of chloroplasts in Saccharum and related species focused on three aspects: (1) the structural features of the cp genome were compared with Saccharum species and other agronomically and industrially important monocots, such as Zea mays and Sorghum bicolor [16]; (2) the molecular classification of all Saccharum species and their nearest evolutionary neighbors was elucidated by plastid-based studies [23]; (3) the plastid view on sugarcane origins [20]. These results have indicated the potential of this approach to elucidate the phylogenetic relationships within the ‘Saccharum complex’.
However, as the major member of Saccharum species, the cp genomes of S. robustum, S. barberi, and S. sinense have not been sequenced and assembled yet, which is urgently required for a comprehensive understanding of the genus Saccharum. Meanwhile, the cp genomes of representative sugarcane germplasm were absent. Molecular sequence studies on the Saccharum genus to date have been small in scale, involving either limited marker studies or being based only on phylogenies derived from a few chloroplast regions or a few genomic regions. The situation is even more complex when attempting to distinguish between cultivars that might only be a few decades divergent from one another. In this study, we aimed to obtain the complete cp genome sequences of Saccharum and its relative genera to characterize those genome structures, gene content, and other characteristics. The whole-genome sequencing (WGS) paired-end reads were used to assemble the corresponding plastomes to (1) enrich, update, and improve the database genomics of Saccharinae, (2) improve the phylogenetic resolution of the defined species complexes, and (3) develop efficient markers for germplasm evaluation and species discrimination in Saccharum and Saccharum-relative species.

2. Results

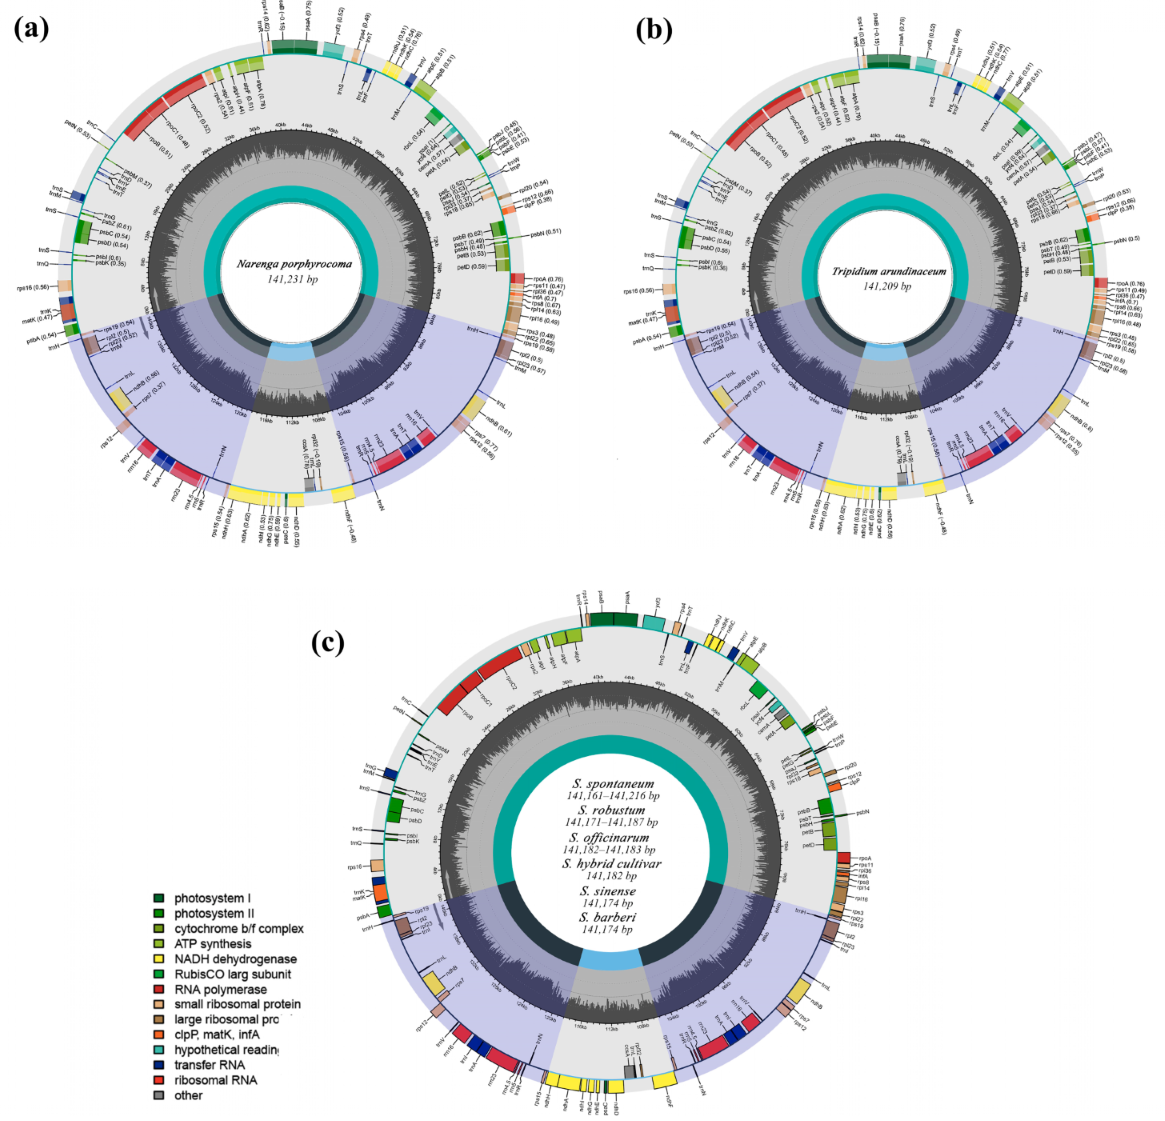
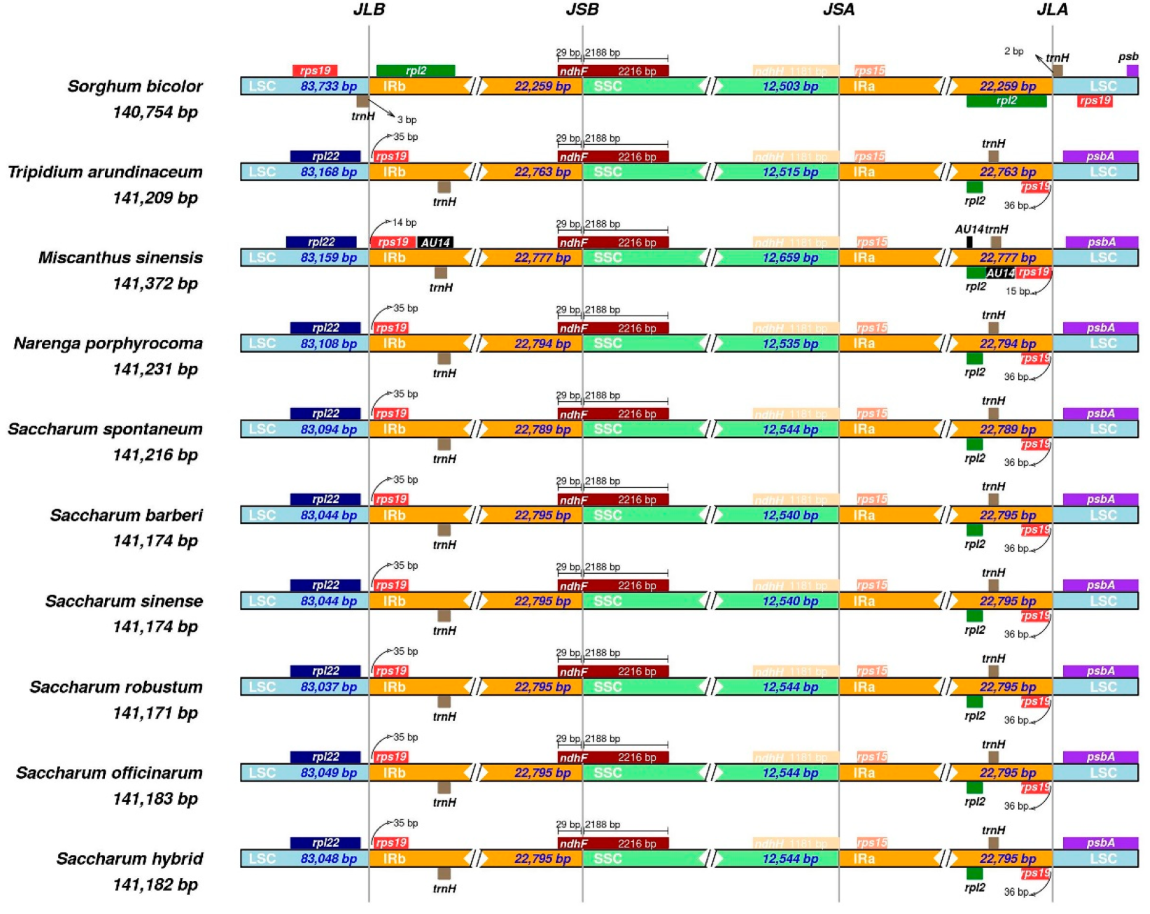
2.1. Plastid Genome Structure and Organization

We sequenced and de novo assembled 19 cp genomes of Saccharinae members. Combined with 4 genomes that were assembled using raw reads from NCBI SRA database, a total of 23 chloroplast genomes (Table S1) was used for plastid genome comparison, which included one species from Tripidium, one from Narenga, and twenty-one species from Saccharum (four S. spontaneum species, four S. robustum species, two S. sinense species, three S. barberi species, four S. officinarum species, and four S. hybrids). The complete chloroplast genome of N. porphyrocoma (141,231 bp) (Figure 1a) contained a large single-copy (LSC) region (83,107 bp), and a small single-copy (SSC) region (12,533 bp), which were separated by a pair of IRs (IRa and IRb; 22,794 bp each), 8 rRNA, and 38 tRNA, whereas that of T. arundinaceum (141,209 bp) (Figure 1b) consisted of an LSC (83,167 bp), an SSC (12,513 bp), and a pair of IRs (22,763 bp each), 8 rRNA and 38 tRNA.
In Saccharum, assembly sizes ranged from 141,161 bp (IND81-013, S. spontaneum) to 141,216 bp (SP79-9, S. spontaneum) (Figure 1c). All had a typical quadripartite structure, comprising an SSC (12,538–12,542 bp) and an LSC (82,036–83,093 bp) region separated by a pair of IRs (22,789–22,795 bp). The cp genome length varied from 141,161 to 141,216 bp, with a medium-size of 141,177 bp. In Saccharum, S. spontaneum ( x ¯ = 141,183 ± 26 bp) had the most variable length, followed by S. robustum (141,171–141,187 bp, x ¯ = 141,179 ± 9 bp) and S. officinarum (141,182–141,183 bp, x ¯ = 141,183 ± 1 bp). Across the 21 chloroplast genome sequences in Saccharum, the cp genome length was most conserved in S. sinense (141,174 bp, x ¯ = 141,174 ± 0 bp) and S. barberi (141,174 bp, x ¯ = 141,174 ± 0 bp), as well as S. hybrid (141,182 bp, x ¯ = 141,182 ± 0 bp) (Table 1).
In terms of synteny and gene number, both were highly conserved in the assembled accessions in Saccharum, Tripidium, and Narenga. Gene annotation showed that there were 130 genes in all assembled cp genomes, including 83 protein-coding genes (74 single copy protein-coding genes, 7 repeated/IR genes, and 2 copies of ndhB, rps12, rps19, rpl2, rpl23, rps7, and rps15), 38 tRNA genes (9 repeated/IR genes and 2 copies of trnA-UGC, trnH-GUG, trnI-CAU, trnV-GAC, trnI-GAU, trnA-UGC, trnR-ACG, trnN-GUU, and trnL-CAA), and 8 rRNA genes (4 repeated/IR genes and 2 copies of rrn23, rrn4.5, rrn5, and rrn16) (Table S2). Among the annotated genes, 13 genes had introns in all species, of which, there were two introns for ycf3 and one intron for the other 12 genes (atpF, ndhA, ndhB, rps16, rpl16, rpl2, trnK-UUU, trnS-CGA, trnL-UAA, trnV-UAC, trnT-CGU, and trnA-UGC). Interestingly, the gene rps12 had two introns but with a trans-splicing, with one of its exons located in the LSC region, and the other duplicated by the IRs. The members of the Saccharum complex lost accD (encoded subunits of Acetyl-CoA carboxylase) and ycf1, which were also absent in the cp genomes of other Panicoideae grasses [16].

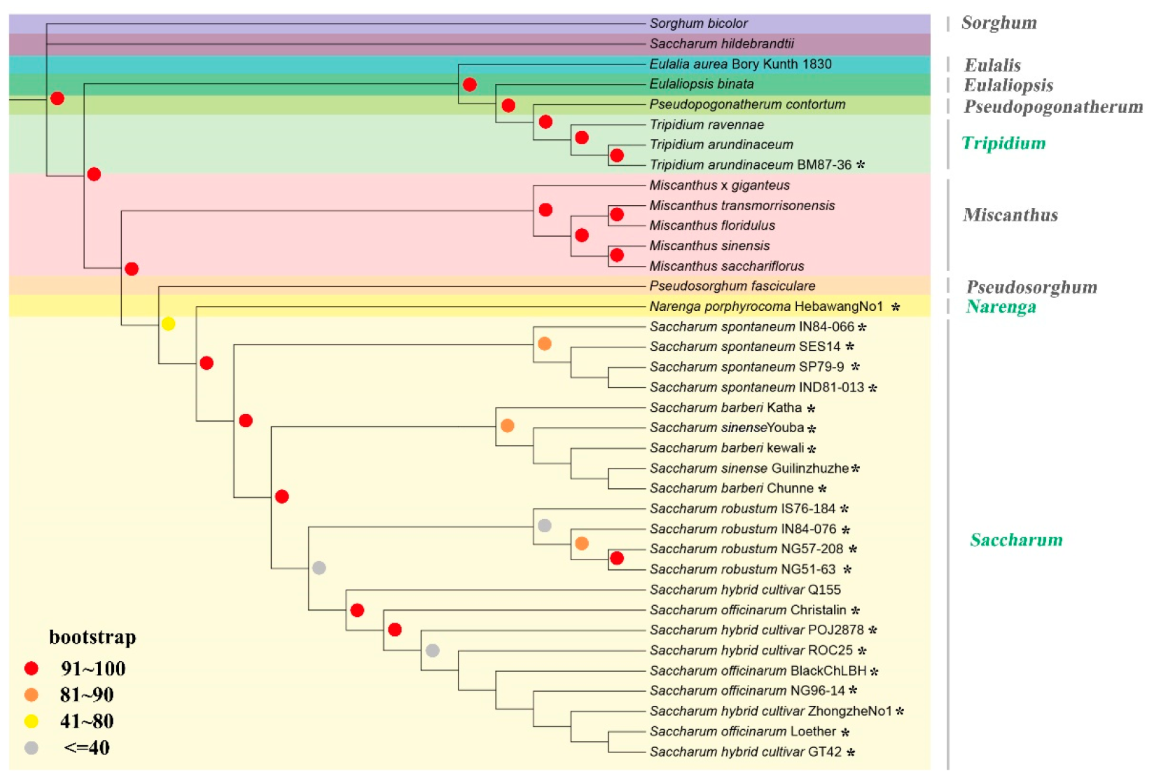
2.2. Phylogenetic Analysis of Saccharinae Species

Maximum likelihood (ML) phylogenetic analysis was performed based on 74 protein-coding genes (PCGs), which were highly conserved single copy protein-coding genes shared among 36 species in Saccharinae (23 cp genomes obtained in this study) (Table S3), rooted using Sorghum bicolor as outgroup. The phylogenetic tree showed that all Saccharum species were clearly clustered into a lineage (Figure 2). S. spontaneum diverged from other Saccharum species firstly, whereas S. sinense and S. barberi were clustered into the same clades, being sisters to S. robustum and S. officinarum, and they probably had different S. officinarum accessions as an ancestor in the hybridization, contributing to their differences in genome compositions. The phylogram showed that S. officinarum and sugarcane modern cultivar were closer to S. robustum than ancient hybrid species S. sinense and S. barberi.

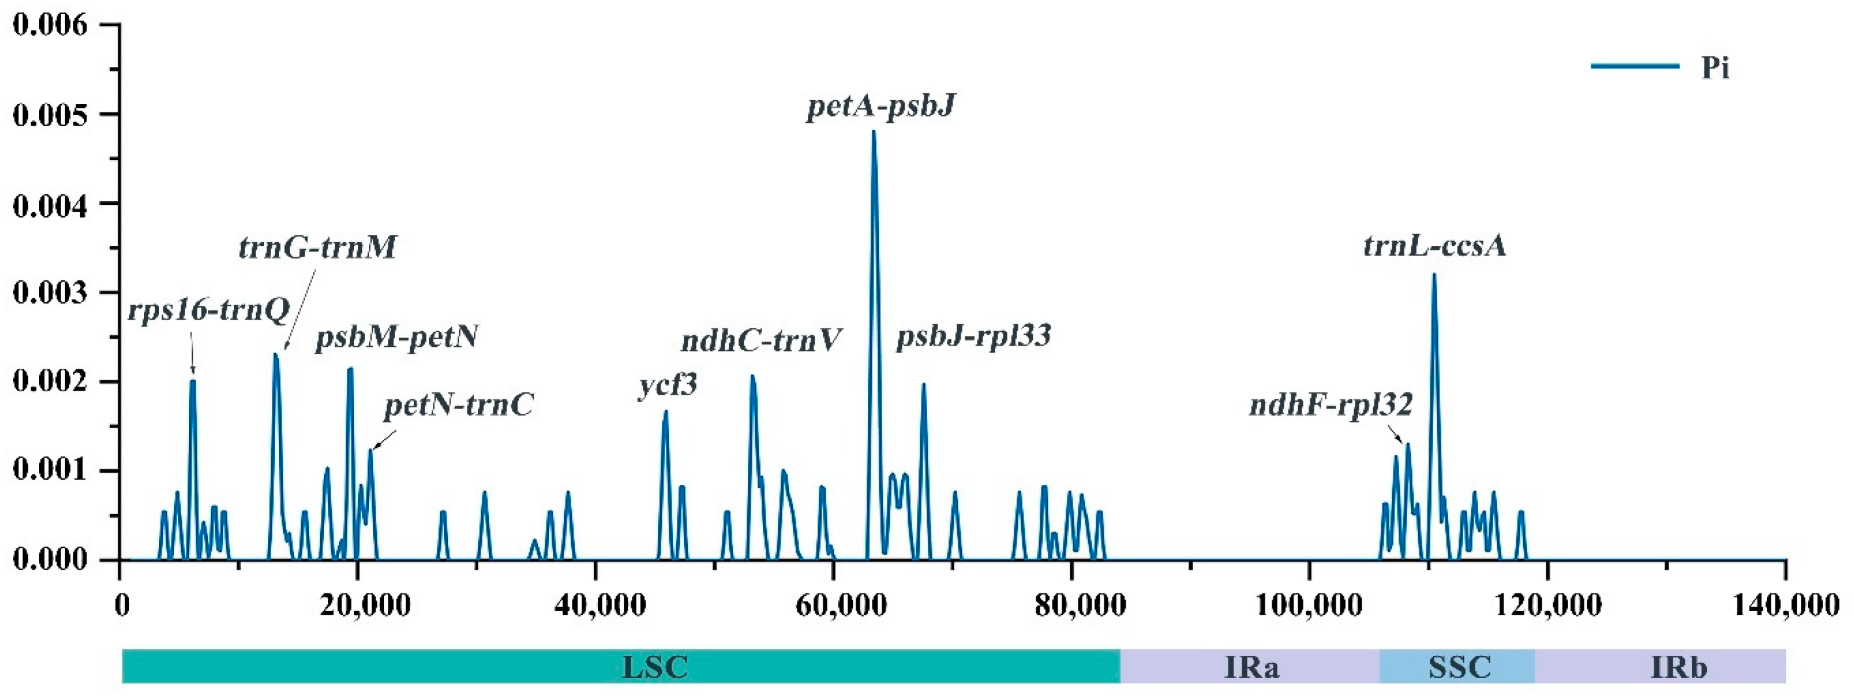
2.3. Repeat Analysis and Genetic Diversity Assessment

Chloroplast repeats with a high diversity in copy numbers are usually useful for markers development to investigate the population genetics and biogeography of allied taxa. In the MISA analyses, a total of 36 microsatellites regions (>=10 bp) were identified in the six Saccharum plastid genomes: 34 in T. arundinaceum and 33 in N. porphyrocoma. The distribution, types, and numbers of repeats were highly similar among the plastomes. The most abundant SSRs were mononucleotide, and the number of that was 26 in T. arundinaceum and S. spontaneum, and 27 in other species. The number of dinucleotide SSRs was the same in all species. Interestingly, trinucleotide SSRs were found in the plastomes of T. arundinaceum, and hexanucleotide SSRs were found in the plastomes of N. porphyrocoma, but were not detected in the six Saccharum plastomes. Detailed information about SSR types, SSR sequences, regions, and start/end positions of the aforementioned SSRs in the cp genome is presented in Supplementary Tables S4 and S5.
There were no large structural variations, except for SNPs, and InDels in Saccharum cp genomes (Tables S6 and S7). Among six Saccharum species, S. spontaneum had the largest number of SNPs (68) and InDels (43), whereas S. officinarum had the smallest number of SNPs (10) and InDels (5). S. robustum had 20 SNPs and12 InDels that were detected, and S. sinense and S. barberi had the same number of SNPs (22) and InDels (10). Most of the SNPs were found in intergenic sequences (52), and the maximum number of SNPs was found in ndhF-rpl32(8), followed by ndhC-trnV-UAC (7), psbM-petN (4), trnG-GCC-trnM-CAU (4), rps16-trnQ-UUG (3), and petA-psbJ (3). Seven SNPs were reported from introns of six genes, which was rps16 (1), trnG-UCC (1), ycf3 (1), trnV-UAC (1), rps12 (2), and rps16 (1). Fifteen SNPs were located in the coding sequence (CDS) of genes involved in a variety of biological processes, from transcription (rpoC1 and rpoC2) to translation (rps8 and rps3), the subunits of ATP synthase (atpA, atpB, and atpF), subunits of photosystem II (psbE and ycf3), c-type cytochrome synthesis (ccsA), and subunits of NADH-dehydrogenase (ndhF and ndhD). Mostf InDels were found in intergenic sequences, except for two InDels found in ycf3 introns in S. spontaneum. Two long insertion fragments found in S. spontaneum were 27 bp and 50 bp, whereas one base insertion was found in other Saccharum species.

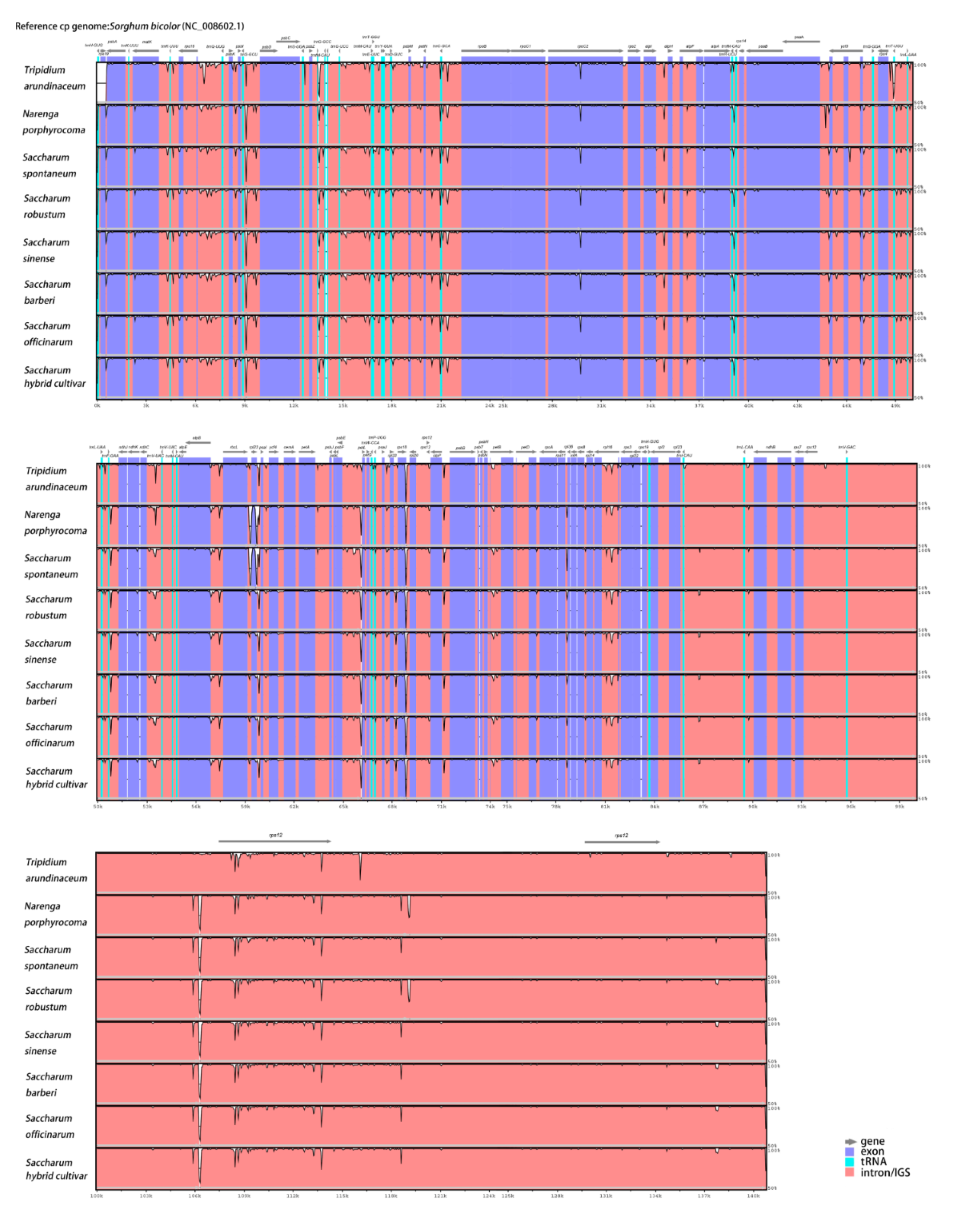
2.4. Comparison of Chloroplast Genome Sequences

The LSC/IRs and IRs/SSC borders and their adjacent genes were compared in the six Saccharum cp genomes and other Saccharine species (Figure 3). The rps19 gene was located in the IRb region entirely, 35 bp away from the LSC/IRb border. The ndhF gene was situated at the junction of IRb/SSC, extending 29 bp into the IRb region. Overall, the structure and gene content of the six chloroplast genomes were consistent, and no significant expansion or contraction of IR regions were found in the Saccharum spp. and two related species.
To investigate the similarities and differences in the cp genome sequences between Saccharum and other species of Saccharinae, a global alignment program was used to align these sequences. The result was plotted using the mVISTA tool with sorghum bicolor as a reference. Those closely related species had little difference in cp genome size, ranging from 141,174 bp to 141,231 bp. As shown in Figure 4, the structures of these cp genomes were conserved. The global patterns of sequence similarities among these sequences were very high.
A comparative sequence analysis of the eight Saccharinae species using mVISTA revealed a high sequence identity, with identity ranging from 97.89% to 99.95%, suggesting that Saccharinae chloroplast genomes were extremely conserved. Overall, the tRNA region was the most conservative (identity = 99.95 ± 0.01%), and exon regions (identity = 99.80 ± 0.00%) were more conserved than the intron region (identity = 99.04 ± 0.14%) and intergenic regions (identity = 98.19 ± 0.19%). Most high polymorphic regions were located in the intergenic regions (such as rps16-trnQ, trnG-trnM, psbM-petN, ndhC-trnV, petA-psbJ, and psbJ-rpl33). These regions may be undergoing more rapid nucleotide substitution at the species level, indicating their potential applications for developing molecular markers for phylogenetic analyses and plant identification in Saccharinae species. A few divergent regions were also observed in the genes coding regions of matK, psbB, psaB, and rpoA, and introns of atpF, rps16, rpl16, and ycf3.

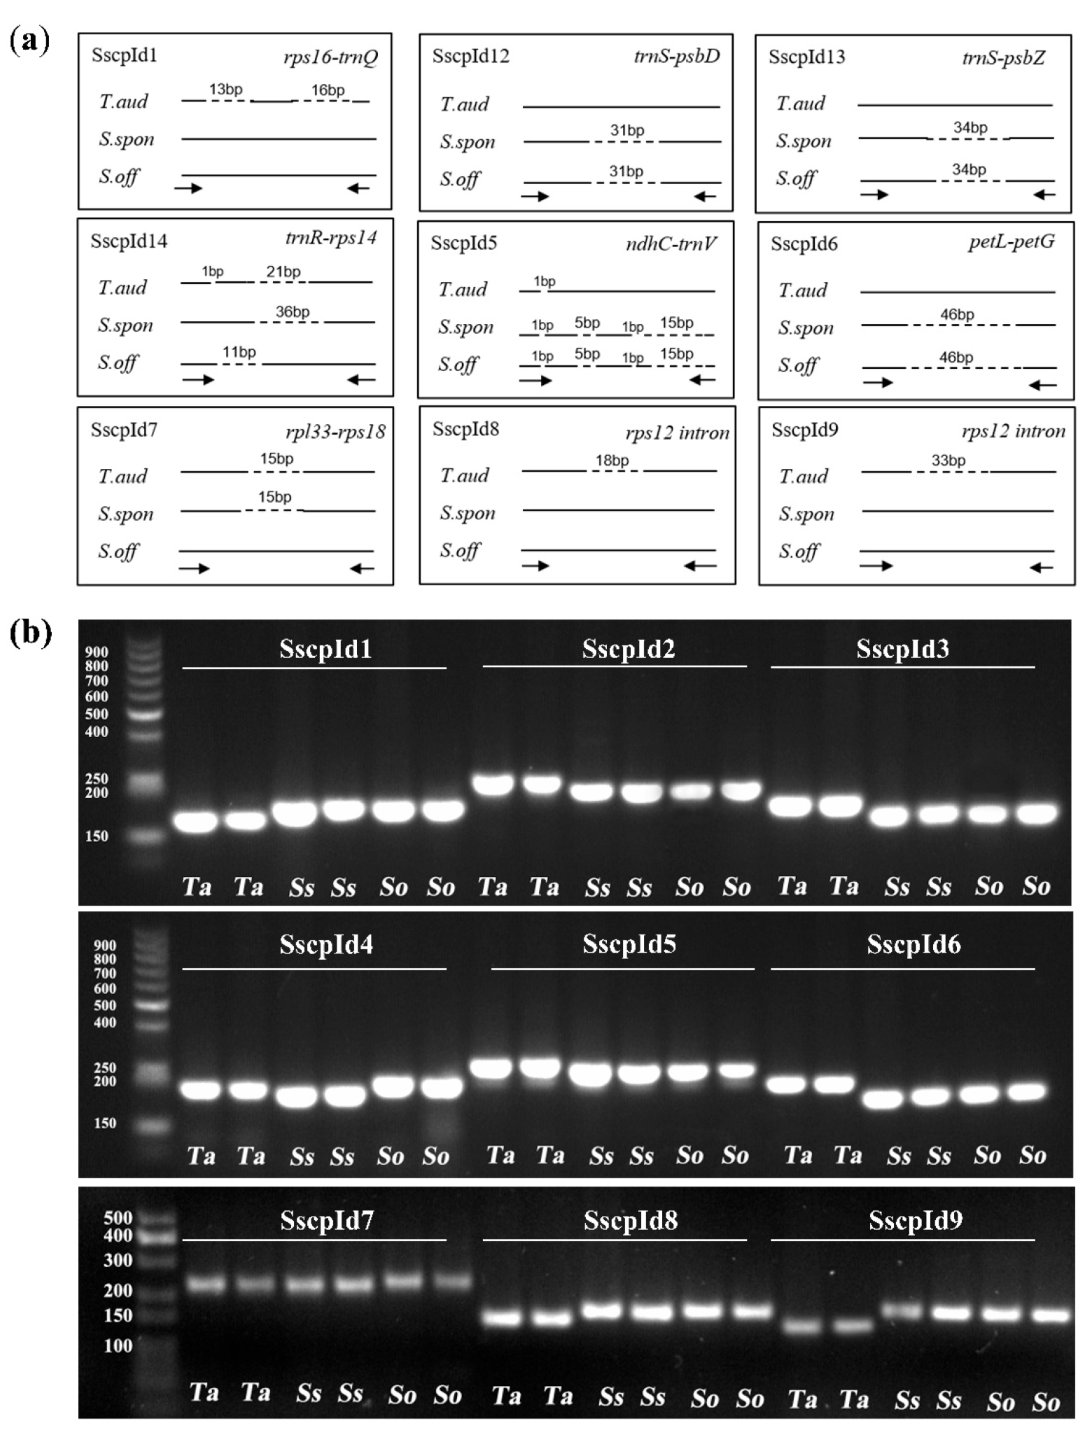
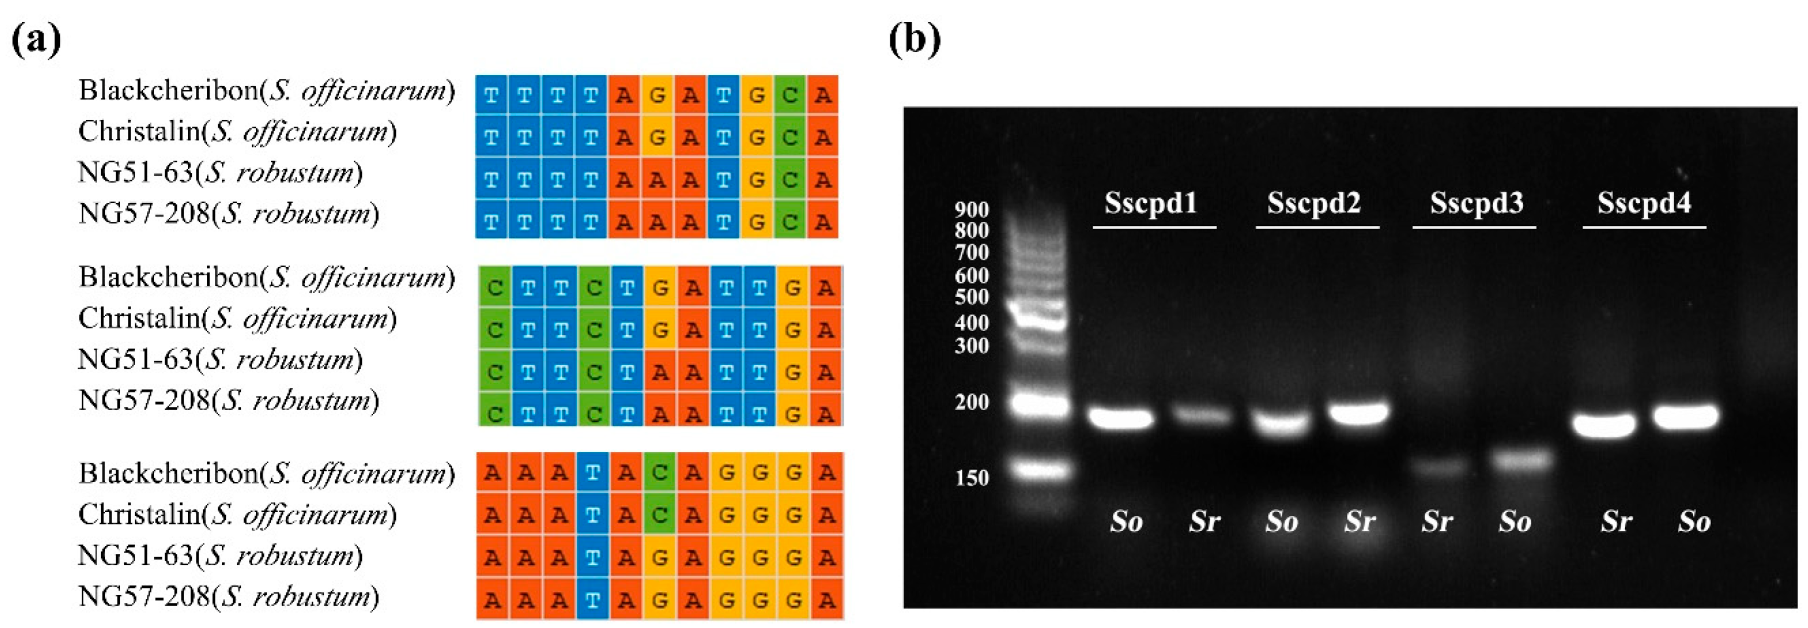
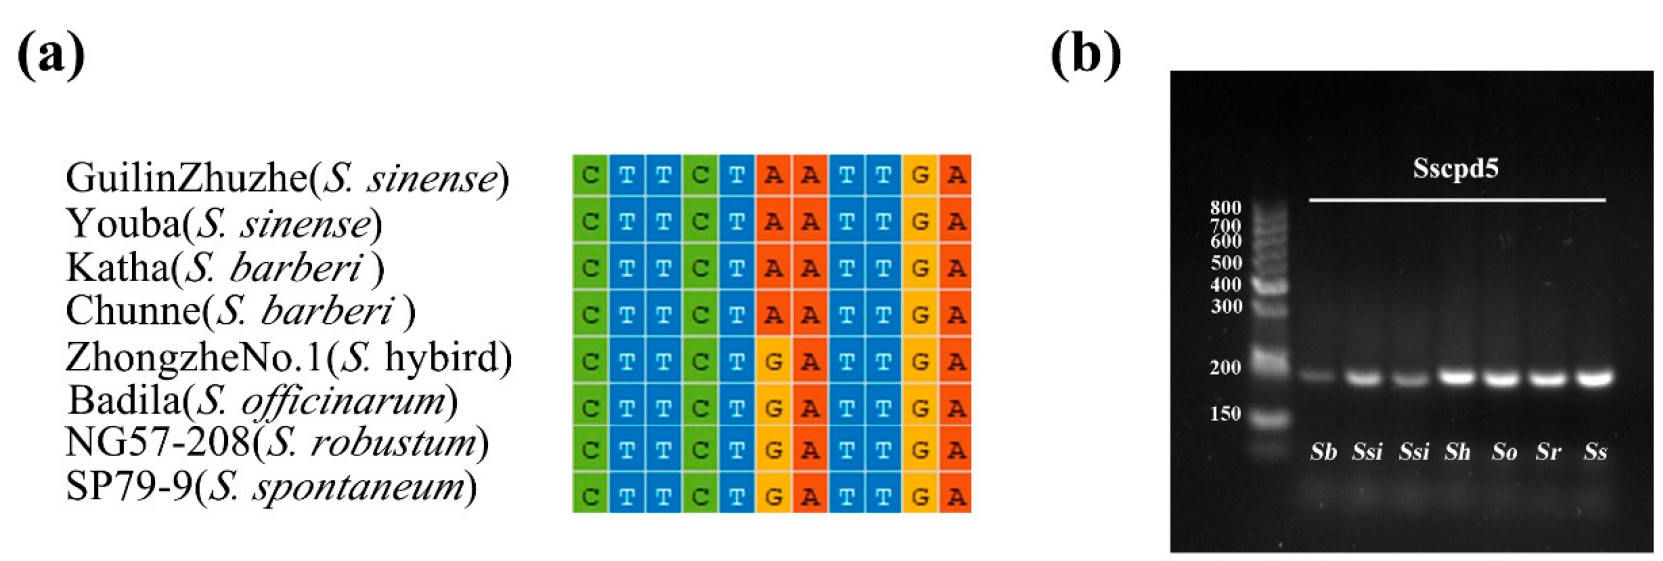
2.5. Development of Markers to Discriminate Saccharum and Sugarcane-Relative Species

The nucleotide diversity (Pi) of the chloroplast genomes in the six Saccharum species (including 21 accessions) was also calculated to assess the sequence divergence level of these species (Figure 5). The average Pi value was 0.000265 (range 0–0.00518) in the LSC region, and 0.000468 (range 0–0.00324) in the SSC region, whereas that of the IR region was 0. Most of the sequences with high Pi values were spacer regions between genes. Among these spacer regions, rps16-trnQ, trnG-trnM, psbM-petN, petN-trnC, ndhC-trnV, petA-psbJ, psbJ-rpl33, ndhF-rpl32, and trnL-ccsA were the nine regions with Pi values bigger than 0.01000. Only one coding region (ycf3) had high Pi values over 0.01000. These hotspot regions of divergence could be applied in developing DNA markers for distinguishing Saccharum species. We also calculated Pi for chloroplast genome sequences of each species to investigate the sequence variation at interspecies level. The highest Pi value was 0.00007 in S. robustum, followed by that of S. spontaneum with 0.00003, whereas the lowest Pi value was 0 in S. officinarum, S. sinense, S. barberi, and S. hybrids. The Pi values of the two wild species (S. spontaneum and S. robustum) within the genus Saccharum were higher than that of the domesticated species (S. officinarum, S. sinense, S. barberi, and S. hybrids), showing that the wild species had the higher sequence diversity.
Based on the alignment of complete cp genome sequences, the nine most variable loci based on the analysis of all twenty-one individuals were selected as DNA markers for development (Figure 6a). Markers were derived from InDels in the intergenic regions, including rps16-trnQ, trnS-psbD, trnS-psbZ, trnR-rps14, ndhC-trnV, petL-petG, rpl33-rps18, and rps12 introns (Table 2). These nine markers were classified into three categories based on their differentiation ability. For the first category, SscpId4 in the trnR-rps14 intergenic region was able to differentiate each of the three species, T. arundinaceum, S. spontaneum, and S. officinarum, which had a 188 bp, 172 bp, and 198 bp expected amplified fragment size, respectively. For the second category, the marker SscpId7 (15 bp InDel in the rpl33-rps18 region) could differentiate S. spontaneum and T. arundinaceum from other Saccharum species. For the third category, all of the rest markers could differentiate T. arundinaceum from Saccharum species, which had a 29 bp, 31 bp, 34 bp, 21 bp, 46 bp, 18 bp, and 33 bp fragment length difference for SscpId1, SscpId2, SscpId3, SscpId5, SscpId6, SscpId8, and SscpId9, respectively. Regarding validation experiments using six samples, two accessions from each species showed the power of these markers to separate the target samples (Figure 6b). These markers were valuable tools for accurate germplasm evaluation in sugarcane research and breeding programs.
The species-specific SNPs between S. robustum and S. officinarum were used to develop dCAPS markers to generate the mismatches near SNPs for the recognition site of restriction endonuclease (Table 3). One SNP in trnG-trnM intergenic regions (“G” for S. officinarum, and “A” for S. robustum) was used to design two dCAPS markers Sscpd1 and Sscpd2 (Figure 7a), with the TaqI and XbaI digestion site in the amplicon fragment using S. robustum DNA as a template, respectively. Sscpd3 and Sscpd4 were designed for SNPs in the petA-psbJ (“G” for S. officinarum, and “A” for S. robustum) and rbcL-psaI (“C” for S. officinarum, and “G” for S. robustum) intergenic region, with the TaqI digestion site in the amplicon fragment using S. officinarum DNA as a template. The validation showed that the markers could separate S. officinarum (Badila) and S. robustum (NG57-208) clearly by the fragment length difference (Figure 7b), indicating that these dCAPS markers worked.
The species-specific SNPs between S. sinense, S. barberi, and other Saccharum spp. (including S. hybrid, S. officinarum, S. robustum, and S. spontaneum) were used to develop the dCAPS marker (Table 4). Sscpd5 designed for SNPs in the rbcL-psaI (“A” for S. sinense and S. barberi, and “G” for other Saccharum spp.) intergenic region, with the TaqI digestion of the amplicon producing a digested fragment, except in S. sinense and S. barberi, resulting in a 201 bp fragment size in S. sinense and S. barberi, and 216 bp in other Saccharum species, respectively. The validation results showed that these markers could clearly separate ancient cultivars S. sinense and S. barberi from modern sugarcane hybrids, S. officinarum and S. robustum, by the fragment length difference (Figure 8b), indicating that the dCAPS marker worked for the discrimination of S. sinense/S. barberi from other Saccharum species.

3. Discussion

In this study, we firstly sequenced and assembled cp genomes of S. barberi, S. sinense, and S. robustum. A total of 23 cp genomes of Saccharinae were presented, including 6 Saccharum species and 2 Saccharum-related species, N. porphyrocoma and T. arundinaceum, which enriched and improved the chloroplast database of Saccharinae. The chloroplast sequences of Saccharum species showed high variation in their intergenic regions. Based on sequence polymorphisms of chloroplast genomes assembled in this study, nine InDels markers and five dCAPS markers were successfully developed. Those markers not only enriched the marker for species discrimination in Saccharinae, but also had highly discriminatory power in Saccharum species and Saccharum-relative species.

3.1. Differences in Gene and Structure of Chloroplast Genomes among Saccharinae Species

For the first time, the chloroplast genomes of the representative six species in Saccharum and two relative species T. arundinaceum and N. porphyrocoma have been described, which provides important insights into the characteristics of plastid genomes of the members of Saccharinea. Our results showed that the chloroplast genomes of Saccharum species were extremely similar, and the genome sizes were similar to those of most plant cp genomes reported previously [20,23,24,25,26], indicating their high level of conservation, especially in terms of chloroplast genome organization, gene content, and SSRs. The expansion and contraction of IR regions were the main cause of variation in cp genome sizes [27]. We compared the cp IR boundary regions of reported plastomes to those of closely related species and found slight differences between closely related species. The six chloroplast sequences of Saccharum species showed higher variation in non-coding regions than in their coding regions. Some of the mutation hotspot regions, including rps16-trnQ, trnG-trnM, psbM-petN, petN-trnC, ndhC-trnV, petA-psbJ, psbJ-rpl33, ndhF-rpl32, and trnL-ccsA, were detected from the cp genomes, which were potential regions for marker development for species discrimination.

3.2. Plastid View on the Evolutionary Relationships within Saccharinae

Within Saccharum, the lineage of S. spontaneum diverged from the other Saccharum species firstly, and S. officinarum diverged from a common ancestor with S. robustum. S. sinense and S. barberi were clustered as a monophyletic group with the S. officinarum and S. robustum linage, suggesting that their maternal origins might be the common ancestors. S. sinense and S. barberi were more distant to S. robustum than S. officinarum and modern sugarcane cultivar. As expected, high polymorphisms within species were observed in the S. spontaneum and S. robustum clade, possibly because they were wild species and had widely ecological distributions. Low polymorphisms were observed in branches S. sinense and S. barberi, indicating their limited maternal origins.
The existing consensus within Saccharum was that S. officinarum originated from S. robustum, whereas S. sinense and S. barberi were believed to have arisen by the local/natural hybridization of S. officinarum with S. spontaneum. Recent studies [28] based on homologous haplotypes suggested that S. officinarum was presumed to be derived from S. robustum 0.64 Mya ago, and S. officinarum and S. robustum were derived from interspecific hybridization between two unknown ancestors [19]. The phylogram presented in the current study confirmed that S. officinarum shares a common ancestor with S. robustum, but the true natural evolutionary processes are still unclear. Our results demonstrated that S. sinense and S. barberi might be from a single-origin natural hybridization and might have arisen earlier than previously inferred (4000 years BP) [19]. However, more evidence is required to corroborate this conclusion. In addition, in the case of some closely related taxa, the use of cp genomes may fail to distinguish these taxa at the intrageneric level [11,12].
Within the ‘Saccharum complex’, T. arundinaceum and N. porphyrocoma were considered as excellent gene resources for sugarcane variety improvement. Many closely related species have been employed within sugarcane breeding programs, but the information on the phylogeny of the core ‘Saccharum complex’ is still limited, especially species such as Erianthus rockii Keng, a close relative that is used in the introgressing process with sugarcane. Previous studies had suggested that Tripidium and Saccharum were divergent eight million years ago, last sharing a common ancestor twelve million years ago [21]. However, the phylogram in this study showed that T. arundinaceum was sister to E. aurea, which was closely related to Miscanthus. The distant plastid phylogenetic relationship between sugarcane and Tripidium suggested that these taxa may be less cross-compatible with sugarcane than Erianthus and Miscanthus, the same as a previous study [25], and were therefore not ideal for crosses with sugarcane. Recently, a comparison of chloroplast genomes and ITS phylogenies revealed that Erianthus is monophyletic with Narenga and Saccharum [23], but the phylogram in this study revealed that T. arundinaceum (once named Saccharum arundinaceum [29] or Erianthus arundinaceum [22]) is clustered into the lineage of Tripidium. Therefore, these accessions should be classified as genus ‘Tripidium’ instead of its traditional genus ‘Saccharum’ or ‘Erianthus’. The phylogenomic analysis had a good boostraps branch that supported that N. porphyrocoma typically emerged as sister to Saccharum, demonstrating that Narenga was more closely related to Saccharum than Tripidium.

3.3. Development of Markers at the Inter- and Intra-Species Level for Saccharum

The cytoplasm plays a significant role in the inheritance and realization of agronomically important traits. To date, many examples of the influence of the cytoplasmic background on numerous plant traits, including those of great biological and economic importance, have been documented [30]. The identification of correct parental germplasm and verifying the cytoplasm origin of their progeny are crucial for sugarcane breeding. The matrilineal inheritance of chloroplasts makes it possible to use their SNPs for the identification of maternal parents [31].
Previously, researchers attempted to utilize cytogenetic tools such as GISH [32] or the detection of the progeny of hybrid populations from intra- or inter-species cross [33,34,35], and the identification of Saccharum germplasm materials. However, GISH is still very expensive, laborious, and time-consuming. Instead, species-specific molecular markers are favored to be utilized. At the beginning, instance ribosomal restriction fragment length polymorphism (RFLP) markers were used to distinguish S. sinense and S. barberi accessions from other Saccharum species, but their detectable variations were limited within species [36]. Then, PCR-based markers, such as the random amplification of polymorphic DNA (RAPD) markers and simple sequence repeats (SSR) or microsatellite markers, were applied. RAPD markers were used to identify “Saccharum officinarum × Erianthus fulvus” true F1 hybrids [37], but they proved to be less reproducibility across laboratories. The SSR marker is considered to be one of the most efficient markers, and has been utilized greatly to identify true hybrids of sugarcane [38,39,40,41,42,43]. Nevertheless, SSRs have some disadvantages over SNPs/InDels-based markers, such as a low mutation rate.
The large and polyploid genome of sugarcane is a challenge for markers development, but the cp genome provides a useful target for developing DNA markers to verify species. For the development of DNA markers using sequence variations between species with similar genetic backgrounds, it would be efficient to use SNPs and InDels. dCAPS markers generated from SNPs have been proven to have important applications in the analyses of genetic polymorphism and phylogeny in closely related species [31,44]. To date, no SNPs or InDels markers for species discrimination have been developed in the sugarcane cp genome. In this study, we successfully developed 14 valuable and unique polymorphic markers to distinguish Saccharum and related species. Most of these markers were derived from the intergenic regions of cp genomes and showed high interspecific polymorphisms. At the level of genus species differentiation, eight InDels-based markers could discriminate T. arundinaceum from Saccharum species. At the level of species differentiation within the genus Saccharum, two InDel markers could discriminate S. officinarum from S. spontaneum, four SNP-based dCAPS markers could discriminate S. officinarum from S. robustum, and one dCAPS marker could differentiate S. barberi and S. sinense from other Saccharum species. Those markers were fragment-length-difference-based (InDels) or SNP-transformed dCAPs, which are easy and cheap to run for sample discrimination. In addition, these markers have a good repeatability, and it is easy to transfer them between sugarcane populations or laboratories. It is possible to utilize these markers for germplasm evaluation and species discrimination in Saccharum and relative species.

4. Materials and Methods

4.1. DNA Extraction, Library Construction, and Sequencing

Fresh leaves of 19 samples were collected from Guangxi University (Nanning, Guangxi, China) (108°19′ E, 22°51′ N, 530,023) (Table S1) and stored in liquid nitrogen. After the DNA extraction from fresh leaf tissues, its quantification was validated using Agarose gel electrophoresis and Nanodrop for construction of DNA library, and it was sequenced by Illumina NovaSeq 6000 sequencing platform (Illumina, San Diego, CA, USA). Approximately 10 Gb of 150 bp paired-end reads were generated for each accession.

4.2. Plastome Assemblies and Annotation

Fastp (v0.21.0) [45] was used for quality control, adapter trimming, quality filtering, and per-read quality pruning. The trimmed reads were subjected to GetOrganelle (v1.7.5) [46] to generate plastome assemblies as suggested for Embryophyta plant plastome sequences (-R 10; -F embplant_pt). The SPAdes [47] kmer settings were set to -k 21, 45, 65, 85, or 105. The contig coverage information and other graph characteristics were used by GetOrganelle to construct the final assembly graphs, which were plotted and visually assessed using Bandage (v0.8.1) [48]. The completed chloroplast assembly was re-aligned to S. officinarum cultivar badila (GenBank: MG685915.1) to confirm the quadripartite structures, including LSC, SSC, and two IRs.
Genome annotation and visualization were performed using web server CPGAVAS2 [49], CDS, and rRNA annotation based on BLAST search, while tRNAscan-SE v2.0.2 [50] was used to find and annotate tRNA genes. Then, the genomes were manually corrected using the Apollo [51]. Lastly, Chloroplot [52] was used to generate a corrected cp circular map.

4.3. Phylogenetic Analyses

For phylogenetics analysis for Saccharinae species, 14 published plastome sequences were downloaded. Sorghum bicolor (NC_008602.1) was used as outgroup. Fasta files with the nucleotide sequences for all 74 PCGs that they were shared from were extracted from the GenBank files using PhyloSuite (v1.2.2) [53]. All of the genes were aligned in batches with MAFFT (v7.313) [54] integrated into PhyloSuite using normal-alignment mode. The best partitioning scheme and evolutionary models for 74 pre-defined partitions were selected using PartitionFinder2 [55], with greedy algorithm and AICc criterion, which were divided into 27 subsets. PhyloSuite was then used to concatenate these alignments into a single alignment and generate phylip and nexus format files for the phylogenetic analysis. The selection of the best-fit partition strategy and models was carried out using PartitionFinder2. Maximum likelihood phylogenies were inferred using IQ-TREE [56] under Edge-unlinked partition model for 50,000 ultrafast [57] bootstraps, as well as the Shimodaira-Hasegawa-like approximate likelihood ratio test [58]. Images were drawn with iTOL [59] and Adobe Illustrator.

4.4. Plastome Polymorphism

To explore the sequence divergence and hotspot regions, DnaSP (v6.0) [60] was used for sliding window analysis for computing nucleotide diversity (pi) among the chloroplast genome sequences, with 500 bp windows size and 250 bp step size.
For variation analysis, clean reads were aligned to S. officinarum cultivar badila (GenBank: MG685915.1) cp genome v3.0 using BWA-mem [61] with default settings. For variant calling, we used the GATK HaplotypeCaller v.4.1.8.1 [62] software with the ‘-ploidy 1’ parameter to compare SNPs and small indels from BAM files. We filtered out low-quality variants (“QD < 2.0 || MQ < 40.0 || FS > 60.0 || SOR > 3.0 || MQRankSum < −12.5 || ReadPosRankSum < −8.0”) in GATK.
The microsatellites were determined by perl script MIcroSAtellite (MISA) [63] with search parameters: 1–10; 2–5; 3–5; 4–4; 5–3; 6–3, where 1, 2, 3, 4, 5, and 6 indicate the mono- di-, tri-, tetra-, penta-, and hexa-nucleotide repeats.

4.5. Comparative Genome Alignment

Aligned sequences and annotations for assembled chloroplast genomes were used to construct sequence conservation plots in the program mVISTA [64] and were compared using mVISTA software in Shuffle-LAGAN mode with the S. bicolor as a reference. IRscope [65] was used to detect IR border expansion and contraction.

4.6. Development and Validation of InDel and dCAPS Markers

To discriminate among the Sacchariane species, specific primers were designed using Primer 3 based on the mutational hotspot regions found in Saccharum and Saccharum-related chloroplast genomes. The specific primers for InDel regions and dCAPS primers for SNP sites were designed using the Primer 3 program (http://bioinfo.ut.ee/primer3-0.4.0/, accessed on 15 January 2022) and dCAPS Finder 2.0 (http://helix.wustl.edu/dcaps/dcaps.html, accessed on 15 January 2022), respectively.
Polymerase chain reaction (PCR) was carried out in a 20 μL reaction mixture containing 10 μL of 10× reaction buffer, 5 pmol of each primer, 1.25 units of Taq DNA polymerase, and 20 ng of DNA template. The PCR reaction was performed in thermocyclers using the following cycling parameters: 94 °C (5 min); 35 cycles of 94 °C (30 s), 56–62 °C (30 s); 72 °C (30 s), then 72 °C (7 min). The PCR products of each dCAPS marker were treated with a restriction enzyme at 37 °C (XbaI) or 65 °C (TaqI) for 1 h. PCR products were visualized on agarose gels (2.0–3.0%) containing safe gel stain.

5. Conclusions

In this study, we sequenced 19 accessions of Saccharinae species, and a total of 23 chloroplast genomes were assembled, including 6 species of Saccharum (among them, S. robustum, S. sinense, and S. barberi firstly reported in this study) and 2 sugarcane relative species, Tripidium arundinaceum and Narenga porphyrocoma. Our results enriched, updated, and improved the database genomics of Saccharinae, further confirming the phylogeny of Saccharinae based on available cp genomes. These results can be used to elucidate evolutionary history, such as the origin of Saccharinea, allowing for a deeper understanding of their parental lineages.
In addition, we developed 14 robust molecular markers, including 9 InDels markers for the discrimination of S. spontaneum, S. officinarum, T. arundinaceum, 5 dCAPS markers for S. officinarum and S. robustum, and 1 dCAPS marker for differentiated S. sinense and S. barberi from other Saccharum species. These markers were demonstrated to have a high discriminatory power in the Saccharum genus. Taken together, the results obtained from our study will contribute to the understanding of Saccharinae classification and plastome evolution at inter- and intra-species levels of Saccharum. Molecular markers developed in this study were inexpensive and efficient, and, thus, were possible to utilize for germplasm evaluation and species discrimination in Saccharum and relative species.

Supplementary Materials

The following supporting information can be downloaded at: https://www.mdpi.com/article/10.3390/ijms23147661/s1.

Author Contributions

Conceptualization, S.L. and X.Y.; validation, M.F., N.W. and B.K.; data curation, S.L., M.F. and J.Z.; writing—original draft preparation, S.L., J.Z. and X.Y.; writing—review and editing, X.Y.; funding acquisition, X.Y., B.C., Y.J. and W.D. All authors have read and agreed to the published version of the manuscript.

Funding

This research was funded by the ‘One Hundred Person’ Project of Guangxi Province, Science, Guangxi Natural Science Foundation (GK AD20297064), Technology Major Project of Guangxi Province (GK2018-266-Z01), National Natural Science Foundation of China (31901510) and National Key Research and Development Program (2021YFD1200204-05).

Institutional Review Board Statement

Not applicable.

Informed Consent Statement

Not applicable.

Data Availability Statement

All WGS data used in this work were deposited at National Center for Biotechnology Information (NCBI), BioProject: PRJNA845970; and assembled chloroplast genomes Genbank accession: ON688638-ON688660.

Conflicts of Interest

The authors declare no conflict of interest.

References

  1. James, G.; Tate, B. Sugarcane; Wiley Online Library: Hoboken, NJ, USA, 2004. [Google Scholar]
  2. Yu, F.; Chai, J.; Li, X.; Yu, Z.; Yang, R.; Ding, X.; Wang, Q.; Wu, J.; Yang, X.; Deng, Z. Chromosomal Characterization of Tripidium arundinaceum Revealed by Oligo-FISH. Int. J. Mol. Sci. 2021, 22, 8539. [Google Scholar] [CrossRef] [PubMed]
  3. Chang, H.; Wang, Q.; Qiu, Y.; Qin, Y.; Li, X.; Wu, Q.; He, W.; Guo, Y.; Zhang, W.; Chen, J.; et al. Production, Identification and Characterization of Erianthus rockii × Narenga porphyrocoma Intergeneric Hybrids as a New Germplasm for Sugarcane Breeding and Genetic Research. Sugar Tech 2020, 22, 389–395. [Google Scholar] [CrossRef]
  4. Liu, X.; Zhang, R.; Ou, H.; Gui, Y.; Wei, J.; Zhou, H.; Tan, H.; Li, Y. Comprehensive transcriptome analysis reveals genes in response to water deficit in the leaves of Saccharum narenga (Nees ex Steud.) hack. BMC Plant Biol. 2018, 18, 250. [Google Scholar] [CrossRef] [PubMed]
  5. Qi, Y.; Gao, X.; Zeng, Q.; Zheng, Z.; Wu, C.; Yang, R.; Feng, X.; Wu, Z.; Fan, L.; Huang, Z. Sugarcane Breeding, Germplasm Development and Related Molecular Research in China. Sugar Tech 2022, 24, 73–85. [Google Scholar] [CrossRef]
  6. Zhu, J.; Zhou, H.; Pan, Y.; Lu, X. Genetic variability among the chloroplast genomes of sugarcane (Saccharum spp.) and its wild progenitor species Saccharum spontaneum L. Genet. Mol. Res. 2014, 13, 3037–3047. [Google Scholar] [CrossRef] [PubMed]
  7. C.P.W.G.; Hollingsworth, P.M.; Forrest, L.L.; Spouge, J.L.; Hajibabaei, M.; Ratnasingham, S.; van der Bank, M.; Chase, M.W.; Cowan, R.S.; Erickson, D.L. A DNA barcode for land plants. Proc. Natl. Acad. Sci. USA 2009, 106, 12794-12797. [Google Scholar]
  8. Dong, W.; Xu, C.; Li, W.; Xie, X.; Lu, Y.; Liu, Y.; Jin, X.; Suo, Z. Phylogenetic resolution in Juglans based on complete chloroplast genomes and nuclear DNA sequences. Front. Plant Sci. 2017, 8, 1148. [Google Scholar] [CrossRef] [Green Version]
  9. Wu, L.; Nie, L.; Xu, Z.; Li, P.; Wang, Y.; He, C.; Song, J.; Yao, H. Comparative and phylogenetic analysis of the complete chloroplast genomes of three Paeonia Section Moutan Species (Paeoniaceae). Front. Genet. 2020, 11, 980. [Google Scholar] [CrossRef]
  10. Celiński, K.; Kijak, H.; Wojnicka-Półtorak, A.; Buczkowska-Chmielewska, K.; Sokołowska, J.; Chudzińska, E. Effectiveness of the DNA barcoding approach for closely related conifers discrimination: A case study of the Pinus mugo complex. C. R. Biol. 2017, 340, 339–348. [Google Scholar] [CrossRef]
  11. Loeuille, B.; Thode, V.; Siniscalchi, C.; Andrade, S.; Rossi, M.; Pirani, J.R. Extremely low nucleotide diversity among thirty-six new chloroplast genome sequences from Aldama (Heliantheae, Asteraceae) and comparative chloroplast genomics analyses with closely related genera. PeerJ 2021, 9, e10886. [Google Scholar] [CrossRef]
  12. Sokołowska, J.; Fuchs, H.; Celiński, K. New insight into taxonomy of European mountain pines, Pinus mugo complex, based on complete chloroplast genomes sequencing. Plants 2021, 10, 1331. [Google Scholar] [CrossRef] [PubMed]
  13. Kim, T.-H.; Yoon, Y.-M.; Park, J.-C.; Park, J.-H.; Kim, K.-H.; Kim, Y.-K.; Son, J.-H.; Park, T.-I. De Novo Transcriptome Assembly and SNP Discovery for the Development of dCAPS Markers in Oat. Agronomy 2022, 12, 184. [Google Scholar] [CrossRef]
  14. Nishijima, R.; Yoshida, K.; Sakaguchi, K.; Yoshimura, S.I.; Sato, K.; Takumi, S. RNA Sequencing-Based Bulked Segregant Analysis Facilitates Efficient D-genome Marker Development for a Specific Chromosomal Region of Synthetic Hexaploid Wheat. Int. J. Mol. Sci. 2018, 19, 3749. [Google Scholar] [CrossRef] [PubMed] [Green Version]
  15. Zhao, B.; Wang, B.; Li, Z.; Guo, T.; Zhao, J.; Guan, Z.; Liu, K. Identification and characterization of a new dwarf locus DS-4 encoding an Aux/IAA7 protein in Brassica napus. Theor. Appl. Genet. 2019, 132, 1435–1449. [Google Scholar] [CrossRef] [PubMed]
  16. Asano, T.; Tsudzuki, T.; Takahashi, S.; Shimada, H.; Kadowaki, K.-i. Complete Nucleotide Sequence of the Sugarcane (Saccharum officinarum) Chloroplast Genome: A Comparative Analysis of Four Monocot Chloroplast Genomes. DNA Res. Int. J. Rapid Publ. Rep. Genes Genomes 2004, 11, 93–99. [Google Scholar] [CrossRef] [PubMed] [Green Version]
  17. Calsa Júnior, T.; Carraro, D.M.; Benatti, M.R.; Barbosa, A.C.; Kitajima, J.P.; Carrer, H. Structural features and transcript-editing analysis of sugarcane (Saccharum officinarum L.) chloroplast genome. Curr. Genet. 2004, 46, 366–373. [Google Scholar] [CrossRef]
  18. Vidigal, P.M.; Coelho, A.S.; Novaes, E.; Barbosa, M.H.; Peternelli, L.A. Complete Chloroplast Genome Sequence and Annotation of the Saccharum Hybrid Cultivar RB867515. Genome Announc. 2016, 4, e01157-16. [Google Scholar] [CrossRef] [Green Version]
  19. Evans, D.L.; Joshi, S.V. Complete chloroplast genomes of Saccharum spontaneum, Saccharum officinarum and Miscanthus floridulus (Panicoideae: Andropogoneae) reveal the plastid view on sugarcane origins. Syst. Biodivers. 2016, 14, 548–571. [Google Scholar] [CrossRef]
  20. Xu, F.; He, L.; Gao, S.; Su, Y.; Li, F.; Xu, L. Comparative Analysis of two Sugarcane Ancestors Saccharum officinarum and S. spontaneum based on Complete Chloroplast Genome Sequences and Photosynthetic Ability in Cold Stress. Int. J. Mol. Sci. 2019, 20, 3828. [Google Scholar] [CrossRef] [Green Version]
  21. Lloyd Evans, D.; Joshi, S.V.; Wang, J. Whole chloroplast genome and gene locus phylogenies reveal the taxonomic placement and relationship of Tripidium (Panicoideae: Andropogoneae) to sugarcane. BMC Evol. Biol. 2019, 19, 33. [Google Scholar] [CrossRef] [Green Version]
  22. Tsuruta, S.I.; Ebina, M.; Kobayashi, M.; Takahashi, W. Complete Chloroplast Genomes of Erianthus arundinaceus and Miscanthus sinensis: Comparative Genomics and Evolution of the Saccharum Complex. PLoS ONE 2017, 12, e0169992. [Google Scholar] [CrossRef] [PubMed]
  23. Evans, D.L.; Hughes, B. Complete Chloroplast Genomes of Saccharum giganteum, Saccharum longisetosum, Cleistachne sorghoides, Sarga timorense, Narenga porphyrocoma and Tripsacum dactyloides. Comparisons with ITS phylogeny and Placement within Saccharum. bioRxiv 2020. [Google Scholar] [CrossRef]
  24. Lloyd Evans, D.; Hlongwane, T.T.; Joshi, S.V.; Riano Pachon, D.M. The sugarcane mitochondrial genome: Assembly, phylogenetics and transcriptomics. PeerJ 2019, 7, e7558. [Google Scholar] [CrossRef] [PubMed] [Green Version]
  25. Welker, C.A.D.; McKain, M.R.; Vorontsova, M.S.; Peichoto, M.C.; Kellogg, E.A. Plastome phylogenomics of sugarcane and relatives confirms the segregation of the genus Tripidium (Poaceae: Andropogoneae). Taxon 2019, 68, 246–267. [Google Scholar] [CrossRef]
  26. Lloyd Evans, D.; Hughes, B.; Joshi, V. Comparative whole plastome and low copy number phylogenetics of the core Saccharinae and Sorghinae. bioRxiv 2022. [Google Scholar] [CrossRef]
  27. Huang, H.; Shi, C.; Liu, Y.; Mao, S.-Y.; Gao, L.-Z. Thirteen Camellia chloroplast genome sequences determined by high-throughput sequencing: Genome structure and phylogenetic relationships. BMC Evol. Biol. 2014, 14, 151. [Google Scholar] [CrossRef] [PubMed] [Green Version]
  28. Pompidor, N.; Charron, C.; Hervouet, C.; Bocs, S.; Droc, G.; Rivallan, R.; Manez, A.; Mitros, T.; Swaminathan, K.; Glaszmann, J.-C.; et al. Three founding ancestral genomes involved in the origin of sugarcane. Ann. Bot. 2021, 127, 827–840. [Google Scholar] [CrossRef] [PubMed]
  29. Welker, C.A.; Souza-Chies, T.T.; Longhi-Wagner, H.M.; Peichoto, M.C.; McKain, M.R.; Kellogg, E.A. Phylogenetic analysis of Saccharum sl (Poaceae; Andropogoneae), with emphasis on the circumscription of the South American species. Am. J. Bot. 2015, 102, 248–263. [Google Scholar] [CrossRef] [PubMed] [Green Version]
  30. Elkonin, L.; Kibalnik, O.; Zavalishina, A.; Gerashchenkov, G.; Rozhnova, N. Genetic function of cytoplasm in plants with special emphasis on sorghum. In Chloroplasts and Cytoplasm. Structure and Function; Nova Science Publishers: New York, NY, USA, 2018; pp. 97–155. [Google Scholar]
  31. Zhang, Y.; Fang, Z.; Wang, Q.; Liu, Y.; Yang, L.; Zhuang, M.; Sun, P. Chloroplast subspecies-specific SNP detection and its maternal inheritance in Brassica oleracea L. by using a dCAPS marker. J. Hered. 2012, 103, 606–611. [Google Scholar] [CrossRef] [Green Version]
  32. Li, X.; Guo, Y.; Huang, F.; Wang, Q.; Chai, J.; Yu, F.; Wu, J.; Zhang, M.; Deng, Z. Authenticity Identification of Saccharum officinarum and Saccharum spontaneum Germplasm Materials. Agronomy 2022, 12, 819. [Google Scholar] [CrossRef]
  33. D’Hont, A.; Rao, P.S.; Feldmann, P.; Grivet, L.; Islam-Faridi, N.; Taylor, P.; Glaszmann, J.C. Identification and characterisation of sugarcane intergeneric hybrids, Saccharum officinarum × Erianthus arundinaceus, with molecular markers and DNA in situ hybridisation. Theor. Appl. Genet. 1995, 91, 320–326. [Google Scholar] [CrossRef] [PubMed]
  34. Pachakkil, B.; Terajima, Y.; Ohmido, N.; Ebina, M.; Irei, S.; Hayashi, H.; Takagi, H. Cytogenetic and agronomic characterization of intergeneric hybrids between Saccharum spp. hybrid and Erianthus arundinaceus. Sci. Rep. 2019, 9, 1748. [Google Scholar] [CrossRef] [PubMed] [Green Version]
  35. Huang, Y.; Wu, J.; Wang, P.; Lin, Y.; Fu, C.; Deng, Z.; Wang, Q.; Li, Q.; Chen, R.; Zhang, M. Characterization of Chromosome Inheritance of the Intergeneric BC2 and BC3 Progeny between Saccharum spp. and Erianthus arundinaceus. PLoS ONE 2015, 10, e0133722. [Google Scholar] [CrossRef] [Green Version]
  36. Wood, B. Restriction fragment length polymorphism distinguishes members of Saccharum sinense and S. barberi. Plant Physiol. 1987, 83, 15. [Google Scholar]
  37. Zhang, H.; Li, F.; He, L.; Zhong, H.; Yang, Q.; He, S. Identification of sugarcane interspecies hybrids with RAPDs. Afr. J. Biotechnol. 2008, 7, 1072–1074. [Google Scholar]
  38. Manigbas, N.L.; Villegas, L.C. Microsatellite markers in hybridity tests to identify true hybrids of sugarcane. Philipp. J. Crop Sci. 2004, 29, 23–32. [Google Scholar]
  39. Todd, J.; Pan, Y.-B.; Boykin, D. Fidelity of Sugarcane Crosses Assessed with SSR Markers. Agronomy 2020, 10, 386. [Google Scholar] [CrossRef] [Green Version]
  40. Ahmad, A.; Wang, J.-D.; Pan, Y.-B.; Sharif, R.; Gao, S.-J. Development and Use of Simple Sequence Repeats (SSRs) Markers for Sugarcane Breeding and Genetic Studies. Agronomy 2018, 8, 260. [Google Scholar] [CrossRef] [Green Version]
  41. Santos, J.; Barbosa, G.; Neto, C.; Almeida, C. Efficiency of biparental crossing in sugarcane analyzed by SSR markers. Crop Breed. Appl. Biotechnol. 2014, 14, 102–107. [Google Scholar] [CrossRef] [Green Version]
  42. Xavier, M.A.; Pinto, L.R.; Fávero, T.M.; Perecin, D.; Carlini-Garcia, L.A.; Landell, M.G. Paternity identification in sugarcane polycrosses by using microsatellite markers. Genet. Mol. Res. 2014, 13, 2268–2277. [Google Scholar] [CrossRef]
  43. Liu, X.-H.; Fang, F.-X.; Zhang, R.-H.; Song, H.-Z.; Yang, R.-Z.; Gao, Y.-J.; Ou, H.-P.; Lei, J.-C.; Luo, T.; Duan, W.-X.; et al. Identification of Progenies from Sugarcane × Narenga porphyrocoma (Hance) Bor. by SSR Marker. Southwest China J. Agric. Sci. 2012, 25, 38–43. [Google Scholar]
  44. Shavrukov, Y.N. CAPS markers in plant biology. Russ. J. Genet. Appl. Res. 2016, 6, 279–287. [Google Scholar] [CrossRef]
  45. Chen, S.; Zhou, Y.; Chen, Y.; Gu, J. fastp: An ultra-fast all-in-one FASTQ preprocessor. Bioinformatics 2018, 34, i884–i890. [Google Scholar] [CrossRef]
  46. Jin, J.J.; Yu, W.B.; Yang, J.B.; Song, Y.; dePamphilis, C.W.; Yi, T.S.; Li, D.Z. GetOrganelle: A fast and versatile toolkit for accurate de novo assembly of organelle genomes. Genome Biol. 2020, 21, 241. [Google Scholar] [CrossRef] [PubMed]
  47. Bankevich, A.; Nurk, S.; Antipov, D.; Gurevich, A.A.; Dvorkin, M.; Kulikov, A.S.; Lesin, V.M.; Nikolenko, S.I.; Pham, S.; Prjibelski, A.D.; et al. SPAdes: A new genome assembly algorithm and its applications to single-cell sequencing. J. Comput. Biol. 2012, 19, 455–477. [Google Scholar] [CrossRef] [Green Version]
  48. Wick, R.R.; Schultz, M.B.; Zobel, J.; Holt, K.E. Bandage: Interactive visualization of de novo genome assemblies. Bioinformatics 2015, 31, 3350–3352. [Google Scholar] [CrossRef] [PubMed] [Green Version]
  49. Shi, L.; Chen, H.; Jiang, M.; Wang, L.; Wu, X.; Huang, L.; Liu, C. CPGAVAS2, an integrated plastome sequence annotator and analyzer. Nucleic Acids Res. 2019, 47, W65–W73. [Google Scholar] [CrossRef]
  50. Chan, P.P.; Lin, B.Y.; Mak, A.J.; Lowe, T.M. tRNAscan-SE 2.0: Improved detection and functional classification of transfer RNA genes. Nucleic Acids Res. 2021, 49, 9077–9096. [Google Scholar] [CrossRef]
  51. Lewis, S.E.; Searle, S.M.J.; Harris, N.; Gibson, M.; Lyer, V.; Richter, J.; Wiel, C.; Bayraktaroglu, L.; Birney, E.; Crosby, M.A.; et al. Apollo: A sequence annotation editor. Genome Biol. 2022, 3, research0082.1. [Google Scholar] [CrossRef]
  52. Zheng, S.; Poczai, P.; Hyvönen, J.; Tang, J.; Amiryousefi, A. Chloroplot: An Online Program for the Versatile Plotting of Organelle Genomes. Front. Genet. 2020, 11, 576124. [Google Scholar] [CrossRef]
  53. Zhang, D.; Gao, F.; Jakovlić, I.; Zou, H.; Zhang, J.; Li, W.; Wang, G. PhyloSuite: An integrated and scalable desktop platform for streamlined molecular sequence data management and evolutionary phylogenetics studies. Mol. Ecol. Resour. 2020, 20, 348–355. [Google Scholar] [CrossRef] [PubMed]
  54. Katoh, K.; Standley, D.M. MAFFT multiple sequence alignment software version 7: Improvements in performance and usability. Mol. Biol. Evol. 2013, 30, 772–780. [Google Scholar] [CrossRef] [PubMed] [Green Version]
  55. Lanfear, R.; Frandsen, P.B.; Wright, A.M.; Senfeld, T.; Calcott, B. PartitionFinder 2: New Methods for Selecting Partitioned Models of Evolution for Molecular and Morphological Phylogenetic Analyses. Mol. Biol. Evol. 2017, 34, 772–773. [Google Scholar] [CrossRef] [Green Version]
  56. Nguyen, L.T.; Schmidt, H.A.; von Haeseler, A.; Minh, B.Q. IQ-TREE: A fast and effective stochastic algorithm for estimating maximum-likelihood phylogenies. Mol. Biol. Evol. 2015, 32, 268–274. [Google Scholar] [CrossRef]
  57. Minh, B.Q.; Nguyen, M.A.T.; von Haeseler, A. Ultrafast approximation for phylogenetic bootstrap. Mol. Biol. Evol. 2013, 30, 1188–1195. [Google Scholar] [CrossRef] [PubMed]
  58. Guindon, S.; Dufayard, J.F.; Lefort, V.; Anisimova, M.; Hordijk, W.; Gascuel, O. New algorithms and methods to estimate maximum-likelihood phylogenies: Assessing the performance of PhyML 3.0. Syst. Biol. 2010, 59, 307–321. [Google Scholar] [CrossRef] [Green Version]
  59. Letunic, I.; Bork, P. Interactive Tree of Life (iTOL) v5: An online tool for phylogenetic tree display and annotation. Nucleic Acids Res. 2021, 49, W293–W296. [Google Scholar] [CrossRef]
  60. Rozas, J.; Ferrer-Mata, A.; Sánchez-DelBarrio, J.C.; Guirao-Rico, S.; Librado, P.; Ramos-Onsins, S.E.; Sánchez-Gracia, A. DnaSP 6: DNA Sequence Polymorphism Analysis of Large Data Sets. Mol. Biol. Evol. 2017, 34, 3299–3302. [Google Scholar] [CrossRef]
  61. Li, H. Aligning sequence reads, clone sequences and assembly contigs with BWA-MEM. arXiv 2013, arXiv:1303.3997. [Google Scholar]
  62. Van der Auwera, G.A.; Carneiro, M.O.; Hartl, C.; Poplin, R.; Del Angel, G.; Levy-Moonshine, A.; Jordan, T.; Shakir, K.; Roazen, D.; Thibault, J.; et al. From FastQ data to high confidence variant calls: The Genome Analysis Toolkit best practices pipeline. Curr. Protoc. Bioinform. 2013, 43, 11.10.11–11.10.33. [Google Scholar] [CrossRef]
  63. Beier, S.; Thiel, T.; Münch, T.; Scholz, U.; Mascher, M. MISA-web: A web server for microsatellite prediction. Bioinformatics 2017, 33, 2583–2585. [Google Scholar] [CrossRef] [PubMed] [Green Version]
  64. Frazer, K.A.; Pachter, L.; Poliakov, A.; Rubin, E.M.; Dubchak, I. VISTA: Computational tools for comparative genomics. Nucleic Acids Res. 2004, 32, W273–W279. [Google Scholar] [CrossRef] [PubMed]
  65. Amiryousefi, A.; Hyvönen, J.; Poczai, P. IRscope: An online program to visualize the junction sites of chloroplast genomes. Bioinformatics 2018, 34, 3030–3031. [Google Scholar] [CrossRef] [PubMed]
Figure 1. Structure of the assembled and annotated chloroplast genomes. The color of genes indicate their function. The genes presented outside the circle are transcribed counterclockwise, whereas the genes presented inside the circle are transcribed clockwise. The gene content and organization are similar for all Saccharum species, and, therefore, one figure (c) is drawn as representative of all three species. (a) N. porphyrocoma; (b) T. arundinaceum; (c) Saccharum species.
Ijms 23 07661 g001
Figure 2. Phylogram based on 74 protein-coding genes shared among Saccharinae species (23 newly assembled in this study, which are marked with *, and 14 published accessions of Saccharinae species in NCBI). Sorghum bicolor is included as outgroup.
Ijms 23 07661 g002
Figure 3. Comparison of border positions of LSC, SSC, and IR regions among nine Saccharinae species and S. bicolor. Genes are denoted by boxes, and the gap between the genes and the boundaries are indicated by the number of bases unless the gene coincides with the boundary. Extensions of genes are also indicated above the boxes.
Ijms 23 07661 g003
Figure 4. Chloroplast genomes were aligned using the mVISTA program with the annotation of S. bicolor as a reference. The X- and Y-scales indicate the coordinates within chloroplast genomes and the percentage of identity (50~100%), respectively. Gray arrows indicate the direction of transcription of each gene. Annotated genes are displayed along the top. The red block is the intron region, the pearlecent Aqua block is the tRNA region, and the purple block is the CDS region.
Ijms 23 07661 g004
Figure 5. Nucleotide diversity (Pi) based on sliding window analysis in the aligned complete chloroplast genomes of S. spontaneum, S. officinarum, S. robustum, S. sinense, S. barberi, and S. hybrids.
Ijms 23 07661 g005
Figure 6. The gel electrophoresis results of the validation of nine molecular markers derived from InDels regions of three chloroplast genomes of T. arundinaceum, S. spontaneum, and S. officinarum. (a) The dashed line indicates deleted sequences. Left and right black arrows indicate forward and reverse primers, respectively. (b) The gel electrophoresis results from the amplification of InDels markers using designed primers. Abbreviated species names are shown on schematic diagrams, Ta, T. arundinaceum; Ss, S. spontaneum; So, S. officinarum.
Ijms 23 07661 g006
Figure 7. dCAPS makers design based on SNPs between S. robustrum and S. officinarum. (a) The multiple alignments of the chloroplast genomes by MAFFT, (b) SNP analysis with dCAPS primers, Sscpd1 and Sscpd2, designed for the SNP site in trnG-trnM region, with TaqI and XbaI restriction sites, respectively. Sscpd3 and Sscpd4 were designed for SNPs in petA-psbJ and rbcL-psaI intergenic region, with TaqI restriction sites. Abbreviated species names are shown on schematic diagrams, Ss, S. spontaneum, Sr, S. robustum, So, S. officinarum.
Ijms 23 07661 g007
Figure 8. The gel electrophoresis results of the amplification of DNA barcodes using designed primers. (a) The multiple alignments of the chloroplast genomes by MAFFT, (b) SNP analysis with dCAPS primers, and Sscpd5 designed for the SNP site in rbcL-psaI region with TaqI restriction sites. Abbreviated species names are shown on schematic diagrams, Sb, S. barberi; Ssi, S. sinense; Sh, S. hybrid; So, S. officinarum; Sr, S. robustum; Ss, S. spontaneum.
Ijms 23 07661 g008
Table 1. The structure and length of the chloroplast genome sequences in N. porphyrocoma, T. arundinaceum, and Saccharum spp. assembled in this study.
SpeciesNon-SaccharumS. spontaneumS. robustumS. sinense
AccessionBM87-36HBW1SES14SP79-9IN84-066IND81-013NG51-63NG57-208IS76-184IN84-076GuilinzhuzheYouba
Length/bp141,209141,231141,162141,216141,191141,161141,171141,171141,187141,187141,174141,174
LSC/bp83,16783,10783,03983,09383,06883,03883,03683,03683,05683,05683,04383,043
SSC/bp12,51312,53312,54212,54212,54212,54212,54212,54212,53812,53812,53812,538
IR/bp22,76322,79422,78922,78922,78922,78922,79522,79522,79522,79522,79522,795
SpeciesS. barberiS. officinarumS. hybrid
AccessionKathaKewaliChunneLoetherChristalinBlackChLBHNG96-14POJ2878ROC25GT42ZhongzheNo1
Length/bp141,174141,174141,174141,183141,182141,182141,183141,182141,182141,182141,182
LSC/bp83,04383,04383,04383,04883,04783,04783,04883,04783,04783,04783,047
SSC/bp12,53812,53812,53812,54212,54212,54212,54212,54212,54212,54212,542
IR/bp22,79522,79522,79522,79522,79522,79522,79522,79522,79522,79522,795
Table 2. Information of nine InDel markers designed for T. arundinaceum, S. spontaneum, and S. officinarum.
PrimerForward
Reverse
RegionPCR Product Size (bp)
T. aruS. sponS. off
SscpId1GGATCGACTCTTTCCCAACA
CCCAAAAACGACCAATCTTT
rps16-trnQ130159159
SscpId2TGACAGAGGCAAGAAATAACGA
GCCCGCTGAAGAGAAAATC
trnS-psbD235204204
SscpId3AAGACCGGAGCTATCAACCA
TGAAAGTGGACTTGCATCTGA
trnS-psbZ157123123
SscpId4CCATTAGACAATGGACGCTTCT
TGCTCCATATTCCTTCTTTATGA
trnR-rps14188172198
SscpId5AACCTAATGAAAATCGGATGATTA
GCGAATTCCTATTTTGTTTGAA
ndhC-trnV249228228
SscpId6AGGGACTCATGTTCCGTCTG
GCATGAAGGGGTTAAATTCC
petL-petG191145145
SscpId7TCGTGTGTTCGATTTTTCCA
TTTTGATCCAGAACCAGAAGAA
rpl33-rps18235235250
SscpId8TTTGGCAAAGAAAAATAGAGTACG
ATTCCTCAAAACGAGGCTCA
rps12 intron155173173
SscpId9TTTGGCATTAGTTCATGAGGA
AAGGAAATGGCTATCAAGAACG
rps12 intron143176176
T. aru: T. arundinaceum; S. spon: S. spontaneum; S. off: S. officinarum.
Table 3. dCAPS makers design based on SNPs between S. robustrum and S. officinarum.
PrimerForward
Reverse
RegionDigestion EnzymePCR Product Size (bp)/
Target SNP
S. robS. off
Sscpd1CGTACTCCTAATCGAATTTGTATTTT
CAGTGGTAAAAGTGTGATTCGTTC
trnG-trnMTaqI226/A199/G
Sscpd2CGTACTCCTAATCGAATTTGTATTCTA
TGGTAAAAGTGTGATTCGTTCTATT
trnG-trnMXbaI224/A197/G
Sscpd3AACAAAAGAATAAATCCAGGGATTCCA
CGGGTCCTTACTCCCCTTTA
rbcL-psaITaqI158/C174/G
Sscpd4TCTTCTTTATTCTTCGAATTGATTGC
TGCGTATTTGATTCCATTATCGT
petA-psbJTaqI216/A201/G
S. rob: S. robustrum; S. off: S. officinarum.
Table 4. dCAPS maker design based on SNPs between S. sinense/S. barberi and other Saccharum species.
PrimerForward
Reverse
RegionDigestion EnzymePCR Product Size (bp)/
Target SNP
S. sin/
S. bar
Other
S. spp.
Sscpd5TCTTCTTTATTCTTCGAATTGATTGC
TGCGTATTTGATTCCATTATCGTTCAT
rbcL-psaITaqI201/A216/G
S. sin: S. sinense; S. bar: S. barberi; S. spp.: Saccharum spp. (included Sh, S. hybrid; So, S. officinarum; SR, S. robustum; Ss, S. spontaneum.).
Publisher’s Note: MDPI stays neutral with regard to jurisdictional claims in published maps and institutional affiliations.

