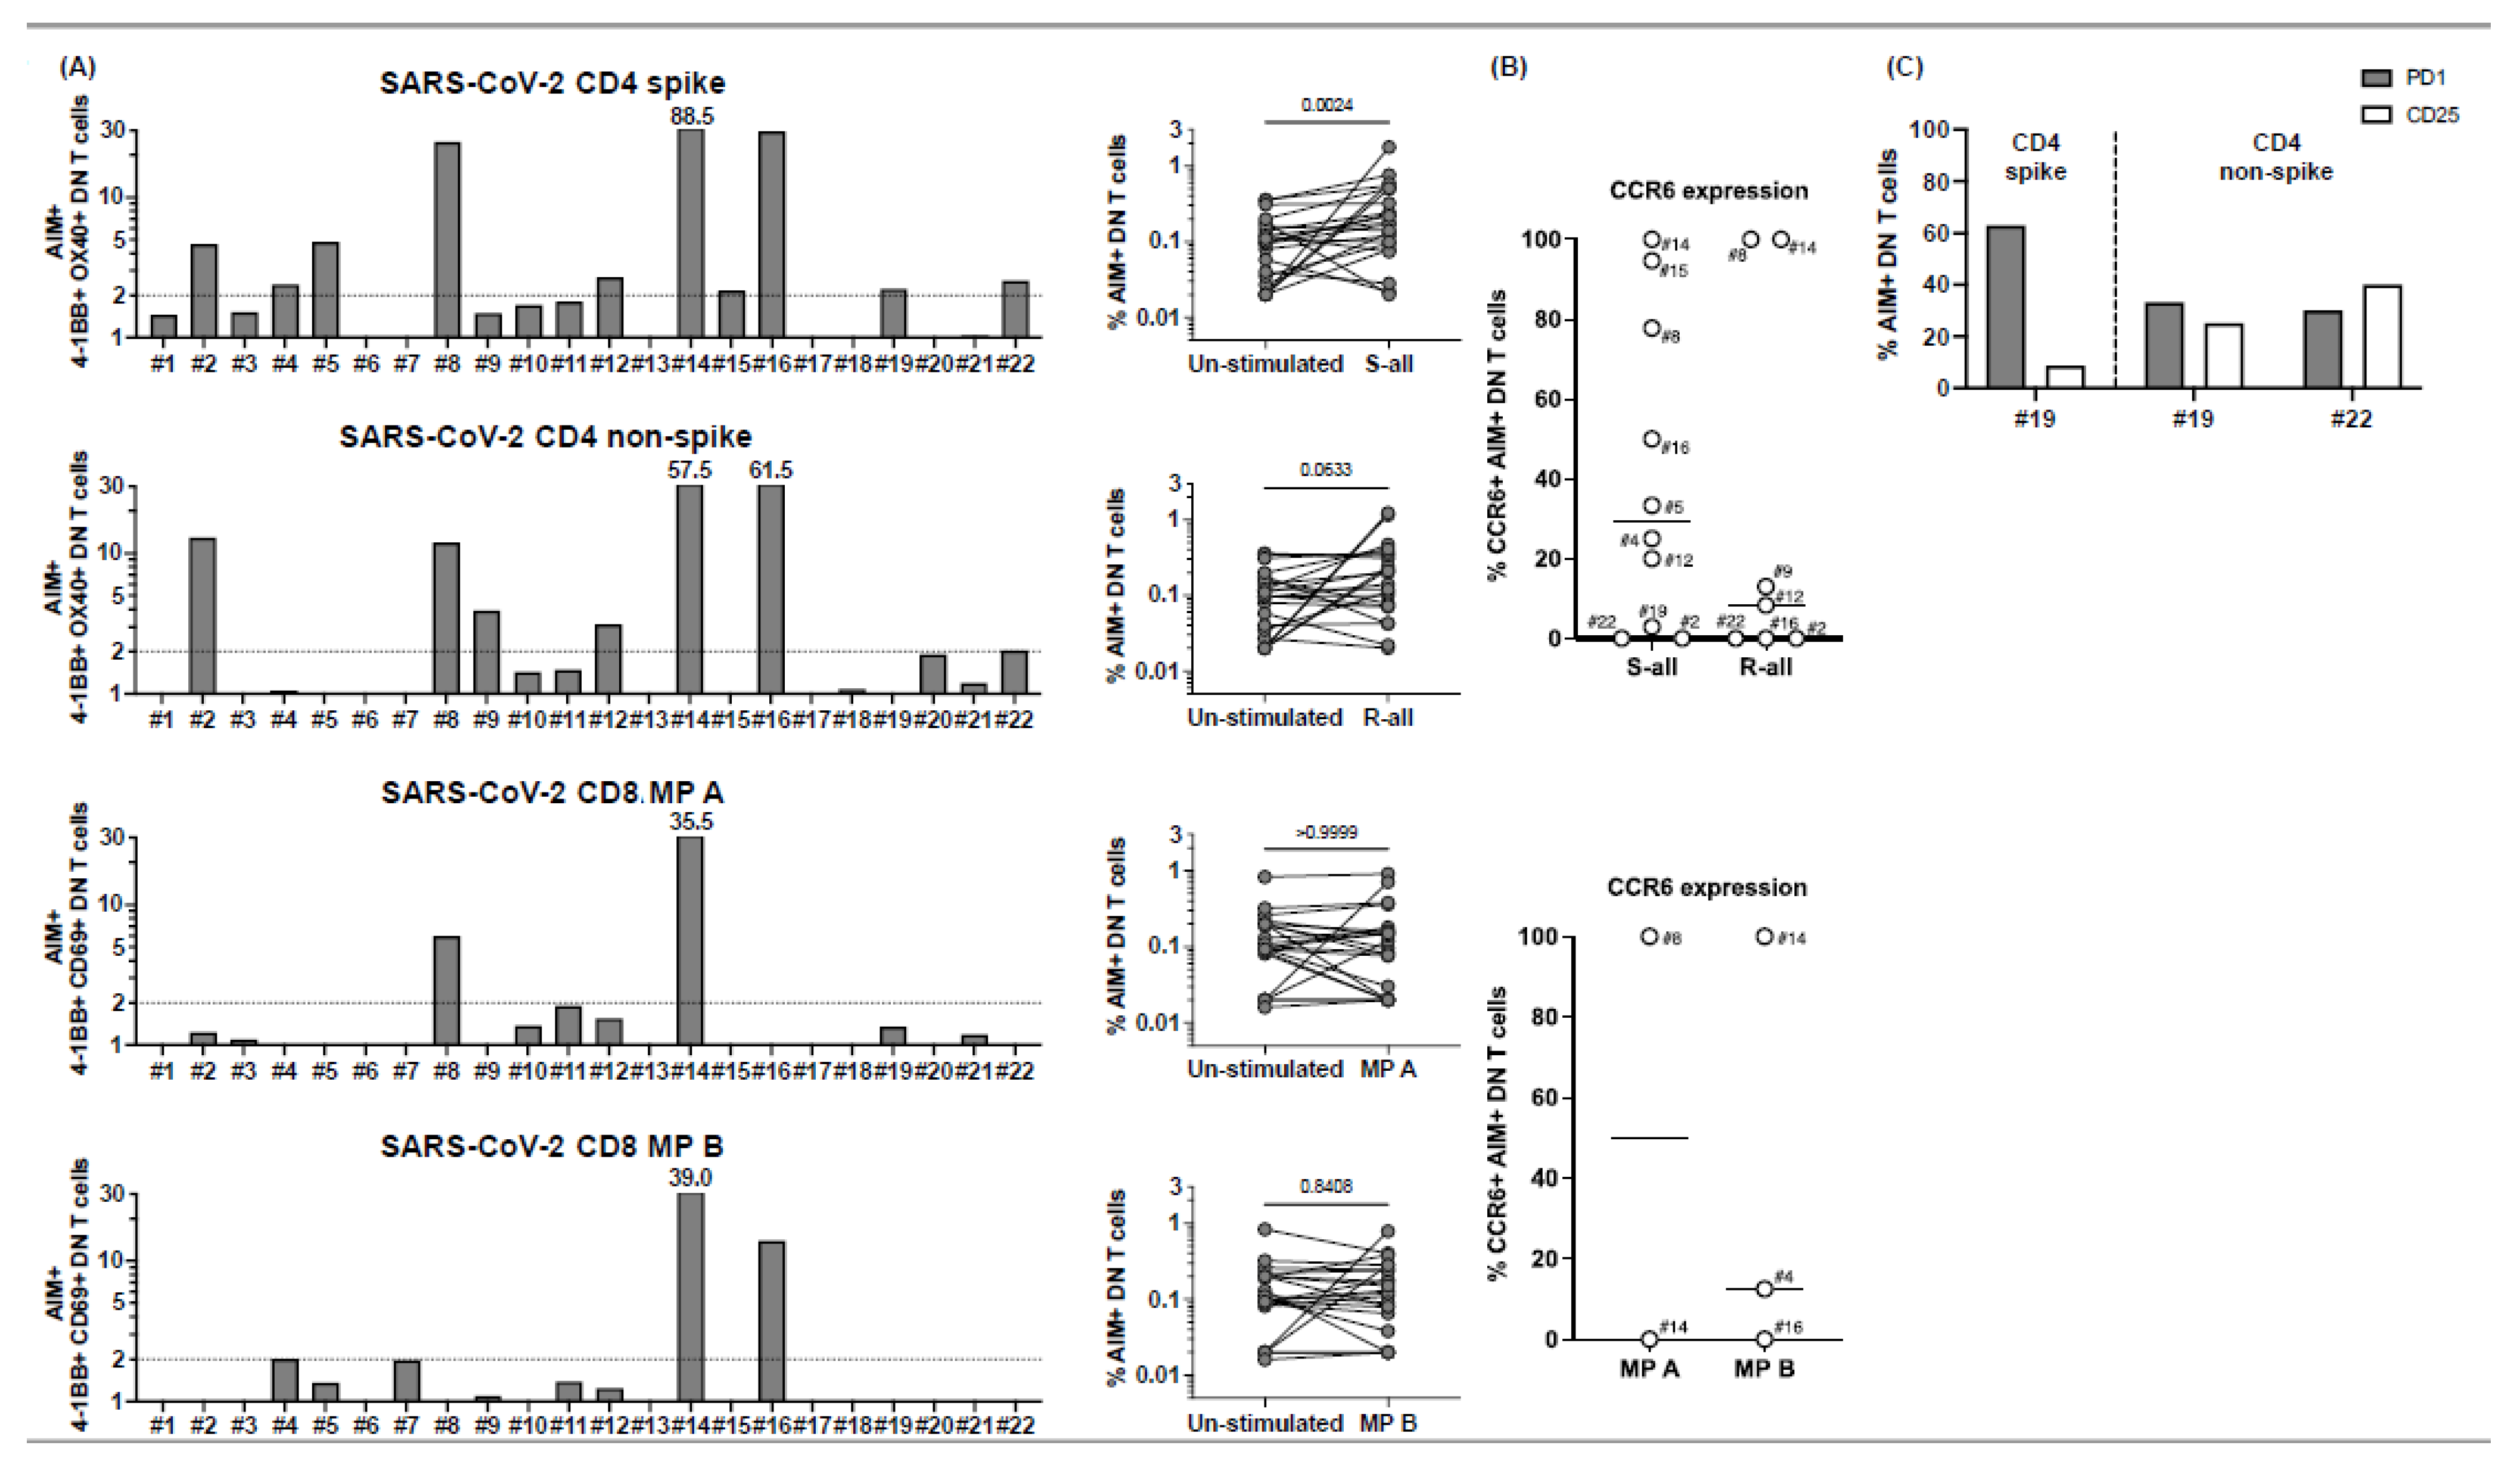
Figure 1.
CD4+ and CD8+ T cell responses to peptide megapools derived from SARS-CoV-2 and their CCR6 expression in subacute MIS-C subjects. PBMCs from 22 subacute MIS-C subjects were separated from heparinized whole blood samples using Ficoll density gradient and stimulated with peptide megapools derived from SARS-CoV-2: CD4 spike (253 epitopes), CD4 nonspike (221 epitopes), CD8 MP A (314 epitopes), or CD8 MP B (314 epitopes). Cell preparations were collected 24 h after stimulation, followed by staining using monoclonal antibodies, to study the T cell activation in response to peptide megapool stimulations and the CCR6 expression on SARS-CoV-2-specific CD4+ and CD8+ T cells by flow cytometry. The T cell responses to the peptide megapools were calculated by dividing the percentage of activated T cells under different stimulatory conditions by the percentage of activated T cells in the unstimulated vehicle controls and were shown as stimulation index (SI). An SI ≥ 2 was considered a positive T cell response to the peptide megapool. (A) CD4+ and CD8+ T cell responses in responses to SARS-CoV-2 peptide megapools in individual subacute MIS-C subject. CD4+ T cell activation was defined by the coexpression of 4-1BB and OX40 (AIM+) gated under CD4+ T cells. CD8+ T cell activation was defined by the coexpression of 4-1BB and CD69 (AIM+) gated under CD8+ T cells. Five (1, 2, 5, 18, and 19) of the 22 subjects showed coordinate CD4+ and CD8+ T cell responses to SARS-CoV-2 CD4 and CD8 peptide megapools. Twelve subjects (3, 4, 8–12, 15, 17, and 20–22) of the 22 studied showed T cell responses to SARS-CoV-2 CD4 peptide megapools, and 1 (7) of the 22 subjects showed T cell responses to only SARS-CoV-2 CD8 peptide megapools. The T cell responses to SARS-CoV-2 CD4 and CD8 peptide megapools were not detected in 4 subjects (6, 13, 14, and 16) of the 22 subacute MIS-C subjects studied. Overall, CD4+ T cells from the MIS-C subjects showed more prevalent responses to SARS-CoV-2 CD4 spike (p < 0.0001) and nonspike (p = 0.0008) proteins, and CD8+ T cell responses were less prominent in the cohort (p > 0.05 for both SARS-CoV-2 CD8 megapool MP A and MP B). (B) CCR6 expression on SARS-CoV-2-specific CD4+ (top panel) and CD8+ (bottom panel) T cells. CCR6 expression can be found on both AIM+ CD4+ (median: 17.8%; Q1–Q3: 9.54–33.1%) and AIM+ CD8+ (median: 18.8%; Q1–Q3: 0–50%) T cells, although the expression of CCR6 on AIM+ CD8+ T cells varies between subjects. Each symbol represents data derived from an individual subject. Comparisons of the percentage of AIM+ T cells between unstimulated control and peptide megapool-stimulated cell cultures were tested by the Wilcoxon signed-rank test.
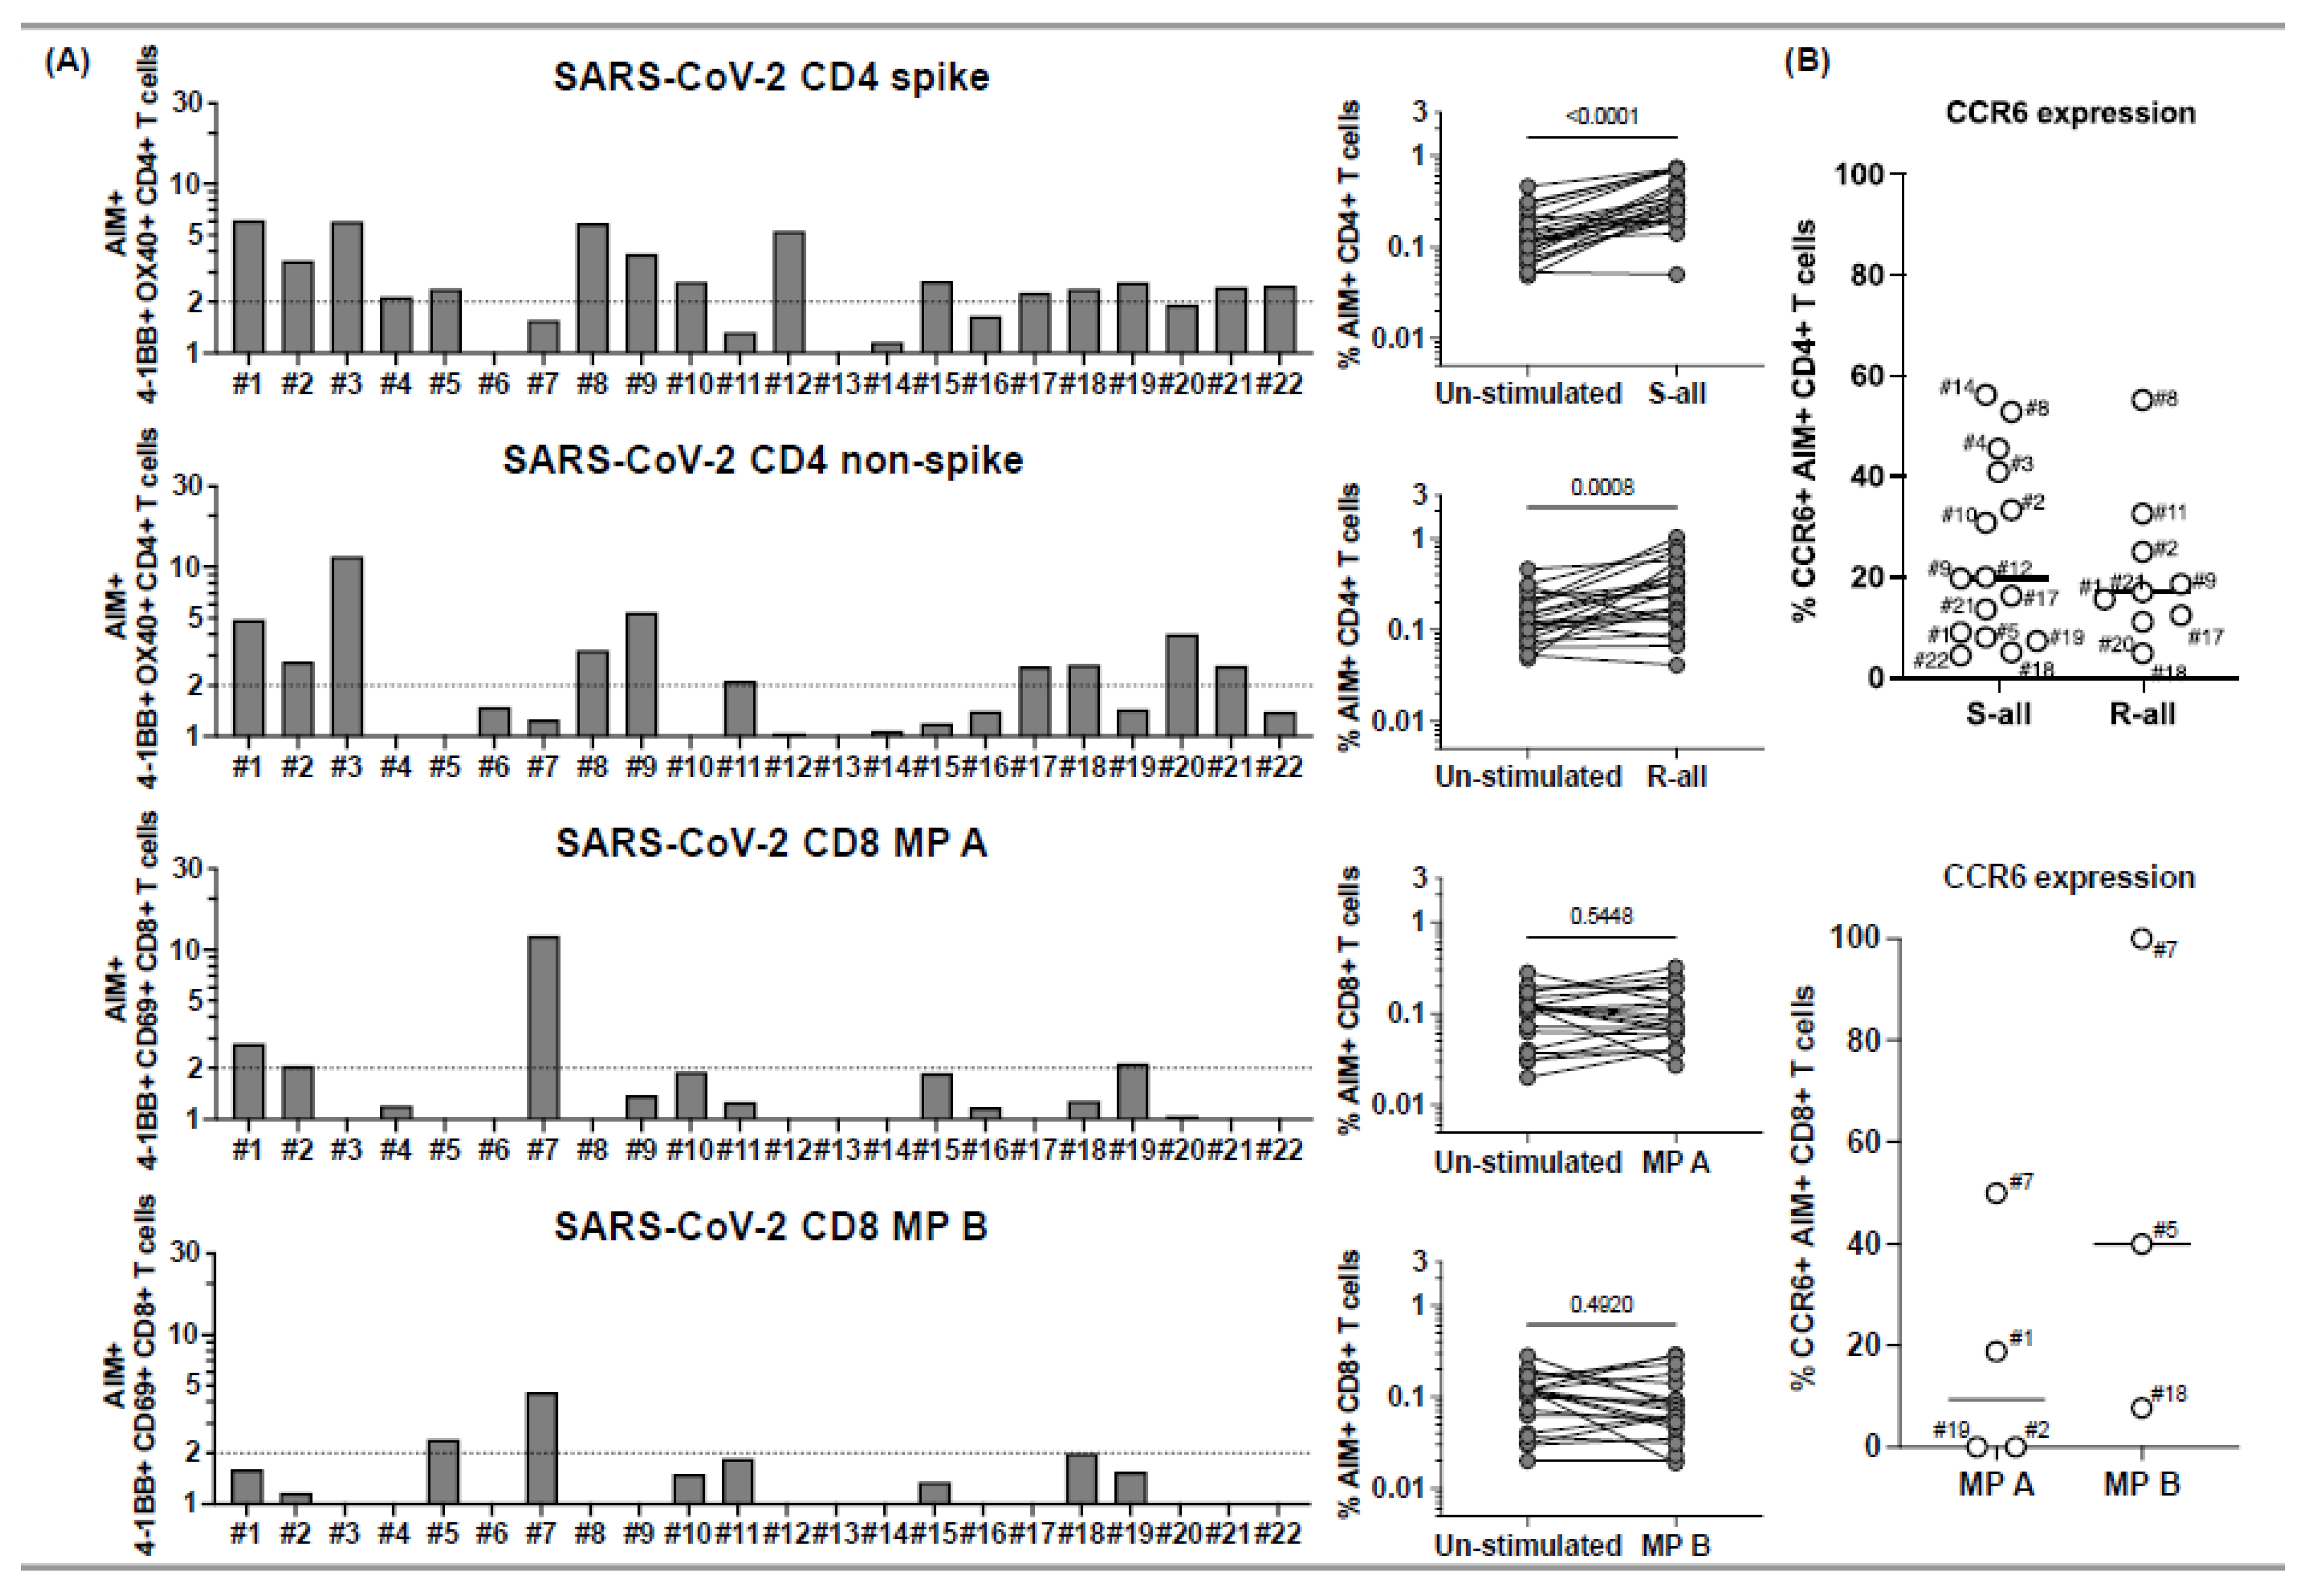
![Ijms 23 07219 g001]()
Figure 2.
Memory phenotypes of SARS-CoV-2-specific, AIM+ CD4+, and CD8+ T cells in subacute MIS-C subjects. Memory phenotypes of SARS-CoV-2-specific AIM+ CD4+ (top panels) and CD8+ T cells (bottom panels) were studied 24 h after the peptide megapool stimulation. Each symbol shows the percentage of terminally differentiated effector T cells (TEMRA CD45RA+ CCR7−; left panels), effector memory T cells (TEM CD45RA− CCR7−; middle panels), and central memory T cells (TCM CD45RA− CCR7−; right panels) in the AIM+ CD4+ or CD8+ T cell populations. Red circles: subjects responding to both CD4 and CD8 epitopes (1, 2, 5, 18, and 19); blue circles: subjects responding to both CD4 spike and nonspike epitopes (3, 8, 9, 17, and 21); white circle: subject responding to either CD4 spike or nonspike epitopes (4, 10–12, 15, 20, and 22); gray circle: subject responding to only CD8 epitopes (7). Each symbol represents data derived from each individual subject. SARS-CoV-2-specific CD4+ T cells showed higher percentages of TEM and TCM phenotypes and lower percentages of TEMRA than SARS-CoV-2-specific CD8+ T cells.
![Ijms 23 07219 g002]()
Figure 3.
CD4− CD8− double-negative (DN) T cell responses to peptide megapools derived from SARS-CoV-2 in subacute MIS-C subjects. CD4− CD8− DN T cell responses were studied gated under CD3+ (T cells), followed by the gating of the CD4− CD8− population (see
Supplementary Figure S1) in the 22 subacute MIS-C subjects. (
A) DN T cell activation in response to SARS-CoV-2 peptide megapool stimulations. The percentages of 4-1BB+ OX40+ DN T cells were enumerated in unstimulated vehicle control, SARS-CoV-2 CD4 spike, and SARS-CoV-2 CD4 non-spike-stimulated cell cultures. In addition, the percentages of 4-1BB+ CD69+ DN T cells were enumerated in unstimulated vehicle control, SARS-CoV-2 CD8 MP A-, and MP B-stimulated cell cultures. SIs of AIM+ DN T cells from each individual subject are shown. Four subjects (4, 8, 14, and 16) of the 22 subjects showed DN T cell responses to both CD4 and CD8 peptide megapools. Seven subjects (2, 5, 9, 12, 15, 19, and 22) of the 22 MIS-C subjects showed DN T cell responses to only CD4 peptide megapools. No subject showed DN T cell responses to only CD8 peptide megapools, and 11 subjects (1, 3, 6, 7, 10, 11, 13, 17, 18, 20, and 21) of the 22 MIS-C subjects showed no measurable DN T cell response. (
B) CCR6 expression on SARS-CoV-2-specific DN T cells. AIM+ DN T cells showed a different level of CCR6 expression from subject to subject. (
C) PD1 and CD25 expression on SARS-CoV-2-specific DN T cells. PD1 and CD25 expressions were studied on 4 subjects (19–22). Subject 19 showed DN T cell responses to both CD4 spike and nonspike peptide megapools, and subject 22 showed DN T cell responses to a CD4 nonspike peptide megapool. Percentages of PD1+ (grey bars) and CD25+ (white bars) were enumerated under AIM+ DN T cells in the cell cultures, which showed a positive response to the peptide megapool. While 30.0–62.9% of the AIM+ DN T cells expressed PD1, 8.6–40.0% of the AIM+ DN T cells also showed CD25 expression. Each symbol represents data derived from each individual subject. Comparisons of the percentages of AIM+ DN T cells between unstimulated control and peptide megapool-stimulated cell cultures were tested by the Wilcoxon signed-rank test.
![Ijms 23 07219 g003]()
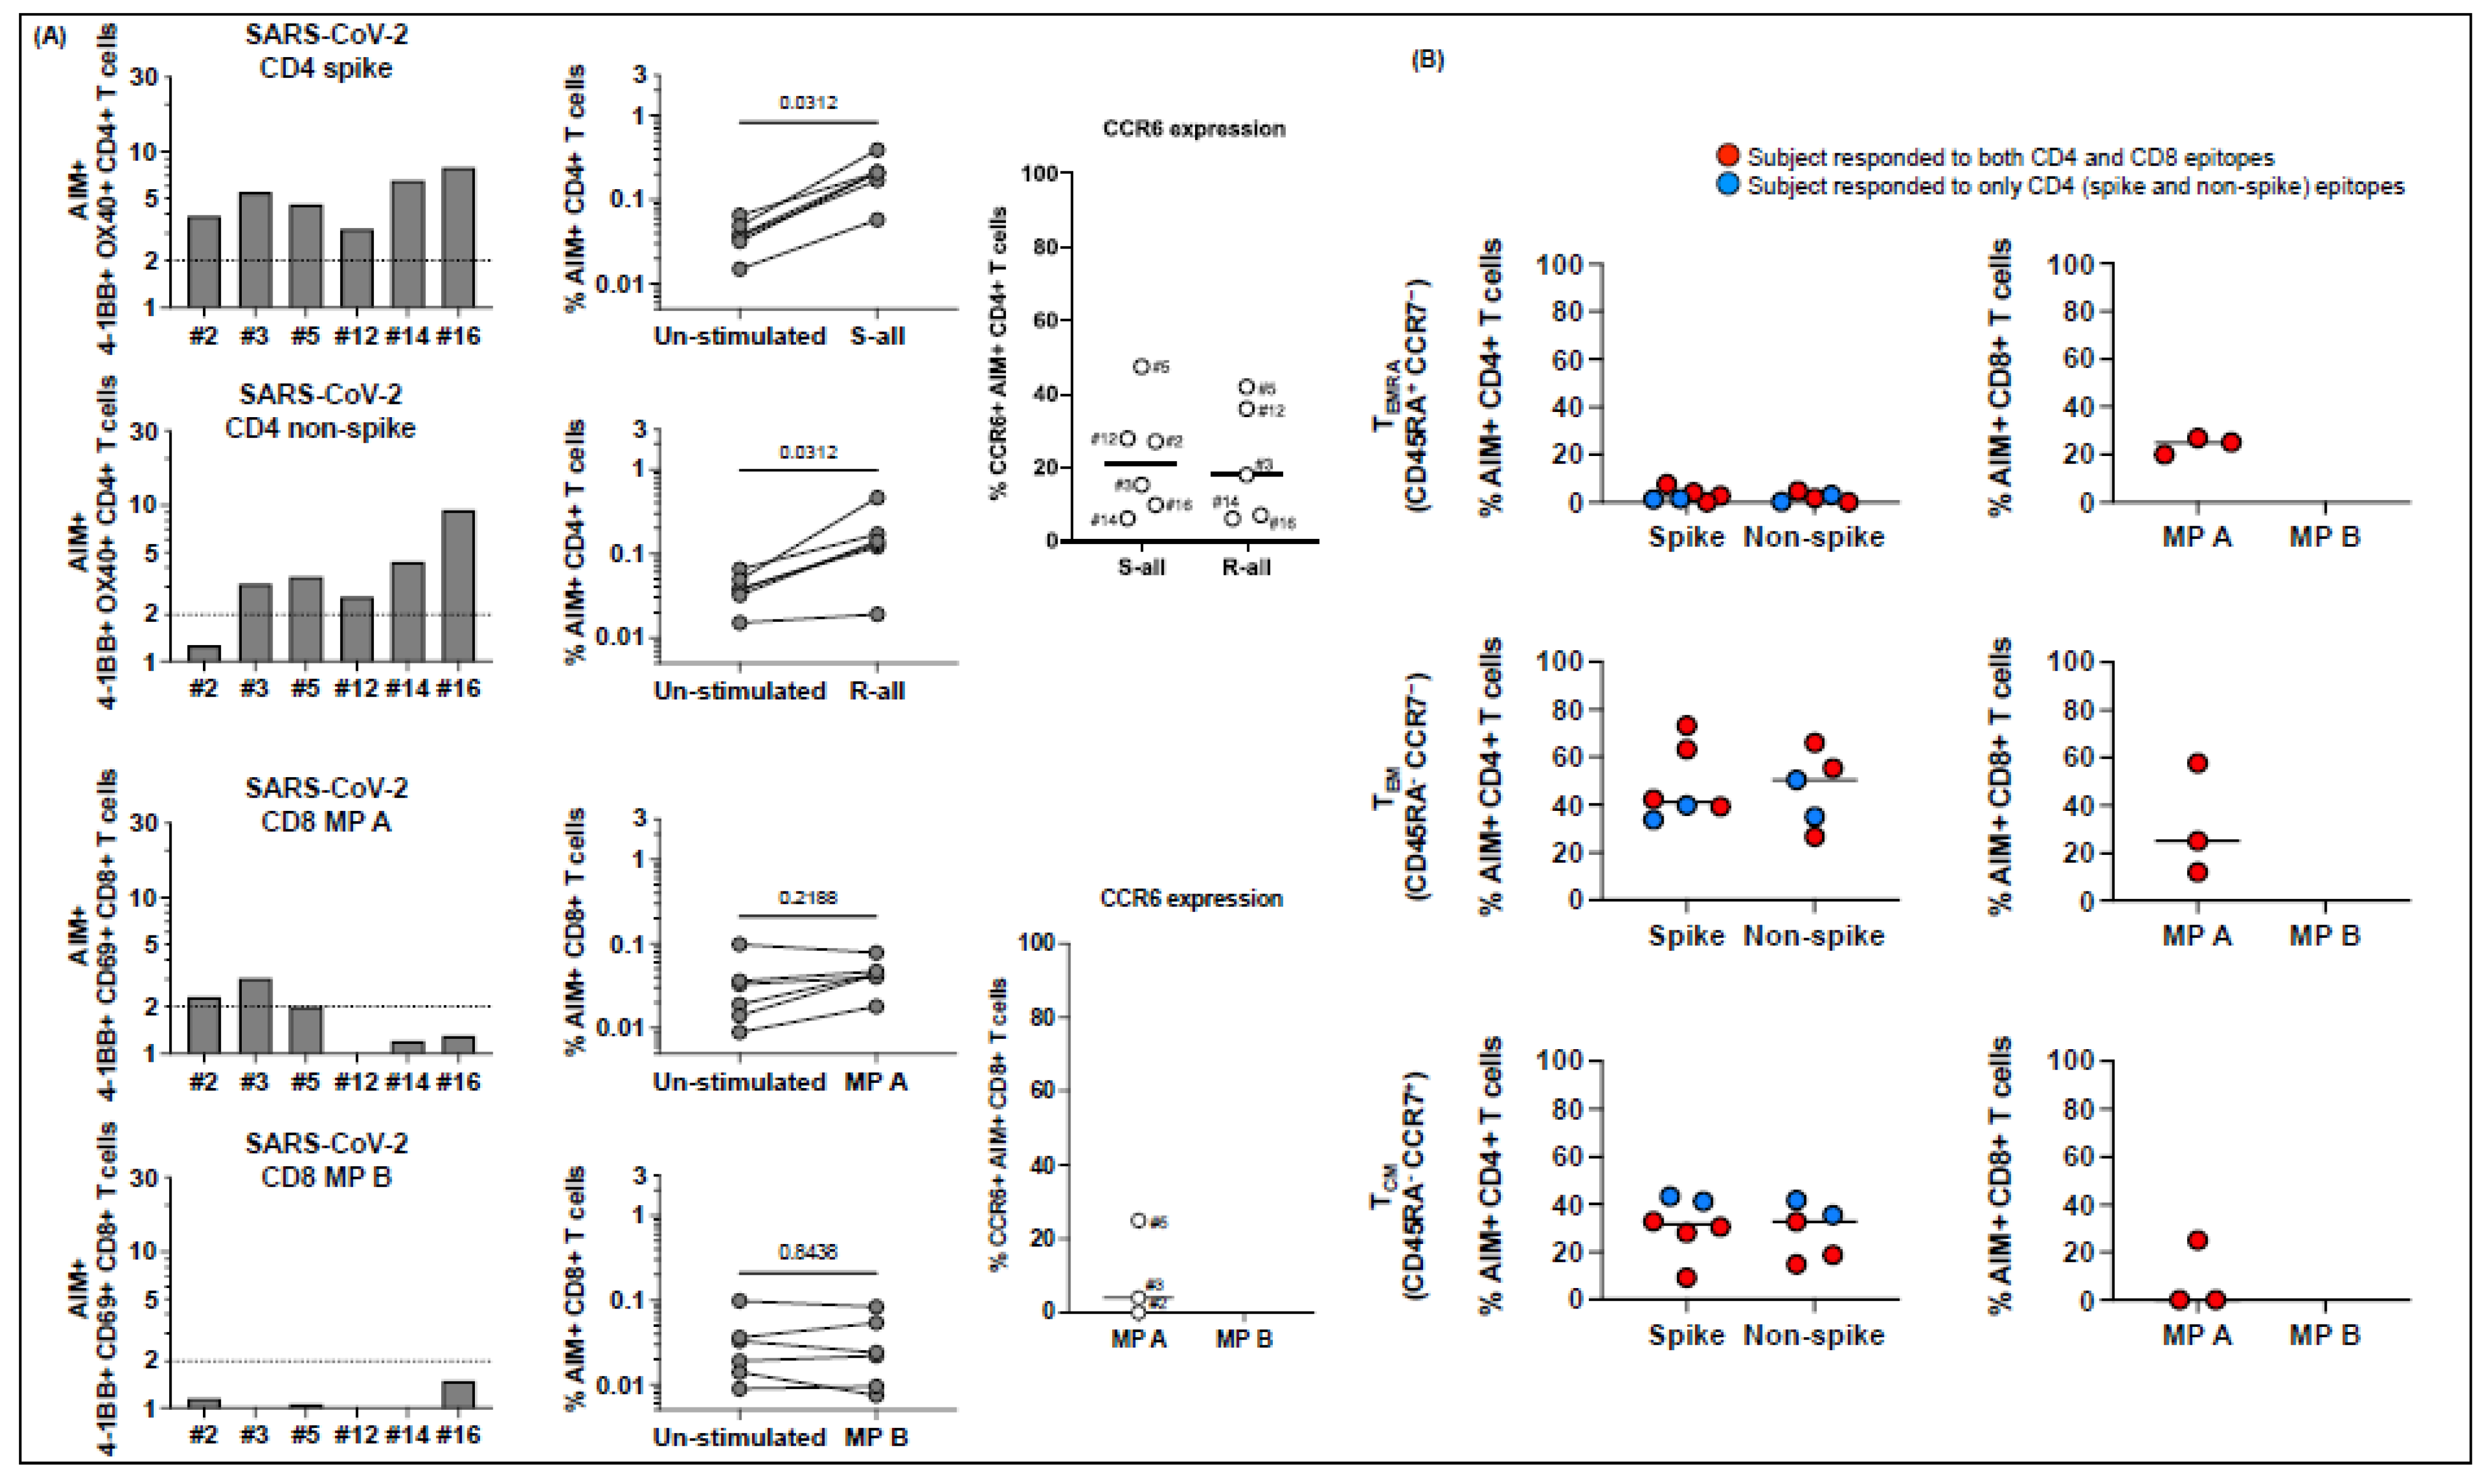
Figure 4.
TCR Vβ21.3+ CD4+ and CD8+ T cell responses to peptide megapools derived from SARS-CoV-2 in subacute MIS-C subjects. CD4+ and CD8+ T cells from 6 (1 and 18–22) of the 22 MIS-C subjects were studied for their TCR Vβ21.3 usage and the TCR Vβ21.3+ CD4+ and CD8+ T cell responses to SARS-CoV-2. (A) TCR Vβ21.3 usage of CD4+ (top panel) and CD8+ (bottom panel) T cells under an unstimulated condition. An amount of 1.7%–2.7% of CD4+ cells and 1.9%–3.9% of CD8+ T cells were TCR Vβ21.3+ among the 6 subjects studied. (B) TCR Vβ21.3+ CD4+ (top panel) and CD8+ (bottom panel) T cell activations in response to anti-CD3/anti-CD28, SARS-CoV-2 CD4 spike and non-spike, and SARS-CoV-2 CD8 MP A and B peptide megapool stimulations. SIs of AIM+ TCR Vβ21.3+ CD4+ and CD8+ T cells from each individual subject are shown. TCR Vβ21.3+ CD4+ and CD8+ T cells from all the subjects responded to anti-CD3/anti-CD28 stimulation except for 1 subject. (C). The majority of the TCR Vβ21.3+ CD4+ and CD8+ T cells showed no detectable response to any of the SARS-CoV-2 peptide megapools; however, TCR Vβ21.3+ CD8+ from subject 18 showed an SI > 2 in response to SARS-CoV-2 CD8 MP B stimulation.
![Ijms 23 07219 g004]()
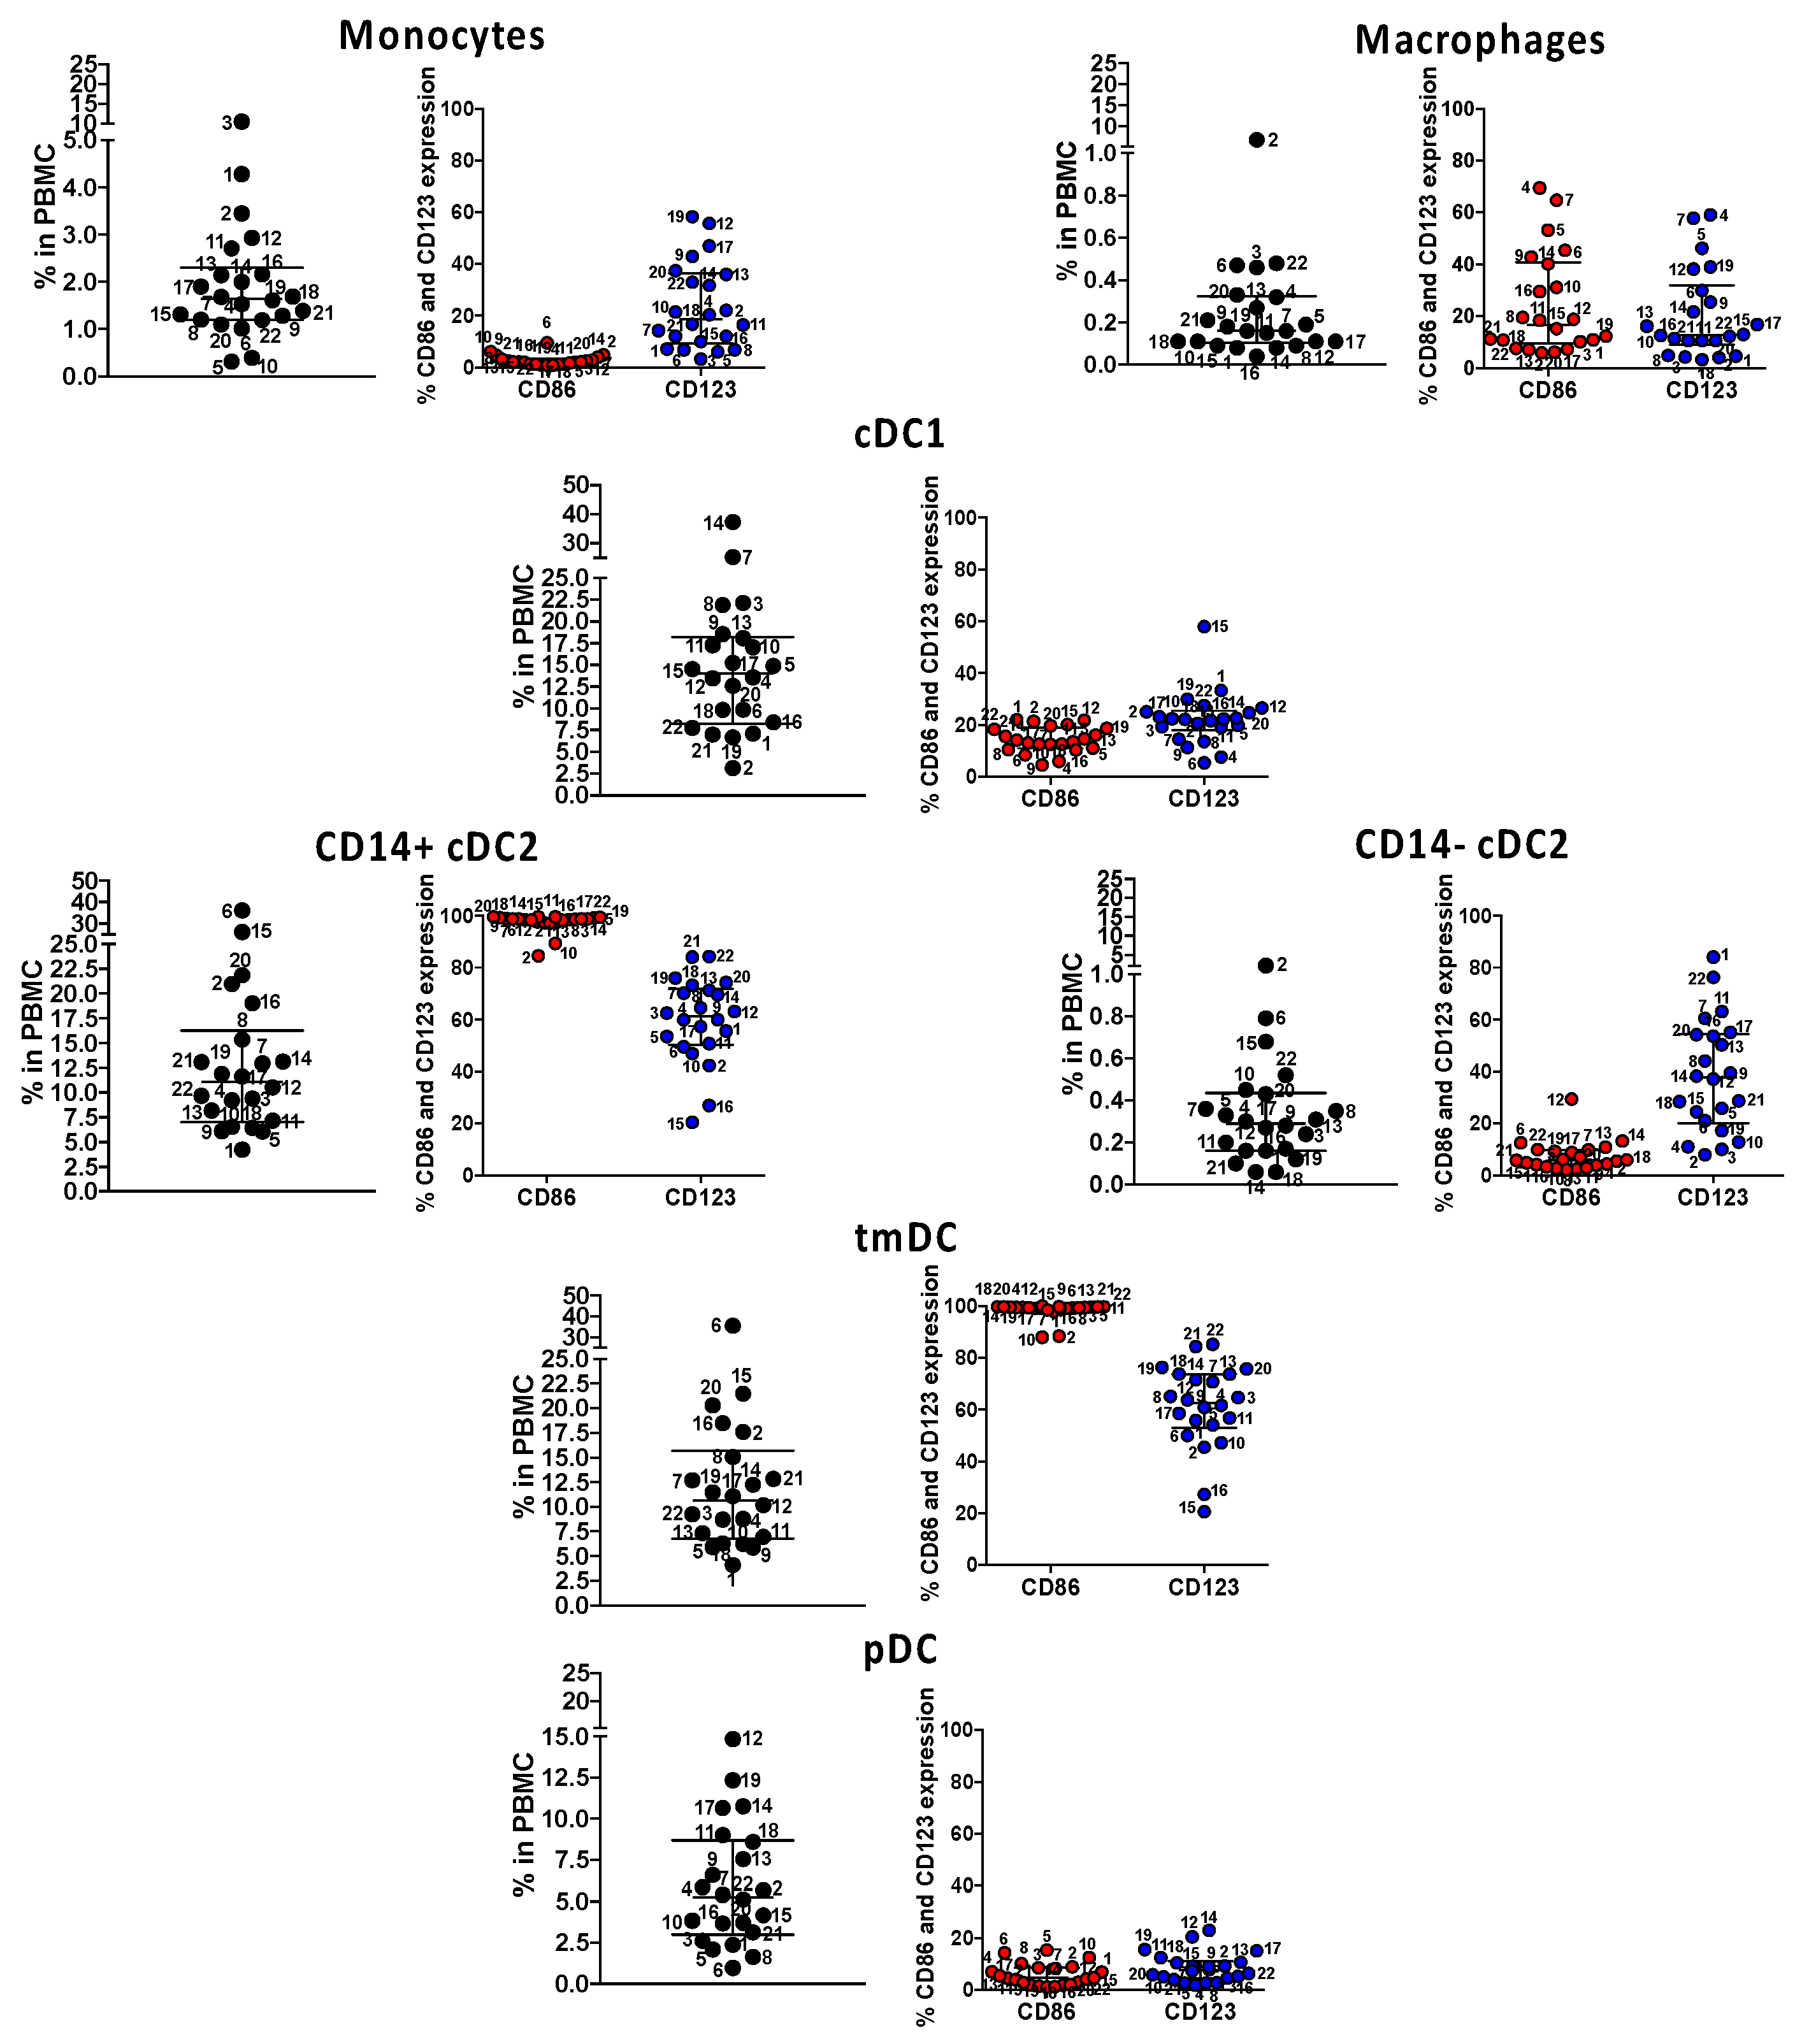
Figure 5.
Immune phenotyping of circulating innate antigen presenting cells (APC) in subacute MIS-C subjects. We enumerated APC populations with a combination of monoclonal antibodies in all the 22 MIS-C subjects studied for SARS-CoV-2 T cell responses in their subacute phase by staining the same PBMC preparations. Monocytes were defined as CD14+ CD11c− CD11b−; macrophages were defined as CD14+ CD11c− CD11b+; myeloid cDC1 were defined as CD11c+ CD11b− CD14−; myeloid cDC2 (CD14+ or CD14−) CD11c+ CD11b+, tmDC were defined as CD11c+ CD11b+ CD4+ ILT-4+; and pDC was defined as CD14− CD11c− CD11b− CD123+. The activation/maturation markers CD86 (red symbols) and CD123 (blue symbols) are shown next to the population. Symbols represent data derived from each individual subject. Median ± interquartile ranges are indicated in the figure. CD14+ cDC2 and CD11c+ CD11b+ CD14+ CD4+ ILT-4+, functionally tolerogenic, were the most activated, as shown by the expression of CD86 and CD123.
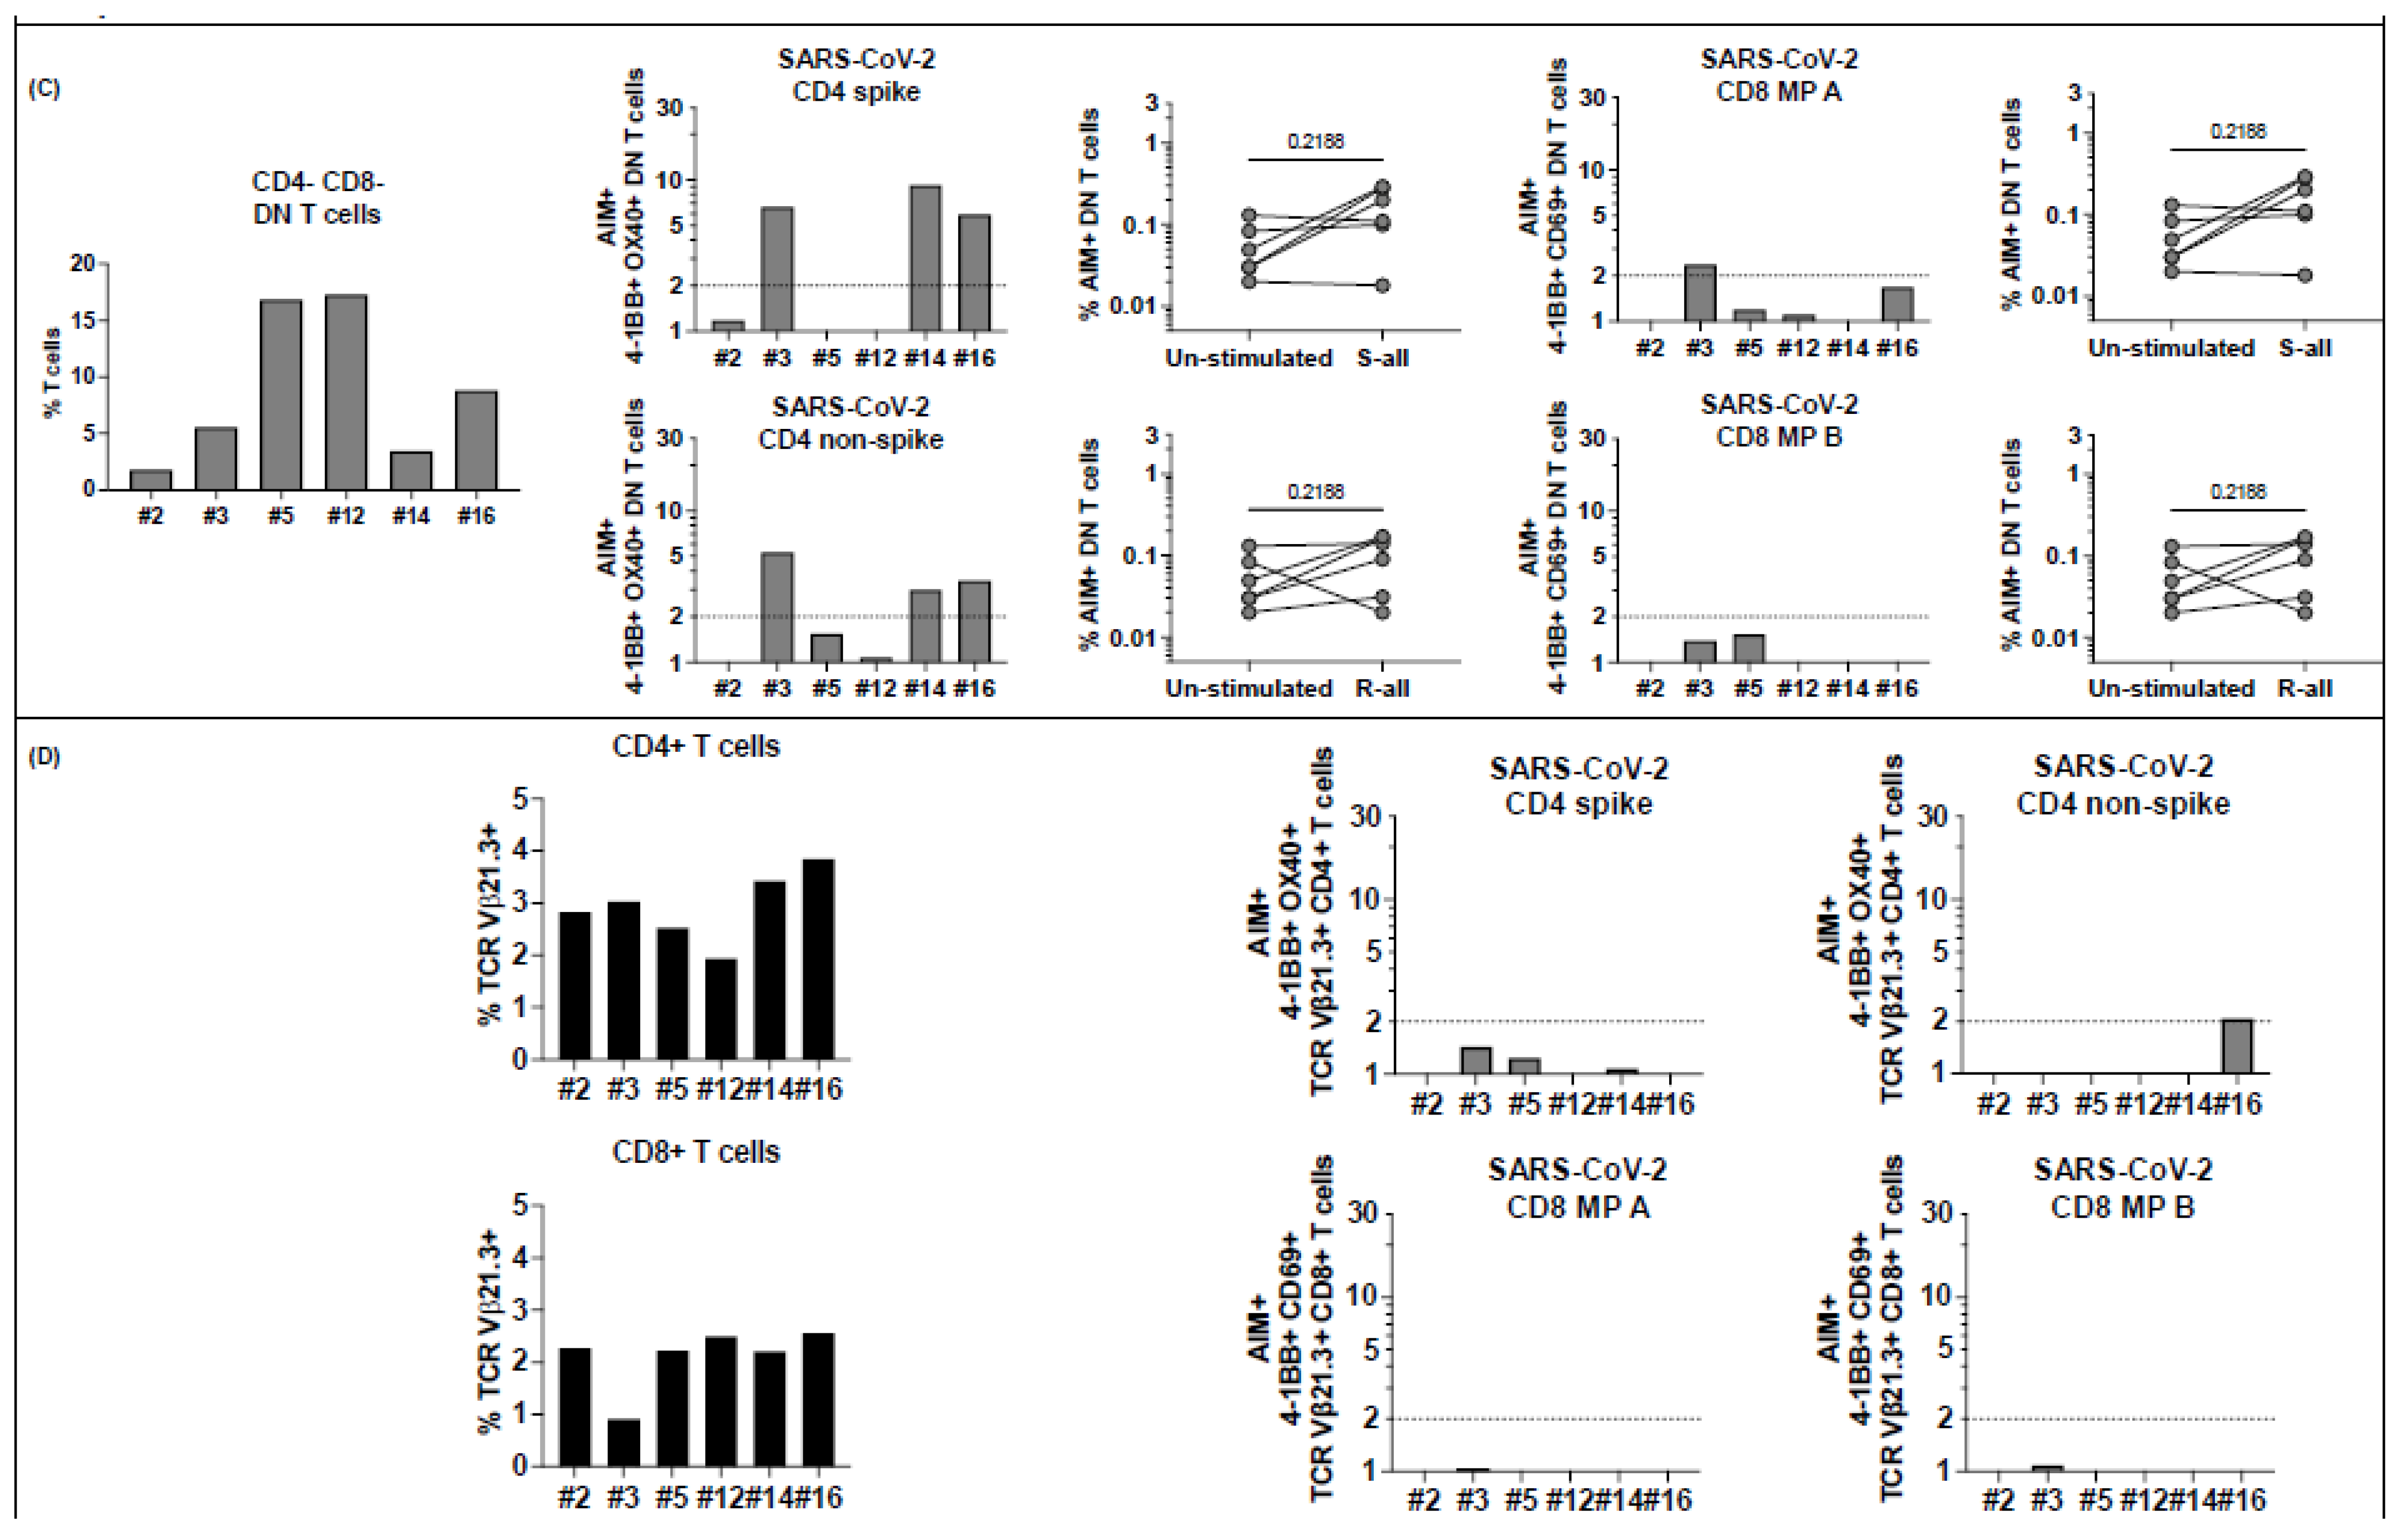
Figure 6.
T cell responses to peptide megapools derived from SARS-CoV-2 in MIS-C subjects healthy 6-14 months after the disease onset. Six MIS-C subjects (2, 3, 5, 12, 14, and 16) studied at their subacute phase were also studied 6–14 months later. Canonical CD4+ and CD8+, CD4− CD8− DN, and TCR Vβ21.3+ CD4+ and CD8+ T cell responses to SARS-CoV-2 peptide megapools were studied. The SI of AIM+ T cells from each individual subject was calculated to study the T cell responses. (A) CD4+ and CD8+ T cell responses to peptide megapools and their CCR6 expressions. Three subjects (2, 3, and 5) of the 6 subjects showed concurrent CD4+ and CD8+ T cell responses, and the other 3 follow-up MIS-C subjects (12, 14, and 16) showed only CD4+ T cell responses to SARS-CoV-2 (both CD4 spike (S) and nonspike (R) megapools). (B) Memory phenotypes of AIM+ CD4+ (left panels) and CD8+ (right panels) T cells. Red circles: subjects responding to both CD4 and CD8 epitopes (subjects 2, 3, and 5); blue circles: subjects responding to both CD4 spike and nonspike epitopes (subjects 12, 14, and 16). AIM+ CD4+ T cells showed a similar level of TEMRA, TEM, and TCM at follow-up visit compared with subacute MIS-C subjects (p > 0.05). AIM+ CD8+ T cells showed a slight increase in TEM (p > 0.05) and a similar level of TEMRA and TCM. (C) Percentage of DN T cells (left panel) and their responses to SARS-CoV-2 peptide megapools (right panels). Percentages of DN T cells were decreased in 5 subjects (2, 3, 5, 12, and 14) compared with subacute MIS-C subjects. One subject (3) showed DN T cell responses to SARS-CoV-2 CD4 and CD8 peptide megapools, and 2 subjects (14 and 16) showed DN T cell responses to SARS-CoV-2 CD4 spike and nonspike peptide megapools. (D) Percentage of CD4+ and CD8+ TcR Vβ21.3 (black bars, left panels). An amount of 2.0–3.9% of CD4+ T cells and 0.9–2.6% of CD8+ T cells were TCR Vβ21.3+ among the 6 subjects studied. TCR Vβ21.3+ CD4+ T cells in 1 subject (16) showed a minor response to a SARS-CoV-2 CD4 nonspike peptide megapool. Each symbol represents an individual subject. Comparisons of the percentage of AIM+ T cells between unstimulated control and peptide megapool-stimulated cell cultures were tested by the Wilcoxon signed-rank test. Comparisons of the memory phenotypes of AIM+ T cells between subacute and follow-up visit were tested by the Mann–Whitney U test.
![Ijms 23 07219 g006a]()
![Ijms 23 07219 g006b]()
Table 1.
Demographic and clinical characteristics of MIS-C patients.
Table 1.
Demographic and clinical characteristics of MIS-C patients.
| Variable * | MIS-C (n = 22) |
|---|
| Demographic information | |
| Age, yrs | 9.1 (5.3–12.0) |
| Male, n (%) | 17 (77) |
| Female, n (%) | 5 (23) |
| Ethnicity, n (%) | |
| Asian | 1 (5) |
| African American | 2 (9) |
| White | 2 (9) |
| >2 races or other | 6 (27) |
| Hispanic | 11 (50) |
| Cardiac data and clinical course | |
| Zmax † | 1.5 (0.8–2.2) |
| Lowest LV Ejection Fraction | 56.5 (47.8–60.8) |
| ICU admission, n (%) | 9 (41) |
| SARS-CoV-2 antibody positive, n (%) | 22 (100) |
| Clinical laboratory data | |
| Illness day of Sample collection ‡ | 5 (4–6) |
| WBC, 103/mL | 9.9 (6.1–14.5) |
| Polys, % | 71 (56–81) |
| Bands, % | 17 (8–25) |
| Lymphocytes, % | 10 (6–12) |
| ANC, /mL | 8391 (4675–13,230) |
| ZHgb | −1.8 (−2.5 to −1.0) |
| PLT, ×103/mm3 | 148 (100–201) |
| ESR, mm/h § | 35 (25–57) |
| CRP, mg/dL | 22 (17–29) |
| ALT, IU/L | 37 (26–51) |
| Sodium, mmol/L | 132 (130–134) |
| BNP, pg/mL ¶ | 215 (40–644) |
| Treatment | |
| Intravenous immunoglobulin | 21 (95) |
| Steroids | 15 (68) |
| Infliximab | 10 (45) |
| Anakinra | 10 (45) |


 ,
, 


