Article

LRF Promotes Indirectly Advantageous Chromatin Conformation via BGLT3-lncRNA Expression and Switch from Fetal to Adult Hemoglobin

by
Vasiliki Chondrou
1,*,
Athanasios-Nasir Shaukat
2,
Georgios Psarias
1,
Katerina Athanasopoulou
1,
Evanthia Iliopoulou
1,
Ariadne Damanaki
1,
Constantinos Stathopoulos
2 and
Argyro Sgourou
1,*
1
Biology Laboratory, School of Science and Technology, Hellenic Open University, 26335 Patras, Greece
2
Department of Biochemistry, School of Medicine, University of Patras, 26504 Patras, Greece
*
Authors to whom correspondence should be addressed.
Int. J. Mol. Sci. 2022, 23(13), 7025; https://doi.org/10.3390/ijms23137025
Submission received: 25 May 2022 / Revised: 21 June 2022 / Accepted: 22 June 2022 / Published: 24 June 2022
(This article belongs to the Special Issue Regulation of Erythropoiesis 3.0)

Abstract

:
The hemoglobin switch from fetal (HbF) to adult (HbA) has been studied intensively as an essential model for gene expression regulation, but also as a beneficial therapeutic approach for β-hemoglobinopathies, towards the objective of reactivating HbF. The transcription factor LRF (Leukemia/lymphoma-related), encoded from the ZBTB7A gene has been implicated in fetal hemoglobin silencing, though has a wide range of functions that have not been fully clarified. We thus established the LRF/ZBTB7A-overexpressing and ZBTB7A-knockdown K562 (human erythroleukemia cell line) clones to assess fetal vs. adult hemoglobin production pre- and post-induction. Transgenic K562 clones were further developed and studied under the influence of epigenetic chromatin regulators, such as DNA methyl transferase 3 (DNMT3) and Histone Deacetylase 1 (HDAC1), to evaluate LRF’s potential disturbance upon the aberrant epigenetic background and provide valuable information of the preferable epigenetic frame, in which LRF unfolds its action on the β-type globin’s expression. The ChIP-seq analysis demonstrated that LRF binds to γ-globin genes (HBG2/1) and apparently associates BCL11A for their silencing, but also during erythropoiesis induction, LRF binds the BGLT3 gene, promoting BGLT3-lncRNA production through the γ-δ intergenic region of β-type globin’s locus, triggering the transcriptional events from γ- to β-globin switch. Our findings are supported by an up-to-date looping model, which highlights chromatin alterations during erythropoiesis at late stages of gestation, to establish an “open” chromatin conformation across the γ-δ intergenic region and accomplish β-globin expression and hemoglobin switch.

1. Introduction

Perturbations in production and operation of the human β-type globin genes (“HBB locus”) are designated as β-hemoglobinopathies and are mainly inherited by the autosomal recessive pattern. Of the most common genetic disorders among the human population, related to the “HBB locus”, are β-thalassemias and Sickle Cell Anemia (SCA). Clinical practice has shown that despite identical disease-causing mutations, the pathological phenotype of disease may vary significantly between individuals. This is partly due to genetic variants of the “HBB locus” including the remote regulatory region (LCR-Locus Control Region) [1] and epigenetic factors affecting chromatin structure [2,3,4]. DNA methylation, histone acetylation, intragenomic lncRNA expression and post-transcriptional attack of several β-type globin genes’ modifier factors by miRNAs, are of the most important mechanisms involved in epigenetic regulation of the “HBB locus” [5,6,7,8,9].
Therapeutic schemes aiming to reactivate fetal hemoglobin (HbF) based in pharmacological factors’ administration have been applied to the clinic for the treatment of β-hemoglobinopathies with dubious results, because of the moderate and heterogeneous HbF expression levels produced, the lack of specificity, and the observed cytotoxicity and mutagenicity in the long run [10,11]. Beneficial contribution of high HbF production to the severe clinical symptoms of β-hemoglobinopathies has been observed at the Hereditary Persistence of HbF in adults (HPFH syndrome), exhibiting an asymptomatic phenotype [12] and thus, the effective reactivation of γ-globin gene’s expression has been constantly at the forefront of research attempts. Clarification of the hemoglobin switch process, from fetal (HbF) to adult (HbA), is considered as a prerequisite for the successful outcome of such efforts. Even though hemoglobin switching is under intensive study, there are still some “dark”, mainly epigenetic, regulatory rules awaiting to be enlightened.
The leukemia/lymphoma-related (LRF/ZBTB7A) transcription factor has been characterized as a critical key regulator of HbF in erythroid cells, acting independently from the main repressor, BCL11A (B Cell CLL/Lymphoma 11A) [7,13,14], and exerting its repressive activity through recruitment of the NuRD (Nucleosome Remodeling) complex. Interaction with the NuRD complex regulates chromatin by reducing activating histone marks and inhibits fetal globin genes’ transcription, indicating LRF as an indirect epigenetic component conferring its repressing activity at the late stages of erythrocytes maturation, during hemoglobin switch from HbF to HbA. LRF deficient human CD34+ hematopoietic stem and progenitor cells (HSPC) show a delay in erythroid differentiation, whereas double LRF/ZBTB7A-knockout HUDEP-2 cells (human immortalized erythroid line, which requires doxycycline removal to achieve terminal differentiation) exhibit a significantly high γ/β globin ratio [7].
The present study aimed to determine the influence of LRF to the balance between γ/β-globin production at both LRF-overexpression or LRF-knockout conditions. We thus established stably overexpressing (OE) LRF and LRF-knockdown (KD) K562 human erythroleukemic clones, which were studied before and during response to hemoglobin induction with chemical treatment [15]. K562 cells have been extensively used as an in vitro model for the study of molecular mechanisms underlying human globin genes’ regulation [16] and constitutively express HbF; although, the cell line originates from an adult, rendering this genetic/epigenetic background the appropriate frame for attainment and study of the switch process from γ- to β-globin expression. In a parallel experiment, K562 clones were stably modified to display an aberrant epigenetic landscape, with the objective to uncover potential epigenetic issues related to globin’s expression regulation across the “HBB locus”.

2. Results

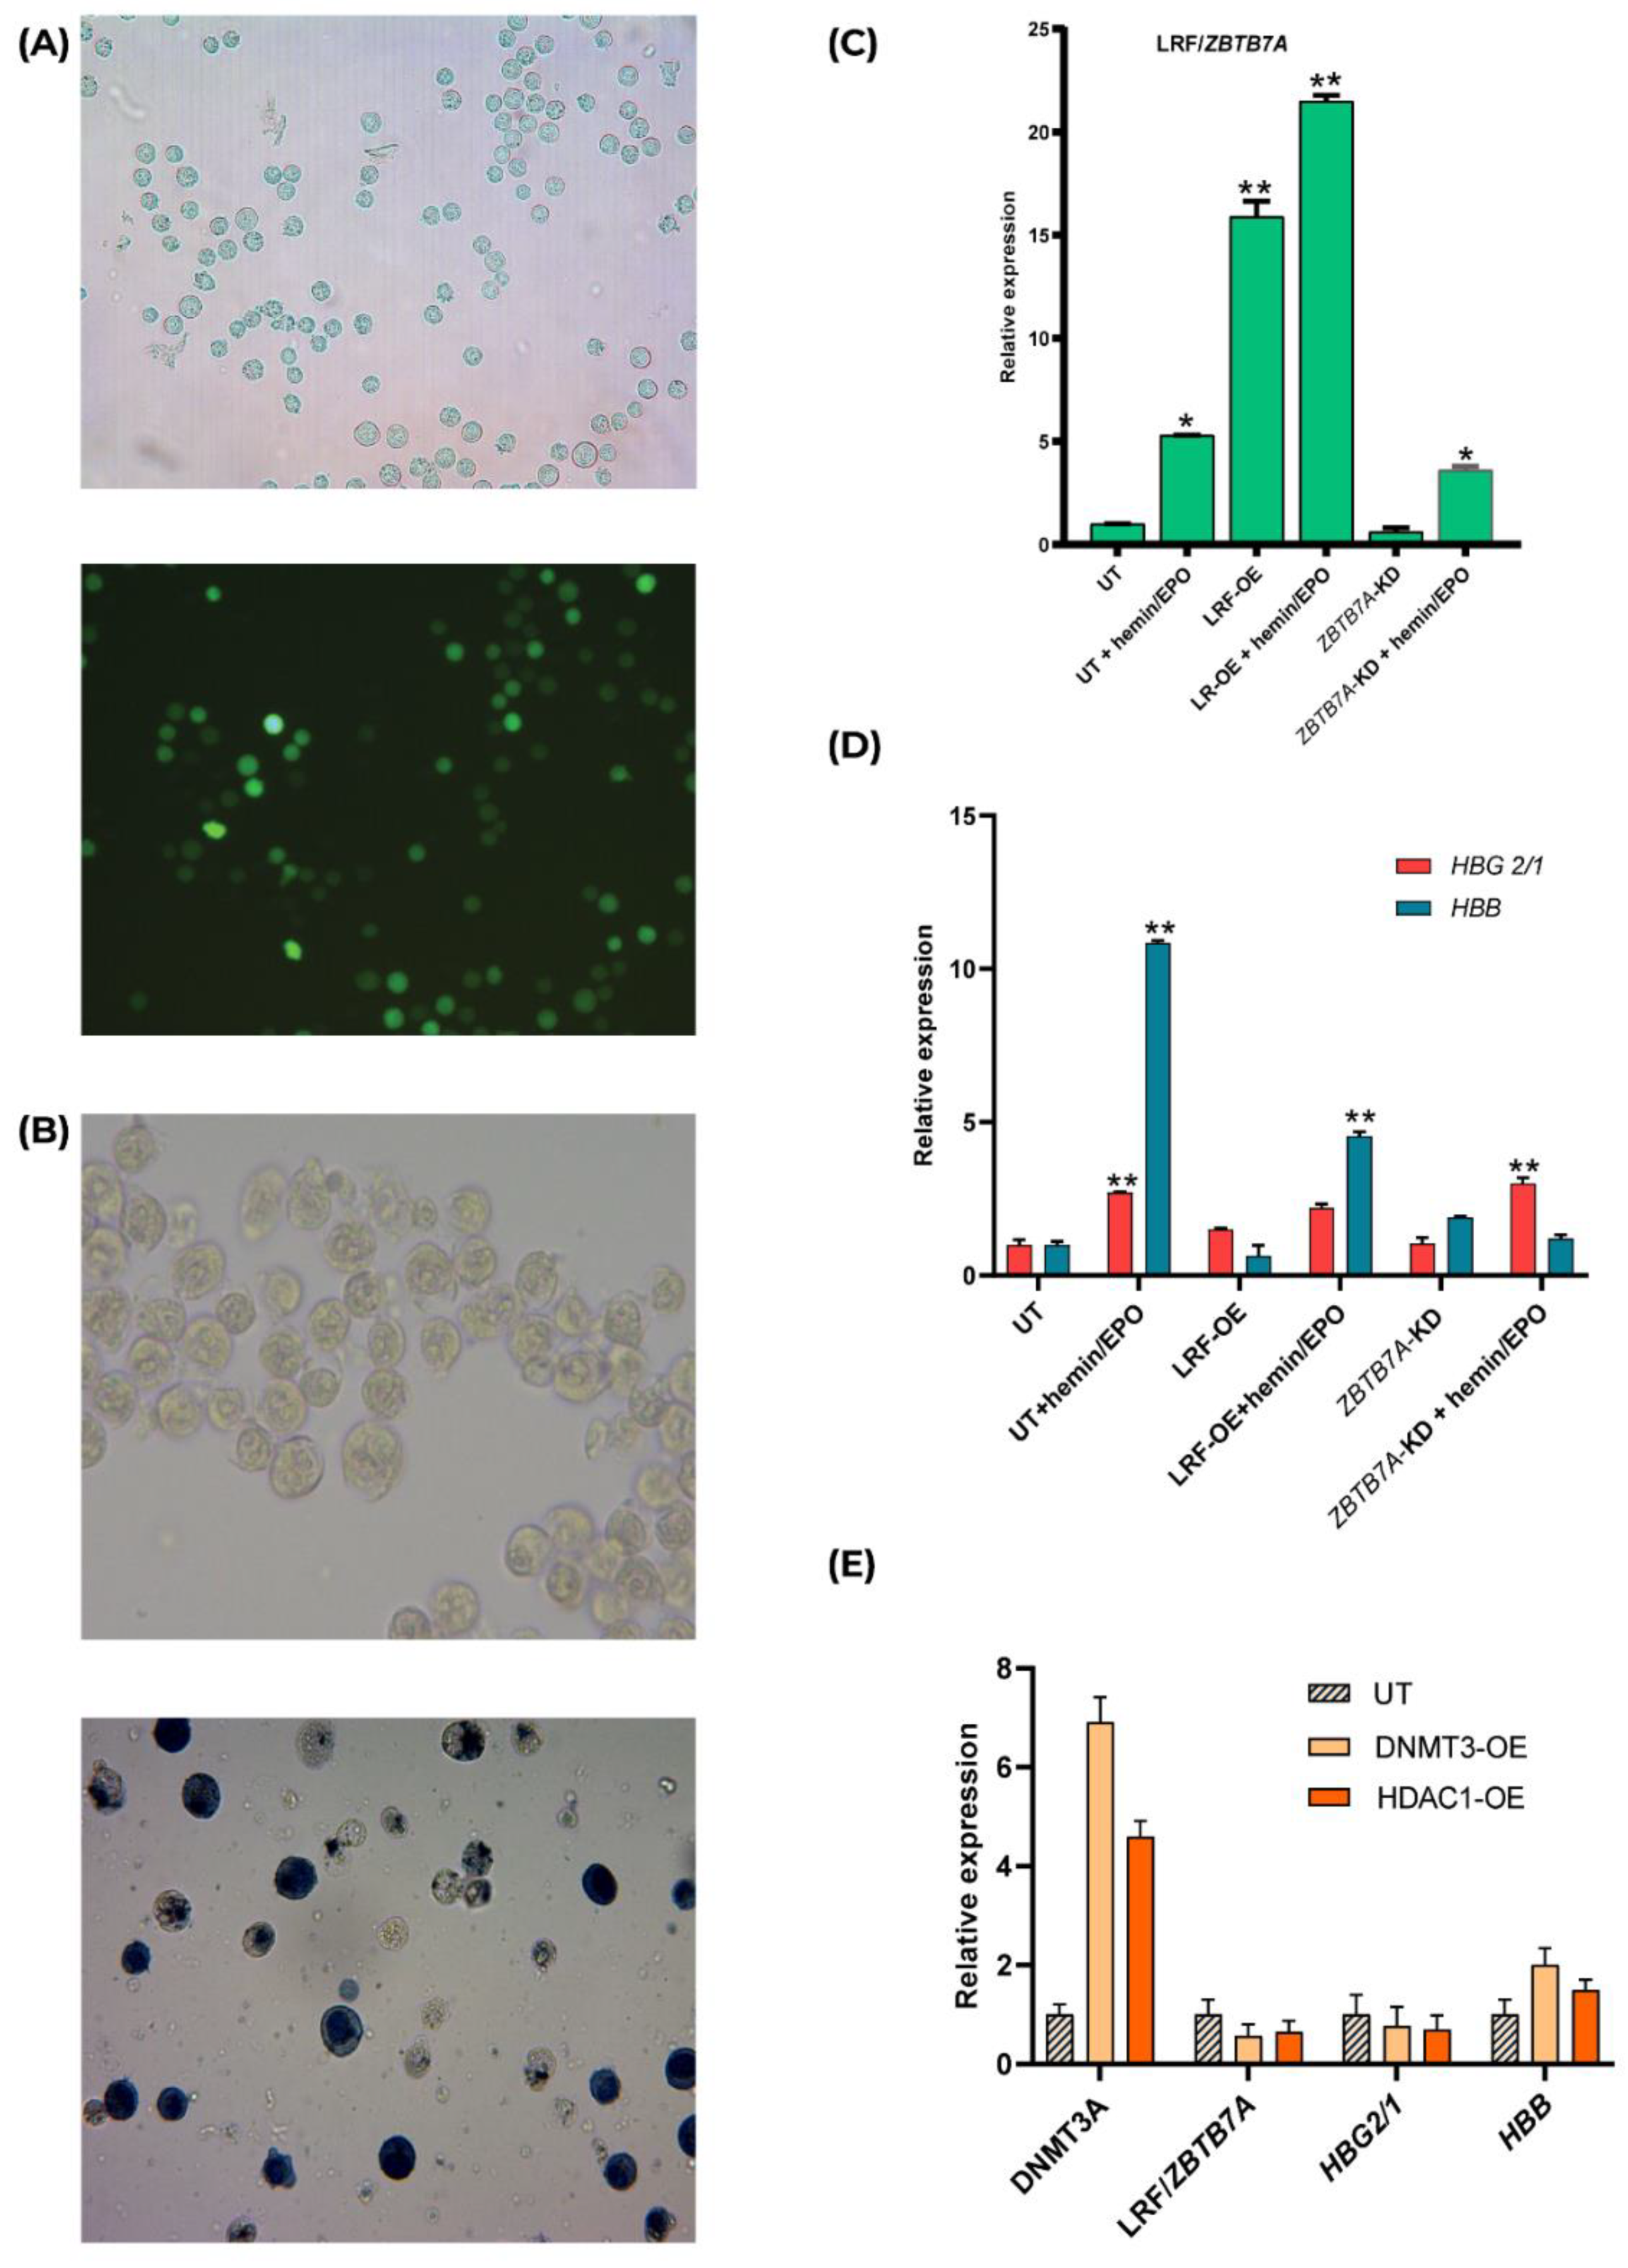
2.1. LRF/ZBTB7A Overexpression in Transfected K562 Clones and Hemin/EPO Treatment Induces Preferentially β- Than γ-Globin Expression

We have developed an in vitro study system composed of human transgenic K562 cell clones, either overexpressing or diminishing LRF/ZBTB7A expression, towards the objective of unraveling the function of the transcription factor LRF, encoded from the ZBTB7A gene, known to act during hemoglobin transversion by inhibiting γ-globin (HBG2/1) genes’ expression [7,14]. LRF-overexpression was efficiently established by the episomal vector LRF/ZBTB7A-GFP for longer than 60 generations during continuous culture of K562 cells in the presence of (400 μg/mL) G418 antibiotic (Figure 1A). ZBTB7A knockdown (KD) K562 clones were obtained by a CRISPR/Cas9 system guided to target the first protein coding exon of ZBTB7A, with sequence specific gRNAs (Figure 5C). Recombination between donor DNA carrying the Puromycin-GFP cassette and the first exon of the ZBTB7A sequence led to genetically engineered K562 cell clones surviving in the presence of 6 μg/mL Puromycin. Sequencing analysis downstream and upstream from predicted insertion sites revealed heterozygous knockout K562 clones and the insertion of the Puromycin-GFP cassette in exogenous regions as well, which were anticipated due to the high genetic instability nature of the K562 karyotype [17]. LRF expression was quantified and was found to be accelerated by 15-fold in LRF-overexpressing (OE) clones, whereas it was reduced to half expression in ZBTB7A- knockdown (KD) K562 clones (Figure 1C).
Untransfected and transfected either long-term LRF-OE or ZBTB7A-KD K562 clones, were subsequently treated with hemin/erythropoietin (EPO) to urge cell differentiation and hemoglobin production. K562 cell line behaves like undifferentiated early pluripotent hematopoietic progenitors and upon chemical induction with hemin/EPO differentiate towards an erythroid character [18]. Furthermore, another major characteristic of K562 cell line is that although it derives from an adult patient and a BCL11A XL transcript is generated, fetal (HbF) hemoglobin (HBG2/1) expression still dominates, whereas adult (HbA) hemoglobin production (HBB expression) is totally suppressed [19].
Hemin/EPO cocktail induced total hemoglobin expression up to 48% during a 3-h interval (Figure 1B). In particular, HBG2/1 expression was increased by at most 2.7-fold in untransfected and 2.2-fold in LRF-overexpressing K562 clones. HBB expression was elevated at much higher levels. by 10.9-fold in untransfected and 4.5-fold in LRF-overexpressing K562 clones (p < 0.01). Contrariwise, ZBTB7A-KD K562 clones upon hemin/EPO treatment showed 3-fold elevation in HBG2/1 and an insignificant change in HBB expression levels (Figure 1D), confirming results from previously conducted research [7,13,14].
Further to qPCRs, the methylation status of CpGs lying at the promoter region of HBG2, which have been shown to be hypermethylated in adult erythroblasts, as an additional mechanism leading to “closed” chromatin conformation required for γ-globin silencing [20], was estimated with Pyrosequencing. Methylation of Cytosines followed by Guanosines located at HBG2 promoter region, more specifically CpG1, CpG3 and CpG6, showed significantly lower values of methylation in LRF-overexpressing K562 clones, further depleted in both untransfected and LRF-overexpressing K562 clones after addition of hemin/EPO (Figure 2A).
Data interpretation clearly manifests a favorable expression of HBB during hemin/EPO treatment of untransfected and LRF-OE K562 cells and a minor elevation of HBG2/1 expression, although the drastic hypomethylation of the HBG2 promoter would potentially hyper boost gene’s transcription levels. ZBTB7A-KD K562 clones fail to increase HBB expression during hemoglobin induction, though HBG2/1 were significantly upregulated (Figure 1D).

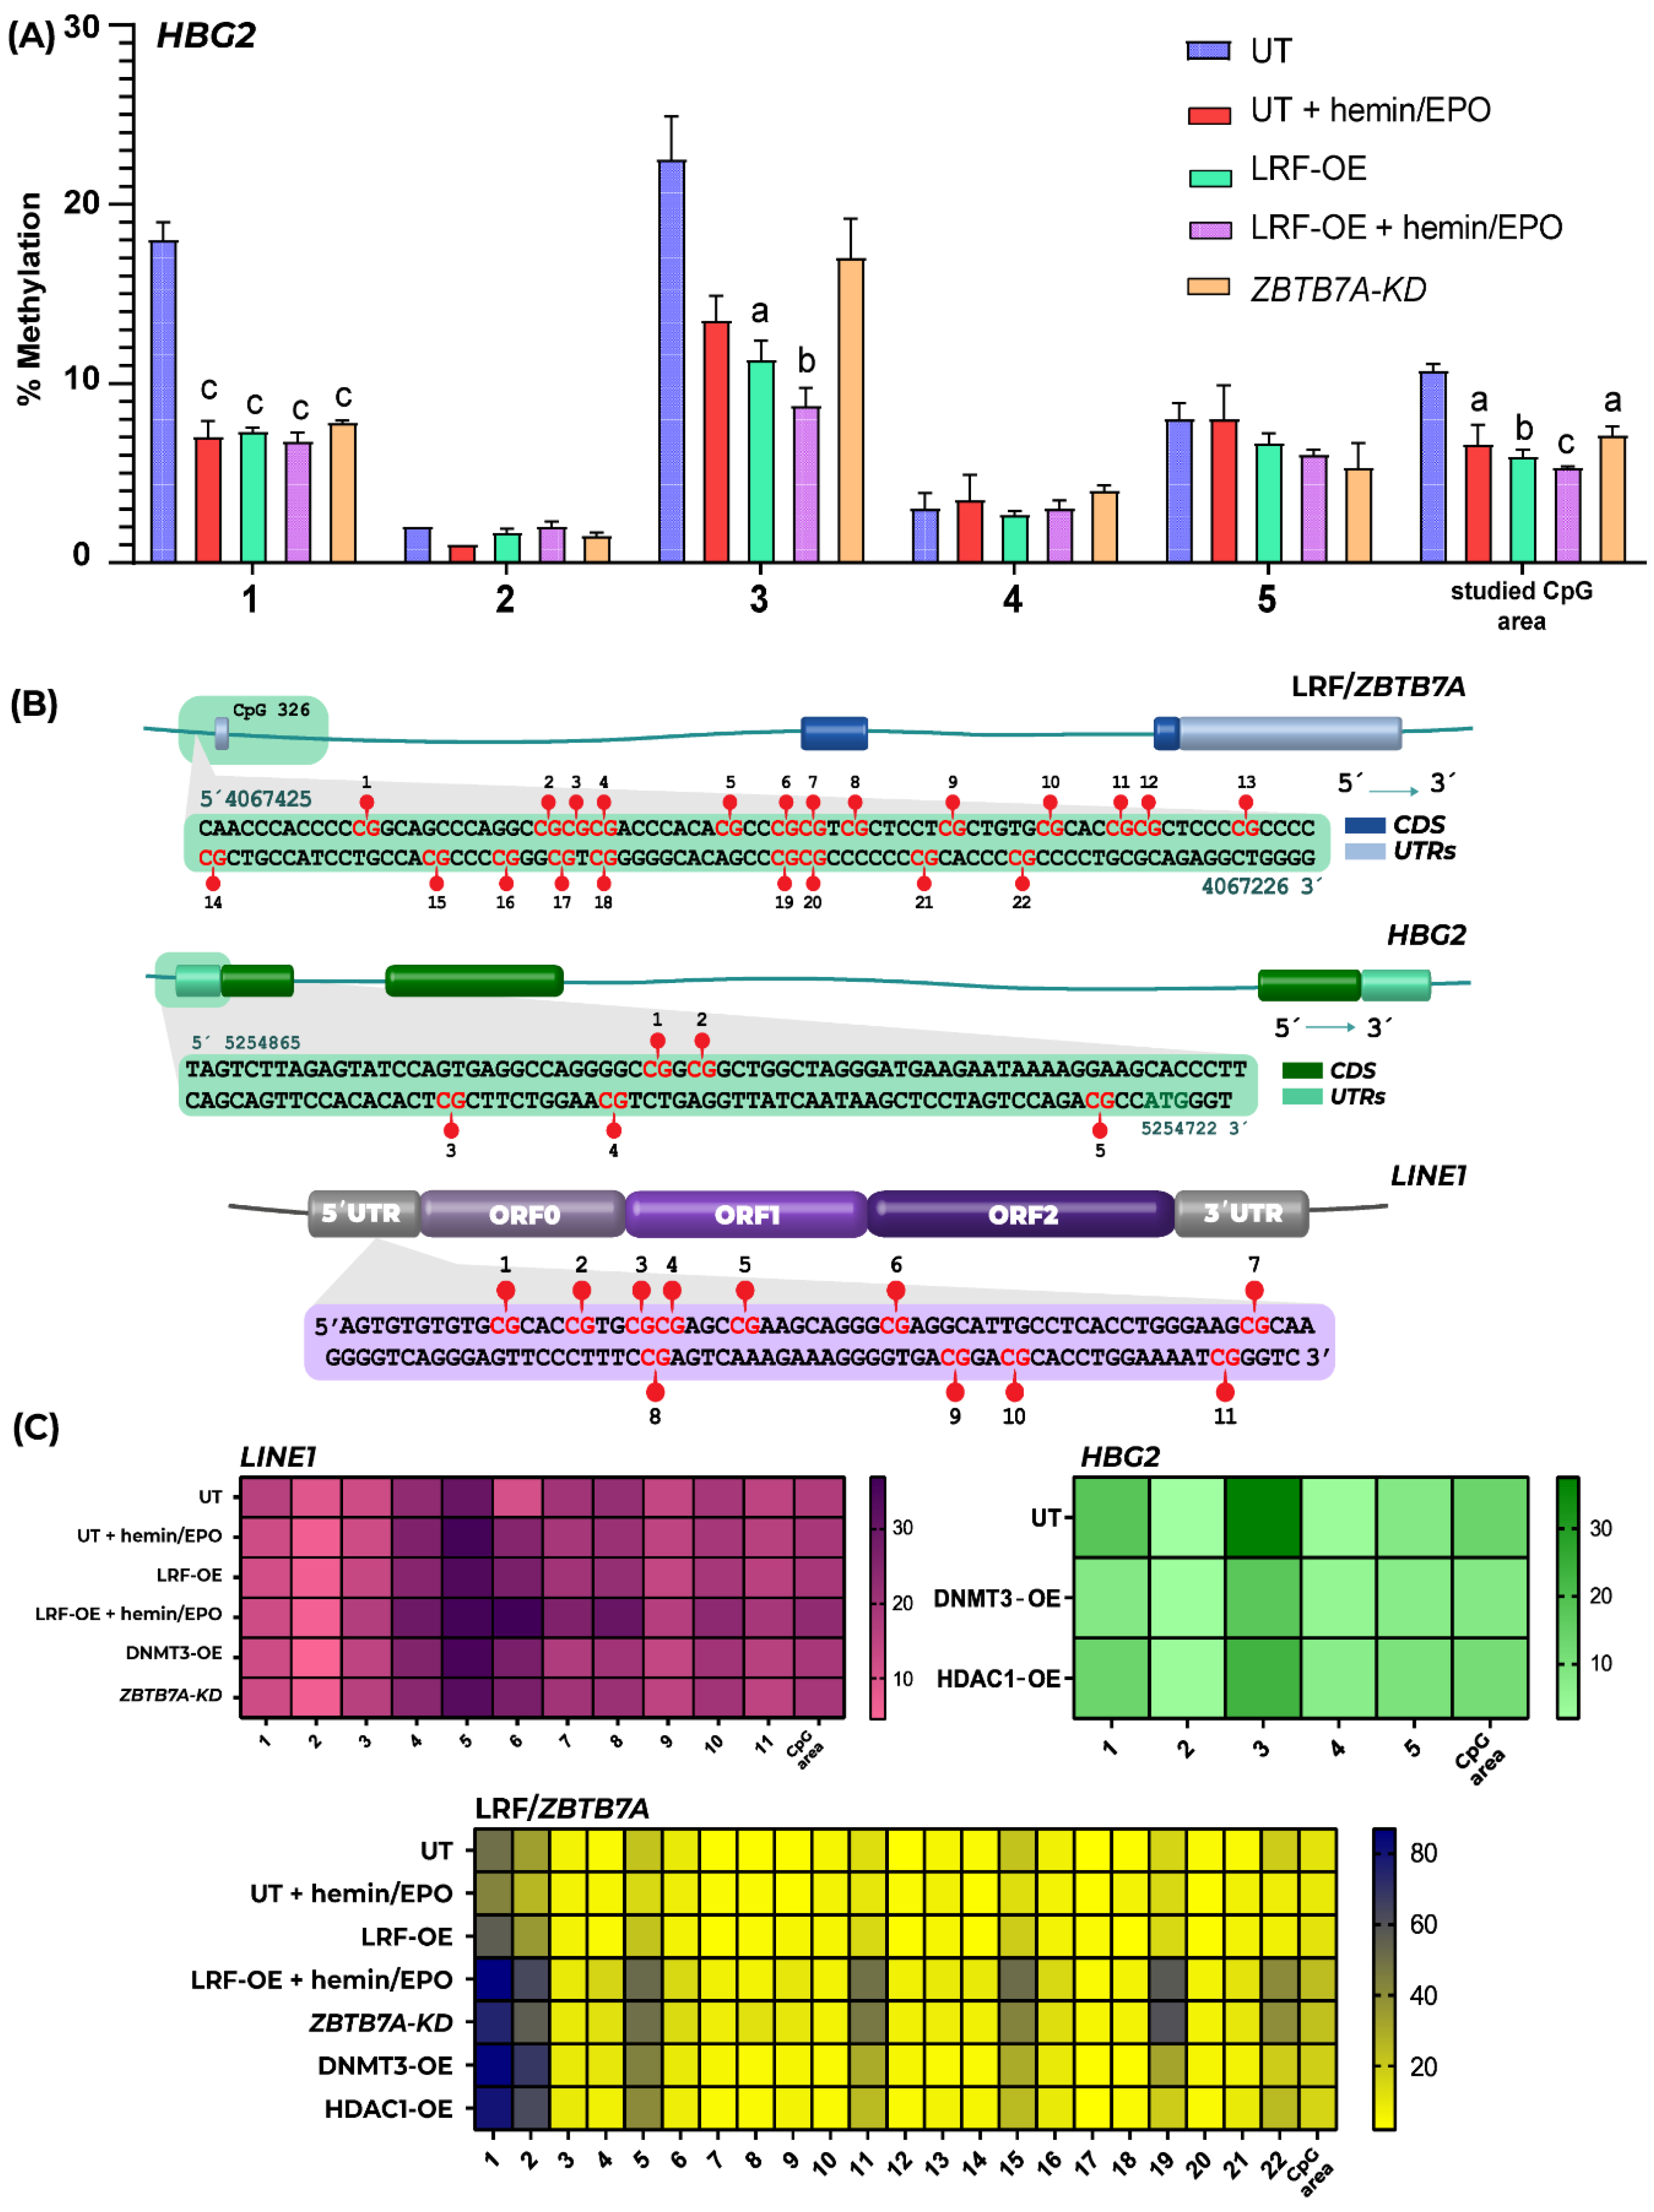
2.2. Epigenetic Events Promoted by Overexpression of DNMT3A and HDAC1 Leads to Insubstantial Changes in γ- and β-Globin Expression Levels

In an effort to evaluate LRF/ΖΒTB7A as an epigenetic reader we have produced transgenic K562 clones either expressing the core enzymatic center of the de novo acting DNA methyl-transferase DNMT3A or the ubiquity-expressed Histone Deacetylase HDAC1 and double expressing clones with DNMT3A and LRF/ΖΒTB7A. In mammals, DNA methyltransferase enzymes comprise of two parts: a large multidomain N-terminal part of variable size, which has regulatory functions, and a C terminal catalytic part. The N-terminal part of DNMT3A is followed by a proline-tryptophan-tryptophan-proline (PWWP) domain, an ATRX-DNMT3-DNMT3L-type zinc finger (ADD) domain, whereas the smaller C-terminal part, is common for all DNMTs and harbors the active center of the enzyme, which contains six highly conserved cytosine C5-DNA methyltransferase motifs [21,22]. Due to length restrictions and stability issues designated for the DNA sequence synthesis, we have constructed and cloned within the episomal vector only the C-terminal domain acquiring methyltransferase activity of DNMT3A. However, by this option, exogenous DNMT3A overexpression reflects the action of other DNA methyltransferases too, which share the same enzymatic active center and are responsible to perform de novo DNA methylation. HDAC1, the other epigenetic remodeler, removes acetyl-groups from the histone tails leading to more condensed chromatin conformation.
Transfected K562 clones were constantly cultivated for 2 months and studied under the prevailing frame of epigenetic instability, stimulated by the elevated expression levels of DNMT3 and HDAC1. DNMT3A and HDAC1 were upregulated by 6.9- and 4.6-fold respectively (Figure 1E). DNMT3A/LRF double transfected K562 clones unexpectedly overexpressed LRF but not DNMT3A, suggesting a possible overlap of the LRF function, covering DNMT3A. Thus, results derived from double-transfected clones will not be further discussed. DNA methylation profiles of genetic loci were assessed to confirm epigenetic disturbance and HBG2/1 and HBB expression were estimated in an attempt to study the hemoglobin expression profile during aberrant methylation across the genome.
In previous studies, ZBTB7A CpG island 326 has been indicated as a delicate sensor of DNA methylation and associated with the impaired pharmacological induction of HbF upon hydroxyurea treatment of β-hemoglobinopathies patients [13]. Additionally, repetitive sequences such as the Long Interspersed Nuclear Element-1 (LINE-1) repeats, are normally hypermethylated across the human genome to suppress their transcription and retrotransposition. LINE-1 represents almost 18% of the genome sequences and its methylation status has been suggested as a surrogate marker for estimating global DNA methylation [23]. Both genetic areas were analyzed in transfected K562 clones for divergent methylation profiles, utilizing targeted Pyrosequencing analysis. LINE-1 CpGs were hypomethylated in all experimental conditions tested, as in untransfected K562 cells (Figure 2B,C), indicating up-regulation of expression and capability of transposition throughout the genome, contributing to genomic instability, one of the hallmarks of cancer in general.
CpG 326 of ZBTB7A was significantly hypermethylated at positions CpG1, CpG2, CpG5, CpG11, CpG15, CpG19 and CpG22 (Figure 2B,C), under the influence of both epigenetic modifiers’ overexpression, either DNMT3A-OE or HDAC1-OE. HBG2 proximal promoter methylation levels were also evaluated and found unaltered compared to untransfected cells (Figure 2B). Epigenetic changes studied in transfected K562 genome were equivalent at both DNMT3A-OE and HDAC1-OE status.
Performed qPCRs revealed that HBG2/1, HBB and LRF/ZBTB7A expression levels were unaffected (Figure 1E). Results lead to the conclusion that the K562 genome hypermethylation in DNMT3-OE and HDAC1-OE clones was partially and selectively achieved, nevertheless there was not any remarkable impact observed on LRF/ZBTB7A, HBG2/1 and HBB expression, implying that epigenetic imbalance does not influence LRF’s function.

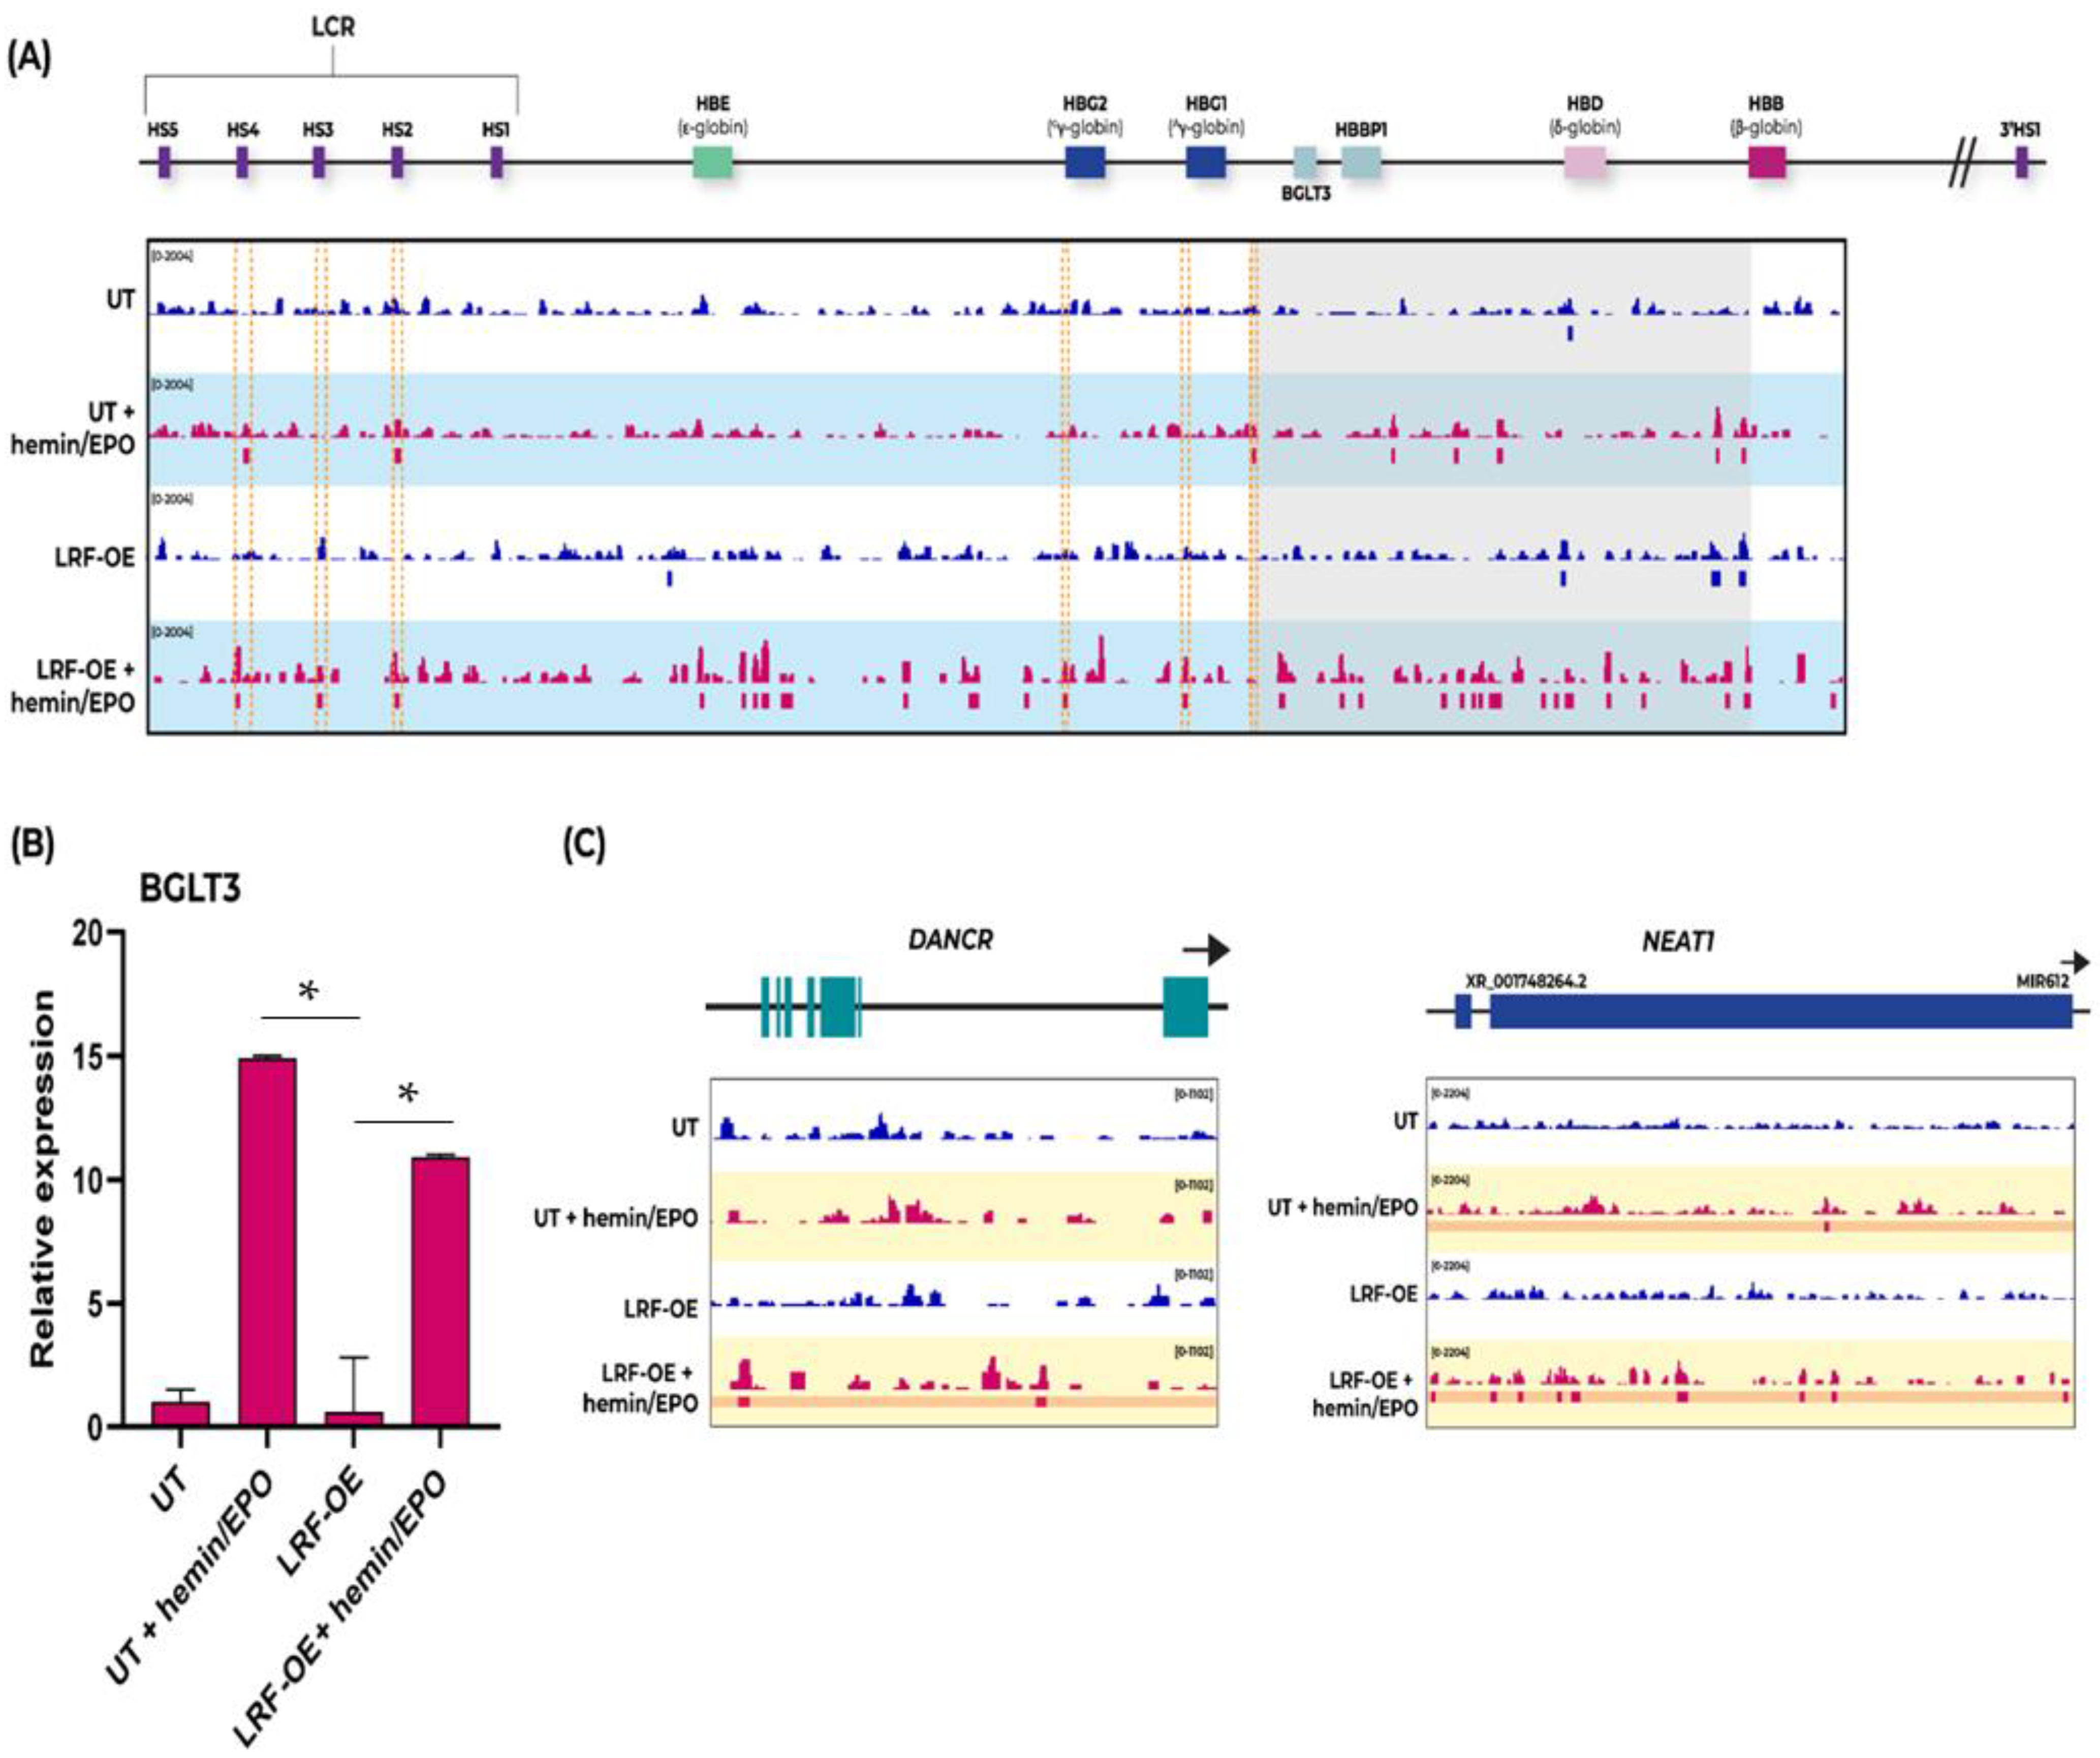
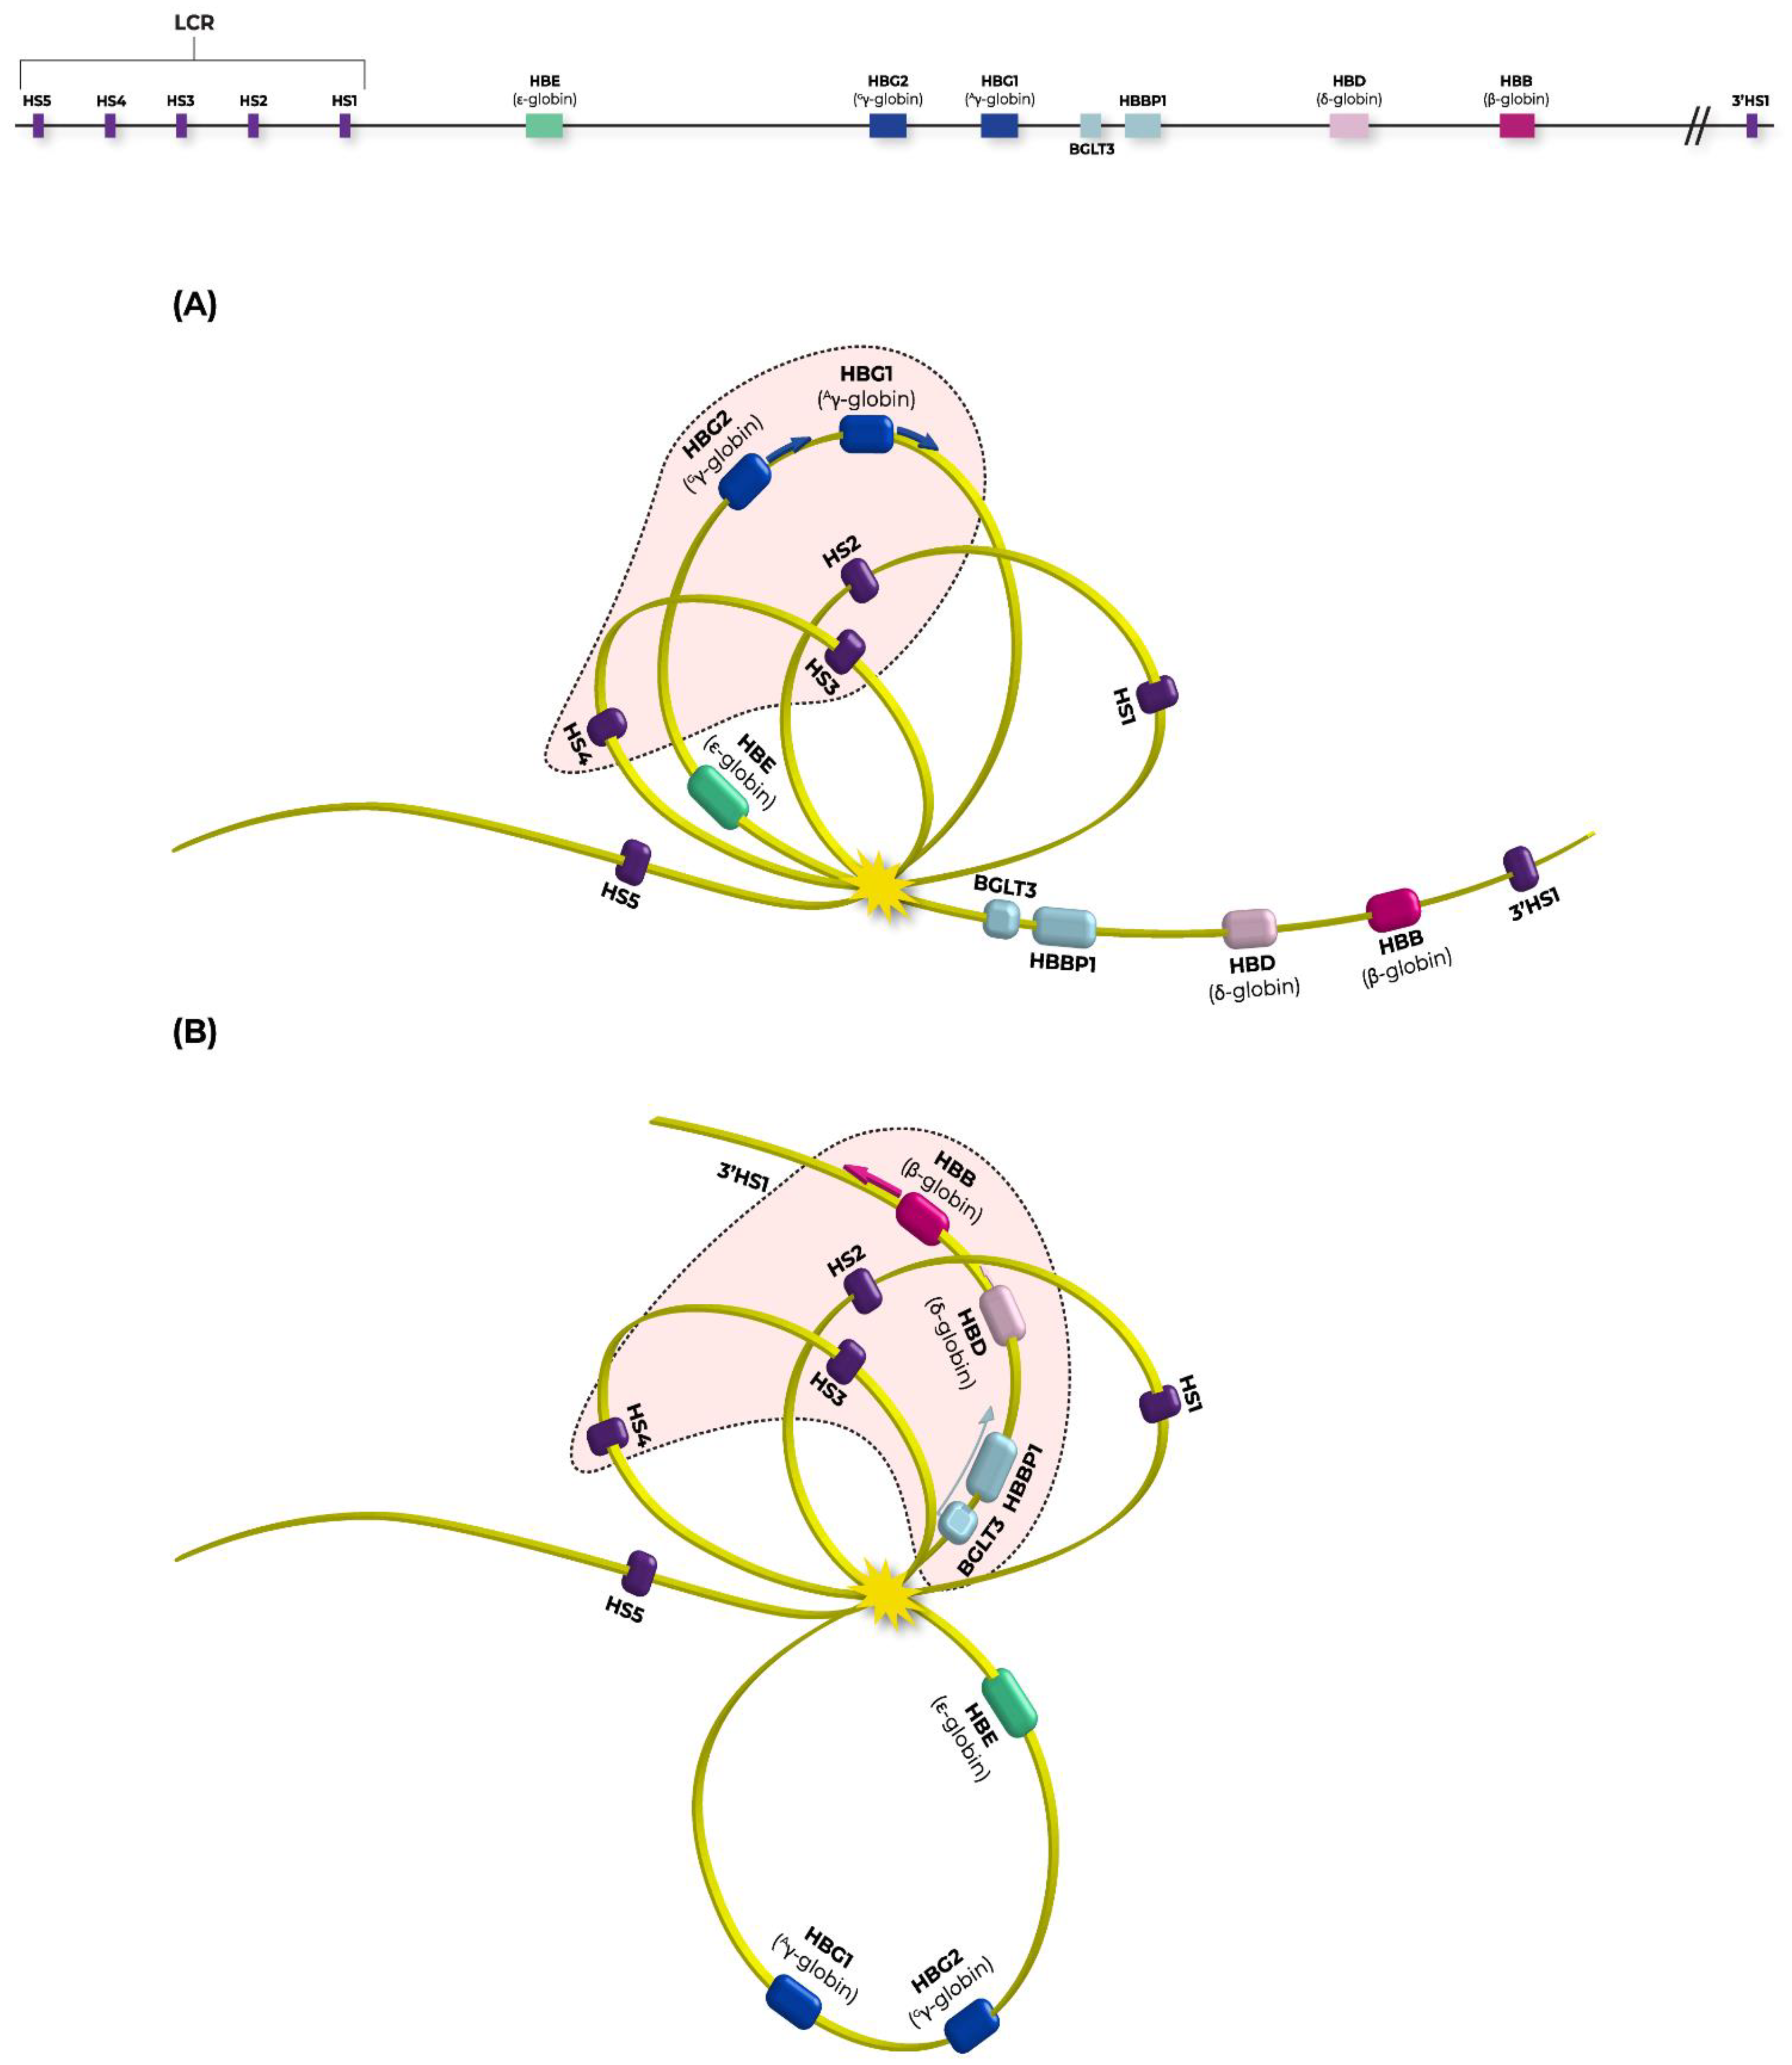
2.3. ChIP-Seq Analysis Reveals a Novel Function of LRF’s Regulatory Properties on BGLT3 Gene

To identify enriched loci with recognition binding sites for LRF within the K562 genome, the chromatin immunoprecipitation method with antibodies against LRF followed by the next generation sequencing of precipitated DNA fragments, was utilized. Untransfected and LRF-OE transfected clones were subjected to analysis pre- and post-erythropoiesis induction with hemin/EPO (four experimental conditions). To confirm the reliability of our results we have downloaded and compared a relevant ChIP-seq dataset from the Sequence Read Archive (SRA) (Accession number SRR6006200). To identify differentially LRF-enriched regions between experimental conditions and correlate our results to corresponding ChIP-seq data created by other research groups, read normalization was conducted to mitigate technical variance.
LRF was shown to be broadly distributed across the genome with a high rate of enriched regions, further increased upon erythropoiesis (hemin/EPO induction) (Figure 3A). Lengthwise, “HBB locus” LRF occupied fetal (HBG2/1) and BGLT3 genes with significant enrichment at post-erythropoiesis condition in untransfected and more evident in LRF-overexpressing K562 clones. Across βLCR, LRF signals were enriched at HS2 and HS4 (DNAse hypersensitive sites) in untransfected and at HS2, HS3 and HS4 in LRF-OE K562 cells, both during hemin/EPO induction. LRF-OE pre-hemin/EPO induction failed to highlight any LRF’s connection to βLCR. LRF-ChIP binding signals were extended to the adult HBB gene at post-erythropoiesis in untransfected and in both LRF-overexpressing clones (pre- and post-hemin/EPO induction). Observed LRF occupancy sites at HBG2/1 were adjacent to BCL11A [24], which can be considered as critical and necessary for the co-silencing of HBG2/1 genes. Moreover, LRF can potentially master BGLT3 gene’s up-regulation and as a consequence the enhancement of HBB expression in adults.
To evaluate BGLT3 expression during experimental conditions studied, we carried out qPCRs with sequence specific primer sets. BGLT3-lncRNA expression was evident only in hemin/EPO induced K562 clones (Figure 3B) at comparable values; 14.9-fold elevation in untransfected and 10.9-fold elevation in LRF-overexpressing clones, but not in LRF-OE pre-hemin/EPO induction, indicating that extra erythroid specific transcription factors’ participation and specific βLCR HSs activation are required for co-operation and full manifestation of this phenomenon. K562 cell erythroid differentiation after chemical induction is regulated by the Raf/MEK/ERK pathway and the transcription factor ETV6, a member of the transcription factor E-Twenty Six (ETS) family [25]. Both hemin and erythropoietin, administered to K562 cells in the present study, induce a rapid activation of the ERK pathway and hemoglobin production [26]. The profiling of hemin induced proteins in K562 has revealed a wide range of protein molecules involved in diverse activities, such regulators of intracellular trafficking, chaperones, modulators of mitochondrial multi-electron transfer in the respiratory chain, gene expression regulators, and members along signal transduction pathways etc. [27]. Nevertheless, the exogenous ZBTB7A gene lacks all upstream and downstream genomic regulatory regions responsible for cell signaling response, and as a consequence, the hemin/EPO induction process has no apparent effect on it. This is consistent with results of the study where comparable results from untransfected and LRF-overexpressing K562 clones post-hemin/EPO induction, were obtained.

3. Discussion

The present study attempted to highlight epigenetic issues related to the hemoglobin switch from fetal (HbF) to adult (HbA), and mainly the role of LRF/ZBTB7A as a potential epigenetic regulator of this process. According to the ChIP-seq analysis, LRF/ZBTB7A binds HBG2/1 promoter regions and immediately upstream of BGLT3 gene in K562 cells, mainly during hemin/EPO induction. LRF/ZBTB7A residence is upgraded in LRF-overexpressing and untransfected K562 cells post-hemin/EPO induction, the same as BGLT3-lncRNA expression (Figure 3A,B). Eventually, BGLT3-lncRNA expression and enhancement of specific DNAse hypersensitive sites (HSs) within LCR further stimulate the epigenetic events responsible for the activation of the downstream HBB promoter (Figure 1D). The consequent preferential HbA hemoglobin increase is apparently co-assisted by LRF and other structural and transcription partners, also induced by hemin/EPO treatment.
During the last weeks of gestation, fetal hemoglobin (HbF) is replaced by adult (HbA), a process known to be orchestrated by the BCL11A repressor function to HBG2/1 genes’ promoters. Apart from BCL11A, the γ-δ putative intergenic region upstream from HBD, encompassing the BGLT3 gene, has been strongly implicated to HBG2/1 silencing. This intergenic region is transcriptionally silent during the fetal stage and is also associated with high HbF levels (HPFH syndrome) in naturally occurring deletions detected in β-hemoglobinopathies patients, implying a strong potential of BGLT3-lncRNA expression to HBB induction [5,28]. Additionally, BGLT3-lncRNA production is induced by imatinib treatment in Bcr-Abl (translocation between chromosome 9 and 22, resulting in hybrid bcr-abl gene) positive K562 erythroleukemic cells and leads to apoptosis. Study by Guo et al., 2018, concluded that Bcr-Abl represents a BGLT3-lncRNA repressor probably acting through DNA hypermethylation of the region, leading to transcriptional silencing [29]. However, this notion was not proved by our methylation assays in overexpressing DNMT3A and HDAC1 K562 clones. BGLT3-lncRNA transcript elevation during hemoglobin switch reflects several other epigenetic modifications, additional to the already known pleiotropic activities of lncRNAs, such as chromatin remodeling, protein guidance to genomic loci via RNA-DNA interactions, transcription and RNA splicing [30,31,32]. We thus propose that during hemoglobin transversion from HbF to HbA, binding of BCL11A to HBG2/1 is a perquisite for HbF repression, but to accomplish full repress of HBG2/1 genes, LRF/ZBTB7A occupancy is required, too. Simultaneous binding of LRF at HBG2/1 and BGLT3 advances BCL11A’s suppression efficiency to HBG2/1 genes and the accessible conformation of downstream chromatin up to HBB by BGLT3-lncRNA expression enhancement (Figure 4). Results from qPCRs also manifested that HBB expression is advanced under the influence of high BGLT3-lncRNA expression, in an inverse manner rather than HBG2/1 expression (Figure 1D), despite HBG2’s hypomethylated status (Figure 2A), suggested as contributing to its transcriptional elevation.
Obstructed KLF1 function has been also associated with reduced levels of the γ-globin repressors, BCL11A and LRF/ZBTB7A and a reversal of the fetal globin genes’ expression [33,34,35]. Within the promoter region of ZBTB7A, are the KLF1 and GATA-1 binding sites, driving a favorable generation of a longer LRF/ZBTB7A transcript, comprising a 5′ prime-end extension and exclusively expressed during late erythroid differentiation [35]. However, since the exogenous ZBTB7A gene lacks KLF-1 and GATA-1 binding capacity, the enhancement upon hemin/EPO treatment derives only from the endogenous ZBTB7A gene, which explains the analogous imprinted results from LRF-overexpressing and untransfected K562.
So far, active β-type globin promoters are suggested to form 4D chromatin configurations, such as loops with βLCR tissue-specific enhancer and engagement of transcription factors, accomplishing operative networks to promote spatiotemporal transcriptional programs during distinct developmental stages. Genes in general tend to restrict their contacts with enhancers within the same TAD (Topologically Associating Domains) [36], whereas CTCF (CCCTC-binding factor) [37] has been considered as a mediator of embedding chromosomal loops in the framework of TADs and/or insulators, setting a barrier between active genes. CTCF sites are enriched in TADs’ borders, further supporting this role [38]. Inter-TADs are discrete domains within a TAD, potentially formed by chromatin S/MARs (Scaffold/Matrix Attachment Regions), which lack sequence conservation, but are regarded as anchor sequences of chromosomes to the nuclear matrix [39,40]. S/MARs are signatured by AT- or TG- rich sequences and curved DNA, with a median length ≤2 kb, usually possessing origin of replication (OriC) features. The median length of the formed chromatin loops by S/MARs is ≤31 kb [41,42,43], a considerably smaller scale than TADs, particularly of the HBB locus, which is composed of almost 300 kb [44]. Lengthwise, within the human HBB locus, four MAR elements are predicted [45] and suggested to cooperate at several developmental stages of the fetus by recruiting in a preset order: HBE, HBG2 and HBG1 and finally HBB promoters to LCR, leading to a dominant expression of a different hemoglobin at each stage. Looping models between LCR and globin genes’ promoters have long been proposed and further expanded under new enlightened data derived from current techniques [24,46].
The proposed looping model derived from the present study (Figure 4) is in consistency with recently published models and combines all basic factors influencing HbF transversion to HbA [24,43]. Additionally, this clarifies the characterization of LRF/ΖΒΤΒ7A as an indirect epigenetic modifier factor with an evolving role in lncRNAs’ regulation of expression. Further evidence for LRF’s regulatory properties on lncRNAs is established from its designated occupancy sites at 5′ prime-ends of DANCR and NEAT1 lncRNA genes, suggested to have an involvement in erythropoiesis [47,48], which is obtained from the ChIP-seq analyses (Figure 3C).
Conclusively, it is apparent that LRF/ZBTB7A has an emerging role as an indirect chromatin modulator during the HbF to HbA switch. The “HBB locus”, including the tissue-specific LCR enhancer, is highly enriched with LRF/ZBTB7A recognition sites, which vary in potency during erythropoiesis and are not affected by variations in genome methylation levels. LRF certainly binds and potentially co-silences HBG2/1 with the BCL11A transcription factor, but also enables BGLT3-lncRNA and apparently other erythroid specific lncRNAs’ expression, triggering HbF to HbA transversion in the adult stage of erythropoiesis.

4. Materials and Methods

4.1. Cell Culture

Human K562 erythroleukemia cells were cultured in Dulbecco’s Modified Eagle Medium (DMEM, Sigma), supplemented with 10% fetal bovine serum (FBS, Gibco—Thermo Fisher Scientific Inc., Grand Island, NE, USA), 100 units/mL penicillin and 100 μg/mL streptomycin (Sigma -Aldrich Pty Ltd, An affiliate of Merck KGaA, Darmstadt, Germany) in a humidified atmosphere at 37 °C and 5% CO2. They were passaged every 2 days. Erythroid differentiation was induced by treatment with 30 μΜ hemin (AppliChem GmbH, Darmstadt, Germany) and 5 ng/mL erythropoietin (EPO) (Cell signaling) for 3 h at 37 °C and 5% CO2 [49,50]. Cell viability was evaluated using 0.4% trypan blue stain (Fluorochem, Hadfield, UK). Total hemoglobin pre- and post-induction was obtained by Benzidine staining [51]. K562 transfections were carried out with Lipofectamine® 3000 (Invitrogen- Thermo Fisher Scientific Inc., Grand Island, NE, USA) according to manufacturer’s protocol, and transgenic clones were selected by 800 μg/mL of Geneticin (G418) (Gibco—Thermo Fisher Scientific Inc., Grand Island, NE, USA) or 6 μg/mL puromycin for CRISPR/Cas9. Long-term expression of the reporter gene eGFP in transfected cells was detected by fluorescence microscopy (LEICA Microsystems, Heerbrugg, Switzerland), confirming exogenous genes’ sustainable existence.

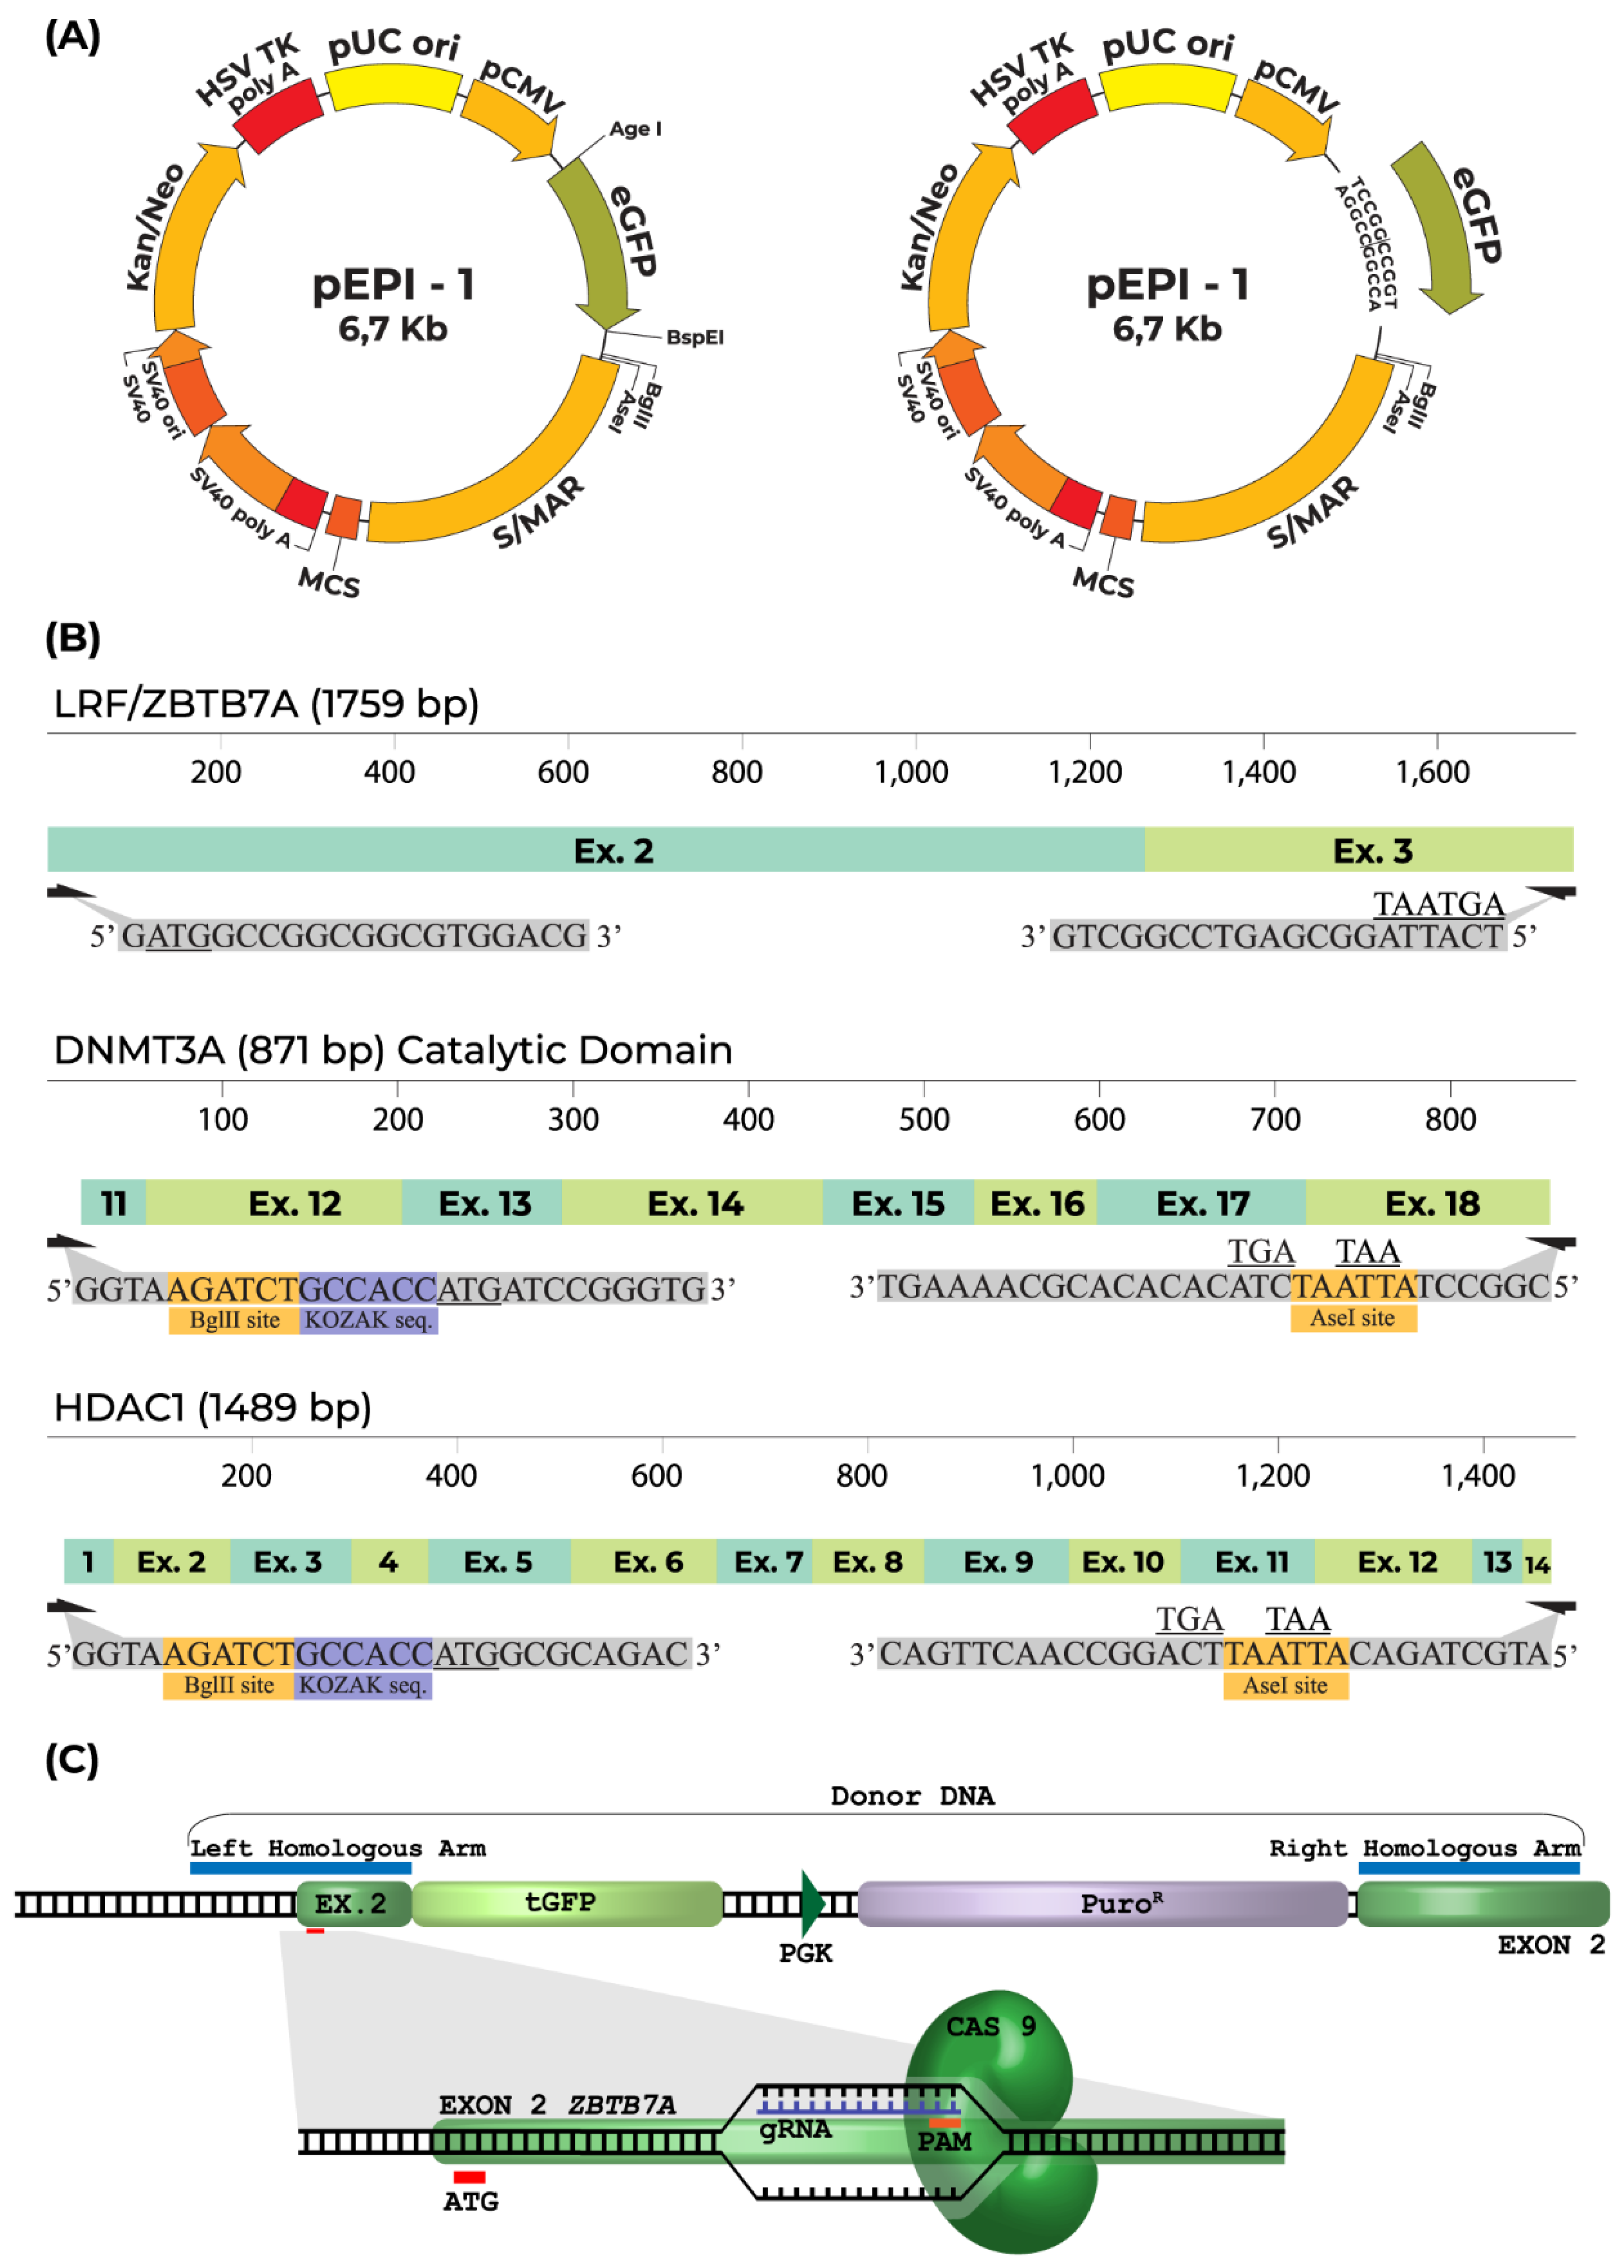
4.2. Plasmid Construction

DNA genomic sequences of LRF/ZBTB7A (1759 bp), DNMT3A (871 bp) and HDAC1 (1489 bp) were synthesized by IDT (Integrated DNA Technologies, Coralville, IA, USA). LRF/ZBTB7A and HDAC1 encompassed the protein coding transcripts NM_015898.4, and NM_004964.3, respectively. To minimize the length of the DNMT3A gene and favor its insertion in the vector, only the enzymatic center of the coding sequence was synthesized. The LRF/ZBTB7A sequence was ligated into the BspEI restriction site of pEPI-1 episomal expression vector, immediately downstream of the eGFP reporter gene. pEPI-1 includes a functional S/MAR element resulting in successful episomal replication and prolonged retention of the exogenous genes in the nucleus, despite continuous cell mitosis [52]. Before ligation, the linear episomal vector was blunt-ended by the Klenow fragment of DNA polymerase (New England Biolabs GmbH, Frankfurt, Germany), and dephosphorylated with Antarctic Phosphatase (New England Biolabs GmbH, Frankfurt, Germany). After initial transfections of K562 cells with LRF/ZBTB7A-eGFP construct, the eGFP (700 bp) was deleted with double digestion (AgeI and BspEI), followed by Klenow treatment to form blunt ends, which were re-ligated with T4 DNA ligase (New England Biolabs GmbH, Frankfurt, Germany). HDAC1 and the catalytic domain of DNMT3 were inserted into the episomal vector (with abolished eGFP) as BglII-AseI fragments at relevant sites of the vector. All exogenous genes were flanked by the Kozak consensus sequence (GCCACC) upstream first translation codon and two stop codons at the end of coding sequence (Figure 5A,B). Primer sets utilized in episomal vectors’ construction are listed in Table 1.

4.3. LRF/ZBTB7A Knockout Using CRISPR/Cas9 System

The CRISPR (clustered regularly interspaced short palindromic repeats)/Cas9 gene editing technology was used through the homology-directed repair mechanism to knockout the LRF/ZBTB7A gene’s expression in K562 cells. Two guide-RNAs (KN222759G1: 5′ AGGATGTCGCTGCTGTGGTC 3′, KN222759G2: 5′ GTGCGACGTGGTGATCCTGG 3′) were designed targeting the second exon of LRF/ZBTB7A transcript (NM_015898.4). The donor DNA consisted of a left and a right homologous arm (LHA and RHA) flanking a functional cassette, encoding for the green- fluorescent reporter protein (tGFP) and the puromycin resistance gene (OriGene Technologies, Inc., Rockville, MD, USA) (Figure 5C).

4.4. RT-qPCR

Total RNA was extracted from cultivated (untransfected and transfected) K562 clones using the RNeasy Mini kit (74104, Qiagen GmbH, Hilden, Germany) according to the manufacturer’s instructions. 1 μg of total RNA was subjected to cDNA synthesis with the Quantitect Reverse transcription kit (205,311, Qiagen GmbH, Hilden, Germany). Gene’s expression analysis was performed with specific primers sets (Table 1) and qPCR reactions were carried out in ECO Real-Time PCR system (Illumina, CA, USA) using the SsoFast Eva Green SuperMix (Biorad, CA, USA). All reactions were run in triplicates in at least two independent experiments. The 2−ΔΔCT method or Pfaffl equation with PCR efficiency correction was used for data analysis [53]. Fold changes in gene expression were normalized to GAPDH reference gene and relative to the calibrator sample (untransfected K562).

4.5. Chromatin Immunoprecipitation

ChIP assay was performed using Protein A/G PLUS Agarose (Santa Cruz Biotechnology, Inc., Heidelberg, Germany) according to the Santa Cruz Biotechnology protocol. 2 × 10⁷ cells from studied experimental conditions were cross-linked with 1% formaldehyde. After quenching and cell lysis, chromatin was sonicated with a LABSONIC M sonicator (Sartorius, Göttingen, Germany) to generate 150–300 bp DNA fragments. The polyclonal rabbit anti-ZBTB7A antibody (abcam) was utilized in immunoprecipitation reactions and the rabbit serum IgG fraction (I5006, Sigma-Aldrich Pty Ltd, An affiliate of Merck KGaA, Darmstadt, Germany) as negative control. After reverse crosslinking at 65 °C, immunoprecipitated DNA was recovered/purified via phenol/chloroform extraction and ethanol precipitation. Linear acrylamide (Invitrogen-Thermo Fisher Scientific Inc., Grand Island, NE, USA) was used for pellet visualization and for increasing the precipitation efficiency.

4.6. ChIP-Seq Library Construction and Next-Generation Sequencing

Library preparation from ChIP-isolated DNA was performed using the Ion Xpress™ Plus Fragment Kit and the Ion Xpress™ Barcode Adapters 1–16 Kit (both from ThermoFischer Scientific Inc., Grand Island, NE, USA). The protocol for 200 bp read-length libraries and for 50–100 ng input DNA was employed with some modifications. Due to the small amount of input DNA (10 ng), and to avoid adapter concatamerization, 1 μL of P1 adapter and IonXpress™ Barcodes was used instead of 2 μL. Adapter ligation and dual bead size selection for 200 bp read length fragments was performed using AMPure XP beads, followed by separation on magnetic rack, two ethanol washes and a final elution of DNA fragments in 25 μL Low TE. The size selected libraries were then amplified for 16 cycles. The quality was assessed on the Bioanalyzer 2100 (Agilent Technologies, Santa Clara, CA, USA) using a High Sensitivity DNA ChIP (Agilent Technologies, Santa Clara, CA, USA), and quantified via qPCR using the KAPA Library Quantification Kit for Ion Torrent™ [54]. Template preparation and chip loading prior to sequencing was performed on the Ion Chef system using the Ion 540™ Chef kit and an Ion 540™ chip. The loaded chip was then sequenced on an Ion GeneStudio S5 sequencer.

4.7. Analysis, Peak Calling and Visualization of ChIP-Seq Data

For downstream analysis, the sequencing data were uploaded to the Galaxy web platform through the usegalaxy.eu public server [55]. The datasets were mapped to hg38 using Bowtie2 with the—very-sensitive-local preset [56]. BigWig files used for visualisation of ChIP-seq data were created using the deeptools bamCoverage function with the following parameters—outFileFormat ‘bigwig’—binSize 1—normalizeUsing RPKM. The initial alignments that include redundant alignments were used to generate the bigWig files, to account for the high degree of sequence duplication within the HBB locus that can mask LRF/ZBTB7A occupancy. All datasets were visualised in IGV v2.12.2. For peak calling, only the non-redundant alignments from each BAM dataset were used (number of non-redundant alignments >5,652,842) and were compared to the negative (rabbit) IgG control via MACS2 callpeak with the following parameters—gsize ‘2,700,000,000’—p value ‘0.05’—bw ‘190’ [57]. The Intersect tool was used to identify peaks located in close proximity to genes (−2000 to +10,000 bps relative to the transcription start site). All raw sequencing data and bigwig files are available at the GEO Repository under the Accession Number GSE200135 (https://www.ncbi.nlm.nih.gov/geo/query/acc.cgi?acc=GSE200135 accessed on 24 May 2022).

4.8. Methylation Analysis/Pyrosequencing

DNA methylation was assessed at genomic DNA extracted from K562 cultivated cells using phenol: chloroform: isoamyl acid in 25:24:1 ratio (Sigma-Aldrich Pty Ltd, An affiliate of Merck KGaA, Darmstadt, Germany), according to standard protocols [58]. 1.5 μg of isolated genomic DNA was treated with EpiTech® Bisulfite Kit (QIAGEN GmbH, Hilden, Germany) and bisulfite converted DNA was then used as a template for amplification of regions of interest with PyroMark® PCR Kit (QIAGEN GmbH, Hilden, Germany). PCR products (biotinylated strand) were immobilized with streptavidin-coated sepharose beads (Streptavidin Sepharose™ High Performance, GE HealthCare) and annealed with a Pyrosequencing primer. Reactions were performed in the PyroMark Q24 instrument using PyroMark® Gold Q24 Reagents (QIAGEN GmbH, Hilden, Germany), according to the manufacturer’s instructions. Primer sets are listed at Table 1. Every pyrosequencing reaction was performed in duplicate.

4.9. Statistical Analysis

SPSS software version 20.0 was used for data analysis via one-way ANOVA with Bonferroni or Tukey’s multiple comparisons post hoc tests. Results are presented as mean ± SE of at least two biological replicates. Normal distribution of data was assessed by the Shapiro-Wilk test. The p values < 0.05 were considered statistically significant.

Author Contributions

V.C., G.P., K.A., E.I., A.D. and A.S. performed cloning, cell cultures and transfections, DNA and RNA isolation and cDNA synthesis; K.A. and V.C. performed qPCRs and Pyrosequencing assays; A.-N.S. and V.C. performed ChIP-seq experiment and ANS with supervision of C.S. analyzed the results; G.P. and V.C. edited all figures; A.S. supervised the study, analyzed data and wrote the manuscript, A.S. with V.C. conceived this project; C.S. revised the manuscript. All authors have read and agreed to the published version of the manuscript.

Funding

Vasiliki Chondrou is co-financed by Greece and the European Union (European Social Fund-ESF) through the Operational Programme «Human Resources Development, Education and Lifelong Learning» in the context of the project “Reinforcement of Postdoctoral Researchers—2nd Cycle” (MIS-5033021), implemented by the State Scholarships Foundation (ΙΚΥ) and Katerina Athanasopoulou was financially supported by the 80250 (ELKE_EAP) grant of the Hellenic Open University.

Institutional Review Board Statement

Not applicable.

Informed Consent Statement

Not applicable.

Data Availability Statement

Not applicable.

Conflicts of Interest

The authors declare no conflict of interest.

References

  1. Giardine, B.; Borg, J.; Viennas, E.; Pavlidis, C.; Moradkhani, K.; Joly, P.; Bartsakoulia, M.; Riemer, C.; Miller, W.; Tzimas, G.; et al. Updates of the HbVar database of human hemoglobin variants and thalassemia mutations. Nucleic Acids Res. 2014, 42, D1063–D1069. [Google Scholar] [CrossRef] [PubMed]
  2. Bianchi, N.; Zuccato, C.; Finotti, A.; Lampronti, I.; Borgatti, M.; Gambari, R. Involvement of miRNA in erythroid differentiation. Epigenomics 2012, 4, 51–65. [Google Scholar] [CrossRef] [PubMed]
  3. Deng, W.; Rupon, J.W.; Krivega, I.; Breda, L.; Motta, I.; Jahn, K.S.; Reik, A.; Gregory, P.D.; Rivella, S.; Dean, A.; et al. Reactivation of developmentally silenced globin genes by forced chromatin looping. Cell 2014, 158, 849–860. [Google Scholar] [CrossRef] [PubMed] [Green Version]
  4. Liu, X.; Chen, Y.; Zhang, Y.; Liu, Y.; Liu, N.; Botten, G.A.; Cao, H.; Orkin, S.H.; Zhang, M.Q.; Xu, J. Multiplexed capture of spatial configuration and temporal dynamics of locus-specific 3D chromatin by biotinylated dCas9. Genome Biol. 2020, 21, 59. [Google Scholar] [CrossRef] [Green Version]
  5. Sankaran, V.G.; Xu, J.; Byron, R.; Greisman, H.A.; Fisher, C.; Weatherall, D.J.; Sabath, D.E.; Groudine, M.; Orkin, S.H.; Premawardhena, A.; et al. A functional element necessary for fetal hemoglobin silencing. N. Engl. J. Med. 2011, 365, 807–814. [Google Scholar] [CrossRef] [Green Version]
  6. Lulli, V.; Romania, P.; Morsilli, O.; Cianciulli, P.; Gabbianelli, M.; Testa, U.; Giuliani, A.; Marziali, G. MicroRNA-486-3p regulates gamma-globin expression in human erythroid cells by directly modulating BCL11A. PLoS ONE 2013, 8, e60436. [Google Scholar] [CrossRef] [Green Version]
  7. Masuda, T.; Wang, X.; Maeda, M.; Canver, M.C.; Sher, F.; Funnell, A.P.; Fisher, C.; Suciu, M.; Martyn, G.E.; Norton, L.J.; et al. Transcription factors LRF and BCL11A independently repress expression of fetal hemoglobin. Science 2016, 351, 285–289. [Google Scholar] [CrossRef] [Green Version]
  8. Ivaldi, M.S.; Diaz, L.F.; Chakalova, L.; Lee, J.; Krivega, I.; Dean, A. Fetal gamma-globin genes are regulated by the BGLT3 long noncoding RNA locus. Blood 2018, 132, 1963–1973. [Google Scholar] [CrossRef] [Green Version]
  9. Liu, N.; Xu, S.; Yao, Q.; Zhu, Q.; Kai, Y.; Hsu, J.Y.; Sakon, P.; Pinello, L.; Yuan, G.C.; Bauer, D.E.; et al. Transcription factor competition at the gamma-globin promoters controls hemoglobin switching. Nat. Genet. 2021, 53, 511–520. [Google Scholar] [CrossRef]
  10. Bianchi, N.; Zuccato, C.; Lampronti, I.; Borgatti, M.; Gambari, R. Fetal Hemoglobin Inducers from the Natural World: A Novel Approach for Identification of Drugs for the Treatment of β-Thalassemia and Sickle-Cell Anemia. Evid. Based Complement. Altern. Med. 2009, 6, 141–151. [Google Scholar] [CrossRef] [Green Version]
  11. Musallam, K.M.; Taher, A.T.; Cappellini, M.D.; Sankaran, V.G. Clinical experience with fetal hemoglobin induction therapy in patients with beta-thalassemia. Blood 2013, 121, 2199–2212; quiz 2372. [Google Scholar] [CrossRef] [PubMed] [Green Version]
  12. Thompson, R.B.; Mitchener, J.W.; Huisman, T.H. Studies on the fetal hemoglobin in the persistent high Hb-F anomaly. Blood 1961, 18, 267–284. [Google Scholar] [CrossRef] [PubMed]
  13. Chondrou, V.; Stavrou, E.F.; Markopoulos, G.; Kouraklis-Symeonidis, A.; Fotopoulos, V.; Symeonidis, A.; Vlachaki, E.; Chalkia, P.; Patrinos, G.P.; Papachatzopoulou, A.; et al. Impact of ZBTB7A hypomethylation and expression patterns on treatment response to hydroxyurea. Hum. Genom. 2018, 12, 45. [Google Scholar] [CrossRef] [PubMed]
  14. Chumchuen, S.; Pornsukjantra, T.; Khamphikham, P.; Anurathapan, U.; Sripichai, O.; Songdej, D.; Hongeng, S. Downregulation of Transcription Factor LRF/ZBTB7A Increases Fetal Hemoglobin Expression in β-Thalassemia/Hemoglobin E Erythroid Cells. Blood 2019, 134 (Suppl. S1), 3549. [Google Scholar] [CrossRef]
  15. Fibach, E.; Kollia, P.; Schechter, A.N.; Noguchi, C.T.; Rodgers, G.P. Hemin-induced acceleration of hemoglobin production in immature cultured erythroid cells: Preferential enhancement of fetal hemoglobin. Blood 1995, 85, 2967–2974. [Google Scholar] [CrossRef]
  16. Green, A.R.; Rockman, S.; DeLuca, E.; Begley, C.G. Induced myeloid differentiation of K562 cells with downregulation of erythroid and megakaryocytic transcription factors: A novel experimental model for hemopoietic lineage restriction. Exp. Hematol. 1993, 21, 525–531. [Google Scholar]
  17. Naumann, S.; Reutzel, D.; Speicher, M.; Decker, H.J. Complete karyotype characterization of the K562 cell line by combined application of G-banding, multiplex-fluorescence in situ hybridization, fluorescence in situ hybridization, and comparative genomic hybridization. Leuk. Res. 2001, 25, 313–322. [Google Scholar] [CrossRef]
  18. Sasaki, D.; Kosunago, S.; Mikami, T.; Matsumoto, T.; Suzuki, M. Growth-inhibition by hemin in K562 human leukemic cells is related to hemoglobin-producing activity. Biol. Pharm. Bull. 1994, 17, 586–590. [Google Scholar] [CrossRef] [Green Version]
  19. Finotti, A.; Gasparello, J.; Breveglieri, G.; Cosenza, L.C.; Montagner, G.; Bresciani, A.; Altamura, S.; Bianchi, N.; Martini, E.; Gallerani, E.; et al. Development and characterization of K562 cell clones expressing BCL11A-XL: Decreased hemoglobin production with fetal hemoglobin inducers and its rescue with mithramycin. Exp. Hematol. 2015, 43, 1062–1071.e3. [Google Scholar] [CrossRef] [Green Version]
  20. Lessard, S.; Beaudoin, M.; Benkirane, K.; Lettre, G. Comparison of DNA methylation profiles in human fetal and adult red blood cell progenitors. Genome Med. 2015, 7, 1. [Google Scholar] [CrossRef] [Green Version]
  21. Cheng, X.; Hashimoto, H.; Horton, J.R.; Zhang, X. Chapter 2—Mechanisms of DNA Methylation, Methyl-CpG Recognition, and Demethylation in Mammals. In Handbook of Epigenetics; Tollefsbol, T., Ed.; Academic Press: San Diego, CA, USA, 2011; pp. 9–24. [Google Scholar]
  22. Ren, W.; Gao, L.; Song, J. Structural Basis of DNMT1 and DNMT3A-Mediated DNA Methylation. Genes 2018, 9, 620. [Google Scholar] [CrossRef] [PubMed] [Green Version]
  23. Woo, H.D.; Kim, J. Global DNA hypomethylation in peripheral blood leukocytes as a biomarker for cancer risk: A meta-analysis. PLoS ONE 2012, 7, e34615. [Google Scholar] [CrossRef] [PubMed]
  24. Shen, Y.; Verboon, J.M.; Zhang, Y.; Liu, N.; Kim, Y.J.; Marglous, S.; Nandakumar, S.K.; Voit, R.A.; Fiorini, C.; Ejaz, A.; et al. A unified model of human hemoglobin switching through single-cell genome editing. Nat. Commun. 2021, 12, 4991. [Google Scholar] [CrossRef] [PubMed]
  25. Li, Z.; Sun, M.Z.; Lv, X.; Guo, C.; Liu, S. ETV6 Regulates Hemin-Induced Erythroid Differentiation of K562 Cells through Mediating the Raf/MEK/ERK Pathway. Biol. Pharm. Bull. 2022, 45, 250–259. [Google Scholar] [CrossRef] [PubMed]
  26. Woessmann, W.; Zwanzger, D.; Borkhardt, A. ERK signaling pathway is differentially involved in erythroid differentiation of K562 cells depending on time and the inducing agent. Cell Biol. Int. 2004, 28, 403–410. [Google Scholar] [CrossRef]
  27. Tsolaki, V.C.; Georgiou-Siafis, S.K.; Tsamadou, A.I.; Tsiftsoglou, S.A.; Samiotaki, M.; Panayotou, G.; Tsiftsoglou, A.S. Hemin accumulation and identification of a heme-binding protein clan in K562 cells by proteomic and computational analysis. J. Cell. Physiol. 2022, 237, 1315–1340. [Google Scholar] [CrossRef] [PubMed]
  28. Antoniani, C.; Meneghini, V.; Lattanzi, A.; Felix, T.; Romano, O.; Magrin, E.; Weber, L.; Pavani, G.; El Hoss, S.; Kurita, R.; et al. Induction of fetal hemoglobin synthesis by CRISPR/Cas9-mediated editing of the human beta-globin locus. Blood 2018, 131, 1960–1973. [Google Scholar] [CrossRef] [Green Version]
  29. Guo, G.; Kang, Q.; Zhu, X.; Chen, Q.; Wang, X.; Chen, Y.; Ouyang, J.; Zhang, L.; Tan, H.; Chen, R.; et al. A long noncoding RNA critically regulates Bcr-Abl-mediated cellular transformation by acting as a competitive endogenous RNA. Oncogene 2015, 34, 1768–1779. [Google Scholar] [CrossRef]
  30. Rinn, J.L.; Kertesz, M.; Wang, J.K.; Squazzo, S.L.; Xu, X.; Brugmann, S.A.; Goodnough, L.H.; Helms, J.A.; Farnham, P.J.; Segal, E.; et al. Functional demarcation of active and silent chromatin domains in human HOX loci by noncoding RNAs. Cell 2007, 129, 1311–1323. [Google Scholar] [CrossRef] [Green Version]
  31. Rinn, J.L.; Chang, H.Y. Genome regulation by long noncoding RNAs. Annu. Rev. Biochem. 2012, 81, 145–166. [Google Scholar] [CrossRef] [Green Version]
  32. Kopp, F.; Mendell, J.T. Functional Classification and Experimental Dissection of Long Noncoding RNAs. Cell 2018, 172, 393–407. [Google Scholar] [CrossRef] [PubMed] [Green Version]
  33. Zhou, D.; Liu, K.; Sun, C.W.; Pawlik, K.M.; Townes, T.M. KLF1 regulates BCL11A expression and gamma- to beta-globin gene switching. Nat. Genet. 2010, 42, 742–744. [Google Scholar] [CrossRef] [PubMed]
  34. Borg, J.; Papadopoulos, P.; Georgitsi, M.; Gutierrez, L.; Grech, G.; Fanis, P.; Phylactides, M.; Verkerk, A.J.; van der Spek, P.J.; Scerri, C.A.; et al. Haploinsufficiency for the erythroid transcription factor KLF1 causes hereditary persistence of fetal hemoglobin. Nat. Genet. 2010, 42, 801–805. [Google Scholar] [CrossRef] [PubMed]
  35. Norton, L.J.; Funnell, A.P.W.; Burdach, J.; Wienert, B.; Kurita, R.; Nakamura, Y.; Philipsen, S.; Pearson, R.C.M.; Quinlan, K.G.R.; Crossley, M. KLF1 directly activates expression of the novel fetal globin repressor ZBTB7A/LRF in erythroid cells. Blood Adv. 2017, 1, 685–692. [Google Scholar] [CrossRef] [Green Version]
  36. Fraser, J.; Williamson, I.; Bickmore, W.A.; Dostie, J. An Overview of Genome Organization and How We Got There: From FISH to Hi-C. Microbiol. Mol. Biol. Rev. MMBR 2015, 79, 347–372. [Google Scholar] [CrossRef] [Green Version]
  37. Merkenschlager, M.; Nora, E.P. CTCF and Cohesin in Genome Folding and Transcriptional Gene Regulation. Annu. Rev. Genom. Hum. Genet. 2016, 17, 17–43. [Google Scholar] [CrossRef]
  38. Cuddapah, S.; Jothi, R.; Schones, D.E.; Roh, T.Y.; Cui, K.; Zhao, K. Global analysis of the insulator binding protein CTCF in chromatin barrier regions reveals demarcation of active and repressive domains. Genome Res. 2009, 19, 24–32. [Google Scholar] [CrossRef] [Green Version]
  39. Laemmli, U.K.; Kas, E.; Poljak, L.; Adachi, Y. Scaffold-associated regions: Cis-acting determinants of chromatin structural loops and functional domains. Curr. Opin. Genet. Dev. 1992, 2, 275–285. [Google Scholar] [CrossRef]
  40. Heng, H.H.; Goetze, S.; Ye, C.J.; Liu, G.; Stevens, J.B.; Bremer, S.W.; Wykes, S.M.; Bode, J.; Krawetz, S.A. Chromatin loops are selectively anchored using scaffold/matrix-attachment regions. J. Cell Sci. 2004, 117, 999–1008. [Google Scholar] [CrossRef] [Green Version]
  41. Singh, G.B.; Kramer, J.A.; Krawetz, S.A. Mathematical model to predict regions of chromatin attachment to the nuclear matrix. Nucleic Acids Res. 1997, 25, 1419–1425. [Google Scholar] [CrossRef]
  42. Mathai, J.; Mittal, S.P.; Alam, A.; Ranade, P.; Mogare, D.; Patel, S.; Saxena, S.; Ghorai, S.; Kulkarni, A.P.; Chattopadhyay, S. SMAR1 binds to T(C/G) repeat and inhibits tumor progression by regulating miR-371-373 cluster. Sci. Rep. 2016, 6, 33779. [Google Scholar] [CrossRef] [Green Version]
  43. Narwade, N.; Patel, S.; Alam, A.; Chattopadhyay, S.; Mittal, S.; Kulkarni, A. Mapping of scaffold/matrix attachment regions in human genome: A data mining exercise. Nucleic Acids Res. 2019, 47, 7247–7261. [Google Scholar] [CrossRef] [PubMed] [Green Version]
  44. Huang, P.; Keller, C.A.; Giardine, B.; Grevet, J.D.; Davies, J.O.J.; Hughes, J.R.; Kurita, R.; Nakamura, Y.; Hardison, R.C.; Blobel, G.A. Comparative analysis of three-dimensional chromosomal architecture identifies a novel fetal hemoglobin regulatory element. Genes Dev. 2017, 31, 1704–1713. [Google Scholar] [CrossRef] [PubMed] [Green Version]
  45. Wang, L.; Di, L.J.; Lv, X.; Zheng, W.; Xue, Z.; Guo, Z.C.; Liu, D.P.; Liang, C.C. Inter-MAR association contributes to transcriptionally active looping events in human beta-globin gene cluster. PLoS ONE 2009, 4, e4629. [Google Scholar]
  46. de Laat, W.; Grosveld, F. Spatial organization of gene expression: The active chromatin hub. Chromosome Res. 2003, 11, 447–459. [Google Scholar] [CrossRef] [PubMed]
  47. Li, W.; Ren, Y.; Si, Y.; Wang, F.; Yu, J. Long non-coding RNAs in hematopoietic regulation. Cell Regen. 2018, 7, 27–32. [Google Scholar] [CrossRef]
  48. Ren, Y.; Zhu, J.; Han, Y.; Li, P.; Wu, J.; Qu, H.; Zhang, Z.; Fang, X. Regulatory association of long noncoding RNAs and chromatin accessibility facilitates erythroid differentiation. Blood Adv. 2021, 5, 5396–5409. [Google Scholar] [CrossRef]
  49. Baliga, B.S.; Mankad, M.; Shah, A.K.; Mankad, V.N. Mechanism of differentiation of human erythroleukaemic cell line K562 by hemin. Cell Prolif. 1993, 26, 519–529. [Google Scholar] [CrossRef]
  50. Wang, D.; Si, S.; Wang, Q.; Luo, G.; Du, Q.; Liang, Q.; Guo, X.; Zhang, G.; Feng, J.; Leng, Z. MiR-27a Promotes Hemin-Induced Erythroid Differentiation of K562 Cells by Targeting CDC25B. Cell. Physiol. Biochem. 2018, 46, 365–374. [Google Scholar] [CrossRef] [Green Version]
  51. Rowley, P.T.; Ohlsson-Wilhelm, B.M.; Farley, B.A. K562 human erythroleukemia cells demonstrate commitment. Blood 1985, 65, 862–868. [Google Scholar] [CrossRef] [Green Version]
  52. Piechaczek, C.; Fetzer, C.; Baiker, A.; Bode, J.; Lipps, H.J. A vector based on the SV40 origin of replication and chromosomal S/MARs replicates episomally in CHO cells. Nucleic Acids Res. 1999, 27, 426–428. [Google Scholar] [CrossRef] [PubMed]
  53. Pfaffl, M.W. A new mathematical model for relative quantification in real-time RT-PCR. Nucleic Acids Res. 2001, 29, e45. [Google Scholar] [CrossRef] [PubMed]
  54. Dastani, Z.; Hivert, M.F.; Timpson, N.; Perry, J.R.; Yuan, X.; Scott, R.A.; Henneman, P.; Heid, I.M.; Kizer, J.R.; Lyytikainen, L.P.; et al. Novel loci for adiponectin levels and their influence on type 2 diabetes and metabolic traits: A multi-ethnic meta-analysis of 45,891 individuals. PLoS Genet. 2012, 8, e1002607. [Google Scholar] [CrossRef] [Green Version]
  55. Afgan, E.; Baker, D.; Batut, B.; van den Beek, M.; Bouvier, D.; Cech, M.; Chilton, J.; Clements, D.; Coraor, N.; Gruning, B.A.; et al. The Galaxy platform for accessible, reproducible and collaborative biomedical analyses: 2018 update. Nucleic Acids Res. 2018, 46, W537–W544. [Google Scholar] [CrossRef] [PubMed] [Green Version]
  56. Langmead, B.; Salzberg, S.L. Fast gapped-read alignment with Bowtie 2. Nat. Methods 2012, 9, 357–359. [Google Scholar] [CrossRef] [PubMed] [Green Version]
  57. Zhang, Y.; Liu, T.; Meyer, C.A.; Eeckhoute, J.; Johnson, D.S.; Bernstein, B.E.; Nusbaum, C.; Myers, R.M.; Brown, M.; Li, W.; et al. Model-based analysis of ChIP-Seq (MACS). Genome Biol. 2008, 9, R137. [Google Scholar] [CrossRef] [PubMed] [Green Version]
  58. Albarino, C.G.; Romanowski, V. Phenol extraction revisited: A rapid method for the isolation and preservation of human genomic DNA from whole blood. Mol. Cell. Probes 1994, 8, 423–427. [Google Scholar] [CrossRef]
Figure 1. LRF-, DNMT3A-, HDAC1-overexpressing (OE) K562 clones and induction of erythropoiesis. (A) eGFP detection in LRF-overexpressing (OE) K562 cells, 2 months post transfection. Images derived from phase contrast (up) and fluorescence (down) microscopy. (B) Benzidine staining of untreated (up) and treated with 30 μΜ hemin/5 ng/mL ΕPOK562 cells. Hemoglobinized cells were stained dark blue. (C) Relative expression of LRF/ZBTB7A in LRF-overexpressing (OE) and ZBTB7A-knockdown (KD) K562 clones, pre- and post-hemin/EPO induction. (D) Relative expression of HBG2/1 and HBB in LRF-OE and ZBTB7A-KD K562 clones, pre- and post-hemin/EPO induction. (E) Relative expression of DNMT3A, HDAC1, LRF/ZBTB7A, HBG2/1 and HBB in DNMT3A-OE and HDAC1-OE K562 clones respectively. Values are normalized to untransfected (UT), non-induced cells. * p < 0.05, ** p < 0.01.
Ijms 23 07025 g001
Figure 2. Methylation pattern of CpGs at HBG2, LRF/ZBTB7A and LINE1 genetic loci. (A) The methylation levels of specific CpG sites lying at the 5′ prime end of HBG2 gene. Data are presented as mean ± SE, a indicates p < 0.05, b indicates p < 0.01 and c indicates p < 0.001. (B) Schematic representation of HBG2 and LRF/ZBTB7A gene loci and the LINE1 transposable element. The detailed genomic positions and CpG dinucleotides analyzed are presented. (C) Heatmap visualization of the Cytosines’ methylation levels of CpG sites within HBG2 and ZBTB7A promoter regions and 5′UTR of LINE1. Methylation status of the whole CpG area in each locus is also depicted. Each square corresponds to one CpG site analyzed; data are presented as mean percentage methylation.
Ijms 23 07025 g002
Figure 3. LRF/ZBTB7A occupancy sites at “HBB locus” and BGLT3-lncRNA expression levels. (A) Tracks display ChIP-seq data of LRF/ZBTB7A occupancy and calculated peak enrichment sites for each sample. Reads for untransfected (UT) and LRF-overexpressing (OE) K562 cells, before and after erythropoiesis induction across “HBB locus” including βLCR are depicted. LRF/ZBTB7A occupancy sites starting from BGLT3 gene and across the intergenic region towards the HBB gene are highlighted in the grey background. (B) Relative expression of BGLT3-lnc RNA in LRF-overexpressing (OE) K562 cells pre- and post-hemin/EPO induction. Values were normalized to untransfected (UT) non induced cells. * p < 0.05. (C) ChIP-seq data of LRF/ZBTB7A occupancy sites pre- and post-hemin/EPO induction at genetic loci expressing DANCR- and NEAT1-lncRNAs, reported to be involved in erythropoiesis.
Ijms 23 07025 g003
Figure 4. Updated looping model illustrating fetal (HbF) to adult hemoglobin (HbA) switch. (A) At fetal stage DNA loops promote the proximity of HBG2 and HBG1 (γ-globin genes) to DNAse Hypersensitive Sites (HS2, HS3 and HS4) favoring HbF expression. (B) During HbF to HbA transversion BCL11A and LRF (not shown for satisfying model’s simplicity) bind HBG2/1 promoter regions, leading to their full silencing. Simultaneously, LRF promotes BGLT3-lncRNA expression, further releasing downstream chromatin conformation, thus supporting HBB expression (for detailed analyses refer to discussion). Τhe chromatin loop containing both fetal genes (HBG2 and HBG1) interacting with HS2, HS3 and HS4 LCR enhancer sites, has been now replaced with the “adult”-genes’ loop including BGLT3, HBBP1, HBD and HBB genes. Chromatin modulation stimulates HbA expression at the adult stage. Arrows derived from genes indicate transcription. Yellow star represents the anchor gathering S/MAR elements of “HBB locus”.
Ijms 23 07025 g004
Figure 5. Construction of LRF/ZBTB7A, DNMT3A, HDAC1 episomal vectors and the LRF/ZBTB7A knockout CRSPR/Cas9 system. (A) Restriction sites for LRF/ZBTB7A, DNMT3A, HDAC1 insertion into the episomal vector PEPI-1. Reporter gene’s eGFP sequence, between AgeI/BspEI sites, was removed. Arrows indicate the location as well as the orientation of the eGFP and the vector’s functional elements. (B) Schematic representation of LRF/ZBTB7A, catalytic domain of DNMT3 and HDAC1 sequences incorporated within PEPI-1. Kozak sequence and restriction endonuclease sites added (in PCR primers) are marked with orange and blue color respectively. Start and stop codons are underlined. (C) Schematic illustration of CRISPR/Cas9 mediated LRF/ZBTB7A gene knockout through homology-directed repair mechanism. CRISPR/Cas9 cuts the double stranded DNA after first codon (ATG) indicated as a red rectangle. Position of left and right homology arm is indicated with blue rectangle. Edited ZBTB7A locus is presented.
Ijms 23 07025 g005
Table 1. Primer sets.
AssayGeneSequencePrimer
Pyrosequencing CpG assayLRF/ZBTB7AGTAGATTTTTTTGTGTTAAGGAForward
AACAAACCCCCAACCTCTAC5′ biotinylated Reverse
GGGATTTTTATAGTTTTATTTTTAAForward Pyrosequencing
HBG25′ ATGGTGGGAGAAGAAAATTAGTT 3′Forward
5′ TCTCCTCCAACATCTTCCACATTCA 3′5′ biotinylated Reverse
5′ ATAGTTTTAGAGTATTTAGTGA 3′Forward Pyrosequencing
LINE15′ AAGTAAGTTTGGGTAATGG 3′Forward
5′ AACAACTCCCATCTACAACTCCC 3′5′ biotinylated Reverse
5′ GGGTGGGAGTGAT 3′Forward Pyrosequencing
qPCRGAPDH5′ AGGGCTGCTTTTAACTCTGGT 3′Forward
5′ CCCCACTTGATTTTGGAGGGA 3′Reverse
LRF/ZBTB7A5′ GAAGCCCTACGAGTGCAACATC 3′Forward
5′ GTGGTTCTTCAGGTCGTAGTTGTG 3′Reverse
HBG2/15′ AACCCCAAAGTCAAGGCACA 3′Forward
5′ GATTGCCAAAACGGTCACCA 3′ Reverse
HBB5′ CTGAGTGAGCTGCACTGTGA 3’Forward
5′ ATTGGACAGCAAGAAAGCGA 3′Reverse
DNMT3A5′ GGTGCTGTCTCTCTTTGATGGA 3′Forward
5′ GGATATGCTTCTGTGTGACGC 3′Reverse
BGLT35′ TCAGGGGTAACACACAAACCA 3′Forward
5′ GTCTCATGTGCTGCACGTCT 3′Reverse
HDAC15′ CCCAATGAAGCCTCACCGAA 3′Forward
5′ CGGATGGAGCGCAAGAATTT 3′Reverse
CloningLRF/ZBTB7A5′ GATGGCCGGCGGCGTGGACG 3′Forward
5′ TCATTAGGCGAGTCCGGCTGTGAAG 3′Reverse
DNMT3A5′ GGTAAGATCTGCCACCATGATCCGGGTG 3′Forward
5′ CGGCCTATTAATCTACACACACGAAAGT 3′Reverse
HDAC15′ GGTAAGATCTGCCACCATGGCGCAGAC 3′Forward
5′ TAGCCTAGTTATGCTAGCATTAATTCAGG 3′Reverse
Publisher’s Note: MDPI stays neutral with regard to jurisdictional claims in published maps and institutional affiliations.

