
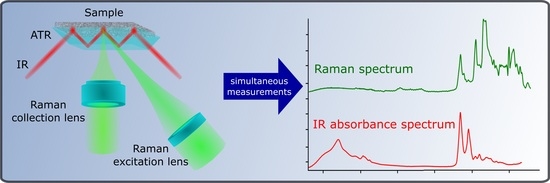
Design and Development of a Bimodal Optical Instrument for Simultaneous Vibrational Spectroscopy Measurements

 , , and
Abstract
:
1. Introduction
2. Results and Discussion
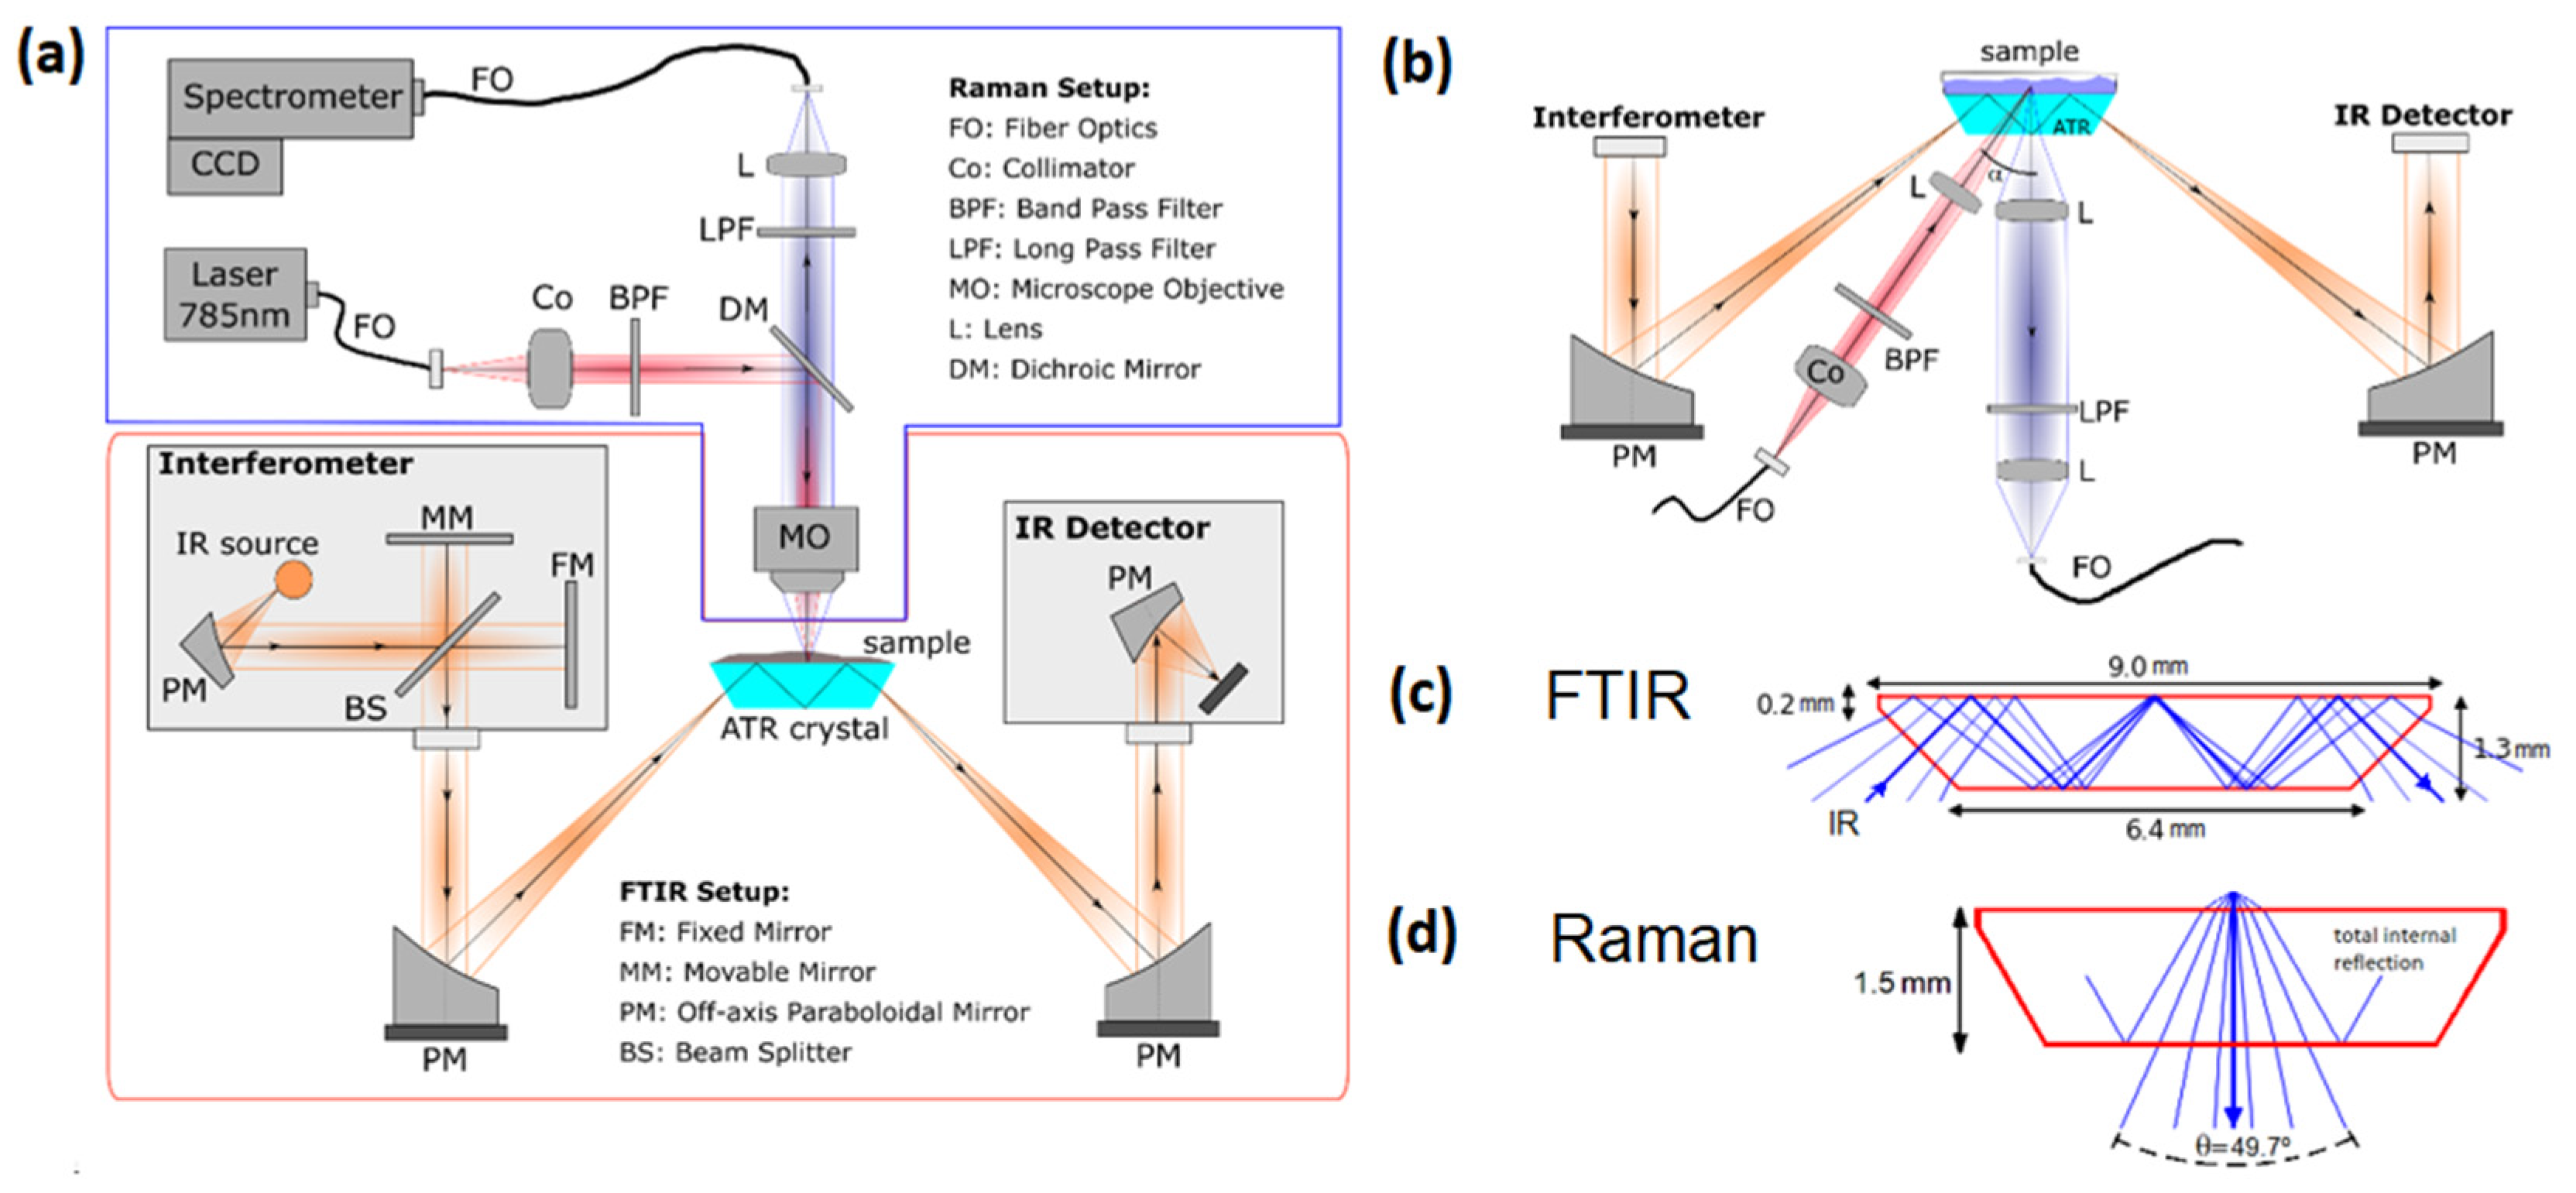
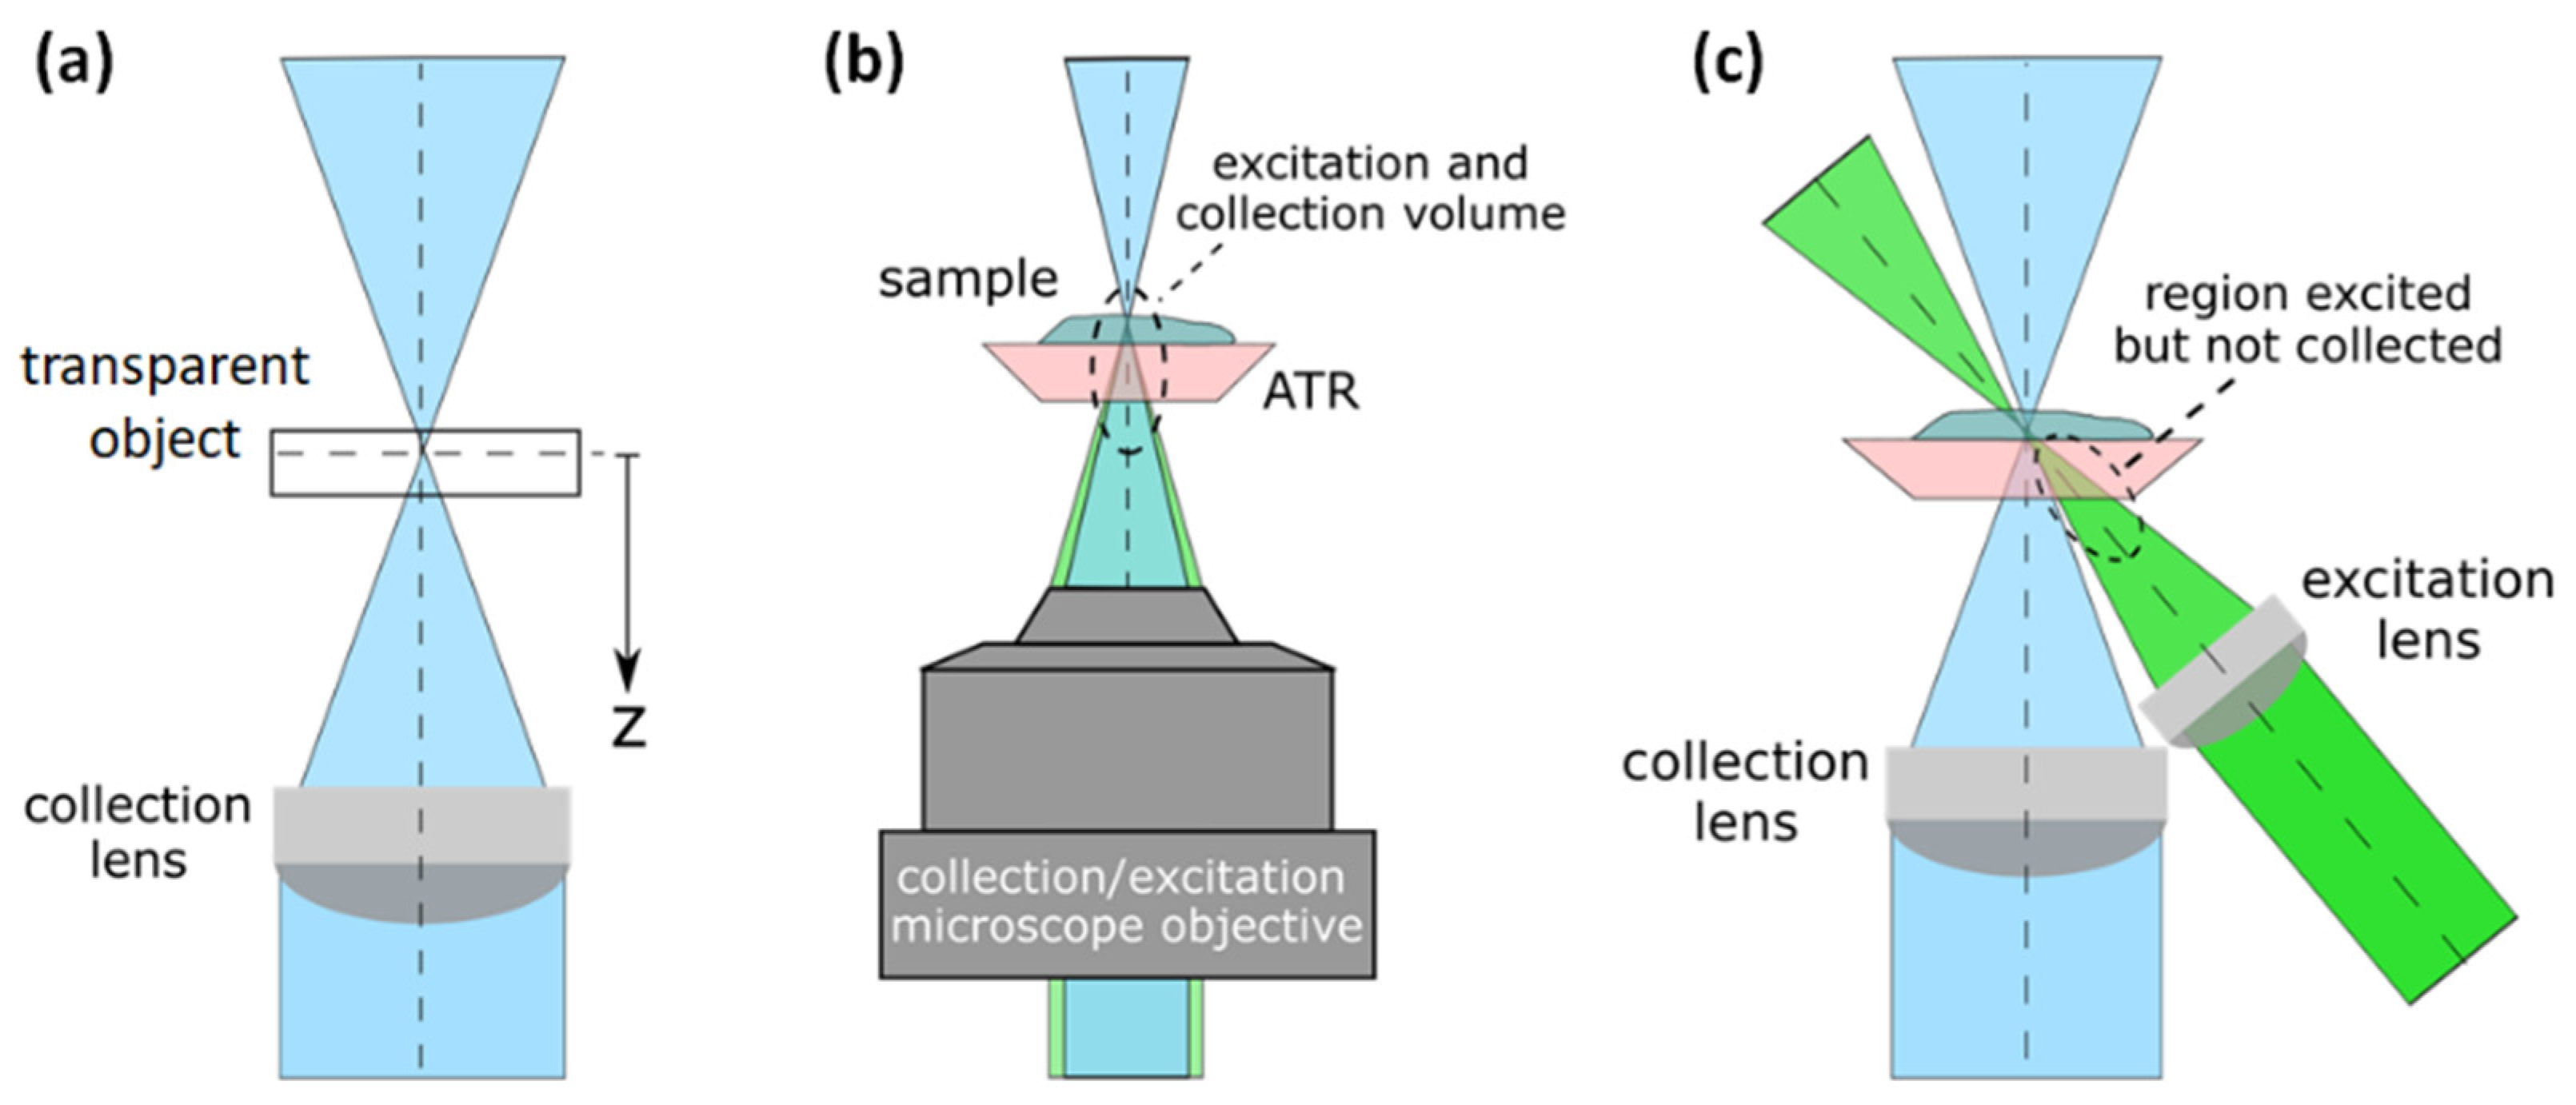
2.1. Optical Design of the Combined System
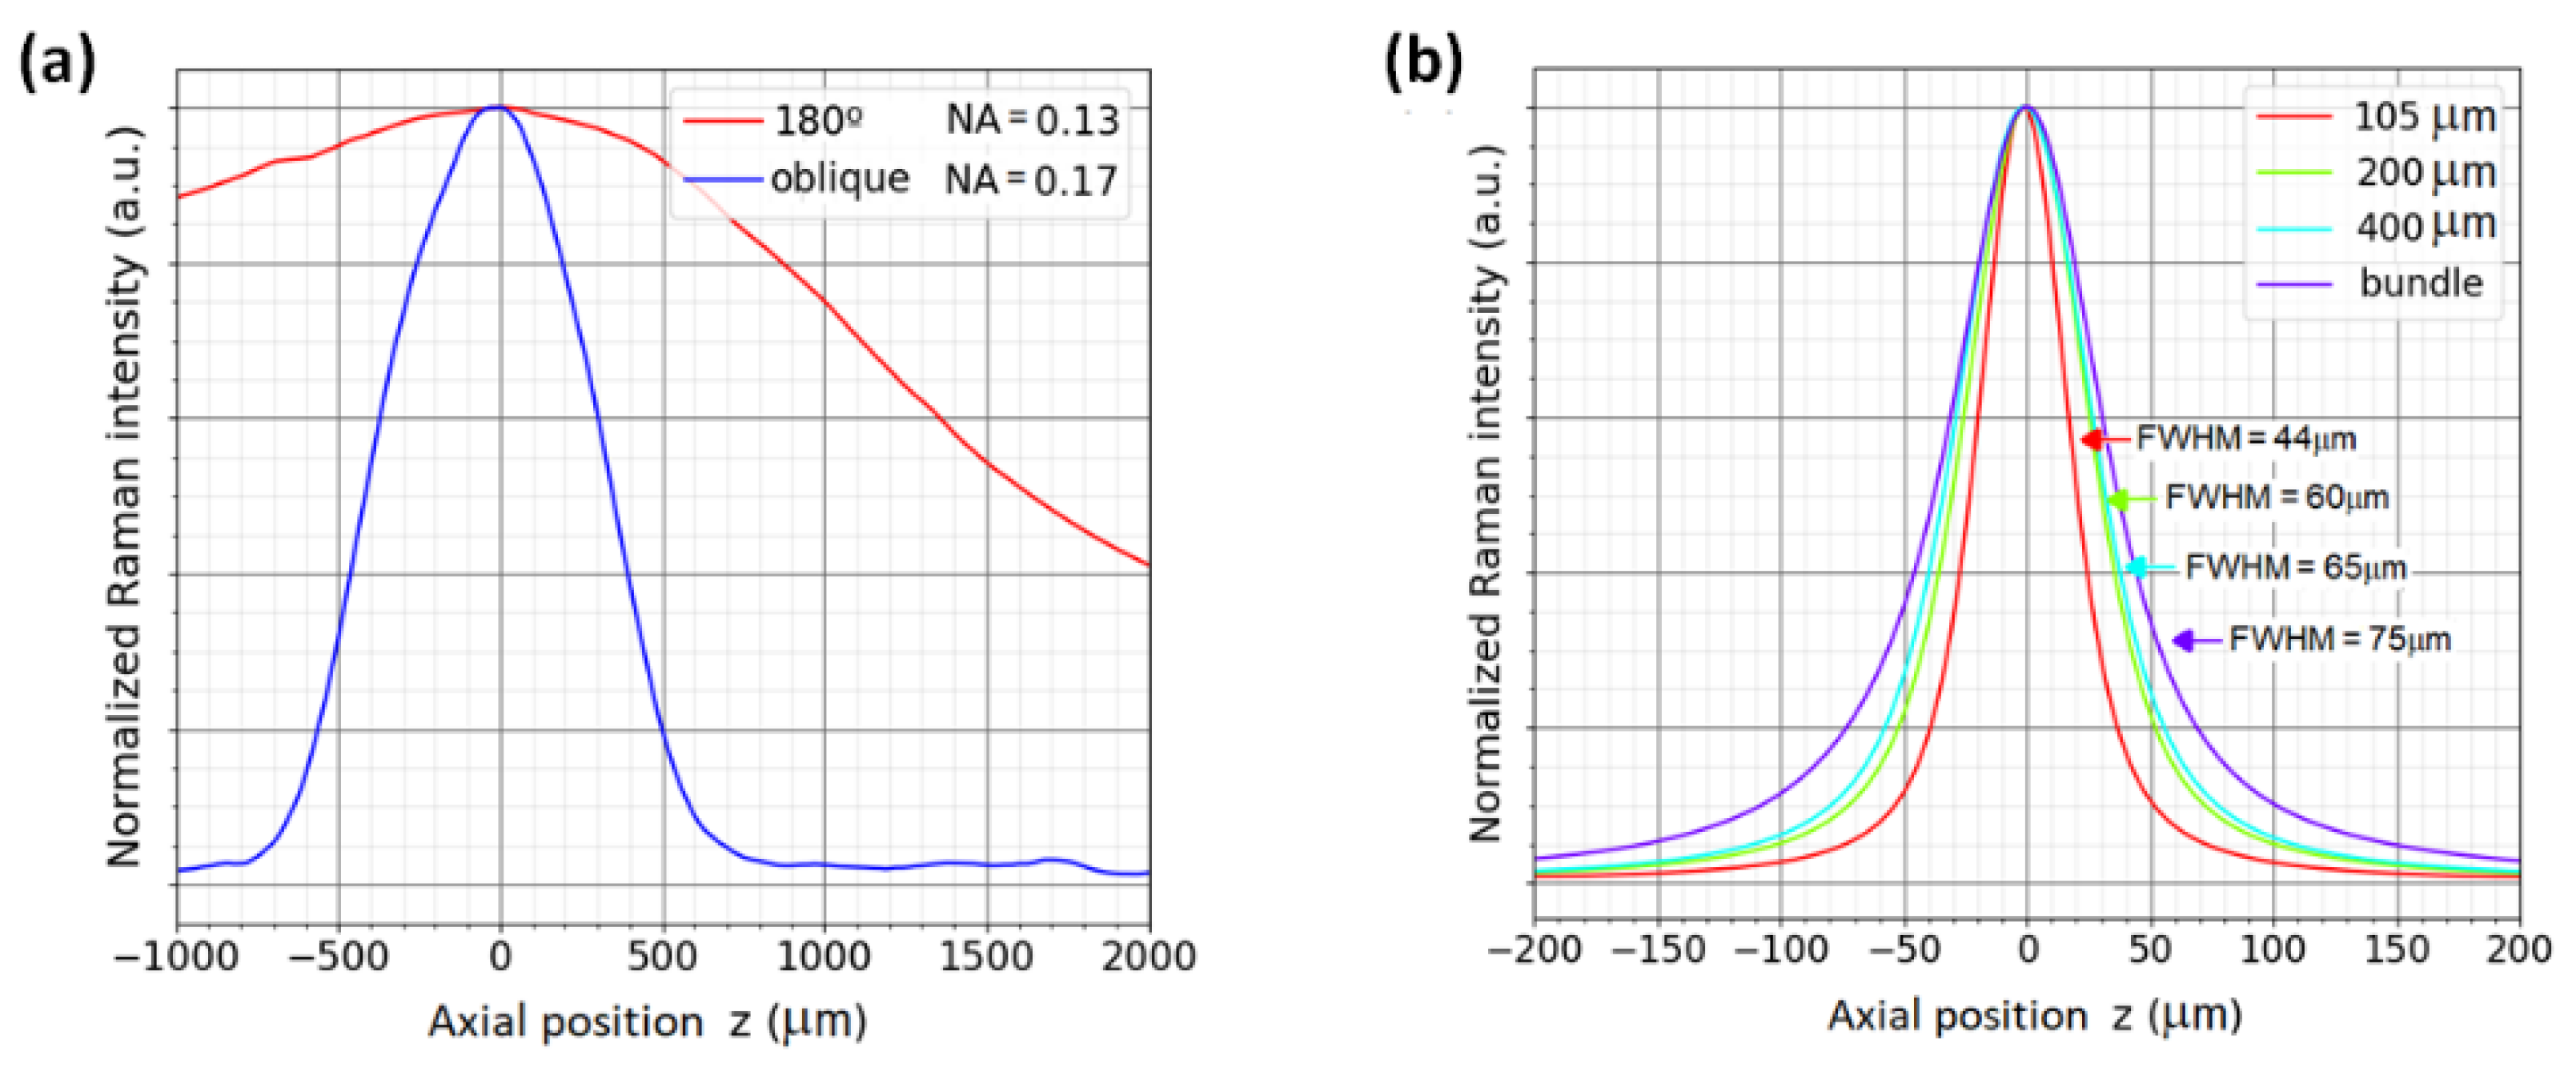
2.2. Raman Depth Profiles
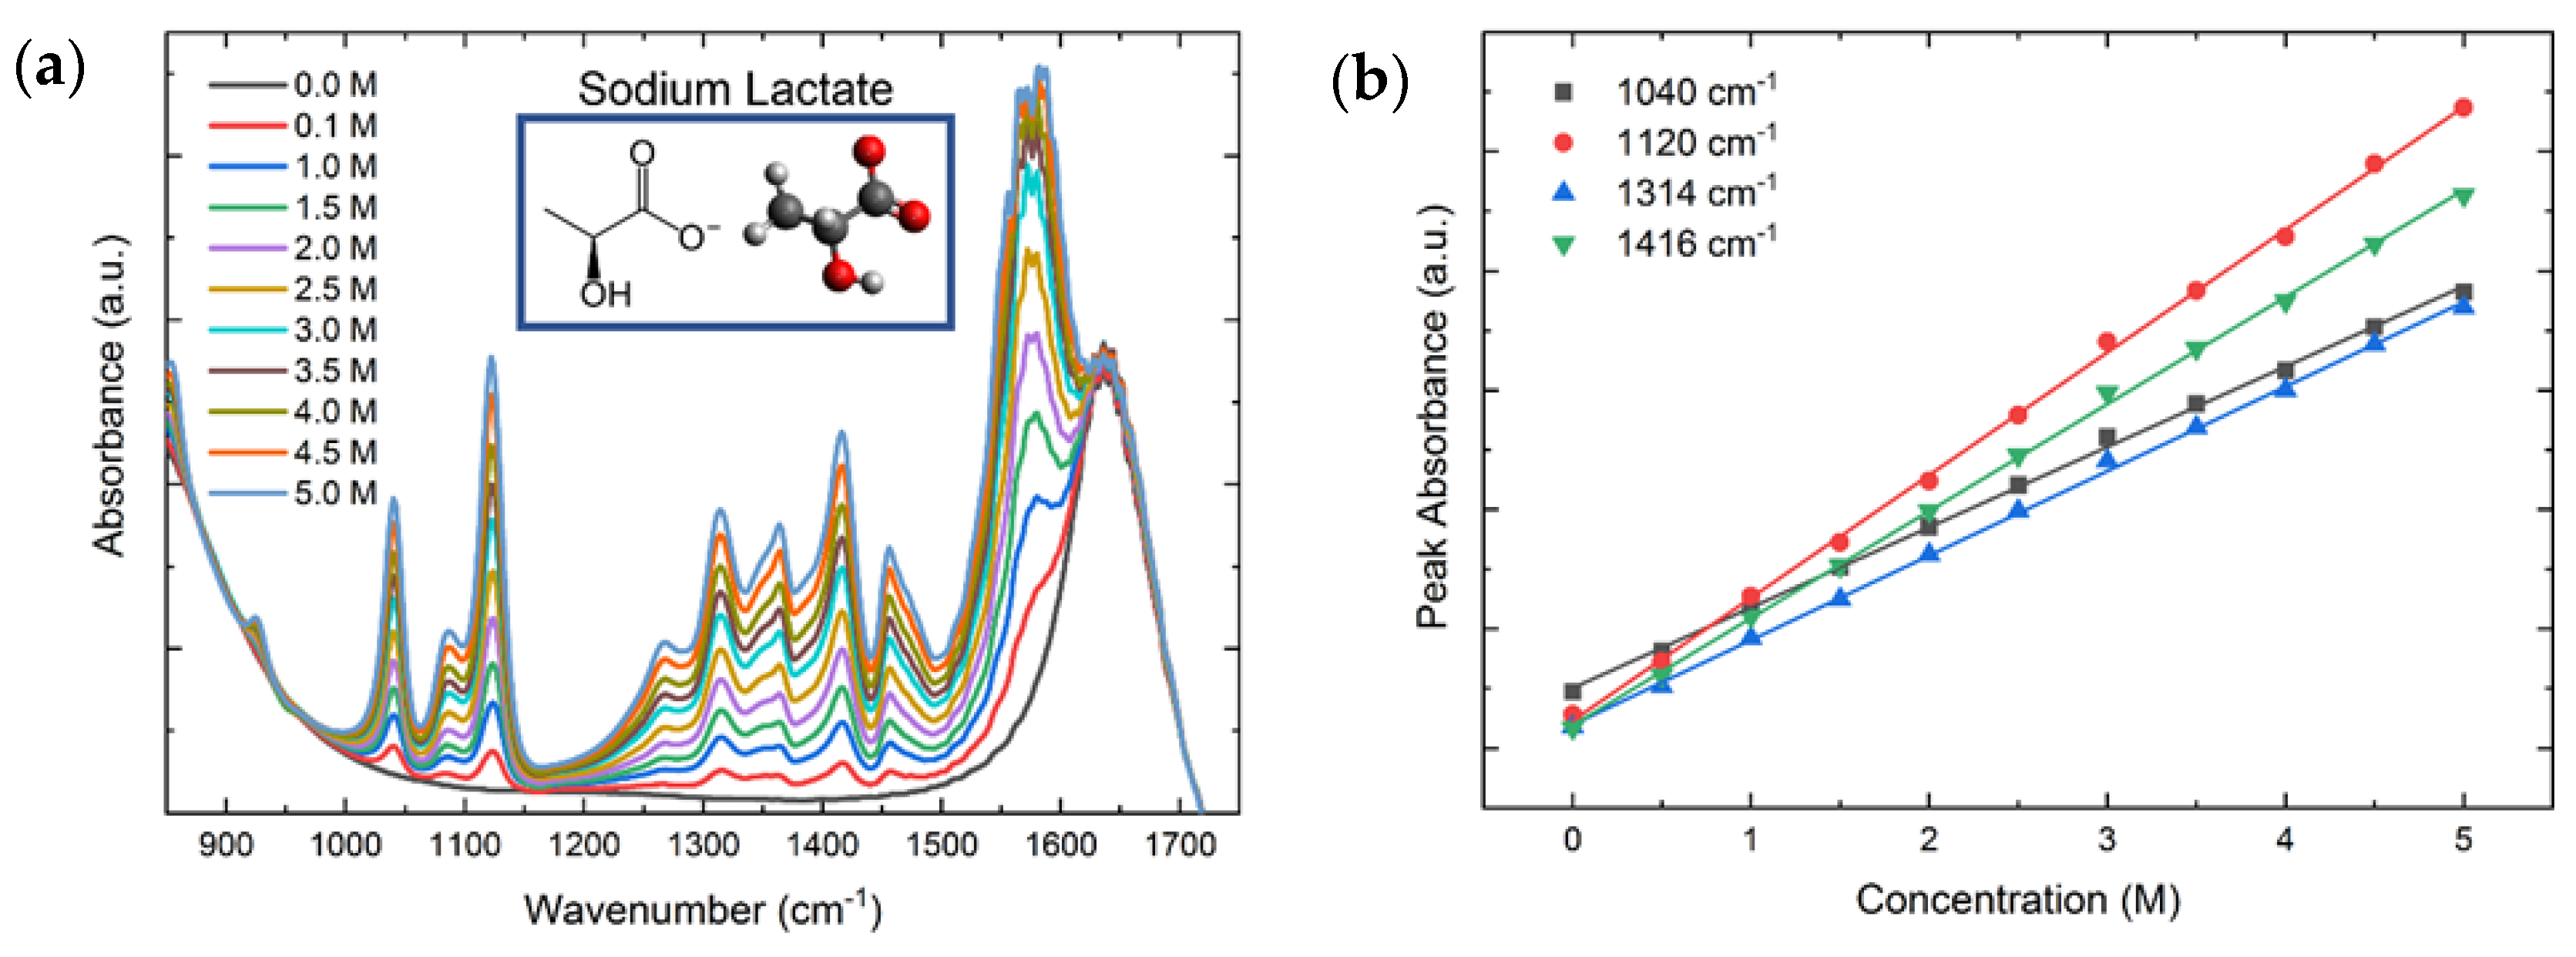
2.3. Vibrational Spectroscopy of Chemical Compounds
2.3.1. FTIR
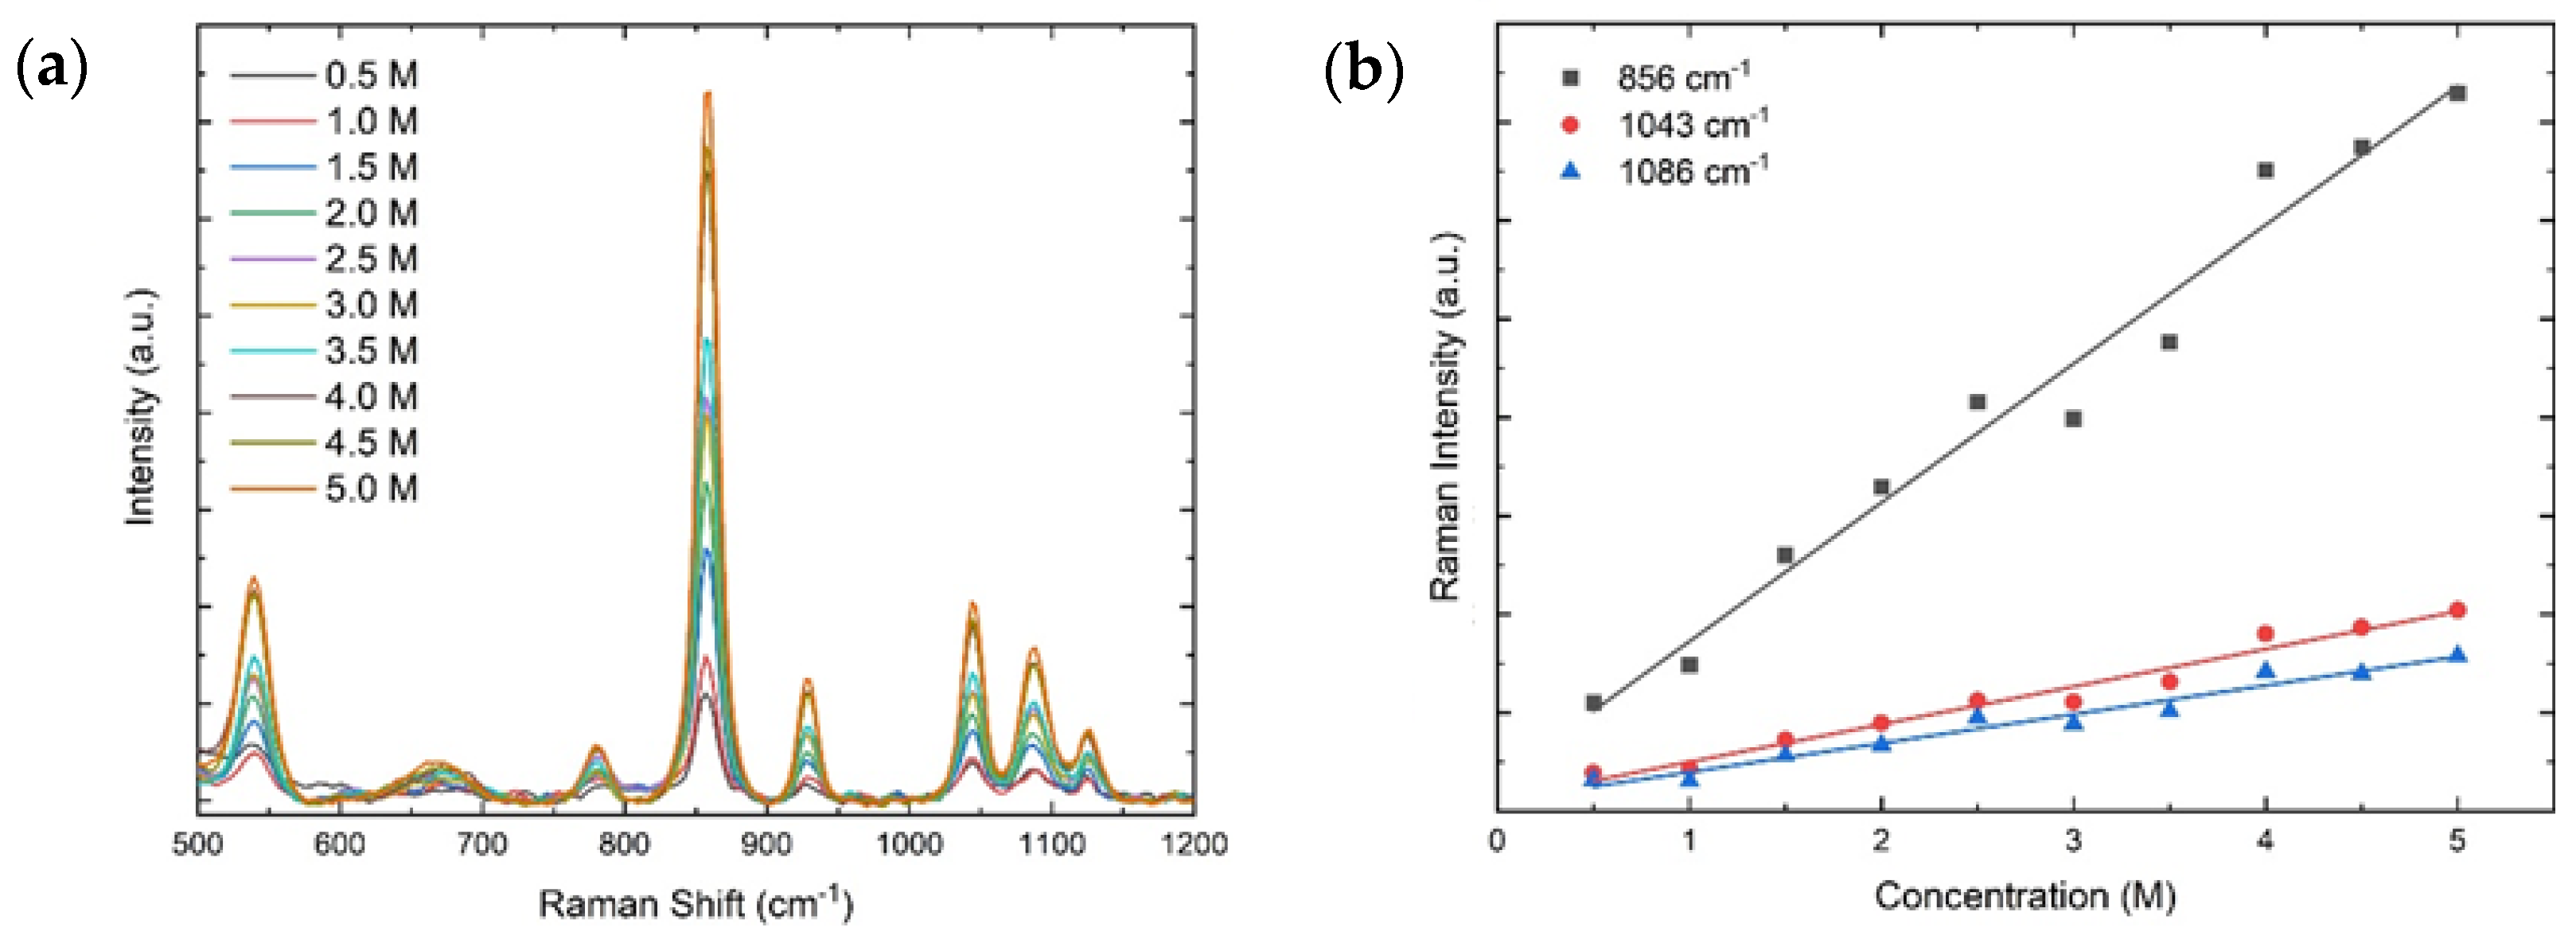
2.3.2. Raman
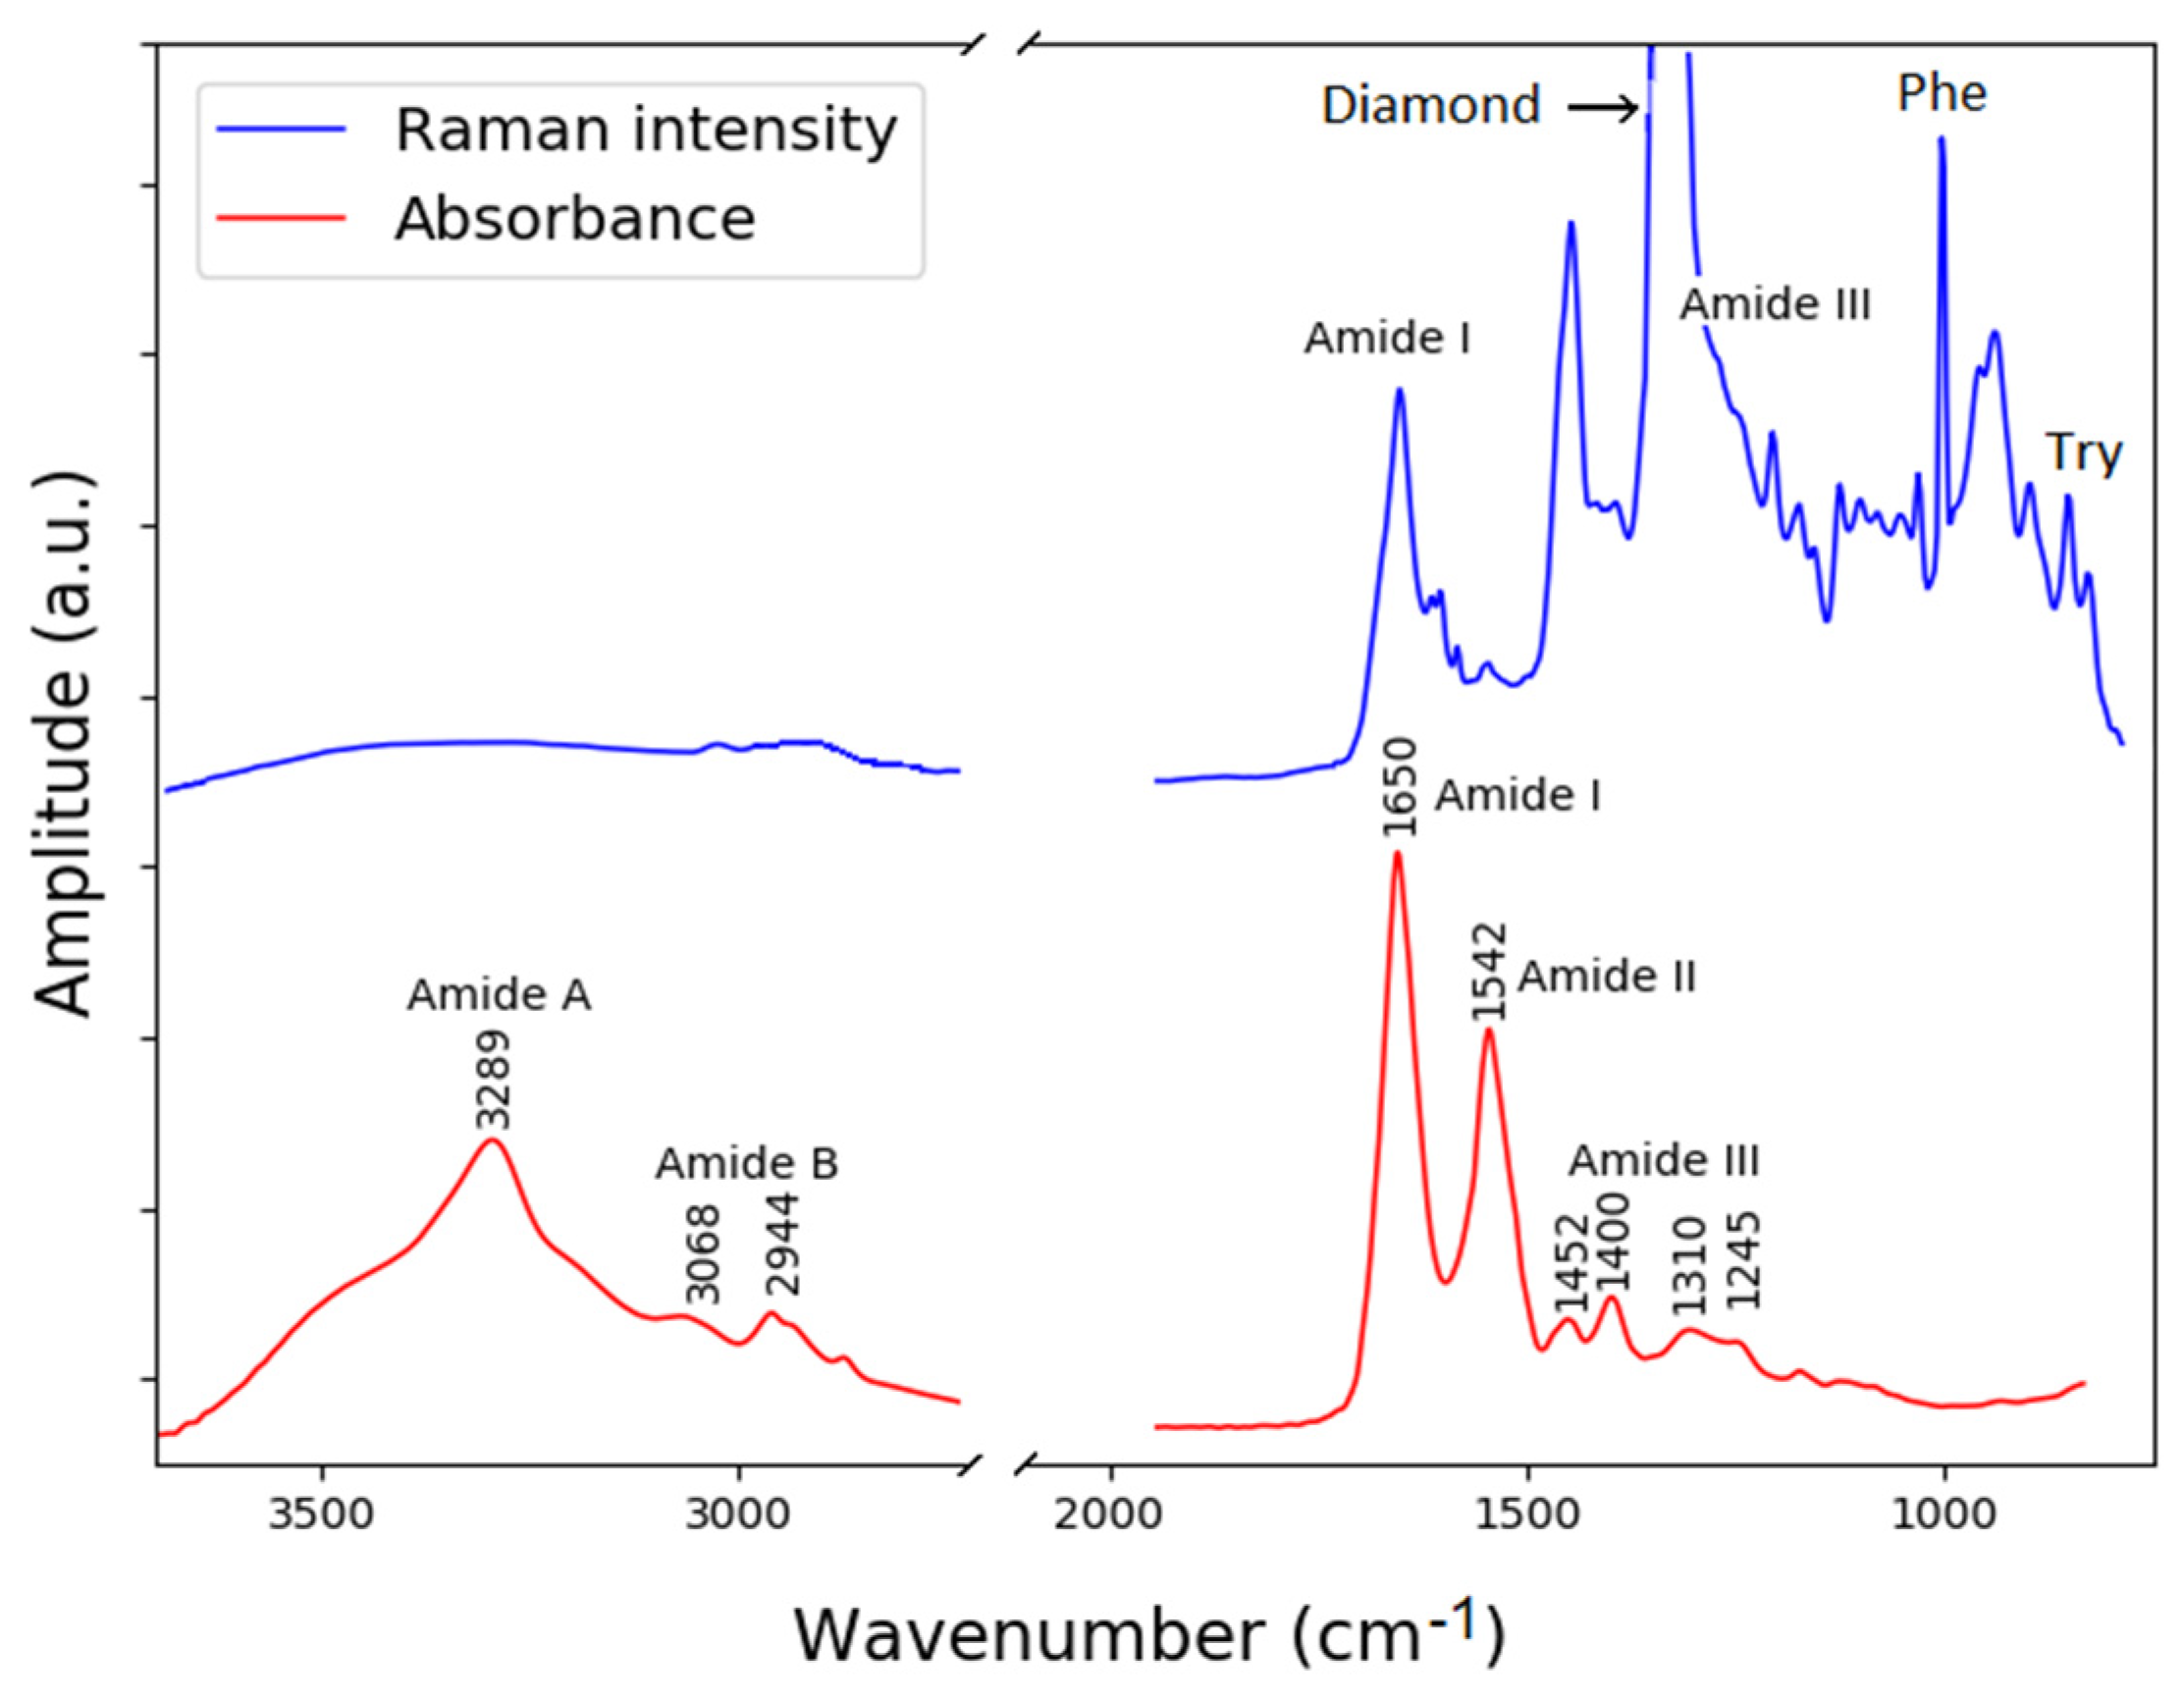
2.4. Vibrational Spectroscopy of Complex Compounds
3. Materials and Methods
3.1. FTIR Module
3.2. Raman Module
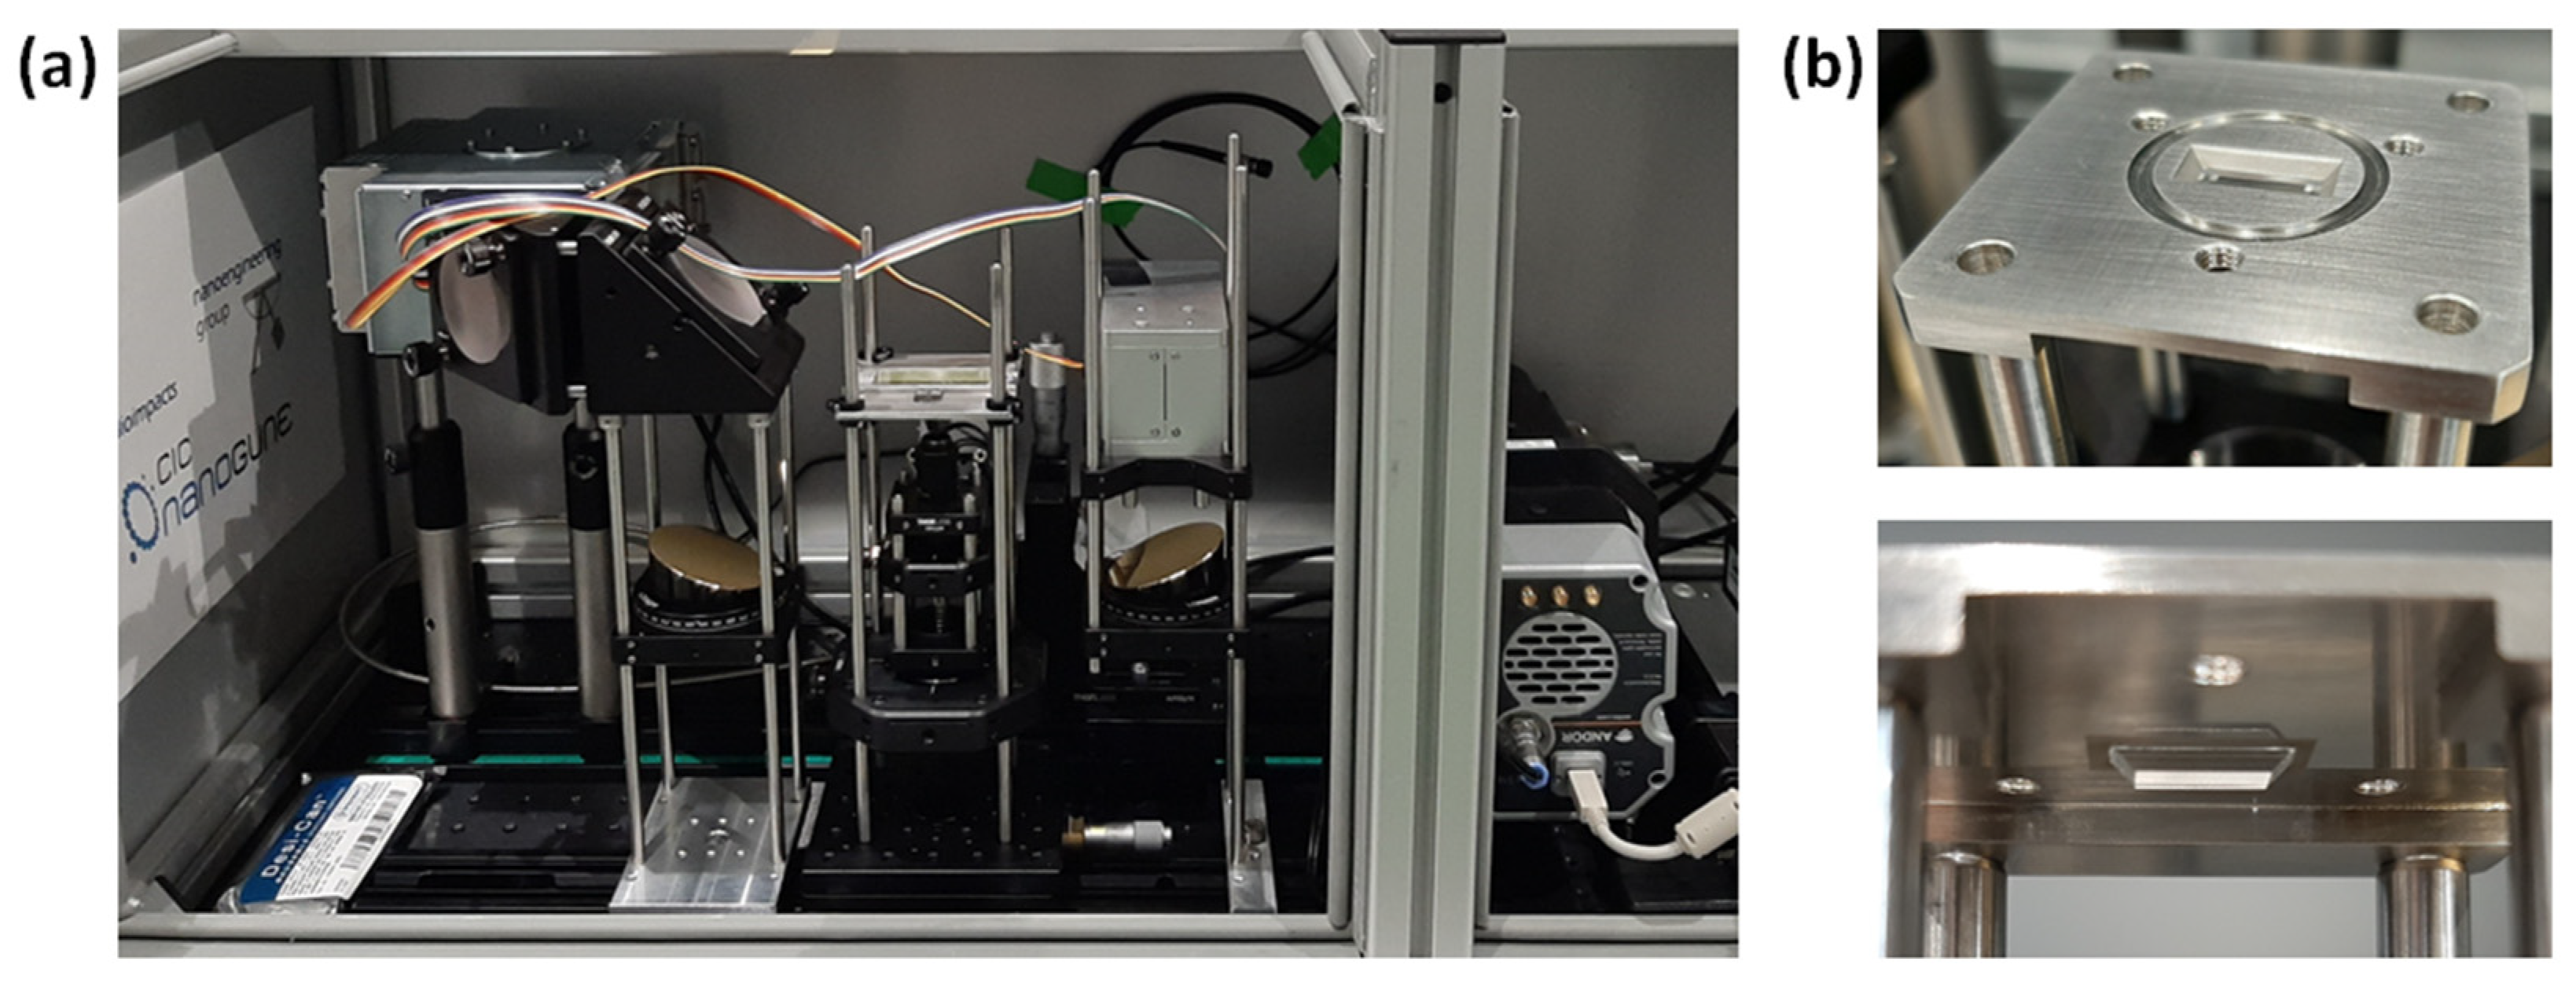
3.3. Sample Cavity and Mechanical Parts
4. Conclusions
5. Patents
Author Contributions
Funding
Institutional Review Board Statement
Informed Consent Statement
Data Availability Statement
Conflicts of Interest
References
- Larkin, P. Infrared and Raman Spectroscopy: Principles and Spectral Interpretation; Elsevier: Amsterdam, The Netherlands, 2017. [Google Scholar]
- Bokobza, L. Some Applications of Vibrational Spectroscopy for the Analysis of Polymers and Polymer Composites. Polymers 2019, 11, 1159. [Google Scholar] [CrossRef] [Green Version]
- Deidda, R.; Sacre, P.-Y.; Clavaud, M.; Coïc, L.; Avohou, H.; Hubert, P.; Ziemons, E. Vibrational Spectroscopy in Analysis of Pharmaceuticals: Critical Review of Innovative Portable and Handheld NIR and Raman Spectrophotometers. TrAC Trends Anal. Chem. 2019, 114, 251–259. [Google Scholar] [CrossRef]
- Zulkifli, S.N.; Rahim, H.A.; Lau, W.-J. Detection of Contaminants in Water Supply: A Review on State-of-the-Art Monitoring Technologies and Their Applications. Sens. Actuators B Chem. 2018, 255, 2657–2689. [Google Scholar] [CrossRef]
- Tahir, H.E.; Xiaobo, Z.; Jianbo, X.; Mahunu, G.K.; Jiyong, S.; Xu, J.-L.; Sun, D.-W. Recent Progress in Rapid Analyses of Vitamins, Phenolic, and Volatile Compounds in Foods Using Vibrational Spectroscopy Combined with Chemometrics: A Review. Food Anal. Methods 2019, 12, 2361–2382. [Google Scholar] [CrossRef]
- Muro, C.K.; Doty, K.C.; Bueno, J.; Halámková, L.; Lednev, I.K. Vibrational Spectroscopy: Recent Developments to Revolutionize Forensic Science. Anal. Chem. 2015, 87, 306–327. [Google Scholar] [CrossRef]
- Castro, K.; Sarmiento, A.; Pérez-Alonso, M.; Madariaga, J.M.; Princi, E.; Vicini, S.; Pedemonte, E.; Rodríguez-Laso, M.D. Vibrational Spectroscopy at the Service of Industrial Archaeology: Nineteenth-Century Wallpaper. TrAC Trends Anal. Chem. 2007, 26, 347–359. [Google Scholar] [CrossRef]
- Käppler, A.; Fischer, D.; Oberbeckmann, S.; Schernewski, G.; Labrenz, M.; Eichhorn, K.-J.; Voit, B. Analysis of Environmental Microplastics by Vibrational Microspectroscopy: FTIR, Raman or Both? Anal. Bioanal. Chem. 2016, 408, 8377–8391. [Google Scholar] [CrossRef]
- Leal, L.B.; Nogueira, M.S.; Canevari, R.A.; Carvalho, L.F.C.S. Vibration Spectroscopy and Body Biofluids: Literature Review for Clinical Applications. Photodiagnosis Photodyn. Ther. 2018, 24, 237–244. [Google Scholar] [CrossRef]
- Cordero, E. In-Vivo Raman Spectroscopy: From Basics to Applications. J. Biomed. Opt. 2018, 23, 1. [Google Scholar] [CrossRef]
- Balan, V.; Mihai, C.-T.; Cojocaru, F.-D.; Uritu, C.-M.; Dodi, G.; Botezat, D.; Gardikiotis, I. Vibrational Spectroscopy Fingerprinting in Medicine: From Molecular to Clinical Practice. Materials 2019, 12, 2884. [Google Scholar] [CrossRef] [Green Version]
- Olaetxea, I.; Valero, A.; Lopez, E.; Lafuente, H.; Izeta, A.; Jaunarena, I.; Seifert, A. Machine Learning-Assisted Raman Spectroscopy for PH and Lactate Sensing in Body Fluids. Anal. Chem. 2020, 92, 13888–13895. [Google Scholar] [CrossRef]
- Byrne, H.J.; Bonnier, F.; McIntyre, J.; Parachalil, D.R. Quantitative Analysis of Human Blood Serum Using Vibrational Spectroscopy. Clin. Spectrosc. 2020, 2, 100004. [Google Scholar] [CrossRef]
- Derruau, S.; Robinet, J.; Untereiner, V.; Piot, O.; Sockalingum, G.D.; Lorimier, S. Vibrational Spectroscopy Saliva Profiling as Biometric Tool for Disease Diagnostics: A Systematic Literature Review. Molecules 2020, 25, 4142. [Google Scholar] [CrossRef] [PubMed]
- Ramos, I.R.; Lyng, F.M.; Rehman, I.U.; Sharrack, B.; Woodroofe, M.N. The Use of Vibrational Spectroscopy to Study the Pathogenesis Multiple Sclerosis and Other Neurological Conditions. Appl. Spectrosc. Rev. 2017, 52, 868–882. [Google Scholar] [CrossRef]
- Travo, A.; Paya, C.; Déléris, G.; Colin, J.; Mortemousque, B.; Forfar, I. Potential of FTIR Spectroscopy for Analysis of Tears for Diagnosis Purposes. Anal. Bioanal. Chem. 2014, 406, 2367–2376. [Google Scholar] [CrossRef]
- Esmonde-White, K.A.; Mandair, G.S.; Raaii, F.; Jacobson, J.A.; Miller, B.S.; Urquhart, A.G.; Roessler, B.J.; Morris, M.D. Raman Spectroscopy of Synovial Fluid as a Tool for Diagnosing Osteoarthritis. J. Biomed. Opt. 2009, 14, 034013. [Google Scholar] [CrossRef]
- Muro, C.K.; Lednev, I.K. Race Differentiation Based on Raman Spectroscopy of Semen Traces for Forensic Purposes. Anal. Chem. 2017, 89, 4344–4348. [Google Scholar] [CrossRef]
- Bakker Schut, T.C.; Witjes, M.J.H.; Sterenborg, H.J.C.M.; Speelman, O.C.; Roodenburg, J.L.N.; Marple, E.T.; Bruining, H.A.; Puppels, G.J. In Vivo Detection of Dysplastic Tissue by Raman Spectroscopy. Anal. Chem. 2000, 72, 6010–6018. [Google Scholar] [CrossRef]
- Chaber, R.; Łach, K.; Depciuch, J.; Szmuc, K.; Michalak, E.; Raciborska, A.; Koziorowska, A.; Cebulski, J. Fourier Transform Infrared (FTIR) Spectroscopy of Paraffin and Deparafinnized Bone Tissue Samples as a Diagnostic Tool for Ewing Sarcoma of Bones. Infrared Phys. Technol. 2017, 85, 364–371. [Google Scholar] [CrossRef]
- Li, Q.-B. In Vivo and in Situ Detection of Colorectal Cancer Using Fourier Transform Infrared Spectroscopy. WJG 2005, 11, 327. [Google Scholar] [CrossRef]
- Sahu, A.; Krishna, C.M. Optical Diagnostics in Oral Cancer: An Update on Raman Spectroscopic Applications. J. Cancer Res. Ther. 2017, 13, 908–915. [Google Scholar] [CrossRef] [PubMed]
- Surmacki, J.; Musial, J.; Kordek, R.; Abramczyk, H. Raman Imaging at Biological Interfaces: Applications in Breast Cancer Diagnosis. Mol. Cancer 2013, 12, 48. [Google Scholar] [CrossRef] [PubMed] [Green Version]
- Widjaja, E.; Zheng, W.; Huang, Z. Classification of Colonic Tissues Using Near-Infrared Raman Spectroscopy and Support Vector Machines. Int. J. Oncol. 2008, 32, 653–662. [Google Scholar] [CrossRef] [Green Version]
- Carmona, P.; Molina, M.; López-Tobar, E.; Toledano, A. Vibrational Spectroscopic Analysis of Peripheral Blood Plasma of Patients with Alzheimer’s Disease. Anal. Bioanal. Chem. 2015, 407, 7747–7756. [Google Scholar] [CrossRef] [Green Version]
- Kansiz, M.; Prater, C.; Dillon, E.; Lo, M.; Anderson, J.; Marcott, C.; Demissie, A.; Chen, Y.; Kunkel, G. Optical Photothermal Infrared Microspectroscopy with Simultaneous Raman—A New Non-Contact Failure Analysis Technique for Identification of <10 Μm Organic Contamination in the Hard Drive and Other Electronics Industries. Micros. Today 2020, 28, 26–36. [Google Scholar] [CrossRef]
- Griffiths, P.R.; De Haseth, J.A. Fourier Transform Infrared Spectrometry, 2nd ed.; Chemical analysis; Wiley-Interscience: Hoboken, NJ, USA, 2007; ISBN 978-0-471-19404-0. [Google Scholar]
- Smith, B.C. Fundamentals of Fourier Transform Infrared Spectroscopy; CRC Press: Boca Raton, FL, USA, 2011; ISBN 978-0-429-14058-7. [Google Scholar]
- Smith, E.; Dent, G. Modern Raman Spectroscopy: A Practical Approach, 2nd ed.; Wiley: Hoboken, NJ, USA, 2019; ISBN 978-1-119-44055-0. [Google Scholar]
- Barman, I.; Tan, K.M.; Singh, G.P. Optical Sectioning Using Single-Plane-Illumination Raman Imaging. J. Raman Spectrosc. 2010, 41, 1099–1101. [Google Scholar] [CrossRef]
- Dieing, T.; Hollricher, O.; Toporski, J. Confocal Raman Microscopy; Springer Series in Optical Sciences; Springer: Berlin/Heidelberg, Germany, 2011; Volume 158, ISBN 978-3-642-12521-8. [Google Scholar]
- Everall, N.J. Depth Profiling with Confocal Raman Microscopy, Part II. Spectroscopy 2004, 19, 22–27. [Google Scholar]
- Tomba, J.P.; Eliçab, G.E.; de la Paz Miguel, M.; Perez, C.J. Depth-Profiling by Confocal Raman Microscopy (CRM): Data Correction by Numerical Techniques. Appl. Spectrosc. 2011, 65, 342–348. [Google Scholar] [CrossRef]
- Adar, F.; Lee, E.; Mamedov, S.; Whitley, A. Experimental Evaluation of the Depth Resolution of a Raman Microscope. Microsc. Microanal. 2010, 16, 360–361. [Google Scholar] [CrossRef] [Green Version]
- Everall, N.; Lapham, J.; Adar, F.; Whitley, A.; Lee, E.; Mamedov, S. Optimizing Depth Resolution in Confocal Raman Microscopy: A Comparison of Metallurgical, Dry Corrected, and Oil Immersion Objectives. Appl. Spectrosc. 2007, 61, 251–259. [Google Scholar] [CrossRef]
- Everall, N.J. Confocal Raman Microscopy: Why the Depth Resolution and Spatial Accuracy Can Be Much Worse Than You Think. Appl. Spectrosc. 2000, 54, 1515–1520. [Google Scholar] [CrossRef]
- Bandekar, J. Amide Modes and Protein Conformation. Biochim. Biophys. Acta Protein Struct. Mol. Enzymol. 1992, 1120, 123–143. [Google Scholar] [CrossRef]
- Blennow, K.; Mattsson, N.; Schöll, M.; Hansson, O.; Zetterberg, H. Amyloid Biomarkers in Alzheimer’s Disease. Trends Pharmacol. Sci. 2015, 36, 297–309. [Google Scholar] [CrossRef]
- Hansson, O.; Lehmann, S.; Otto, M.; Zetterberg, H.; Lewczuk, P. Advantages and Disadvantages of the Use of the CSF Amyloid β (Aβ) 42/40 Ratio in the Diagnosis of Alzheimer’s Disease. Alz. Res. Ther. 2019, 11, 34. [Google Scholar] [CrossRef] [PubMed]
- Lopes, J.; Correia, M.; Martins, I.; Henriques, A.G.; Delgadillo, I.; da Cruz e Silva, O.; Nunes, A. FTIR and Raman Spectroscopy Applied to Dementia Diagnosis Through Analysis of Biological Fluids. JAD 2016, 52, 801–812. [Google Scholar] [CrossRef]
- Ryzhikova, E.; Ralbovsky, N.M.; Sikirzhytski, V.; Kazakov, O.; Halamkova, L.; Quinn, J.; Zimmerman, E.A.; Lednev, I.K. Raman Spectroscopy and Machine Learning for Biomedical Applications: Alzheimer’s Disease Diagnosis Based on the Analysis of Cerebrospinal Fluid. Spectrochim. Acta Part A Mol. Biomol. Spectrosc. 2021, 248, 119188. [Google Scholar] [CrossRef]
- Klener, J.; Hofbauerová, K.; Bartoš, A.; Říčný, J.; Řípová, D.; Kopecký, V. Instability of Cerebrospinal Fluid after Delayed Storage and Repeated Freezing: A Holistic Study by Drop Coating Deposition Raman Spectroscopy. Clin. Chem. Lab. Med. 2014, 52, 657–664. [Google Scholar] [CrossRef]
- Bonnier, F.; Baker, M.J.; Byrne, H.J. Vibrational Spectroscopic Analysis of Body Fluids: Avoiding Molecular Contamination Using Centrifugal Filtration. Anal. Methods 2014, 6, 5155. [Google Scholar] [CrossRef] [Green Version]
- Guo, C.; Guo, X.; Chu, W.; Jiang, N.; Li, H. Spectroscopic Study of Conformation Changes of Bovine Serum Albumin in Aqueous Environment. Chin. Chem. Lett. 2019, 30, 1302–1306. [Google Scholar] [CrossRef]
- Vo-Dinh, T. Basic Instrumentation in Photonics, 2nd ed.; CRC Press: Boca Raton, FL, USA, 2014; ISBN 978-0-429-13920-8. [Google Scholar]
- Arcoptix Website. Available online: http://www.arcoptix.com/index.htm (accessed on 3 May 2022).
- Dutch Diamond Group Website. Available online: https://www.dd-technologies.com/ (accessed on 3 May 2022).
- Kerr, L.T.; Byrne, H.J.; Hennelly, B.M. Optimal Choice of Sample Substrate and Laser Wavelength for Raman Spectroscopic Analysis of Biological Specimen. Anal. Methods 2015, 7, 5041–5052. [Google Scholar] [CrossRef] [Green Version]
- Jayawardhana, S.; Rosa, L.; Buividas, R.; Stoddart, P.R.; Juodkazis, S. Light Enhancement in Surface-Enhanced Raman Scattering at Oblique Incidence. Photonic. Sens. 2012, 2, 283–288. [Google Scholar] [CrossRef] [Green Version]


| Peak (cm−1) | y-Intercept (a.u.) | Slope (a.u.) (cm) | R2 | LoD (M) |
|---|---|---|---|---|
| 1040 | 1.253 ± 0.011 | 0.3367 ± 0.0037 | 0.9988 | 0.0454 |
| 1120 | 1.116 ± 0.014 | 0.5142 ± 0.0046 | 0.9992 | 0.0297 |
| 1314 | 1.100 ± 0.011 | 0.3541 ± 0.0036 | 0.9990 | 0.0431 |
| 1416 | 1.253 ± 0.011 | 0.4485 ± 0.0039 | 0.9993 | 0.0341 |
| Peak (cm−1) | y-Intercept (Counts) | Slope (cm) | R2 | LoD (M) |
|---|---|---|---|---|
| 856 | 310 ± 250 | 1411 ± 81 | 0.97 | 0.05 |
| 1043 | 117 ± 70 | 383 ± 23 | 0.97 | 0.18 |
| 1086 | 103 ± 63 | 293 ± 20 | 0.96 | 0.24 |
Publisher’s Note: MDPI stays neutral with regard to jurisdictional claims in published maps and institutional affiliations. |
© 2022 by the authors. Licensee MDPI, Basel, Switzerland. This article is an open access article distributed under the terms and conditions of the Creative Commons Attribution (CC BY) license (https://creativecommons.org/licenses/by/4.0/).
Share and Cite
Arévalo, L.A.; O’Brien, S.A.; Lopez, E.; Singh, G.P.; Seifert, A. Design and Development of a Bimodal Optical Instrument for Simultaneous Vibrational Spectroscopy Measurements. Int. J. Mol. Sci. 2022, 23, 6834. https://doi.org/10.3390/ijms23126834
Arévalo LA, O’Brien SA, Lopez E, Singh GP, Seifert A. Design and Development of a Bimodal Optical Instrument for Simultaneous Vibrational Spectroscopy Measurements. International Journal of Molecular Sciences. 2022; 23(12):6834. https://doi.org/10.3390/ijms23126834
Chicago/Turabian StyleArévalo, Laura A., Stephen A. O’Brien, Eneko Lopez, Gajendra Pratap Singh, and Andreas Seifert. 2022. "Design and Development of a Bimodal Optical Instrument for Simultaneous Vibrational Spectroscopy Measurements" International Journal of Molecular Sciences 23, no. 12: 6834. https://doi.org/10.3390/ijms23126834
APA StyleArévalo, L. A., O’Brien, S. A., Lopez, E., Singh, G. P., & Seifert, A. (2022). Design and Development of a Bimodal Optical Instrument for Simultaneous Vibrational Spectroscopy Measurements. International Journal of Molecular Sciences, 23(12), 6834. https://doi.org/10.3390/ijms23126834