
5-Fluorouracil Treatment of CT26 Colon Cancer Is Compromised by Combined Therapy with IMMODIN

 ,
,  ,
, 
 , , ,
, , ,
Abstract
:1. Introduction
2. Results
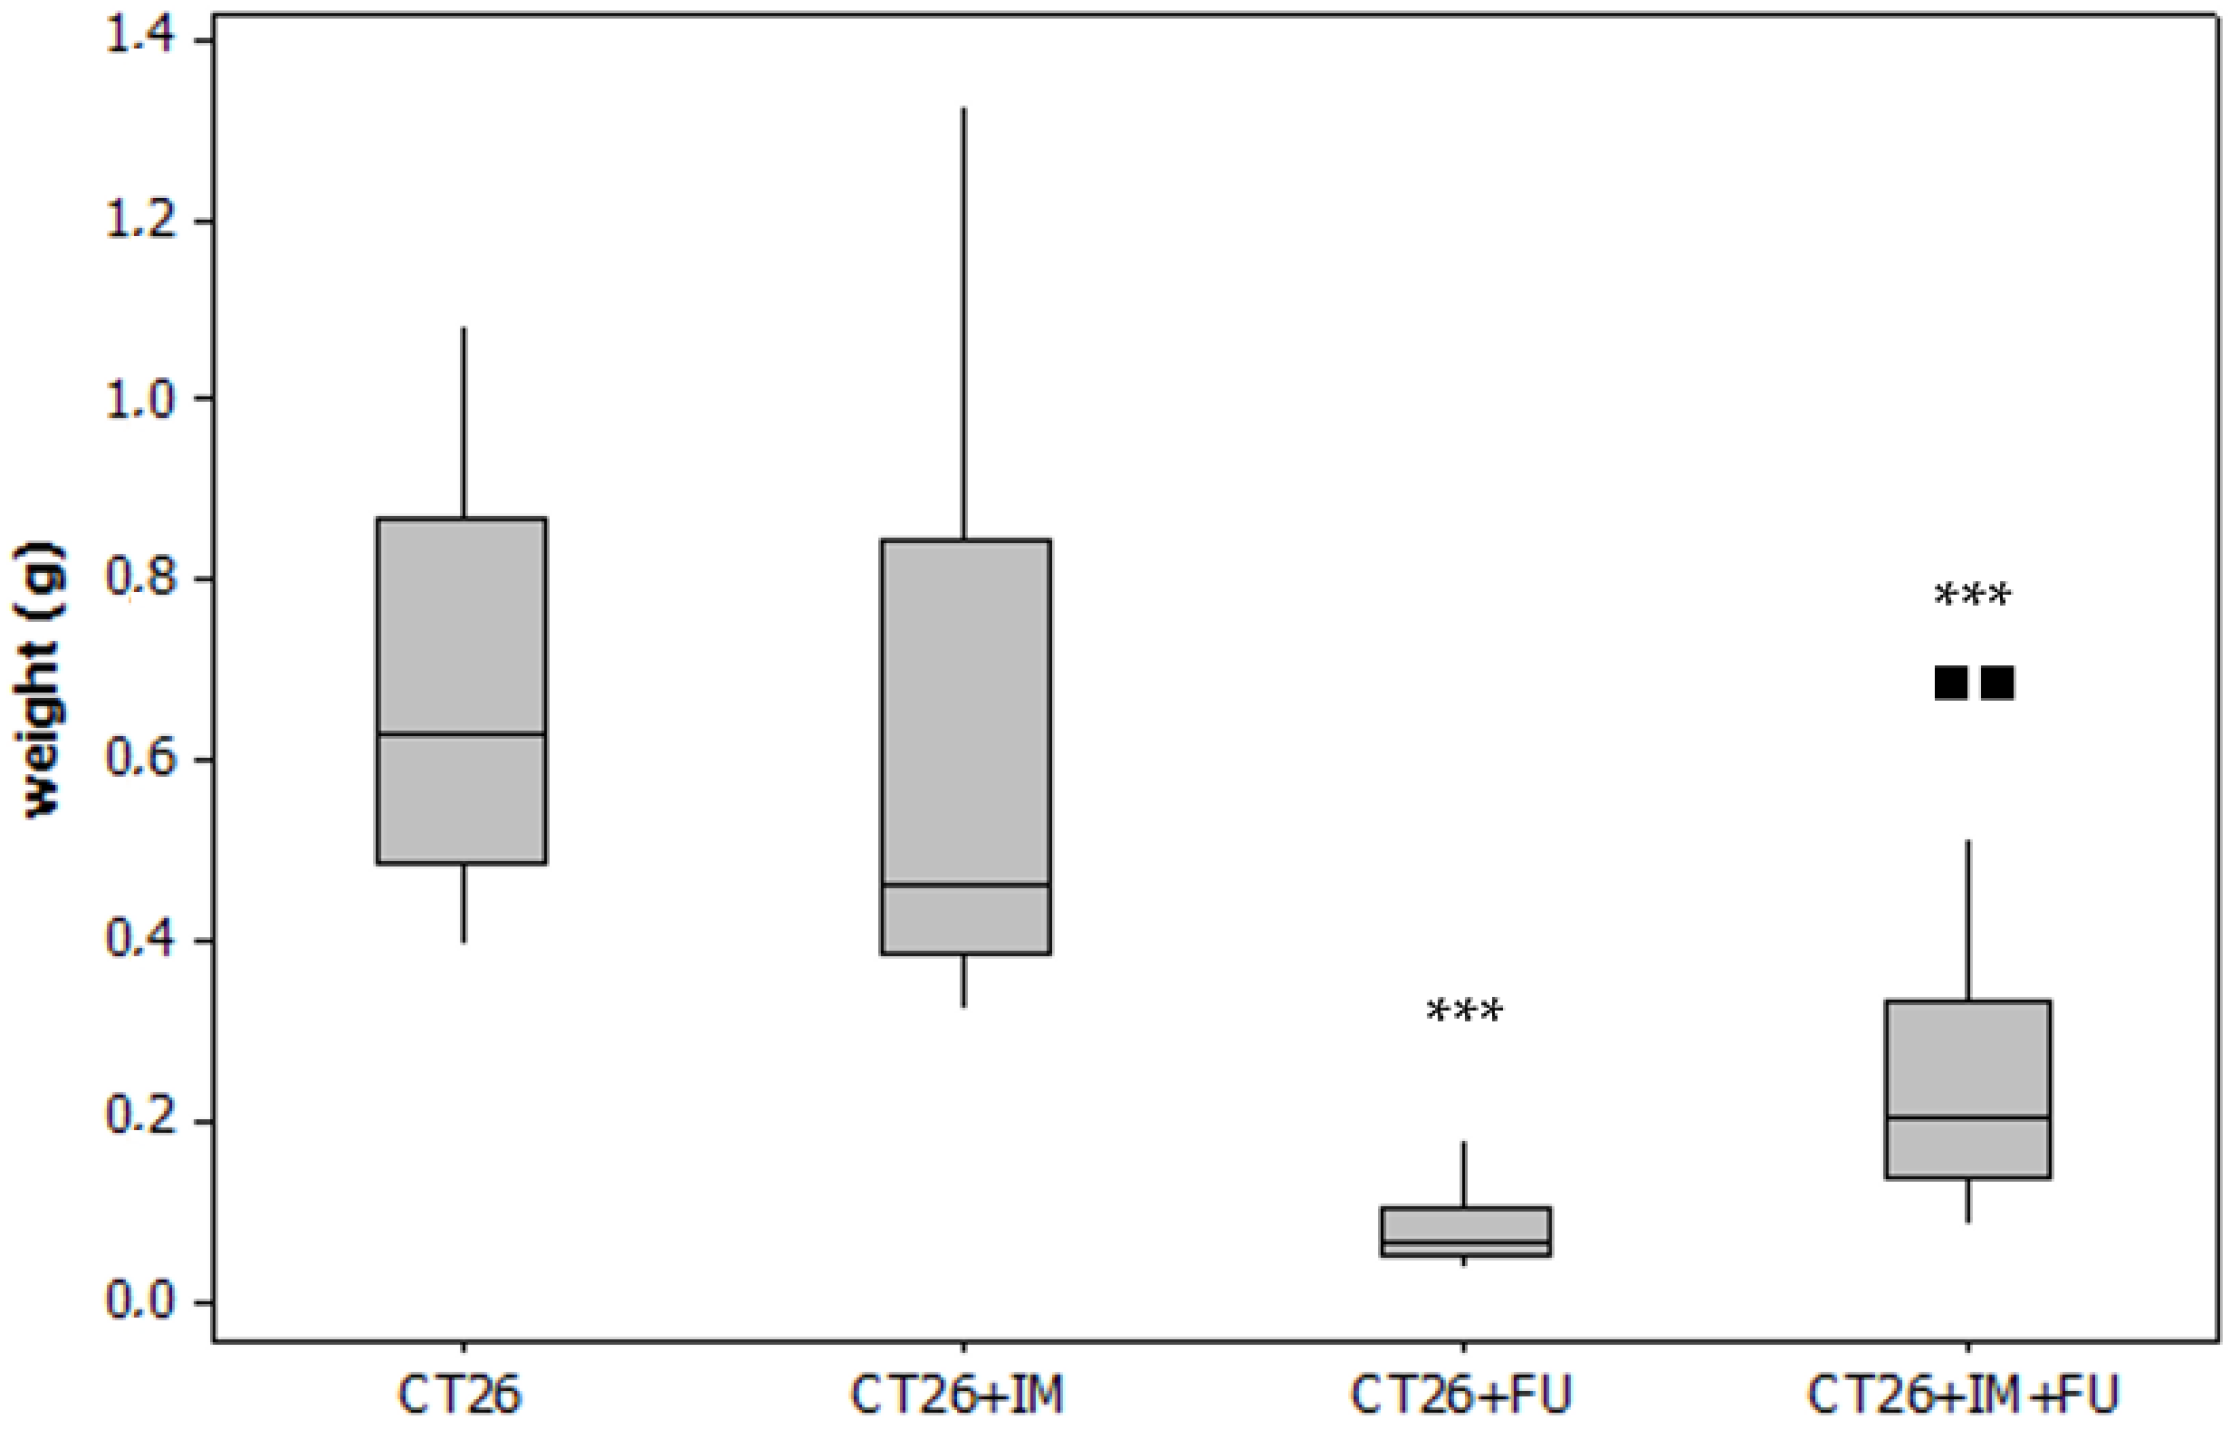
2.1. Tumour Weight
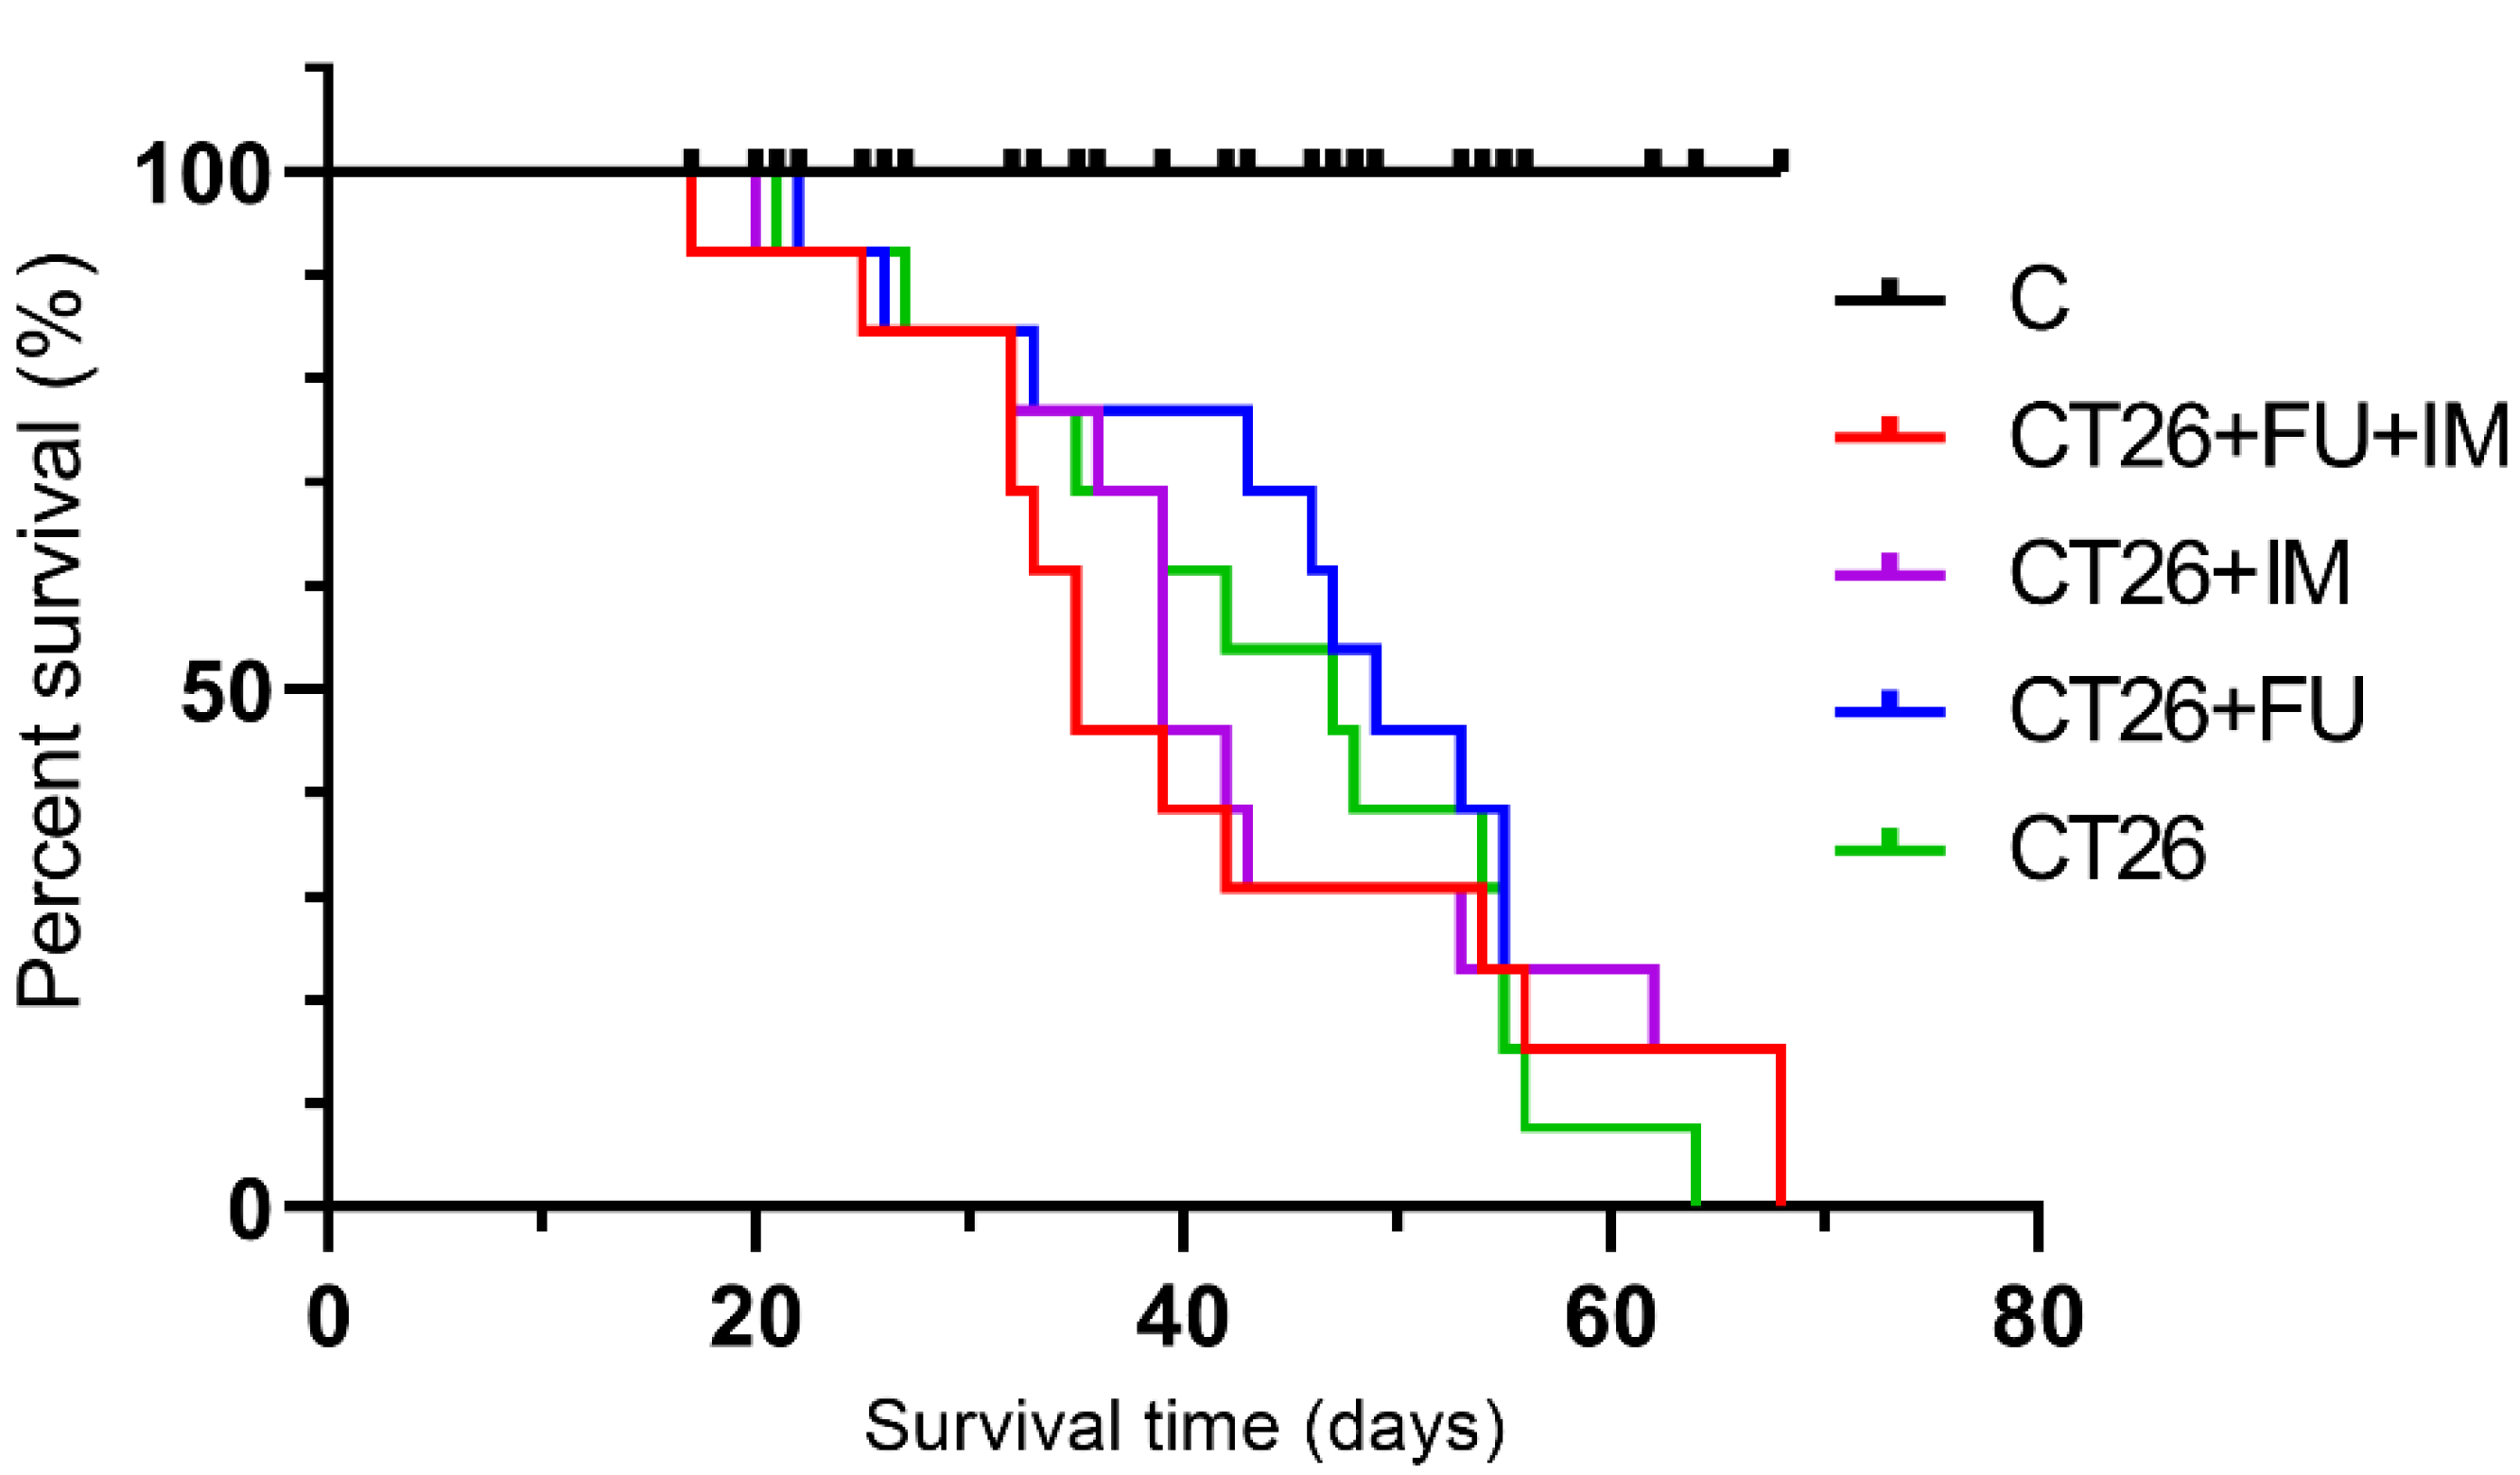
2.2. Animal Survival
2.3. Analysis of Hematological Parameters
2.4. Serum Biochemical Parameters
2.5. Flow Cytometric Analysis of a Single-Cell Suspension from Tumour Tissue
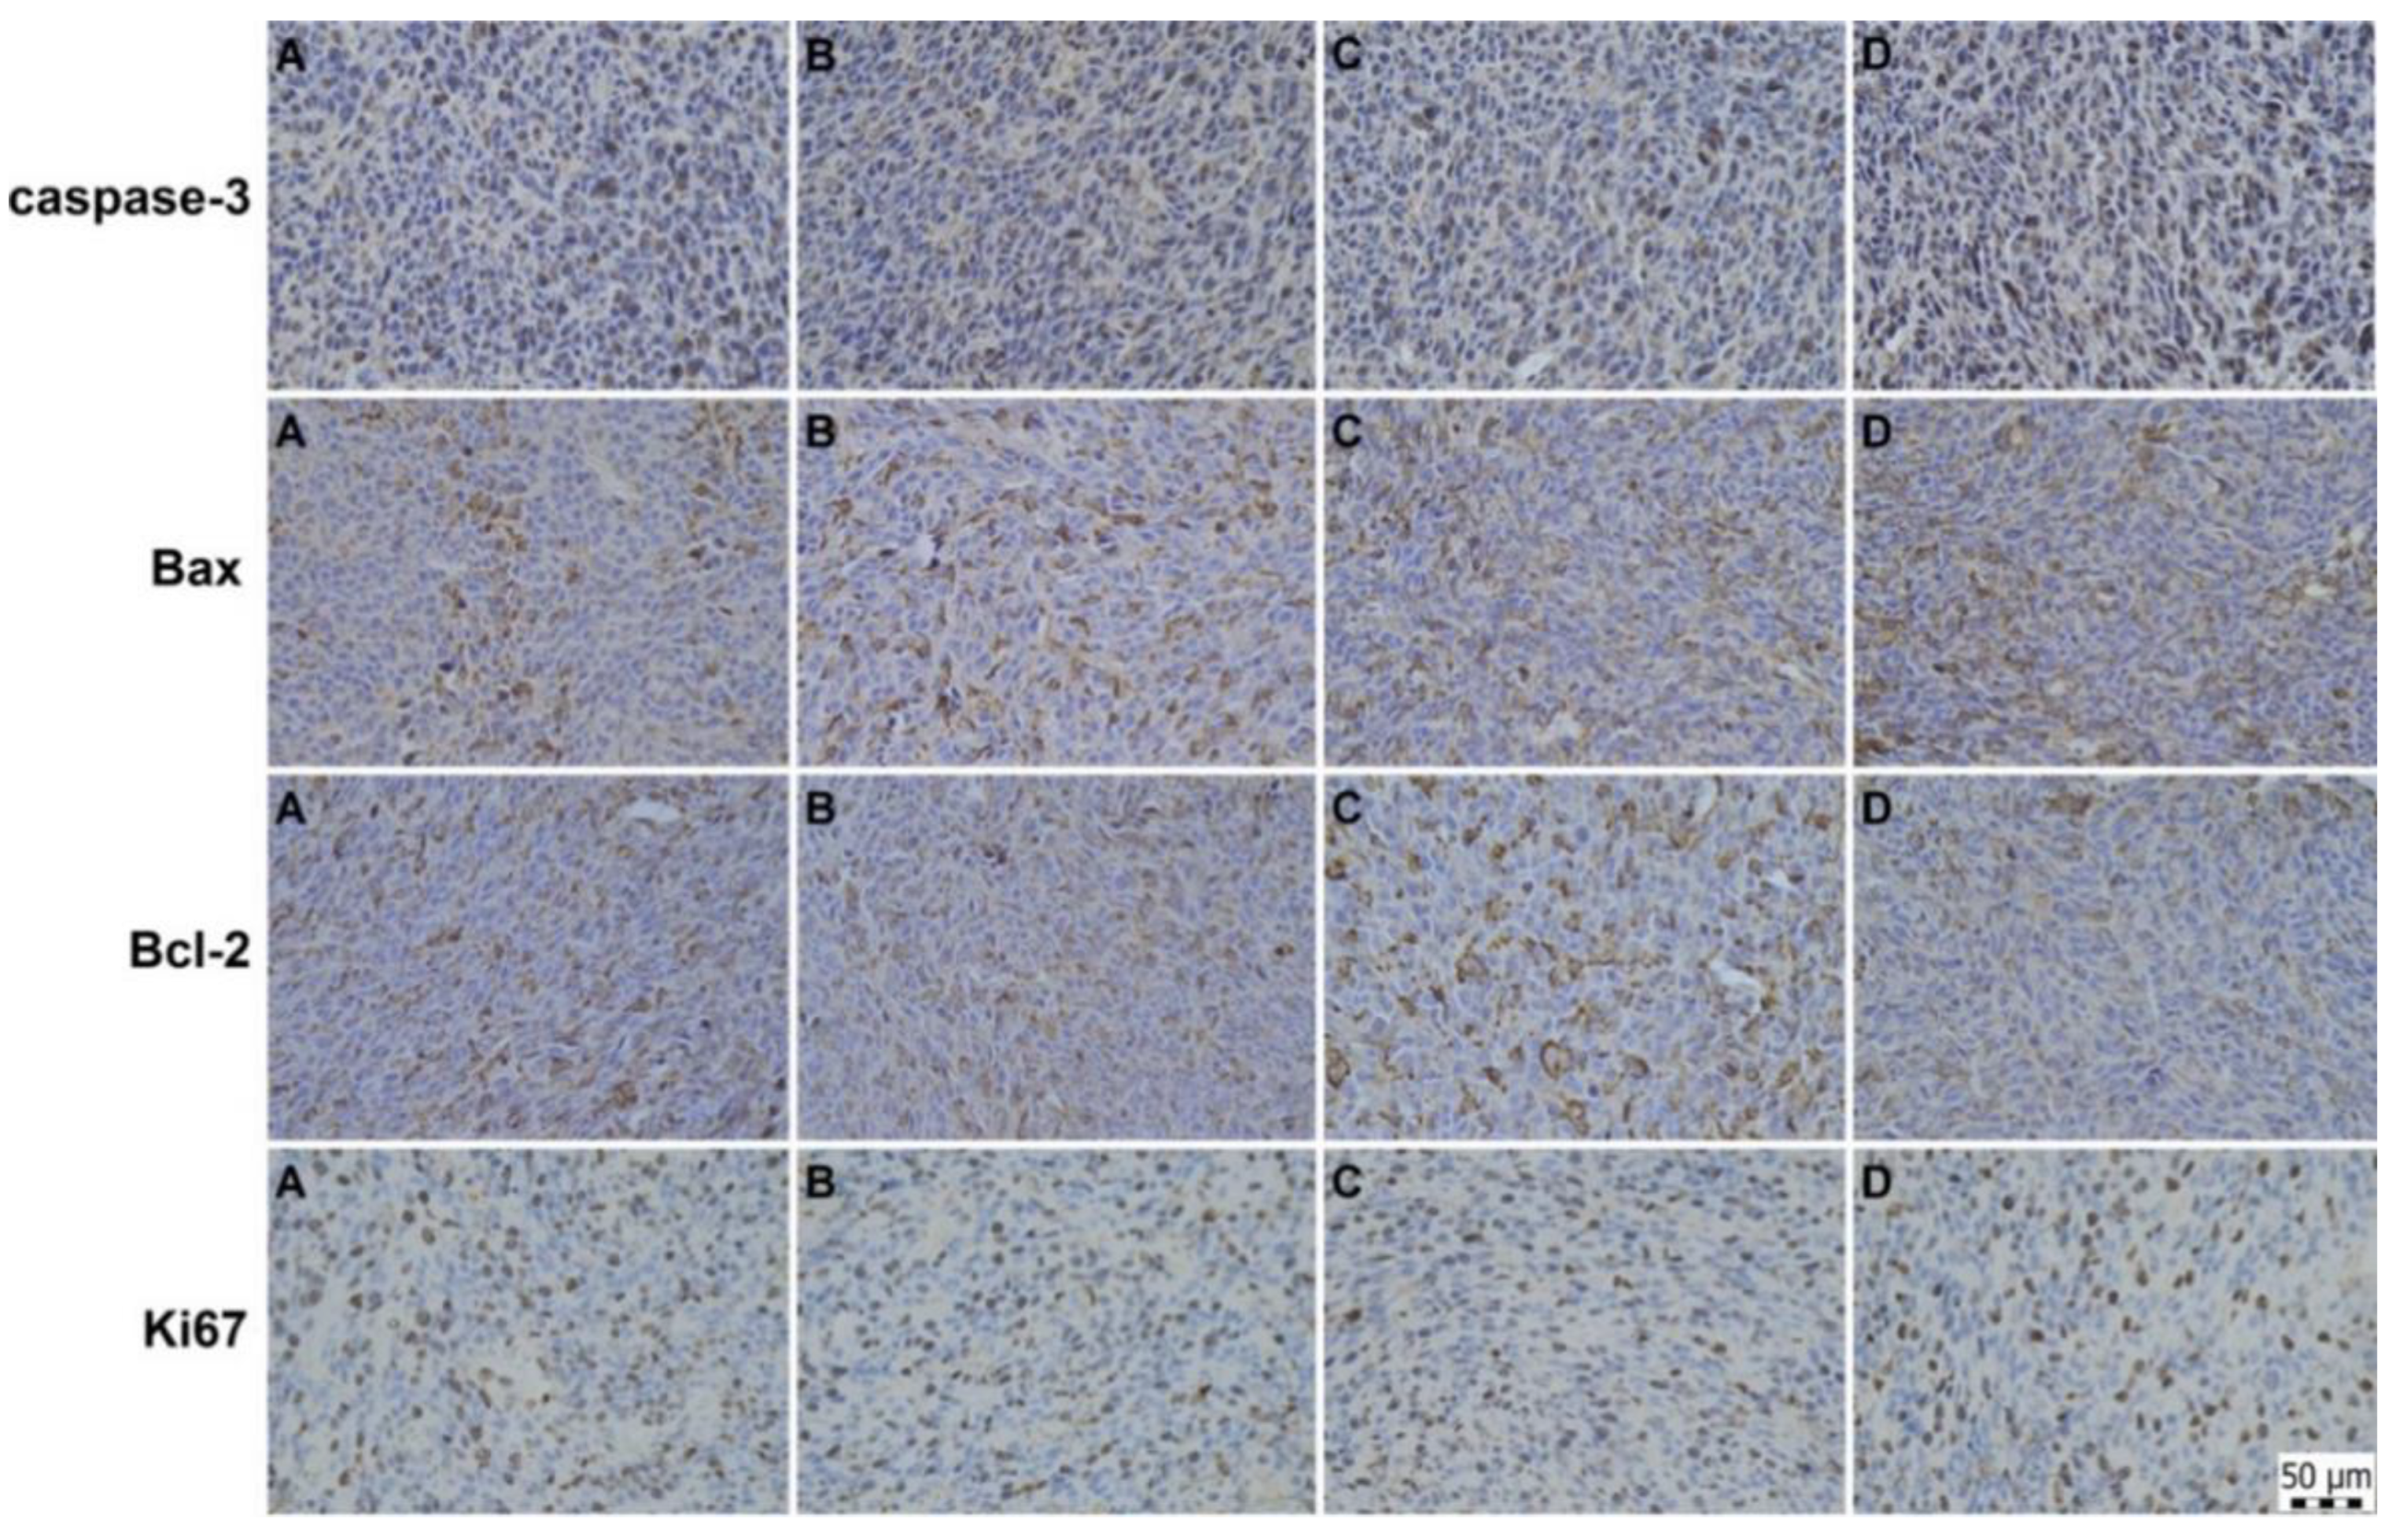
2.6. Immunohistochemical and Histopathological Analyses of Primary Tumour Tissue
3. Discussion
4. Materials and Methods
4.1. Reagents
4.2. Cell Line
4.3. Animal Model, Cancer Cell Inoculation and Experimental Design/Drug Treatment
4.4. Tumour Weight, Tumour Volume, and Animal Survival
4.5. Blood and Serum Analysis
4.6. Flow Cytometric Analysis of a Single-Cell Suspension from Tumour Tissue
4.7. Histopathological Analysis of Tumour Sections
4.8. Histopathological Analysis of Tumour Sections
5. Conclusions
Author Contributions
Funding
Institutional Review Board Statement
Acknowledgments
Conflicts of Interest
References
- Sung, H.; Ferlay, J.; Siegel, R.L.; Laversanne, M.; Soerjomataram, I.; Jemal, A.; Bray, F. Global cancer statistics 2020: GLOBOCAN estimates of incidence and mortality worldwide for 36 cancers in 185 countries. CA Cancer J. Clin. 2021, 71, 209–249. [Google Scholar] [CrossRef] [PubMed]
- ECIS. European Cancer Information System. 2020. Available online: https://ecis.jrc.ec.europa.eu/ (accessed on 1 May 2022).
- Longley, D.B.; Harkin, D.P.; Johnston, P.G. 5-Fluorouracil: Mechanisms of action and clinical strategies. Nat. Rev. Cancer 2003, 3, 330–338. [Google Scholar] [CrossRef] [PubMed]
- Heidelberger, C.; Chaudhuri, N.K.; Danneberg, P.; Mooren, D.; Griesbach, L.; Duschinsky, R.; Schnitzer, R.J.; Pleven, E.; Scheiner, J. Fluorinated pyrimidines, a new class of tumour-inhibitory compounds. Nature 1957, 179, 663–666. [Google Scholar] [CrossRef]
- Douillard, J.Y.; Siena, S.; Cassidy, J.; Tabernero, J.; Burkes, R.; Barugel, M.; Humblet, Y.; Bodoky, G.; Cunningham, D.; Jassem, J.; et al. Randomized, phase III trial of panitumumab with infusional fluorouracil, leucovorin, and oxaliplatin (FOLFOX4) versus FOLFOX4 alone as first-line treatment in patients with previously untreated metastatic colorectal cancer: The PRIME study. J. Clin. Oncol. 2010, 28, 4697–4705. [Google Scholar] [CrossRef]
- Aronson, J.K. Fluorouracil. In Meyler’s Side Effects of Drugs, 16th ed.; Aronson, J.K., Ed.; Elsevier: Berlin, Germany, 2016; pp. 382–394. [Google Scholar]
- Vyas, D.; Laput, G.; Vyas, A.K. Chemotherapy-enhanced inflammation may lead to the failure of therapy and metastasis. Oncol. Targets Ther. 2014, 7, 1015–1023. [Google Scholar] [CrossRef] [Green Version]
- Lee, C.S.; Ryan, E.J.; Doherty, G.A. Gastro-intestinal toxicity of chemotherapeutics in colorectal cancer: The role of inflammation. World J. Gastroenterol. 2014, 20, 3751–3761. [Google Scholar] [CrossRef] [PubMed]
- Fujisawa, T.; Yamaguchi, Y.; Kimura, H.; Arita, M.; Baba, M.; Shiba, M. Adjuvant immunotherapy of primary resected lung cancer with transfer factor. Cancer 1984, 54, 663–669. [Google Scholar] [CrossRef]
- Wagner, G.; Knapp, W.; Gitsch, E.; Selander, S. Transfer factor for adjuvant immunotherapy in cervical cancer. Cancer Detect. Prev. Suppl. 1987, 1, 373–376. [Google Scholar] [PubMed]
- Pilotti, V.; Mastrorilli, M.; Pizza, G.; De Vinci, C.; Busutti, L.; Palareti, A.; Gozzetti, G.; Cavallari, A. Transfer factor as an adjuvant to non-small cell lung cancer (NSCLC) therapy. Biotherapy 1996, 9, 117–121. [Google Scholar] [CrossRef]
- Tulina, D.; Chan, M.K.S.; Michele, W.B.F.; Pan, S.Y. Transfer factors or dialyzable leukocyte extracts as immunomodulating peptides: A conceptual review on broad spectrum of therapeutic areas, Immunologic and Clinical Responses, Trends and Perspectives. Int. J. Immunol. Immunother. 2019, 6, 39. [Google Scholar] [CrossRef] [Green Version]
- Lutter, L.; Hoytema van Konijnenburg, D.P.; Brand, E.C.; Oldenburg, B.; van Wijk, F. The elusive case of human intraepithelial T cells in gut homeostasis and inflammation. Nat. Rev. Gastroenterol. Hepatol. 2018, 15, 637–649. [Google Scholar] [CrossRef] [PubMed]
- van Wijk, F.; Cheroutre, H. Mucosal T cells in gut homeostasis and inflammation. Expert Rev. Clin. Immunol. 2010, 6, 559–566. [Google Scholar] [CrossRef] [PubMed] [Green Version]
- Xia, A.; Zhang, Y.; Xu, J.; Yin, T.; Lu, X.J. T cell dysfunction in cancer immunity and immunotherapy. Front. Immunol. 2019, 10, 1719. [Google Scholar] [CrossRef] [Green Version]
- Fudenberg, H.H. Transfer factor: Past, present and future. Annu. Rev. Pharmacol. Toxicol. 1989, 29, 475–516. [Google Scholar] [CrossRef]
- Zuniga-Navarrete, F.; Zavala-Meneses, S.G.; Zelnik, V.; Kopacek, J.; Skultety, L. Initial proteomic characterization of IMMODIN, commercially available dialysable leukocytes extract. Chem. Pap. 2021, 75, 1959–1968. [Google Scholar] [CrossRef]
- Hana, I.; Vrubel, J.; Pekarek, J.; Cech, K. The influence of age on transfer factor treatment of cellular immunodeficiency, chronic fatigue syndrome and/or chronic viral infections. Biotherapy 1996, 9, 91–95. [Google Scholar] [CrossRef] [PubMed]
- Arnaudov, A.; Kostova, Z. Dialysable leukocyte extracts in immunotherapy. Biotechnol. Biotechnol. Equip. 2015, 29, 1017–1023. [Google Scholar] [CrossRef]
- Demečková, V.; Solár, P.; Hrčková, G.; Mudroňová, D.; Bojková, B.; Kassayová, M.; Gancarčiková, S. Immodin and its immune system supportive role in paclitaxel therapy of 4T1 mouse breast cancer. Biomed. Pharmacother. 2017, 89, 245–256. [Google Scholar] [CrossRef]
- Gmeiner, W.H. Fluoropyrimidine modulation of the anti-tumour immune response-prospects for improved colorectal cancer treatment. Cancers 2020, 12, 1641. [Google Scholar] [CrossRef]
- Galluzzi, L.; Buqué, A.; Kepp, O.; Zitvogel, L.; Kroemer, G. Immunological effects of conventional chemotherapy and targeted anticancer agents. Cancer Cell 2015, 28, 690–714. [Google Scholar] [CrossRef] [Green Version]
- Fang, H.; Ang, B.; Xu, X.; Huang, X.; Wu, Y.; Sun, Y.; Wang, W.; Li, N.; Cao, X.; Wan, T. TLR4 is essential for dendritic cell activation and anti-tumour T-cell response enhancement by DAMPs released from chemically stressed cancer cells. Cell Mol. Immunol. 2014, 11, 150–159. [Google Scholar] [CrossRef] [Green Version]
- Vincent, J.; Mignot, G.; Chalmin, F.; Ladoire, S.; Bruchard, M.; Chevriaux, A.; Martin, F.; Apetoh, L.; Rébé, C.; Ghiringhelli, F. 5-Fluorouracil selectively kills tumour-associated myeloid-derived suppressor cells resulting in enhanced T cell-dependent antitumour immunity. Cancer Res. 2010, 70, 3052–3061. [Google Scholar] [CrossRef] [PubMed] [Green Version]
- Chang, C.T.; Ho, T.Y.; Lin, H.; Liang, J.A.; Huang, H.C.; Li, C.C.; Lo, H.Y.; Wu, S.L.; Huang, Y.F.; Hsiang, C.Y. 5-Fluorouracil induced intestinal mucositis via nuclear factor-κB activation by transcriptomic analysis and in vivo bioluminescence imaging. PLoS ONE 2012, 7, e31808. [Google Scholar] [CrossRef] [PubMed] [Green Version]
- Li, H.L.; Lu, L.; Wang, X.S.; Qin, L.Y.; Wang, P.; Qiu, S.P.; Wu, H.; Huang, F.; Zhang, B.B.; Shi, H.L.; et al. Alteration of gut microbiota and inflammatory cytokine/chemokine profiles in 5-fluorouracil induced intestinal mucositis. Front. Cell Infect. Microbiol. 2017, 7, 455. [Google Scholar] [CrossRef] [PubMed]
- Wu, Y.; Deng, Z.; Wang, H.; Ma, W.; Zhou, C.; Zhang, S. Repeated cycles of 5-fluorouracil chemotherapy impaired anti-tumour functions of cytotoxic T cells in a CT26 tumour-bearing mouse model. BMC Immunol. 2016, 17, 29. [Google Scholar] [CrossRef]
- McMillin, D.W.; Negri, J.M.; Mitsiades, C.S. The role of tumour-stromal interactions in modifying drug response: Challenges and opportunities. Nat. Rev. Drug Discov. 2013, 12, 217–228. [Google Scholar] [CrossRef]
- Wei, C.; Yang, C.; Wang, S.; Shi, D.; Zhang, C.; Lin, X.; Xiong, B. M2 macrophages confer resistance to 5-fluorouracil in colorectal cancer through the activation of CCL22/PI3K/AKT signaling. Oncol. Targets Ther. 2019, 12, 3051–3063. [Google Scholar] [CrossRef] [Green Version]
- Quail, D.F.; Joyce, J.A. Microenvironmental regulation of tumour progression and metastasis. Nat. Med. 2013, 19, 1423–1437. [Google Scholar] [CrossRef]
- O’Sullivan, C.; Lewis, C.E.; Harris, A.L.; McGee, J.O. Secretion of epidermal growth factor by macrophages associated with breast carcinoma. Lancet 1993, 342, 148–149. [Google Scholar] [CrossRef]
- Shojaei, F.; Zhong, C.; Wu, X.; Yu, L.; Ferrara, N. Role of myeloid cells in tumour angiogenesis and growth. Trends Cell Biol. 2008, 18, 372–378. [Google Scholar] [CrossRef]
- Kessenbrock, K.; Plaks, V.; Werb, Z. Matrix metalloproteinases: Regulators of the tumour microenvironment. Cell 2010, 141, 52–67. [Google Scholar] [CrossRef] [Green Version]
- Hourani, T.; Holden, J.A.; Li, W.; Lenzo, J.C.; Hadjigol, S.; O’Brien-Simpson, N.M. Tumour associated macrophages: Origin, recruitment, phenotypic diversity, and targeting. Front. Oncol. 2021, 11, 8365. [Google Scholar] [CrossRef]
- Liu, Y.; Cao, X. The origin and function of tumour-associated macrophages. Cell. Mol. Immunol. 2015, 12, 1–4. [Google Scholar] [CrossRef] [Green Version]
- Scharping, N.E.; Menk, A.V.; Moreci, R.S.; Whetstone, R.D.; Dadey, R.E.; Watkins, S.C.; Ferris, R.L.; Delgoffe, G.M. The tumour microenvironment represses T cell mitochondrial biogenesis to drive intratumoural T cell metabolic insufficiency and dysfunction. Immunity 2016, 45, 701–703. [Google Scholar] [CrossRef]
- Gonzalez, H.; Hagerling, C.; Werb, Z. Roles of the immune system in cancer: From tumour initiation to metastatic progression. Genes Dev. 2018, 32, 1267–1284. [Google Scholar] [CrossRef] [Green Version]
- Bruchard, M.; Mignot, G.; Derangère, V.; Chalmin, F.; Chevriaux, A.; Végran, F.; Boireau, W.; Simon, B.; Ryffel, B.; Connat, J.L. Chemotherapy-triggered cathepsin B release in myeloid-derived suppressor cells activates the Nlrp3 inflammasome and promotes tumour growth. Nat. Med. 2013, 19, 57–64. [Google Scholar] [CrossRef]
- Li, X.; Slayton, W.B. Molecular mechanisms of platelet and stem cell rebound after 5-fluorouracil treatment. Exp. Hematol. 2013, 41, 635–645.e633. [Google Scholar] [CrossRef]
- Studentova, H.; Vitaskova, D.; Sramek, V.; Indrakova, J.; Adam, T.; Juranova, J.; Petrova, P.; Krcmova, L.; Peskova, E.; Solichova, D.; et al. Correlations of neutrophil-to-lymphocyte, lymphocyte-to-monocyte and platelet-to-lymphocyte ratios with biomarkers of atherosclerosis risk and inflammatory response in patients with a history of breast cancer. Pteridines 2015, 26, 161–172. [Google Scholar] [CrossRef]
- Haram, A.; Boland, M.R.; Kelly, M.E.; Bolger, J.C.; Waldron, R.M.; Kerin, M.J. The prognostic value of neutrophil-to-lymphocyte ratio in colorectal cancer: A systematic review. J. Surg. Oncol. 2017, 115, 470–479. [Google Scholar] [CrossRef]
- Tan, D.; Fu, Y.; Tong, W.; Li, F. Prognostic significance of lymphocyte to monocyte ratio in colorectal cancer: A meta-analysis. Int. J. Surg. 2018, 55, 128–138. [Google Scholar] [CrossRef]
- Maor, Y.; Malnick, S. Liver injury induced by anticancer chemotherapy and radiation therapy. Int. J. Hepatol. 2013, 2013, 815105. [Google Scholar] [CrossRef] [PubMed] [Green Version]
- LiverTox: Clinical and Research Information on Drug-Induced Liver Injury [Internet]. Bethesda (MD): National Institute of Diabetes and Digestive and Kidney Diseases; 2012. Fluorouracil. [Updated 2 February 2018]. Available online: https://www.ncbi.nlm.nih.gov/books/NBK548781/ (accessed on 5 May 2022).
- Guicciardi, M.E.; Gores, G.J. Apoptosis: A mechanism of acute and chronic liver injury. Gut 2005, 54, 1024–1033. [Google Scholar] [CrossRef] [PubMed] [Green Version]
- Cao, L.; Quan, X.B.; Zeng, W.J.; Yang, X.O.; Wang, M.J. Mechanism of hepatocyte apoptosis. J. Cell Death 2016, 9, 19–29. [Google Scholar] [CrossRef] [PubMed] [Green Version]
- Aroor, A.R.; James, T.T.; Jackson, D.E.; Shukla, S.D. Differential changes in MAP kinases, histone modifications, and liver injury in rats acutely treated with ethanol. Alcohol Clin Exp. Res. 2010, 34, 1543–1551. [Google Scholar] [CrossRef] [Green Version]
- Panasiuk, A.; Dzieciol, J.; Panasiuk, B.; Prokopowicz, D. Expression of p53, Bax and Bcl-2 proteins in hepatocytes in non-alcoholic fatty liver disease. World J. Gastroenterol. 2006, 12, 6198–6202. [Google Scholar] [CrossRef]
- Hector, S.; Prehn, J.H. Apoptosis signaling proteins as prognostic biomarkers in colorectal cancer: A review. Biochim. Biophys. Acta 2009, 1795, 117–129. [Google Scholar] [CrossRef]
- Sturm, I.; Köhne, C.H.; Wolff, G.; Petrowsky, H.; Hillebrand, T.; Hauptmann, S.; Lorenz, M.; Dörken, B.; Daniel, P.T. Analysis of the p53/BAX pathway in colorectal cancer: Low BAX is a negative prognostic factor in patients with resected liver metastases. J. Clin. Oncol. 1999, 17, 1364–1374. [Google Scholar] [CrossRef]
- Zeestraten, E.C.; Benard, A.; Reimers, M.S.; Schouten, P.C.; Liefers, G.J.; van de Velde, C.J.; Kuppen, P.J. The prognostic value of the apoptosis pathway in colorectal cancer: A review of the literature on biomarkers identified by immunohistochemistry. Biomark. Cancer 2013, 5, 13–29. [Google Scholar] [CrossRef]
- Tsamandas, A.C.; Kardamakis, D.; Petsas, T.; Zolota, V.; Vassiliou, V.; Matatsoris, T.; Kalofonos, H.; Vagianos, C.E.; Scopa, C.D. Bcl-2, bax and p53 expression in rectal adenocarcinoma. Correlation with classic pathologic prognostic factors and patients’ outcome. In Vivo 2007, 21, 113–118. [Google Scholar]
- Katkoori, V.R.; Suarez-Cuervo, C.; Shanmugam, C.; Jhala, N.C.; Callens, T.; Messiaen, L.; Posey, J.; Bumpers, H.L.; Meleth, S.; Grizzle, W.E.; et al. Bax expression is a candidate prognostic and predictive marker of colorectal cancer. J. Gastrointest. Oncol. 2010, 1, 76–89. [Google Scholar] [CrossRef]
- Ramesh, P.; Medema, J.P. BCL-2 family deregulation in colorectal cancer: Potential for BH3 mimetics in therapy. Apoptosis 2020, 25, 305–320. [Google Scholar] [CrossRef] [PubMed] [Green Version]
- Zhou, S.; Huang, C.; Wei, Y. The metabolic switch and its regulation in cancer cells. Sci. China Life Sci. 2010, 53, 942–958. [Google Scholar] [CrossRef]
- Beloribi-Djefaflia, S.; Vasseur, S.; Guillaumond, F. Lipid metabolic reprogramming in cancer cells. Oncogenesis 2016, 5, e189. [Google Scholar] [CrossRef] [PubMed]
- Luo, X.; Cheng, C.; Tan, Z.; Li, N.; Tang, M.; Yang, L.; Cao, Y. Emerging roles of lipid metabolism in cancer metastasis. Mol. Cancer 2017, 16, 76. [Google Scholar] [CrossRef] [Green Version]
- DeBerardinis, R.J.; Chandel, N.S. Fundamentals of cancer metabolism. Sci. Adv. 2016, 2, e1600200. [Google Scholar] [CrossRef] [PubMed] [Green Version]
- Kopecka, J.; Godel, M.; Riganti, C. Cholesterol metabolism: At the crossroad between cancer cells and immune environment. Int. J. Biochem. Cell Biol. 2020, 129, 105876. [Google Scholar] [CrossRef]
- Rajora, M.A.; Zheng, G. Targeting SR-BI for cancer diagnostics, imaging and therapy. Front. Pharmacol. 2016, 7, 326. [Google Scholar] [CrossRef] [Green Version]
- Ganjali, S.; Banach, M.; Pirro, M.; Fras, Z.; Sahebkar, A. HDL and cancer–causality still needs to be confirmed? Update 2020. Semin. Cancer Biol. 2021, 73, 169–177. [Google Scholar] [CrossRef]
- Zeljkovic, A.; Vekic, J.; Mihajlovic, M.; Gojkovic, T.; Vladimirov, S.; Zeljkovic, D.; Spasojevic-Kalimanovska, V.; Trifunovic, B. Revealing the role of high-density lipoprotein in colorectal cancer. Int. J. Mol. Sci. 2021, 22, 3352. [Google Scholar] [CrossRef]
- Danilo, C.; Frank, P.G. Cholesterol and breast cancer development. Curr. Opin. Pharmacol. 2012, 12, 677–682. [Google Scholar] [CrossRef]
- Danilo, C.; Gutierrez-Pajares, J.L.; Mainieri, M.A.; Mercier, I.; Lisanti, M.P.; Frank, P.G. Scavenger receptor class B type I regulates cellular cholesterol metabolism and cell signaling associated with breast cancer development. Breast Cancer Res. 2013, 15, R87. [Google Scholar] [CrossRef] [PubMed]
- Lee, M.K.; Moore, X.L.; Fu, Y.; Al-Sharea, A.; Dragoljevic, D.; Fernandez-Rojo, M.A.; Parton, R.; Sviridov, D.; Murphy, A.J.; Chin-Dusting, J.P. High-density lipoprotein inhibits human M1 macrophage polarization through redistribution of caveolin-1. Br. J. Pharmacol. 2016, 173, 741–751. [Google Scholar] [CrossRef] [Green Version]
- Lee, J.J.; Beumer, J.H.; Chu, E. Therapeutic drug monitoring of 5-fluorouracil. Cancer Chemother. Pharmacol. 2016, 78, 447–464. [Google Scholar] [CrossRef]
- Heggie, G.D.; Sommadossi, J.P.; Cross, D.S.; Huster, W.J.; Diasio, R.B. Clinical pharmacokinetics of 5-fluorouracil and its metabolites in plasma, urine, and bile. Cancer Res. 1987, 47, 2203–2206. [Google Scholar] [PubMed]
- Bayne, L.J.; Vonderheide, R.H. Multicolor flow cytometric analysis of immune cell subsets in tumour-bearing mice. Cold Spring Harb. Protoc. 2013, 2013, 955–960. [Google Scholar] [CrossRef]
- Solár, P.; Hrčková, G.; Koptašíková, L.; Velebný, S.; Solárová, Z.; Bačkor, M. Murine breast carcinoma 4T1 cells are more sensitive to atranorin than normal epithelial NMuMG cells in vitro: Anticancer and hepatoprotective effects of atranorin in vivo. Chem. Biol. Interact. 2016, 250, 27–37. [Google Scholar] [CrossRef]
- Evans, J.P.; Winiarski, B.K.; Sutton, P.A.; Ressel, L.; Duckworth, C.A.; Pritchard, D.M.; Palmer, D.H.; Goldring, C.E.; Kitteringham, N.R. Development of an orthotopic syngeneic murine model of colorectal cancer for use in translational research. Lab. Anim. 2019, 53, 598–609. [Google Scholar] [CrossRef]
- Sato, Y.; Fu, Y.; Liu, H.; Lee, M.Y.; Shaw, M.H. Tumour-immune profiling of CT-26 and Colon 26 syngeneic mouse models reveals mechanism of anti-PD-1 response. BMC Cancer 2021, 21, 1222. [Google Scholar] [CrossRef]


| Total WBCs | C n = 6 | CT26 n = 10 | CT26 + IM n = 10 | CT26 + 5-FU n = 10 | CT26 + IM + 5-FU n = 10 |
|---|---|---|---|---|---|
| Total WBCs (×109/L) | 11.3 ± 0.7 | 7.2 ± 0.6 ** | 7.8 ± 0.6 ** | 9.1 ± 0.8 | 8.8 ± 0.5 ** |
| Monocytes (×109/L) | 0.30± 0.03 | 0.30 ± 0.04 | 0.40 ± 0.06 | 0.30 ± 0.05 | 0.40 ± 0.05 |
| Monocytes (%) | 3 ± 0 | 4 ± 0 | 5 ± 0 ** | 3 ± 0 | 4 ± 0 |
| Lymphocytes (×109/L) | 8.8 ± 0.5 | 4.9 ± 0.5 *** | 5.6 ± 0.5 *** | 7.0 ± 0.6 ▲▲▲ | 6.3 ± 0.4 ** |
| Lymphocytes (%) | 78 ± 1 | 69 ± 2 *** | 67 ± 1 *** | 77 ± 2 ▲▲▲ | 74 ± 2 |
| Granulocytes (×109/L) | 2.3 ± 0.2 | 2.0 ± 0.2 | 2.3 ± 0.2 | 1.8 ± 0.2 | 1.9 ± 0.1 |
| Granulocytes (%) | 19 ± 1 | 29 ± 2 *** | 28 ± 1 *** | 19 ± 1 ▲▲▲ | 22 ± 1 ▲▲▲ |
| NLR | 0.26 ± 0.03 | 0.44 ± 0.20 *** | 0.42 ± 0.10 *** | 0.25 ± 0.03 ▲▲▲ | 0.30 ± 0.06 ▲▲▲ |
| Platelets (×109/L) | 729 ± 110 | 448.5 ± 49.5 * | 279.3 ± 33.7 **▲ | 423.6 ± 67. 9 * | 446.9 ± 81. 9 * |
| PCT (%) | 0.5 ± 0.1 | 0.3 ± 0.0 | 0.2 ± 0.0 | 0.3 ± 0.1 | 0.3 ± 0.1 |
| PDW (%) | 16.0 ± 0.1 | 16.0 ± 0.1 | 16.0 ± 0.1 | 16.0 ± 0.1 | 16.0 ± 0.1 |
| RBC (×1012/L) | 13.7 ± 0.2 | 11.1 ± 0.2 *** | 11.2 ± 0.2 *** | 13.1 ± 0.5 ▲▲ | 13.0 ± 0.4 ▲▲ |
| HCT (%) | 71 ± 1 | 60 ± 1 *** | 60 ± 0 *** | 72 ± 3 ▲▲ | 73 ± 3 ▲▲ |
| HGB (g/dL) | 22.6 ± 0.4 | 18.2 ± 0.3 *** | 18.1 ± 0.4 *** | 22.1 ± 1.0 ▲▲▲ | 21.3 ± 0.7 ▲▲▲ |
| MCV (fL) | 56.7 ± 0.4 | 54.2 ± 0.2 ** | 53.8 ± 0.4 ** | 55.2 ± 0.4 ** | 55.9 ± 0.6 ▲▲ |
| RDW (%) | 15.7 ± 0.2 | 15.6 ± 0.1 | 15.3 ± 0.2 | 15.8 ± 0.1 | 15.5 ± 0.2 |
| MCHC (g/L) | 289.6 ± 2.1 | 303.1 ± 1.1 *** | 299.2 ± 1. 9 *** | 305.7 ± 2.0 *** | 293.3 ± 3.6 ▲▲▲ |
| MPV (fL) | 7.1 ± 0.2 | 7.4 ± 0.1 | 7.3 ± 0.2 | 7.7 ± 0.2 | 7.3 ± 0.2 |
| C A | CT26 B | CT26 + IM C | CT26 + 5-FU D | CT26 + IM + 5-FU E | Statistical Significance | |
|---|---|---|---|---|---|---|
| Total CH (mmol/l) | 4.24 ± 0.05 | 4.04 ± 0.10 | 4.42 ± 0.08 | 4.33 ± 0.09 | 4.65 ± 0.03 | B vs. E *** A vs. E * |
| LDL-CH (mmol/L) | 0.39 ± 0.01 | 1.40 ± 0.06 | 0.52 ± 0.04 | 0.48 ± 0.02 | 0.51 ± 0.02 | B vs. A, C, D, E *** A vs. C, E * |
| HDL-CH (mmol/L) | 0.99± 0.03 | 1.84 ± 0.02 | 1.90 ± 0.07 | 2.15 ± 0.07 | 2.11 ± 0.02 | A vs. B, C, D, E *** |
| TGC (mmol/L) | 2.24 ± 0.02 | 2.95 ± 0.19 | 3.35 ± 0.34 | 2.29 ± 0.04 | 2.35 ± 0.09 | B vs. A, D * Cvs. A, D, E *** |
| AST (μkat/L) | 2.15 ± 0.34 | 3.98 ± 0.07 | 3.82 ± 0.09 | 3.06 ± 0.19 | 3.78 ± 0.02 | B vs. D * A vs. B, C, E *** D vs. A * |
| ALT (μkat/L) | 1.66 ± 0.01 | 3.24 ± 0.99 | 2.23± 0.34 | 1.92 ± 0.49 | 2.27 ± 0.09 | A vs. E ** D vs. E * |
| ALP (μkat/L) | 3.05 ± 0.03 | 2.35 ± 0.31 | 2.44 ± 0.06 | 2.51 ± 0.13 | 2.41 ± 0.15 | A vs. C ** A vs. B, D, E * |
| Total-P (g/L) | 62.60 ± 0.32 | 60.27 ± 4.81 | 66.80 ± 2.96 | 56.20 ± 4.43 | 63.53 ± 3.67 | NS |
| Urea (mmol/L) | 5.74 ± 0.09 | 6.46 ± 0.01 | 7.46 ± 0.41 | 6.66 ± 0.21 | 8.21 ± 0.32 | B vs. E ** A vs. C ** D vs. E ** A vs. E *** |
| Albumin (g/L) | 32.90 ± 0.35 | 31.13 ± 1.18 | 32.87 ± 0.29 | 32.60 ± 0.10 | 32.40 ± 0.91 | NS |
| Creatinine (µmol/L) | 27.00 ± 1.15 | 43.67 ± 1.76 | 34.00 ± 0.57 | 21.00 ± 1.08 | 33.75 ± 1.03 | B vs. A, D *** C vs. D ** D vs. E ** |
| CT26 | CT26 + IM | CT26 + 5-FU | CT26 + IM + 5-FU | |
|---|---|---|---|---|
| Caspase-3 | 26.33 ± 0.90 | 28.22 ± 1.13 | 29.36 ± 1.07 a | 28.99 ± 0.89 a |
| Bax | 14.37 ± 0.80 | 16.60 ± 0.84 | 19.57 ± 0.96 aaa,b | 19.78 ± 1.06 aaa,b |
| Bcl-2 | 33.24 ± 1.34 | 29.36 ± 1.22 a | 27.21 ± 1.27 aa | 23.68 ± 1.59 aaa,bb |
| Bax/Bcl-2 | 0.45 ± 0.04 | 0.58 ± 0.04 a | 0.73 ± 0.04 aaa,b | 0.92 ± 0.10 aaa,bb |
| Ki-67 | 15.77 ± 0.73 | 15.02 ± 0.68 | 15.18 ± 1.13 | 15.17 ± 0.83 |
| MAI | 4.03 ± 0.24 | 4.13 ± 0.25 | 3.80 ± 0.53 | 3.48 ± 0.26 |
| Immune Cells | Cell Markers | Fluorochrome | Panel |
|---|---|---|---|
| Leukocytes | CD45+ | FITC | F4/80 (1:100) |
| T-Lymphocytes | CD45+ CD3+ | PE | CD49b (1:100) |
| B- Lymphocytes | CD45+ CD19+ | PerCP-Cy5.5 | CD3 (1:100) |
| Macrophages | CD45+ F4/80+ | APC | CD19 (1:200) |
Publisher’s Note: MDPI stays neutral with regard to jurisdictional claims in published maps and institutional affiliations. |
© 2022 by the authors. Licensee MDPI, Basel, Switzerland. This article is an open access article distributed under the terms and conditions of the Creative Commons Attribution (CC BY) license (https://creativecommons.org/licenses/by/4.0/).
Share and Cite
Demeckova, V.; Mudronova, D.; Gancarcikova, S.; Kubatka, P.; Kajo, K.; Kassayova, M.; Bojkova, B.; Adamkov, M.; Solár, P. 5-Fluorouracil Treatment of CT26 Colon Cancer Is Compromised by Combined Therapy with IMMODIN. Int. J. Mol. Sci. 2022, 23, 6374. https://doi.org/10.3390/ijms23126374
Demeckova V, Mudronova D, Gancarcikova S, Kubatka P, Kajo K, Kassayova M, Bojkova B, Adamkov M, Solár P. 5-Fluorouracil Treatment of CT26 Colon Cancer Is Compromised by Combined Therapy with IMMODIN. International Journal of Molecular Sciences. 2022; 23(12):6374. https://doi.org/10.3390/ijms23126374
Chicago/Turabian StyleDemeckova, Vlasta, Dagmar Mudronova, Sona Gancarcikova, Peter Kubatka, Karol Kajo, Monika Kassayova, Bianka Bojkova, Marian Adamkov, and Peter Solár. 2022. "5-Fluorouracil Treatment of CT26 Colon Cancer Is Compromised by Combined Therapy with IMMODIN" International Journal of Molecular Sciences 23, no. 12: 6374. https://doi.org/10.3390/ijms23126374
APA StyleDemeckova, V., Mudronova, D., Gancarcikova, S., Kubatka, P., Kajo, K., Kassayova, M., Bojkova, B., Adamkov, M., & Solár, P. (2022). 5-Fluorouracil Treatment of CT26 Colon Cancer Is Compromised by Combined Therapy with IMMODIN. International Journal of Molecular Sciences, 23(12), 6374. https://doi.org/10.3390/ijms23126374