
Effects of Axonal Demyelination, Inflammatory Cytokines and Divalent Cation Chelators on Thalamic HCN Channels and Oscillatory Bursting

 , , ,
, , , 

Abstract
1. Introduction
2. Materials and Methods
2.1. Animals
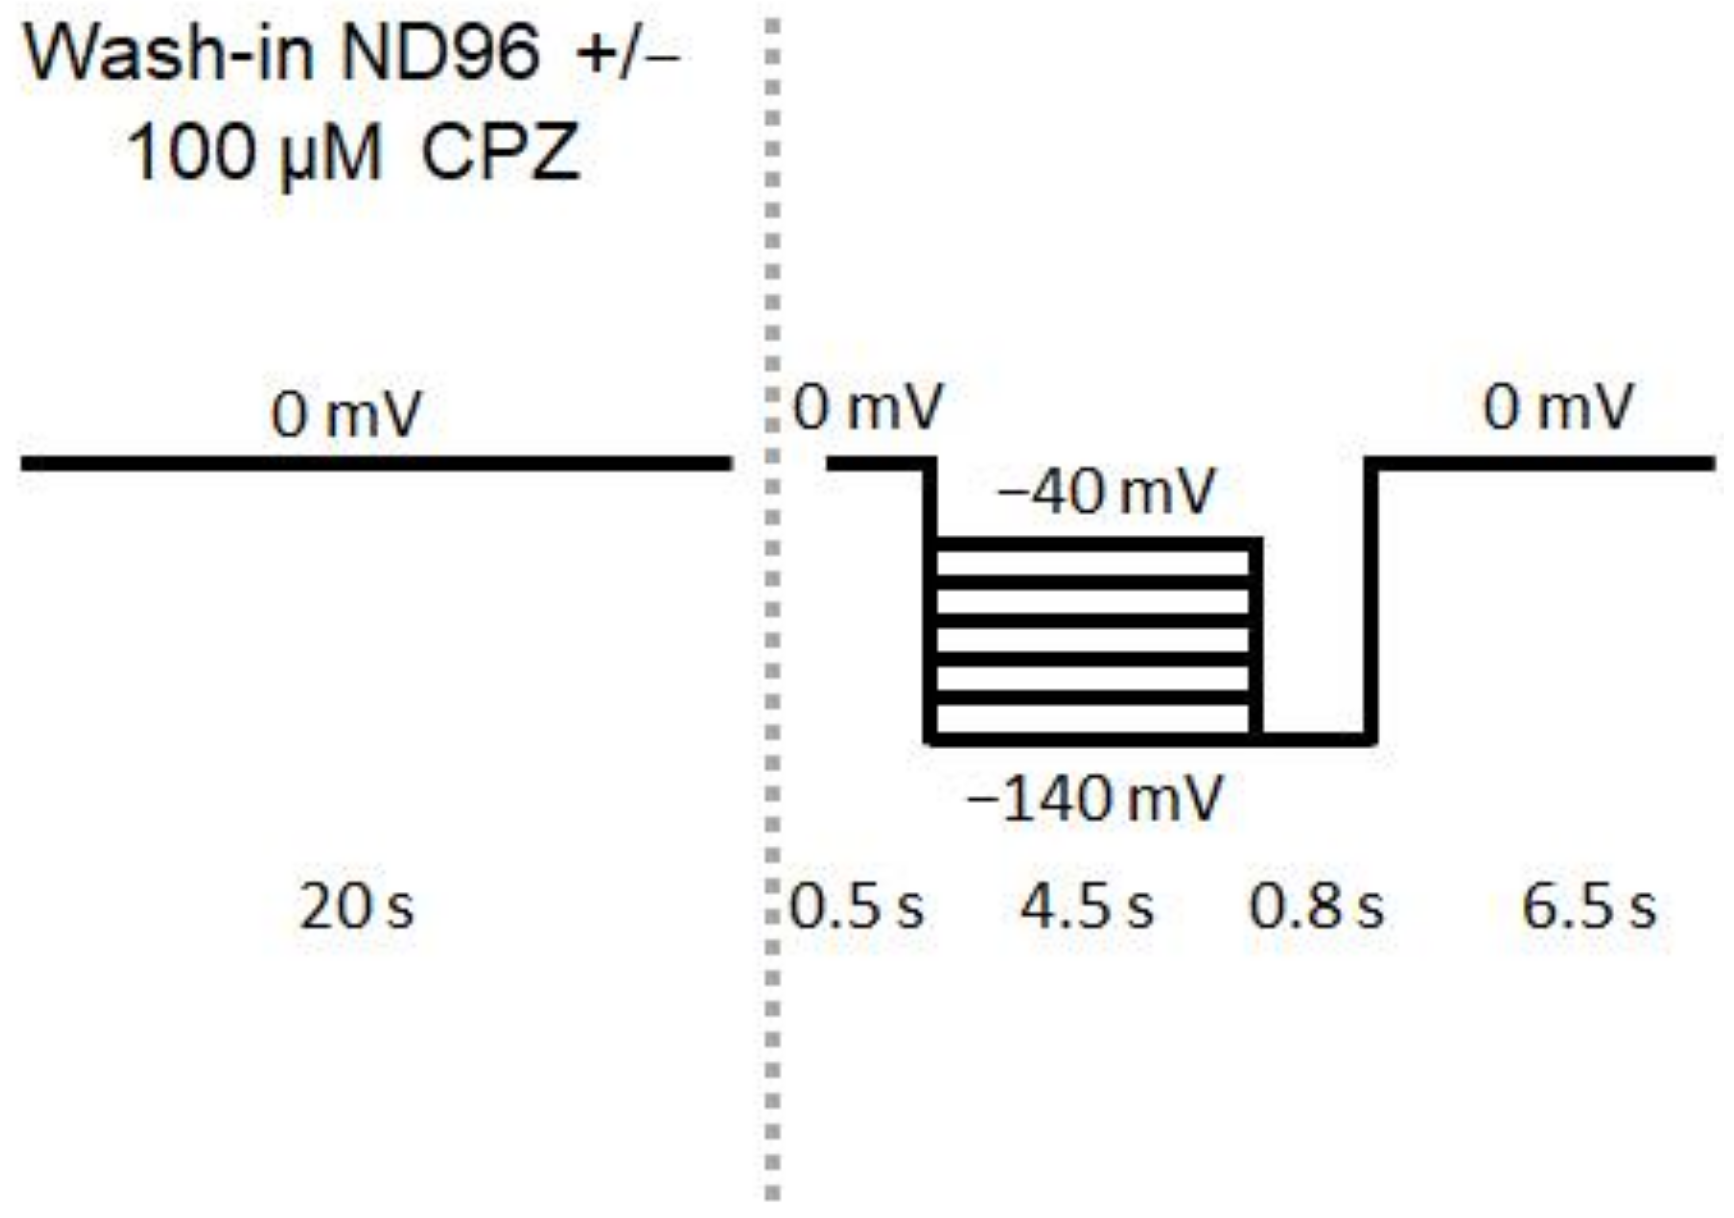
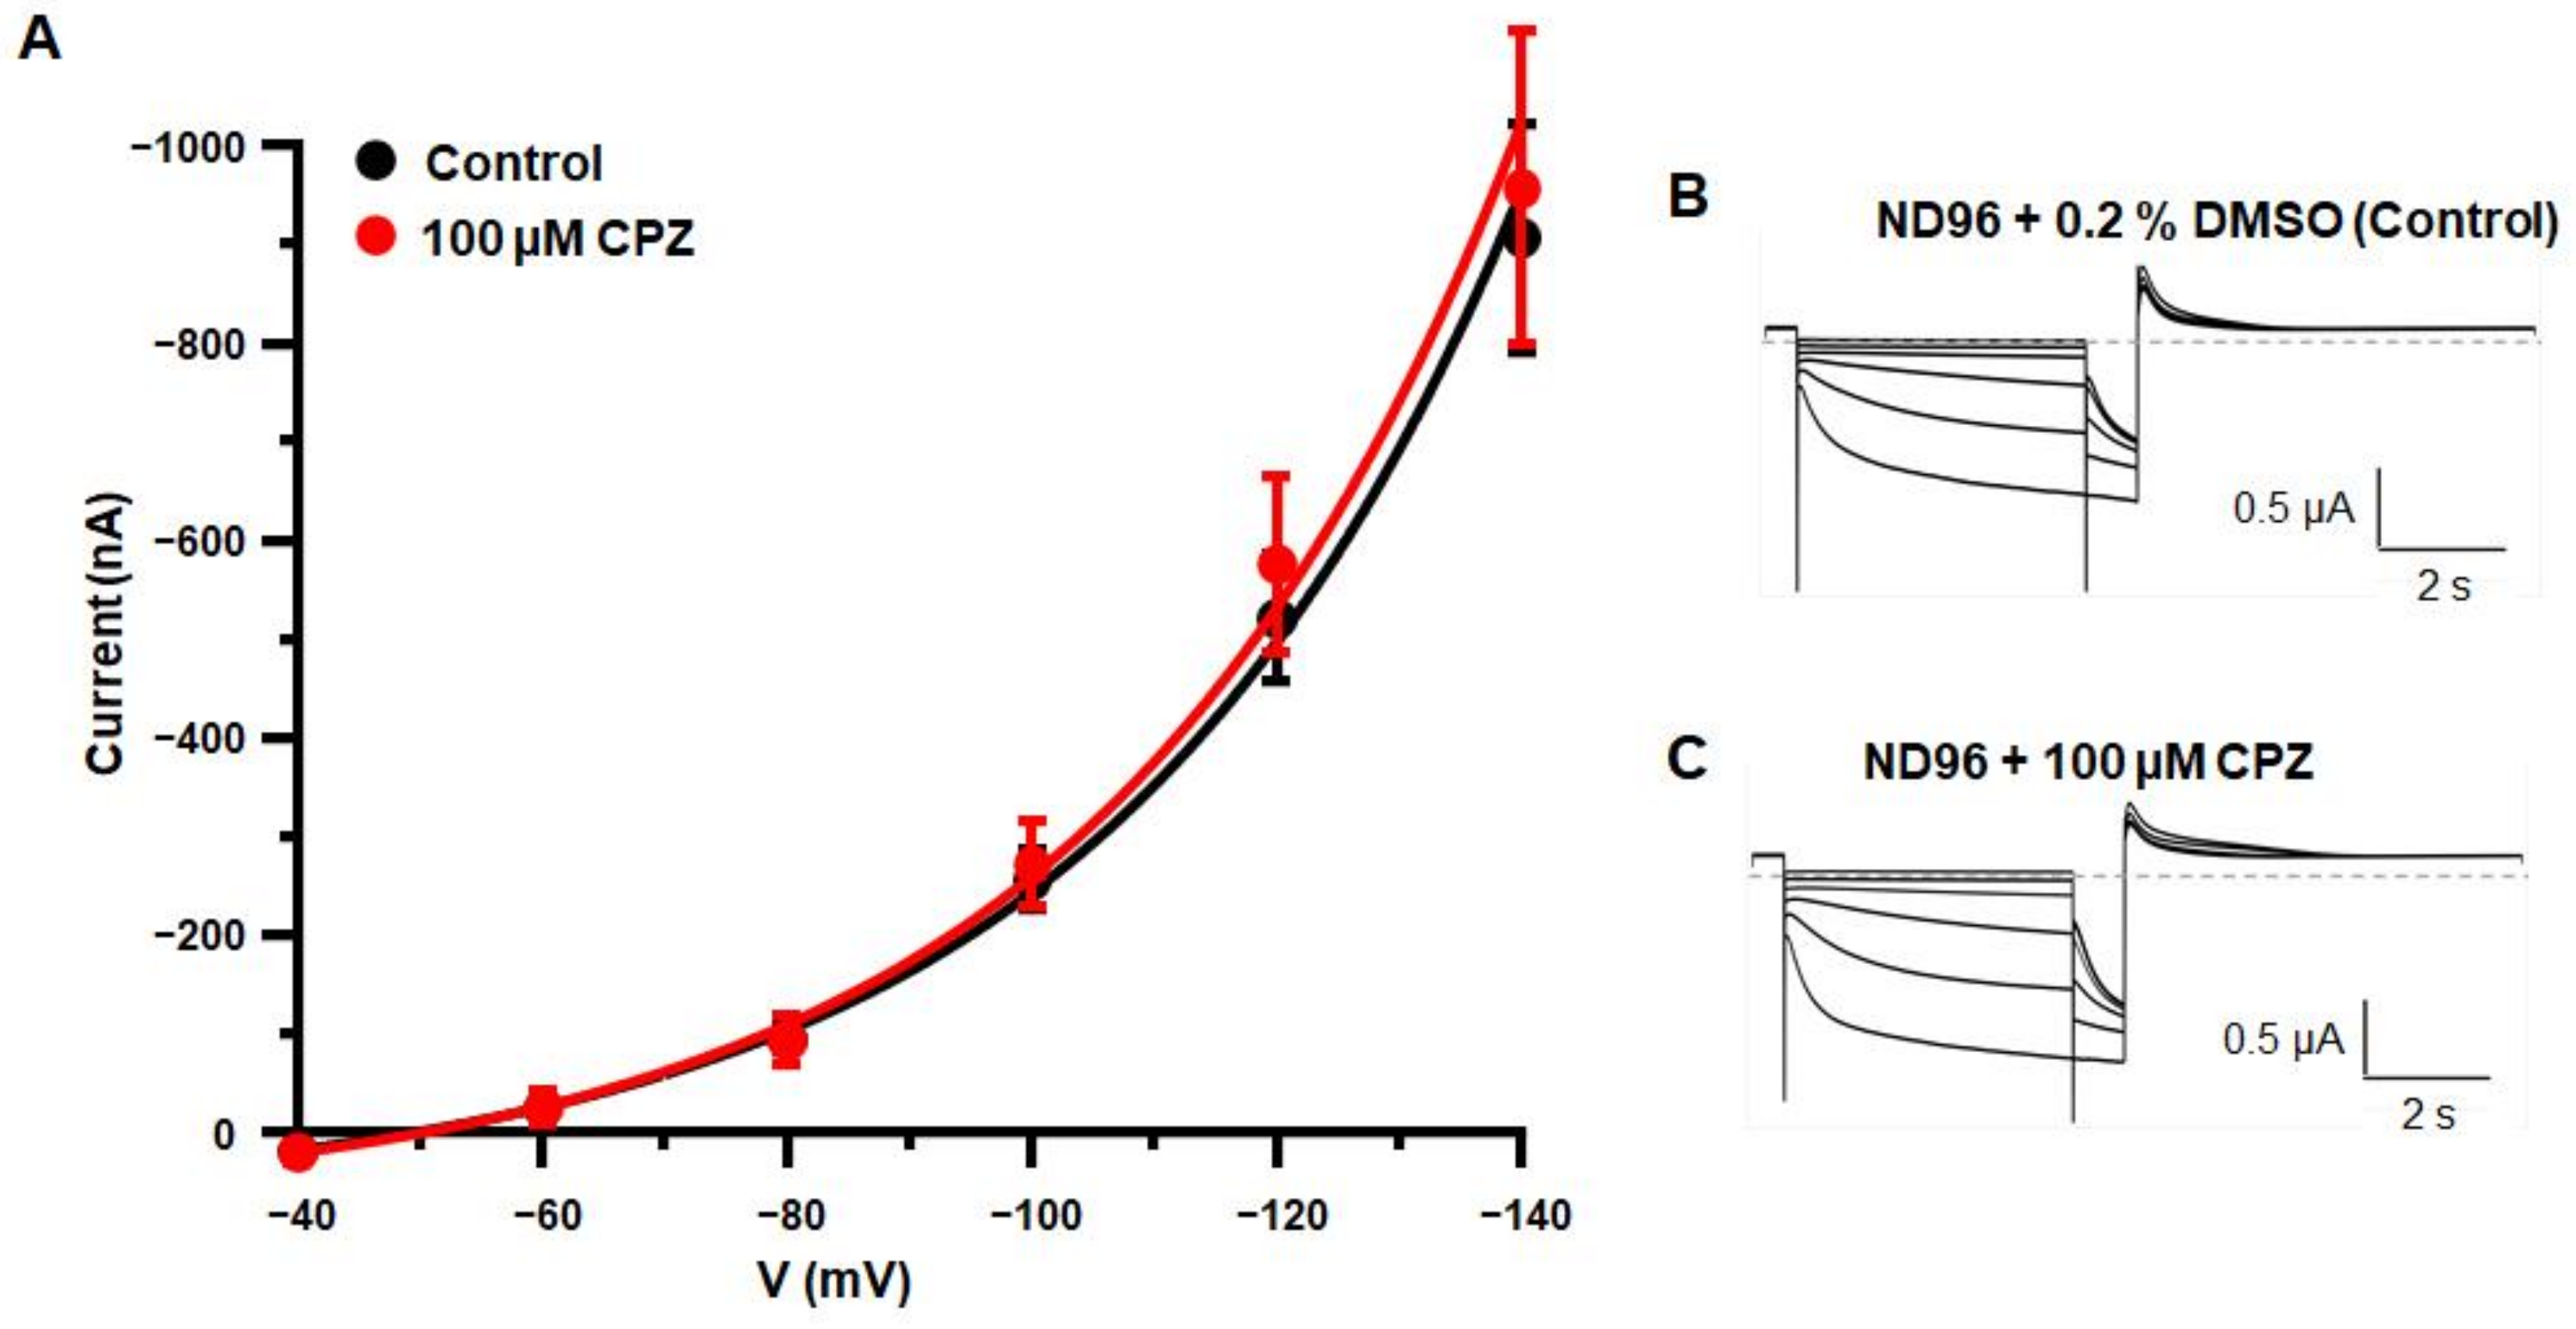
2.2. CPZ Treatment
2.3. Preparation of Acute Brain Slices for Whole-Cell Patch-Clamp Recordings
2.4. Preparation of Acute Brain Slices for Field Potential Recordings
2.5. Cell Culture
2.6. Oocyte Expression
2.7. Drugs
2.8. Preparation of Water-Soluble CPZ Derivative N1,N2-Bis (1-Methylpiperidin-4-Ylidene) Oxalyl Hydrazide (BiMPi) and Purity Measurements
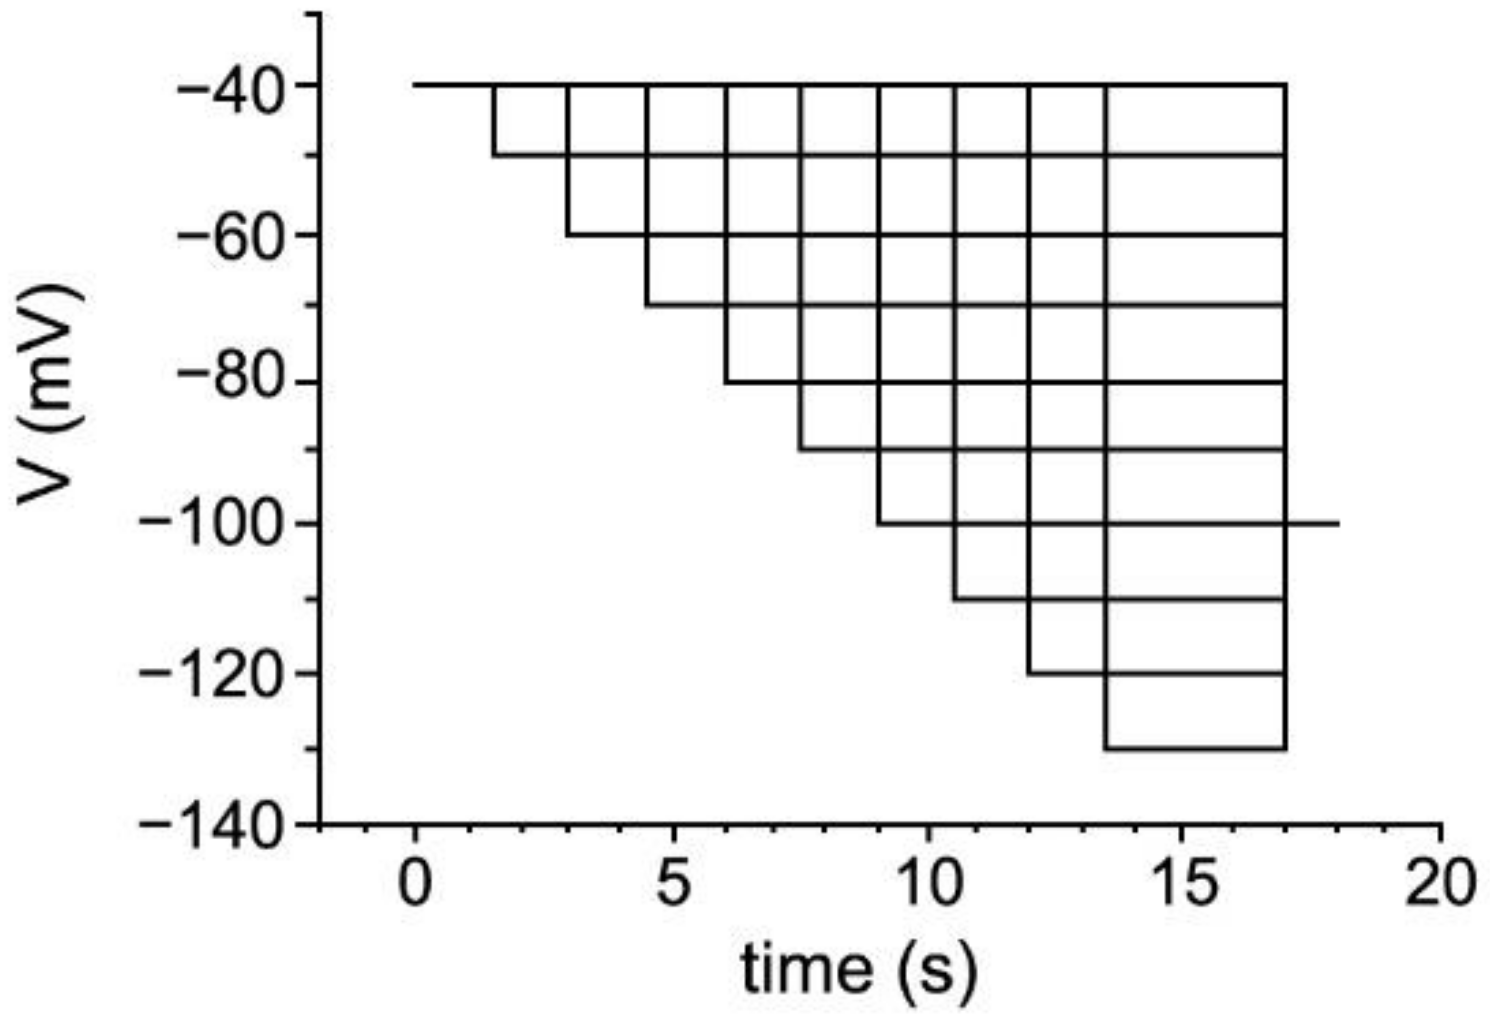
2.9. Whole-Cell Voltage-Clamp Recordings in Acute Brain Slices
2.10. Whole-Cell Current-Clamp Recordings in Acute Brain Slices
2.11. Whole-Cell Voltage-Clamp Recordings of mHCN2 in HEK 293 Cells
2.12. Extracellular Rhythmic Burst Activity Recordings of TC VB Neurons in Acute Brain Slices
2.13. TEVC Measurements in Oocytes
2.14. Computational Modeling
2.15. Data Analysis and Statistics
3. Results
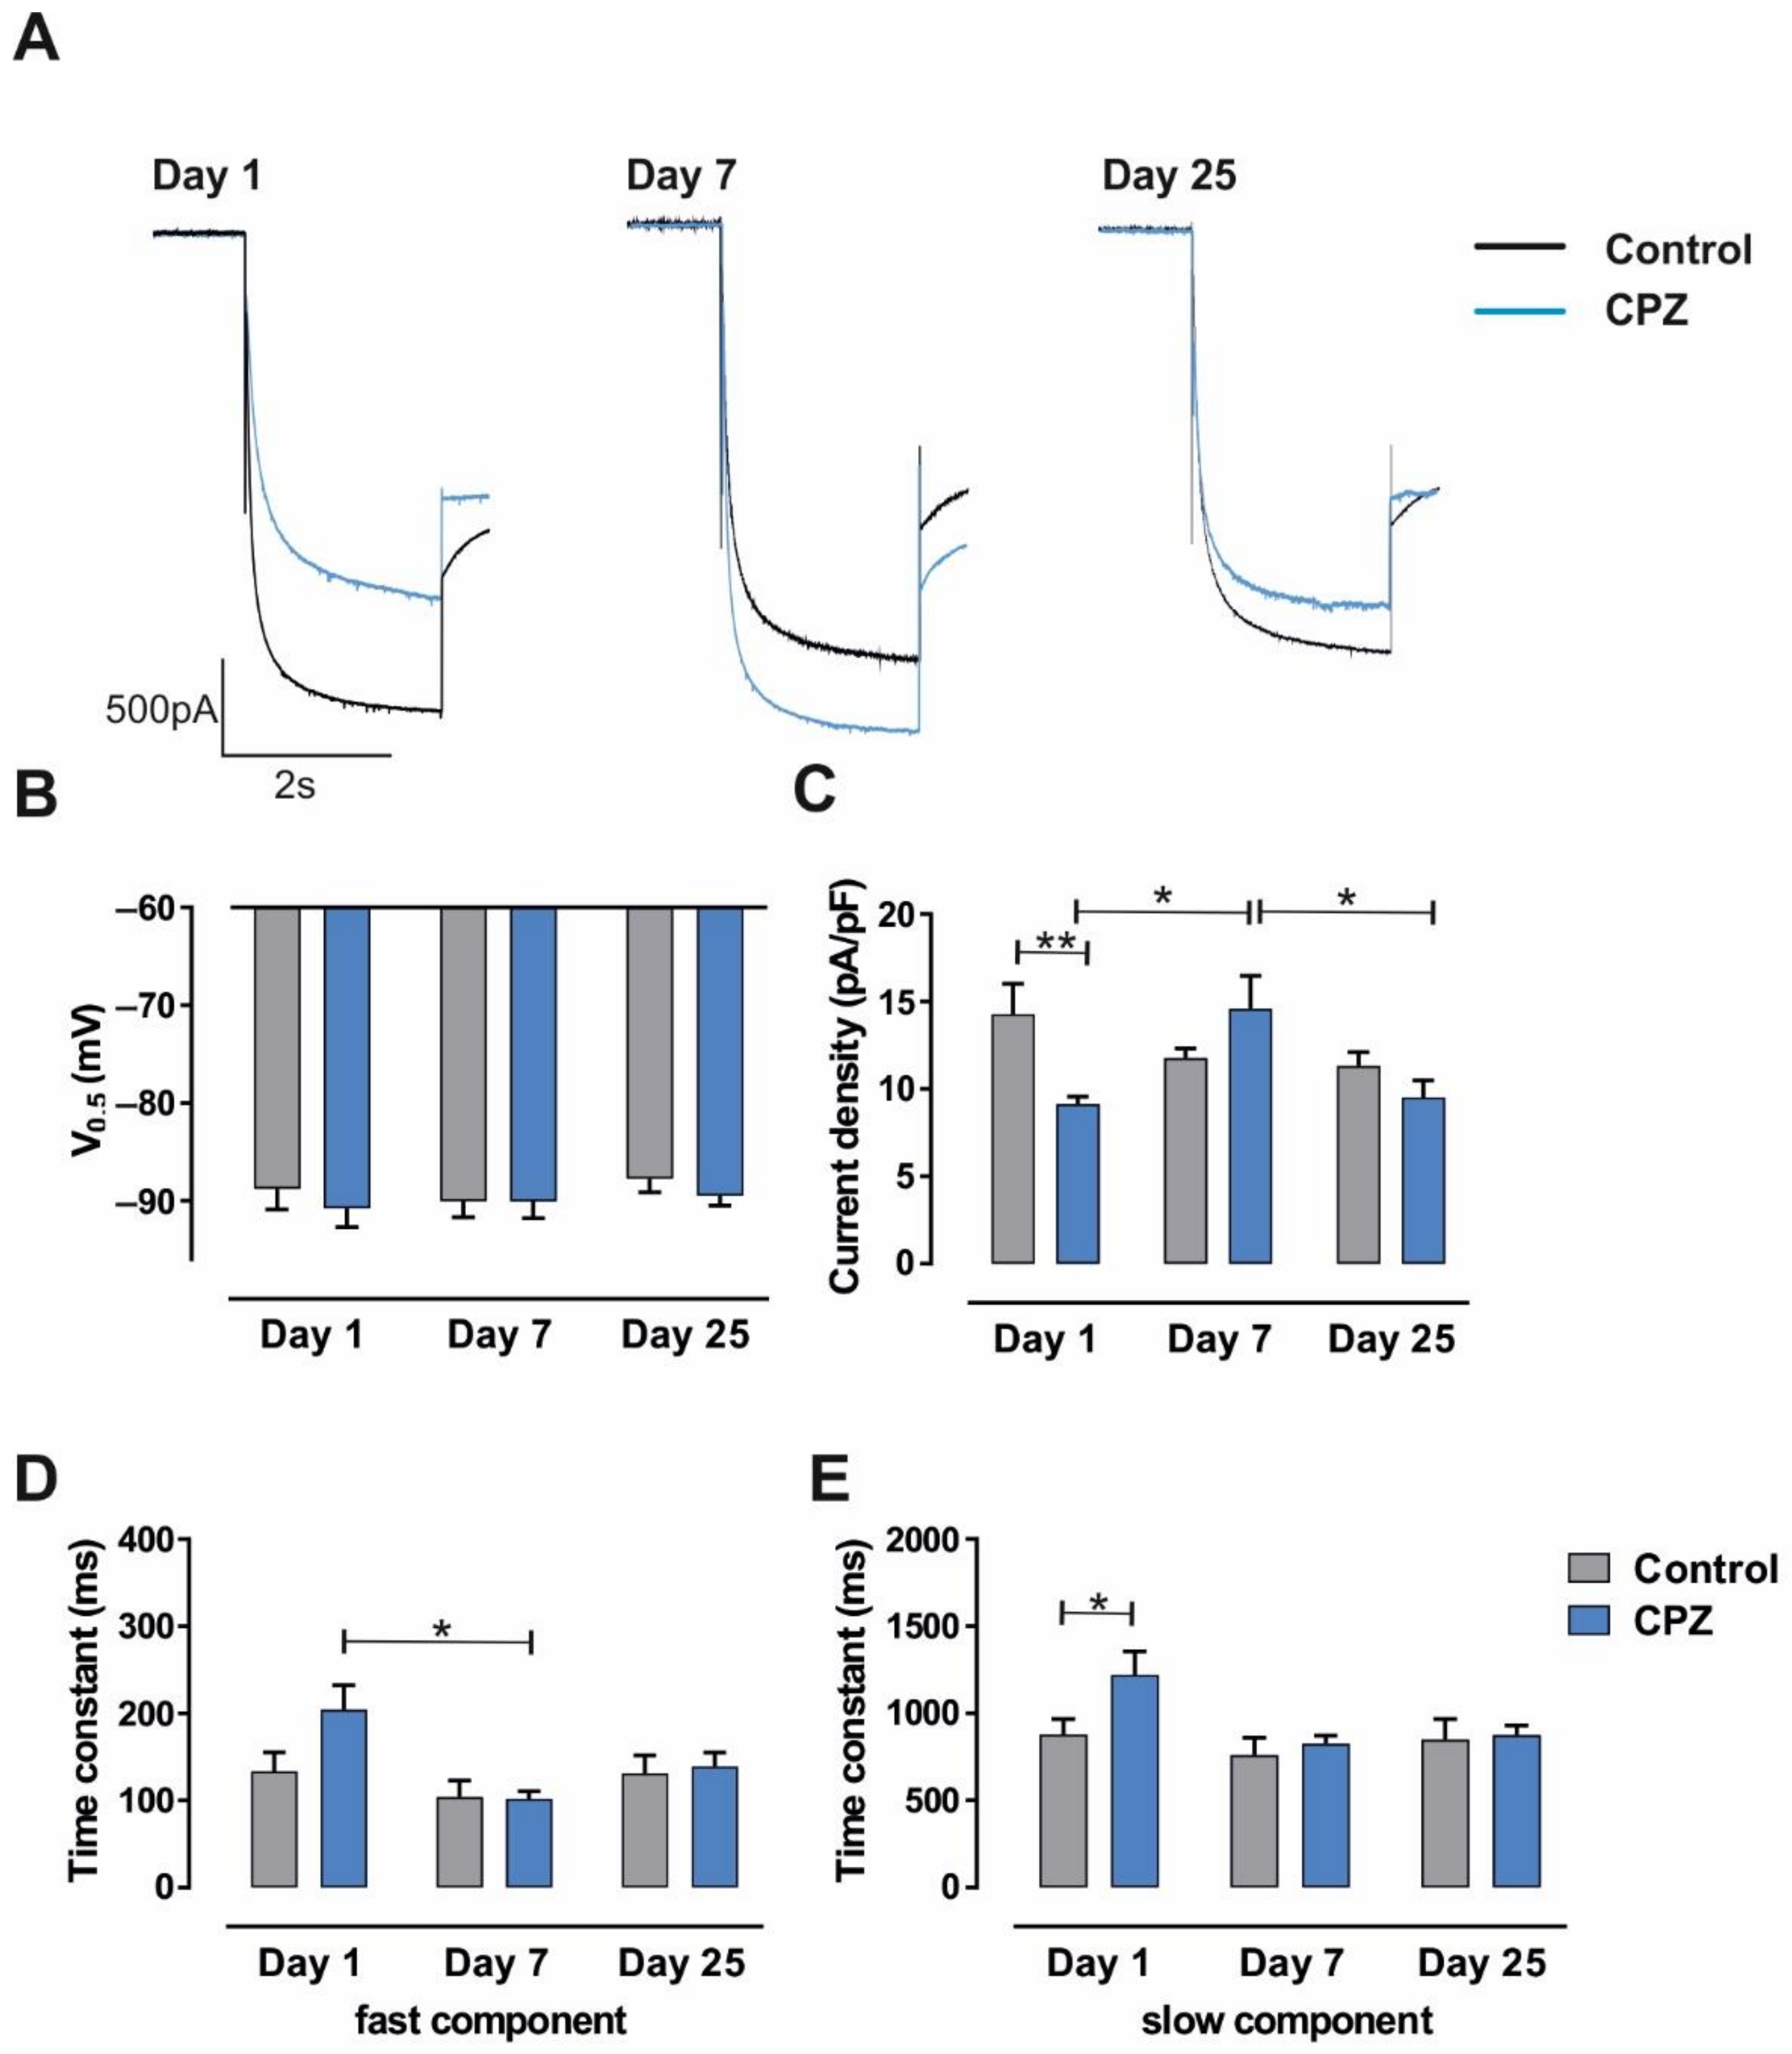
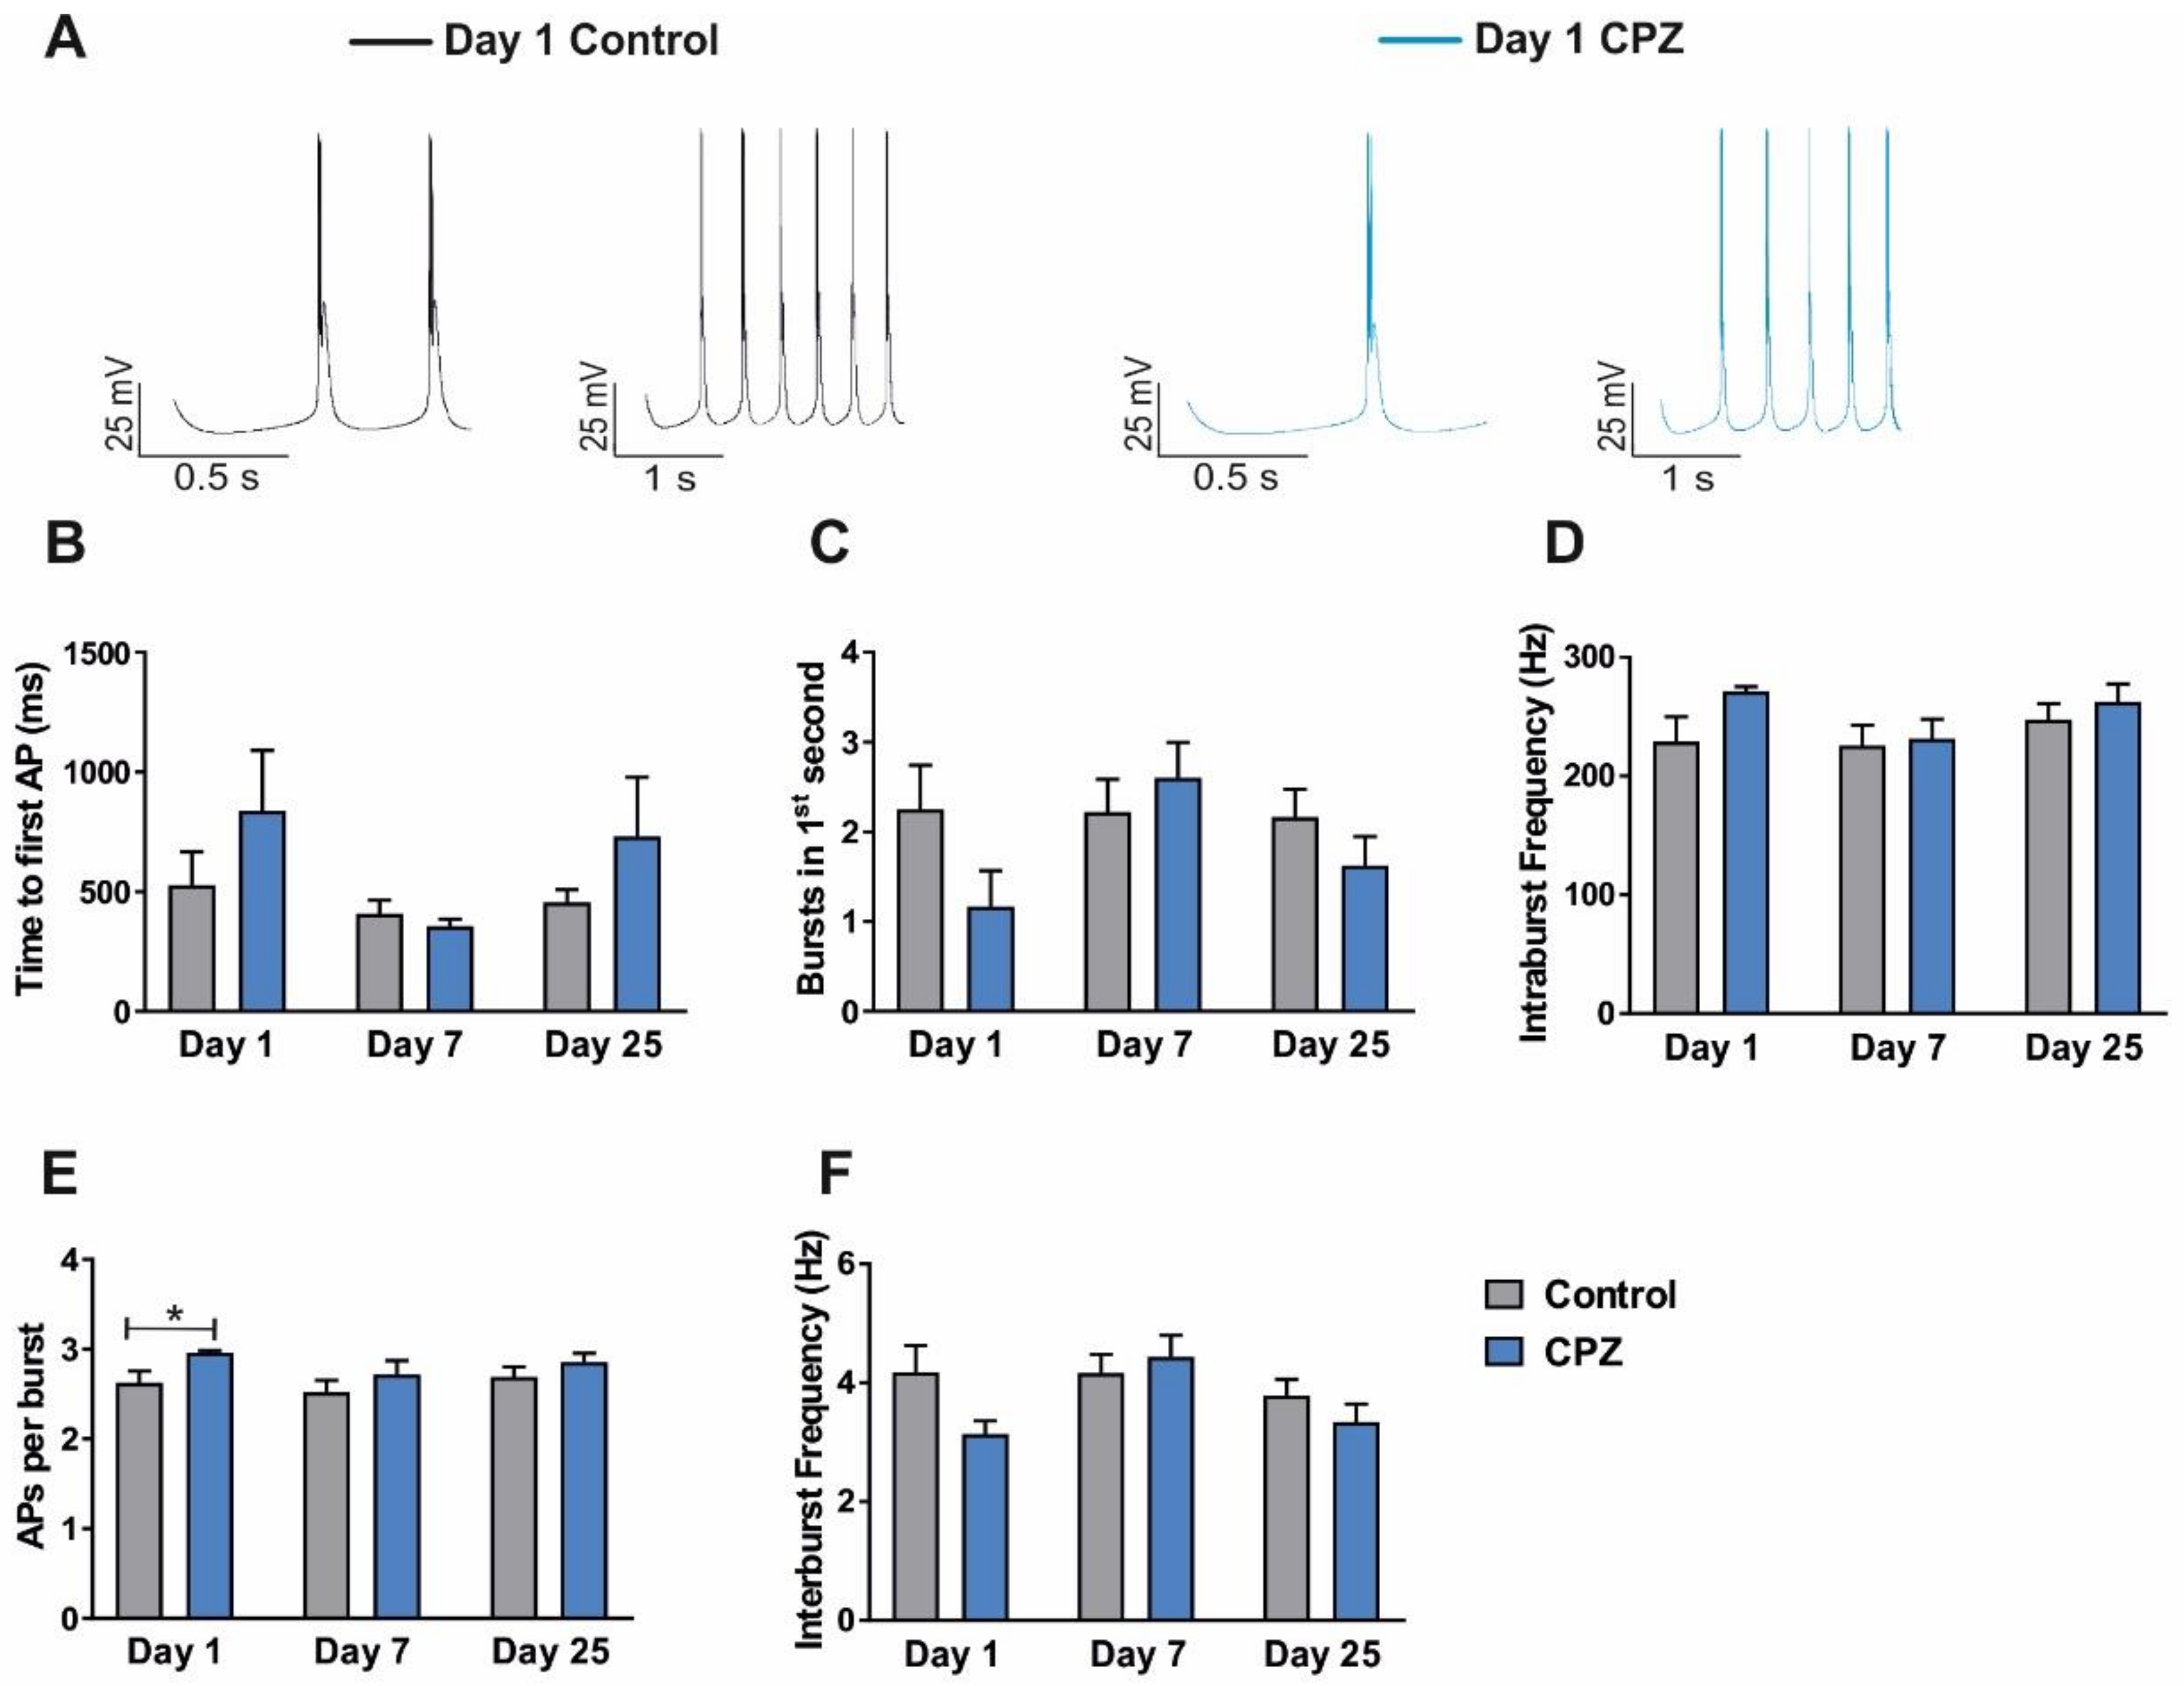
3.1. Alterations of Intrinsic Properties of TC VB Neurons following CPZ Treatment on C57BL/6J Mice
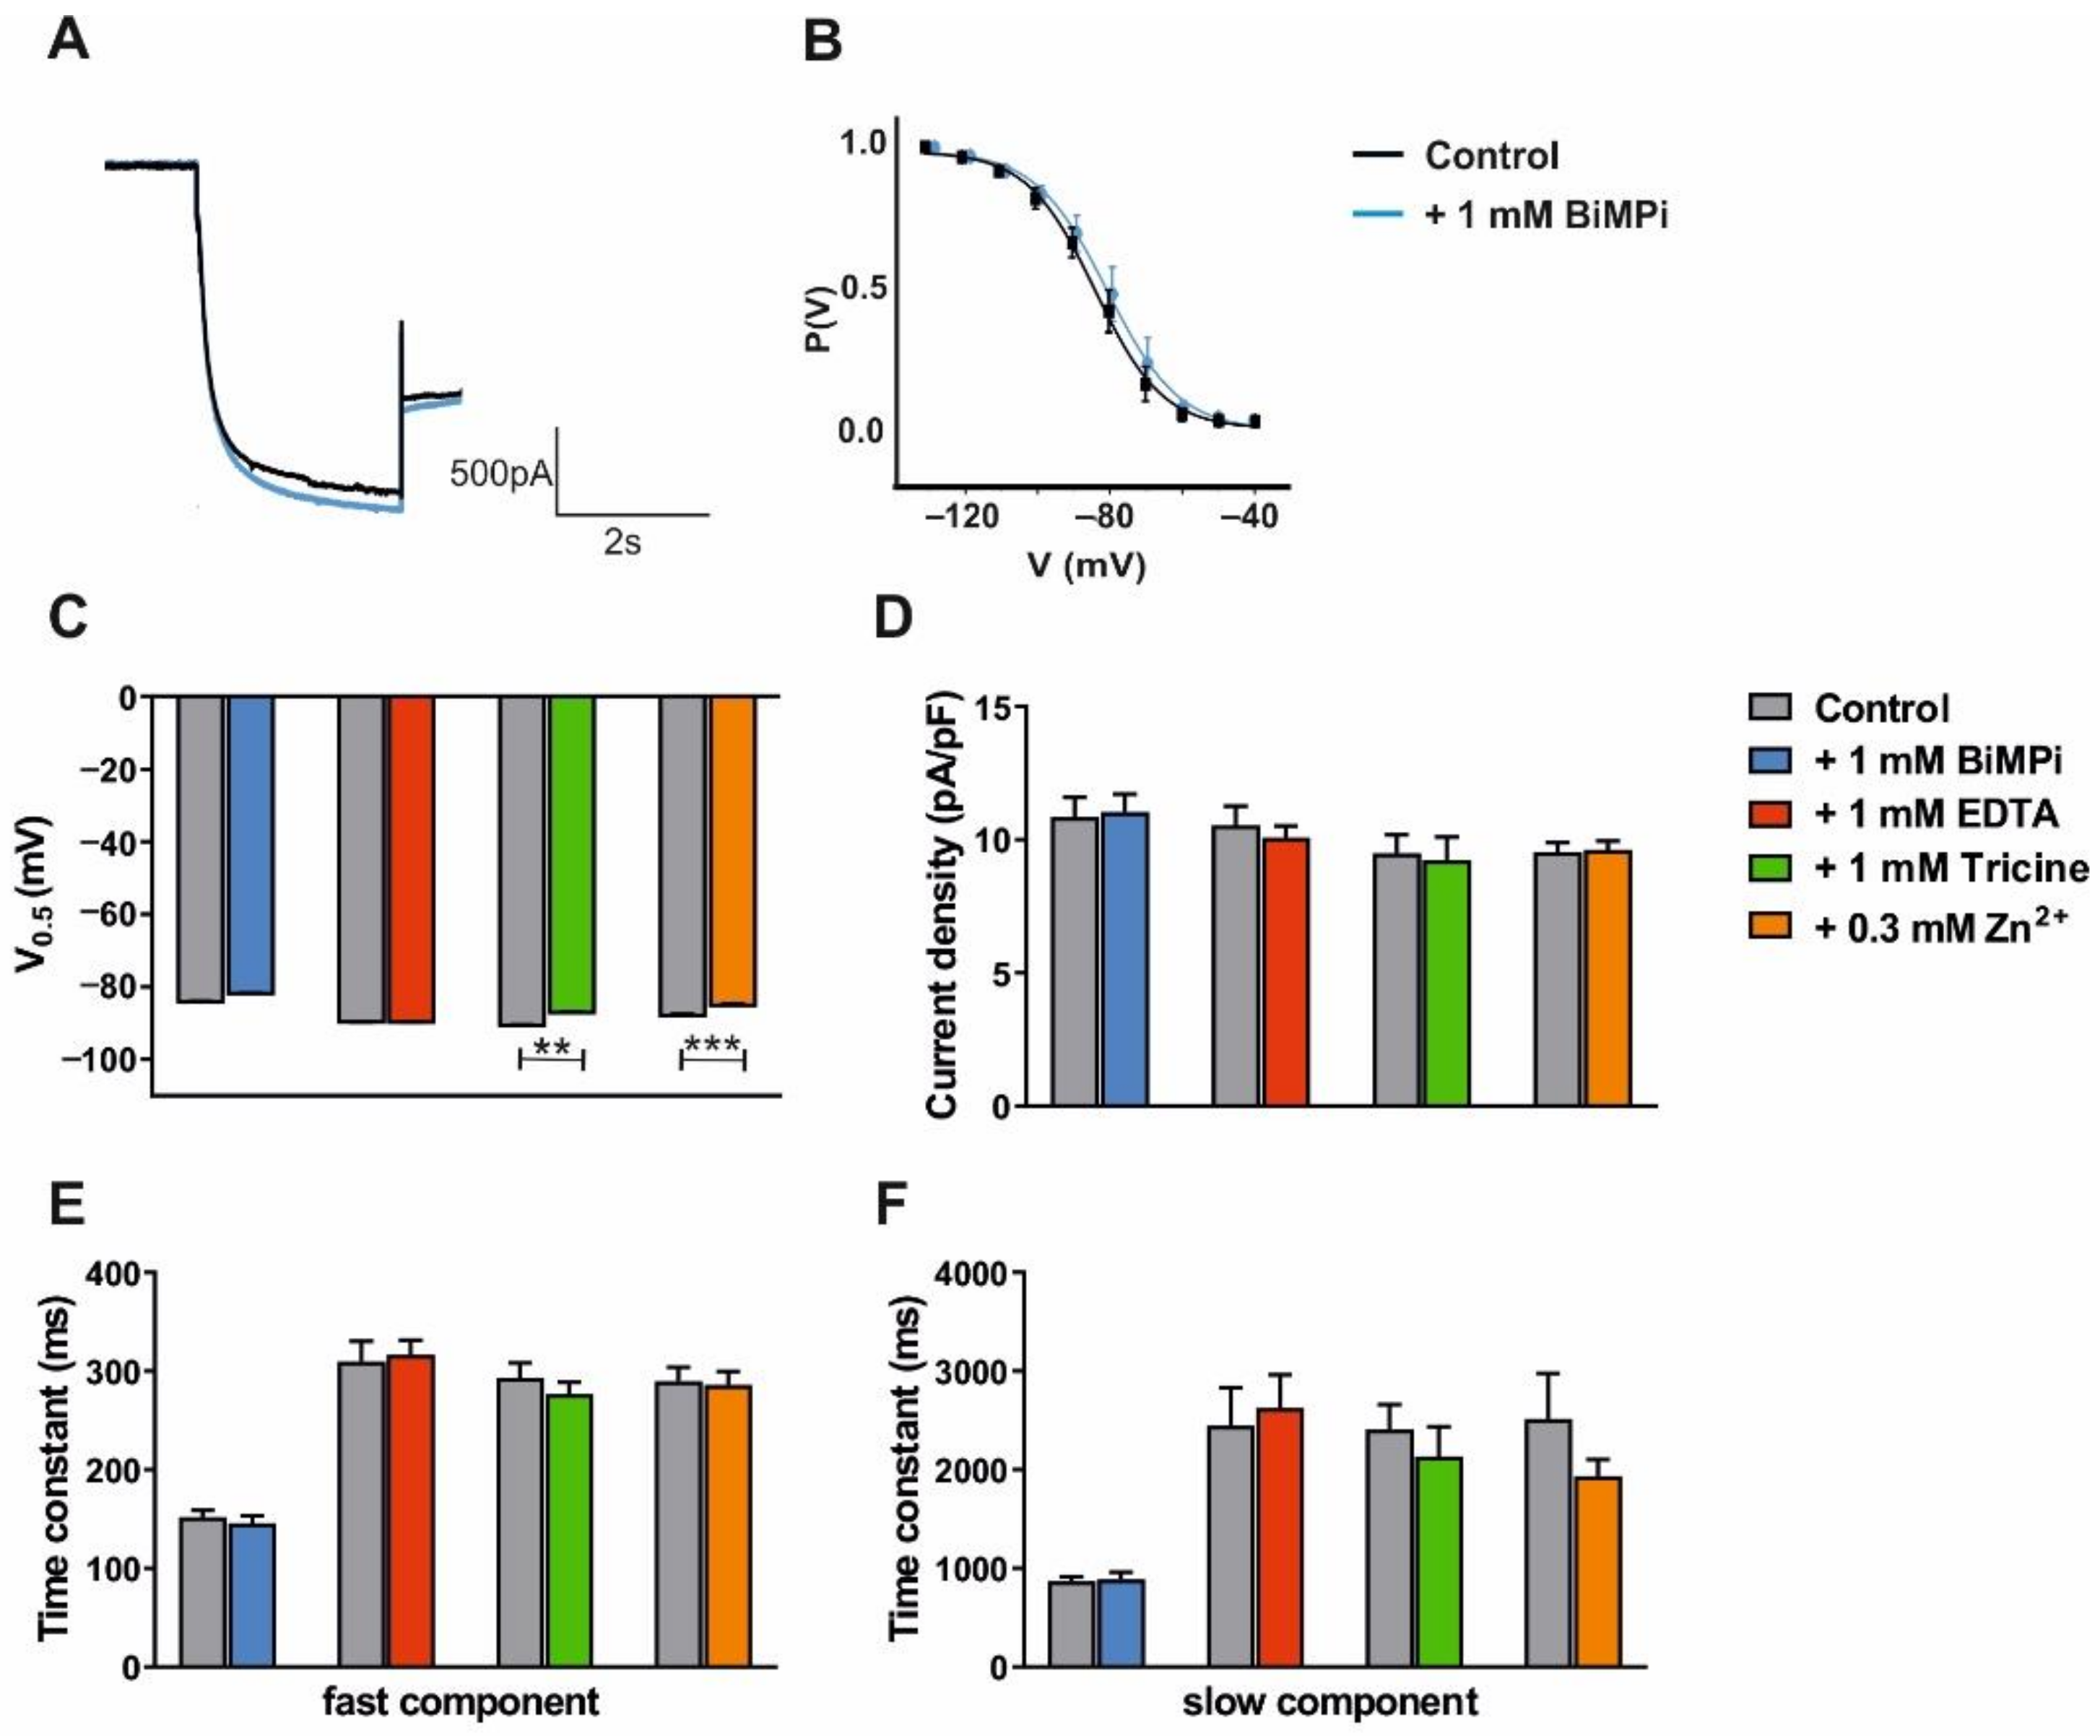
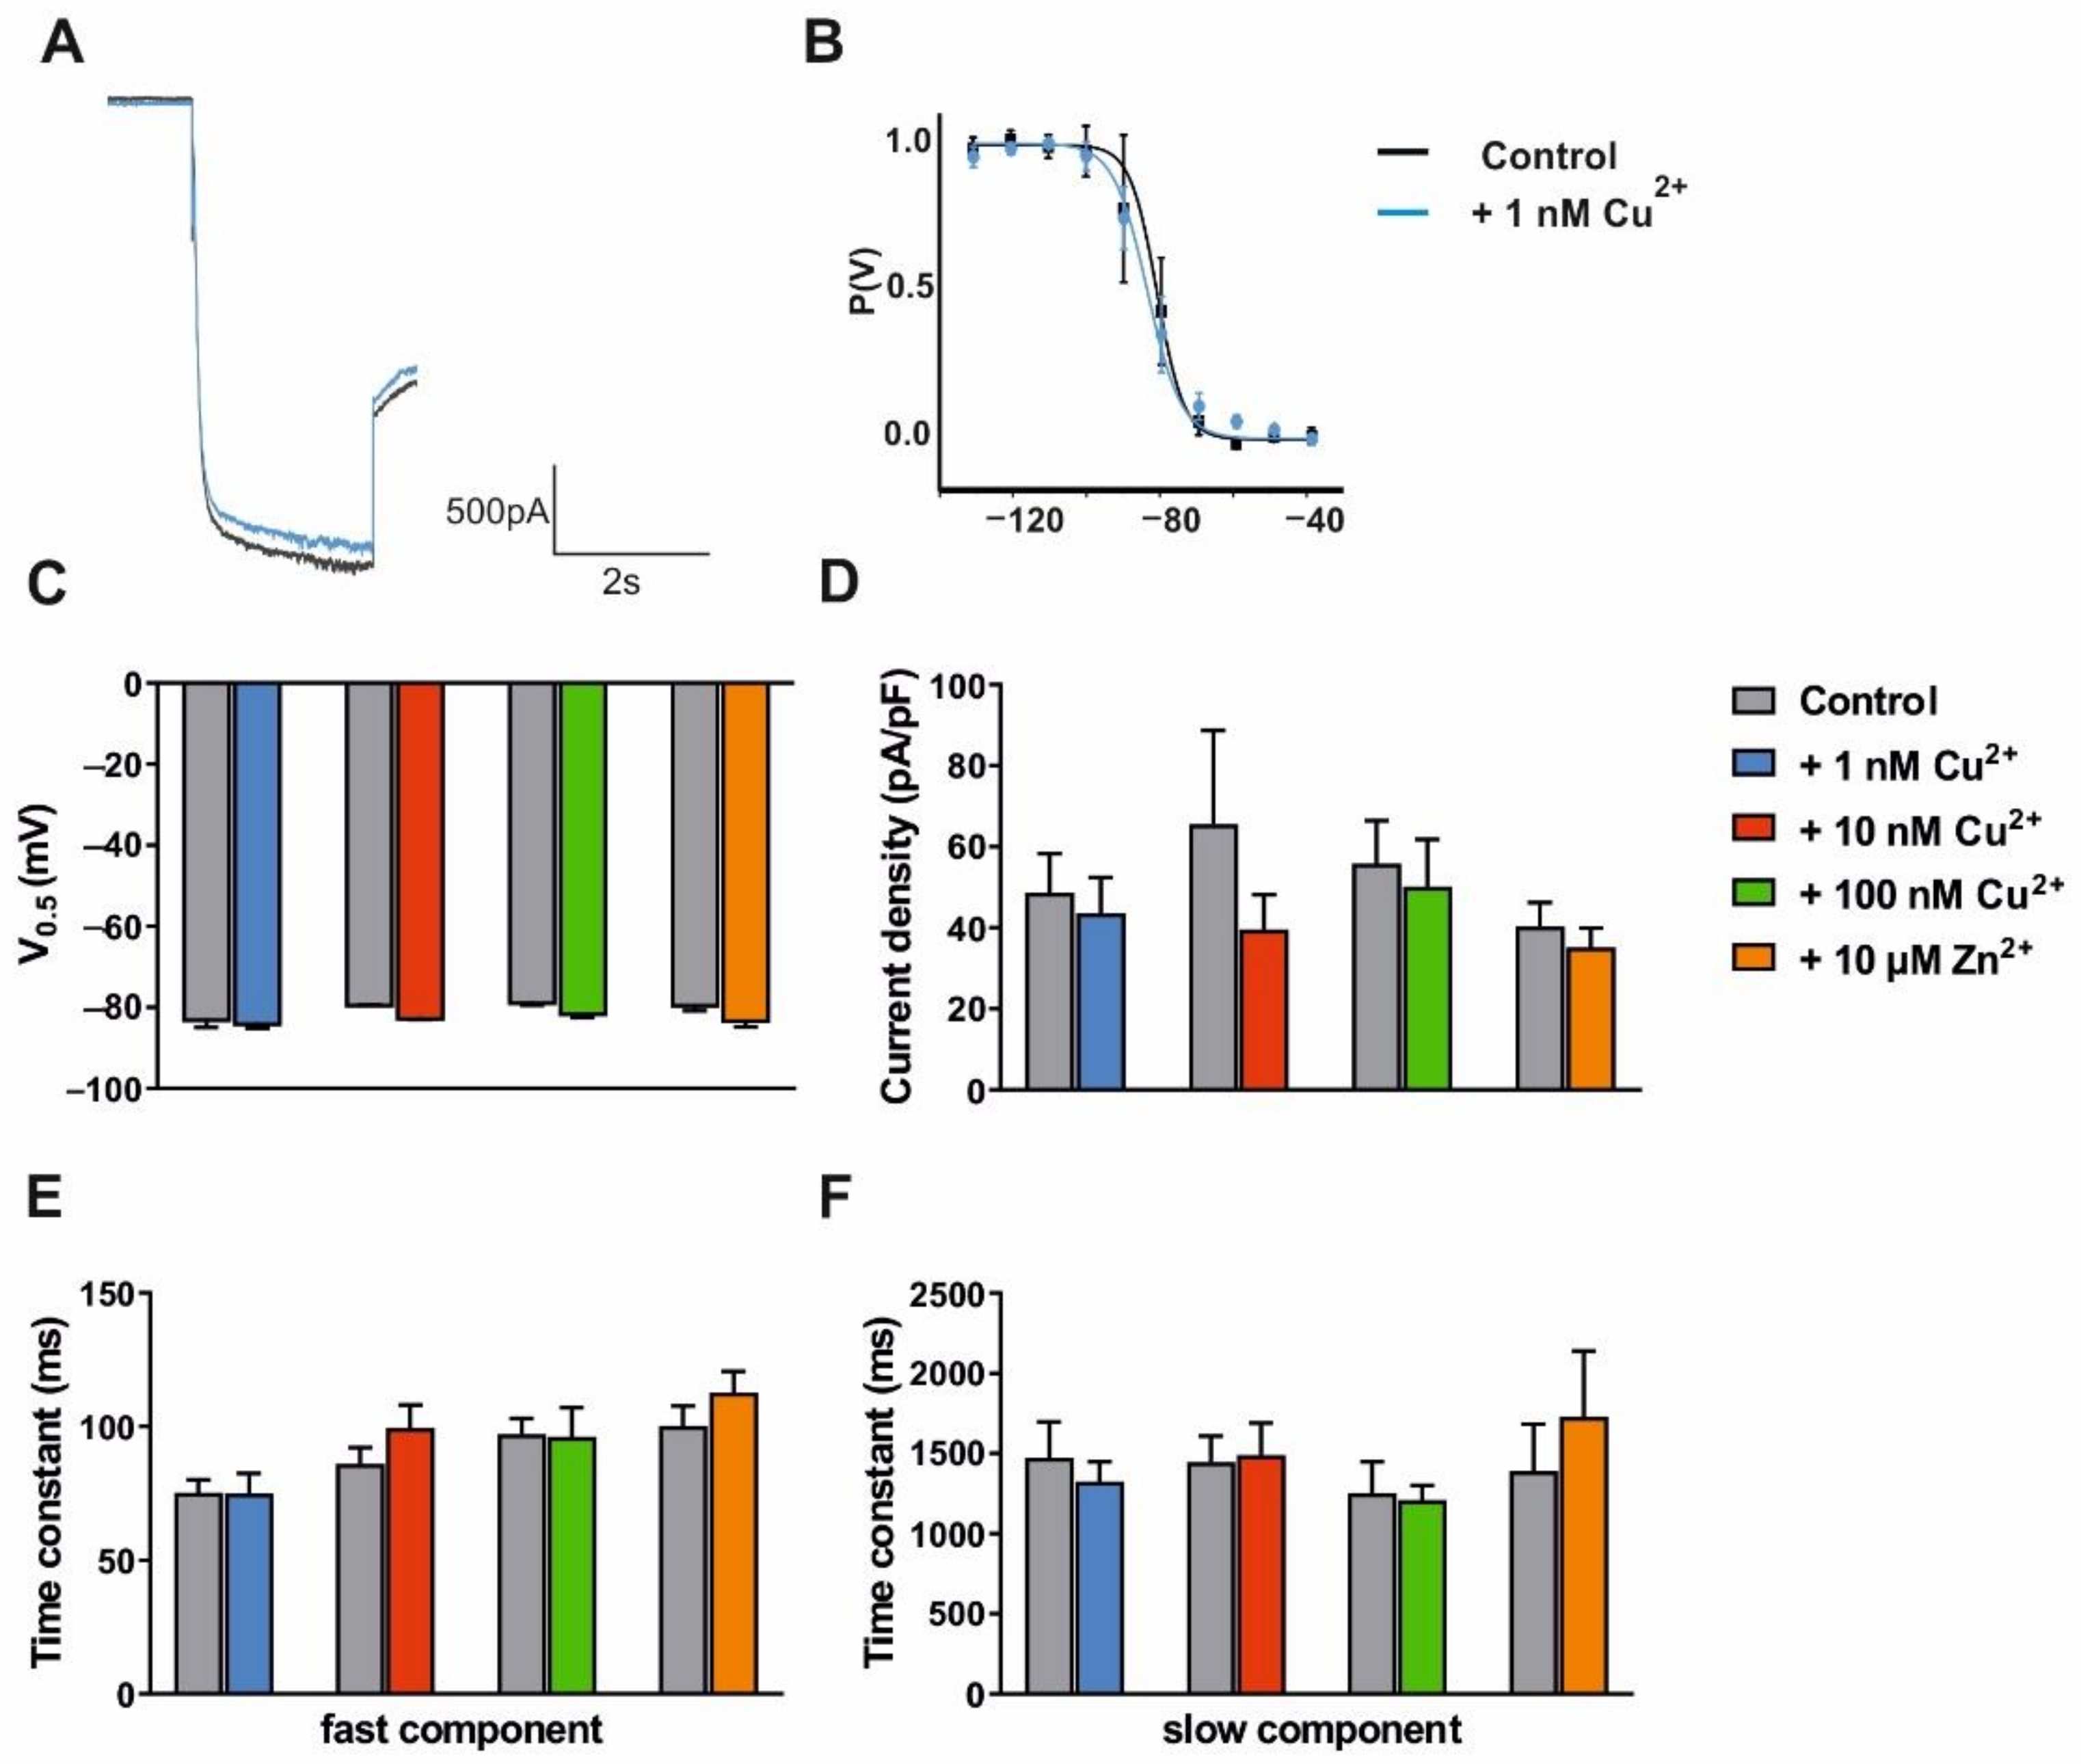
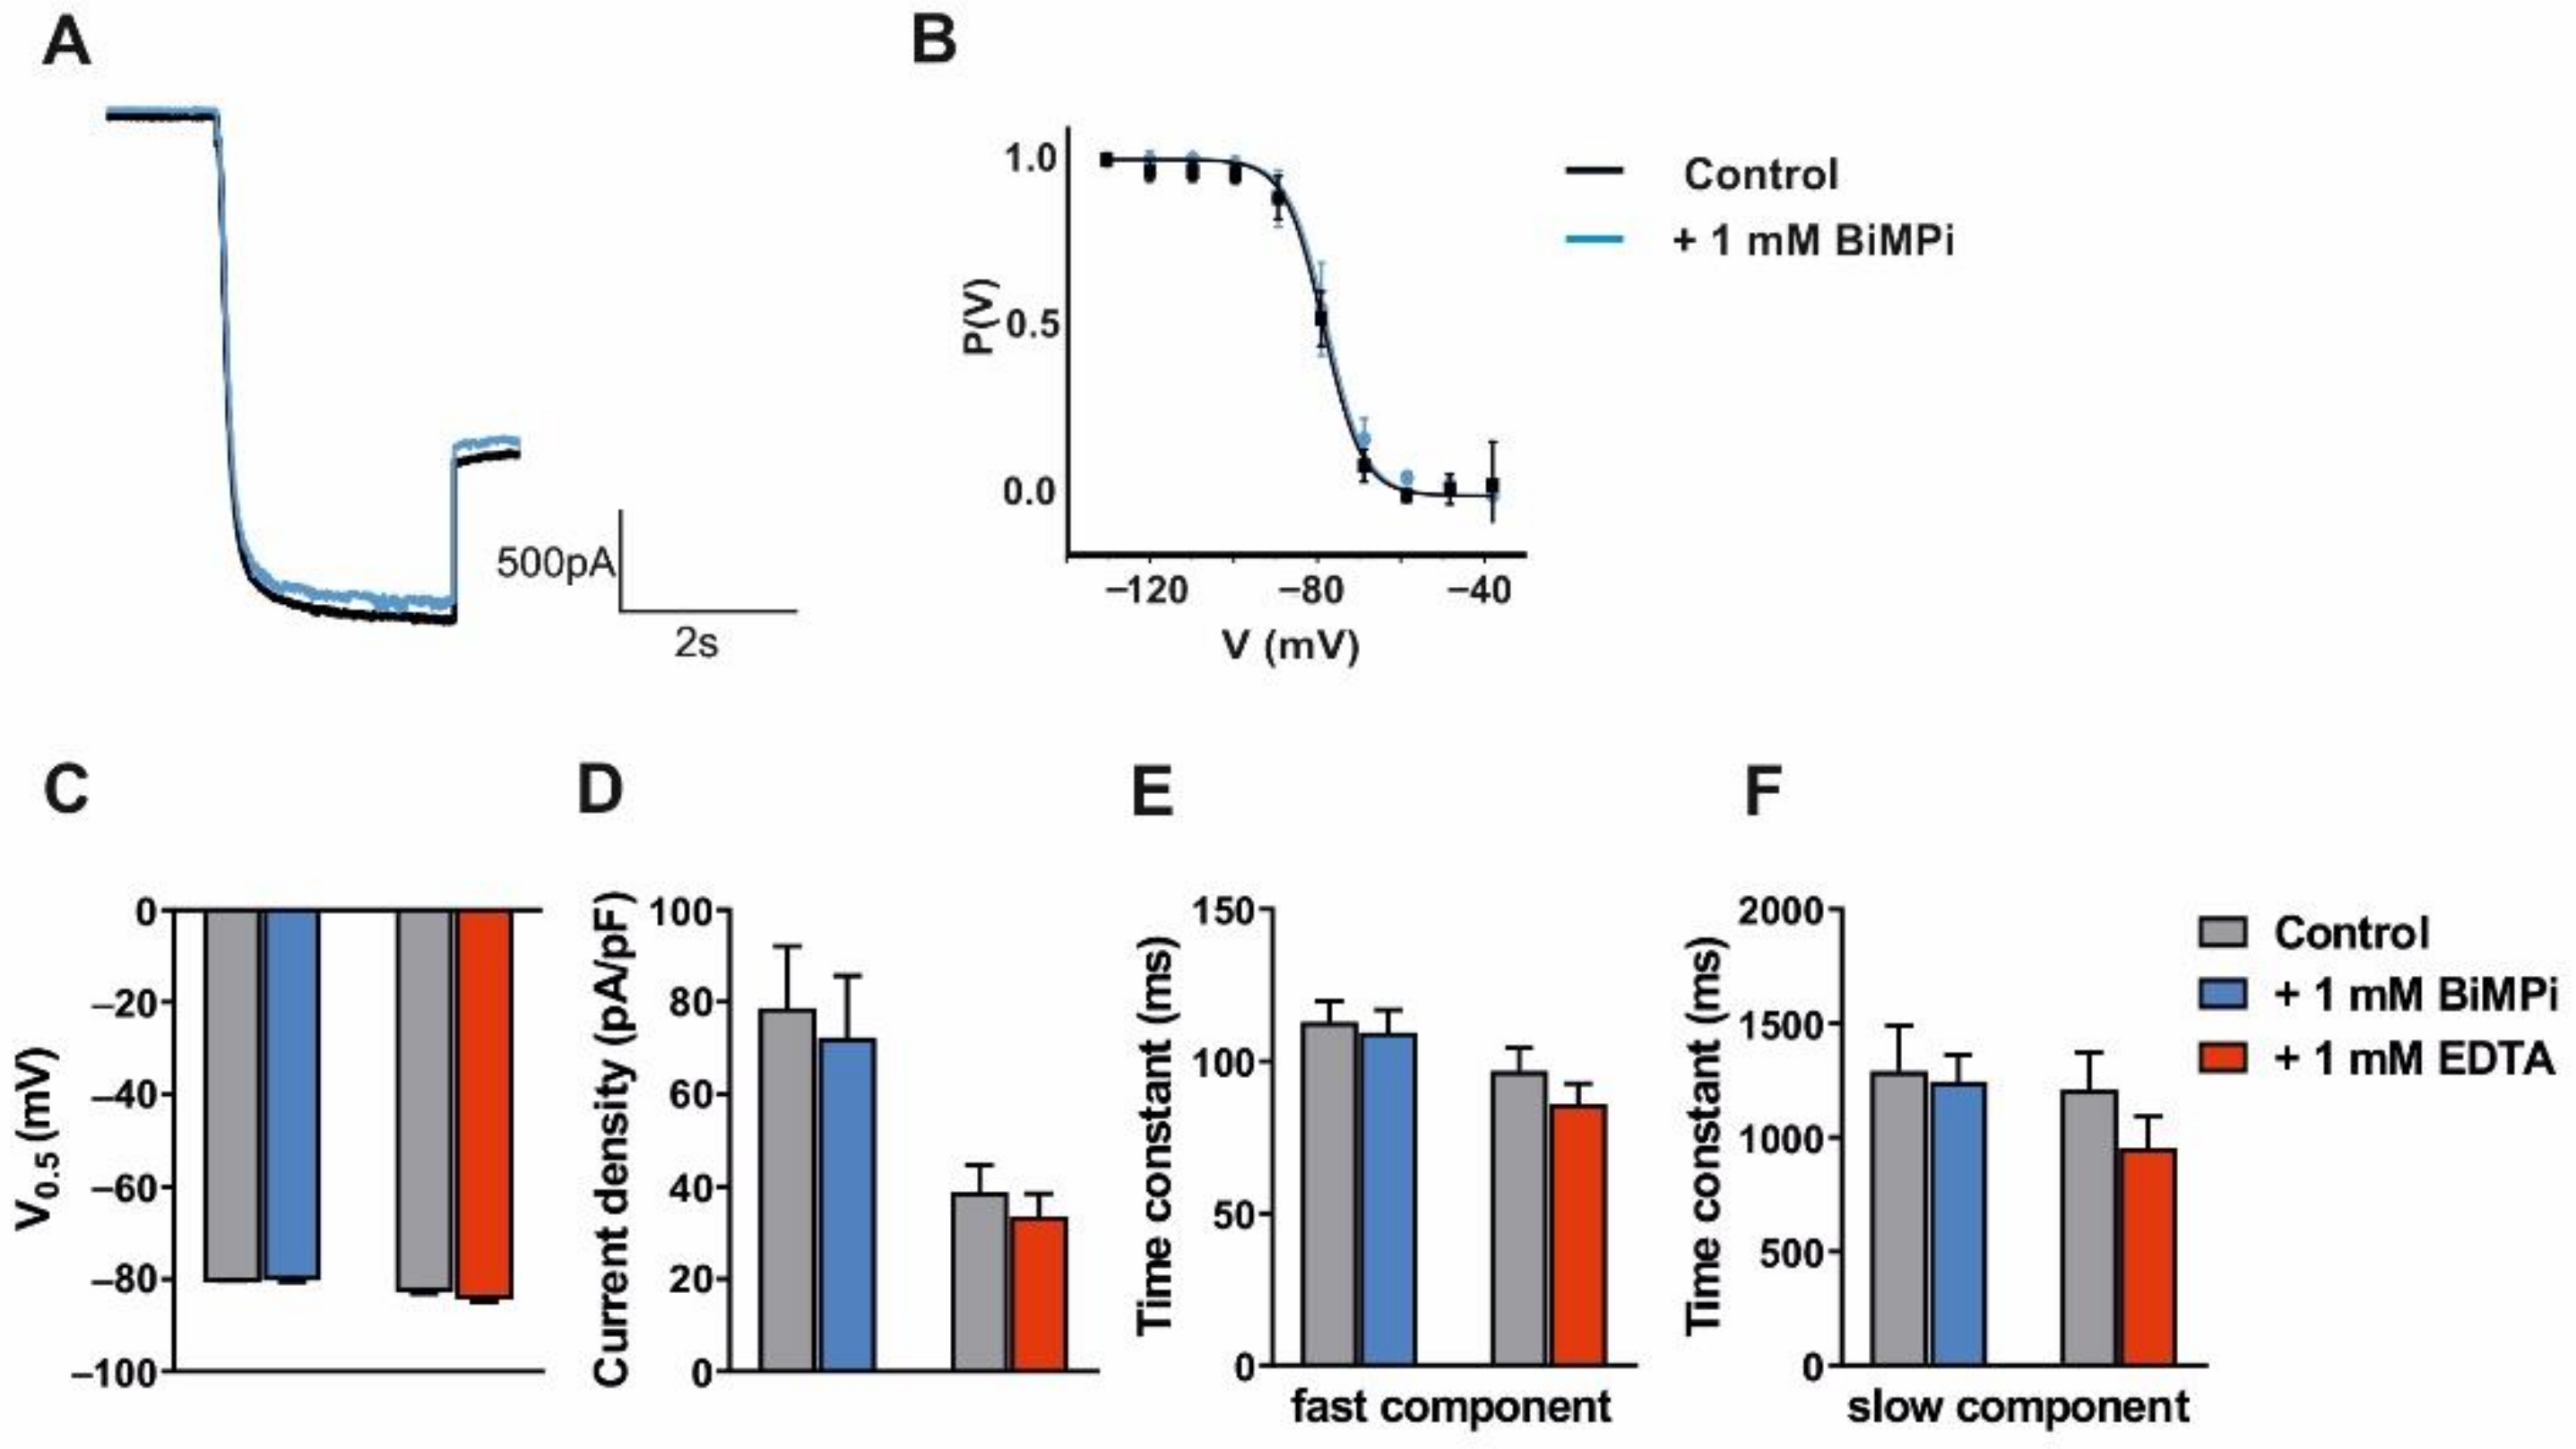
3.2. Modulation of VB TC Neurons in C57BL/6J Mice by Trace Metals and Divalent Cation Chelators
3.3. Modulation of HCN2 and HCN4 Channel Subunits in HEK293 and Oocyte Cells by Divalent Cations Chelators and Trace Metals
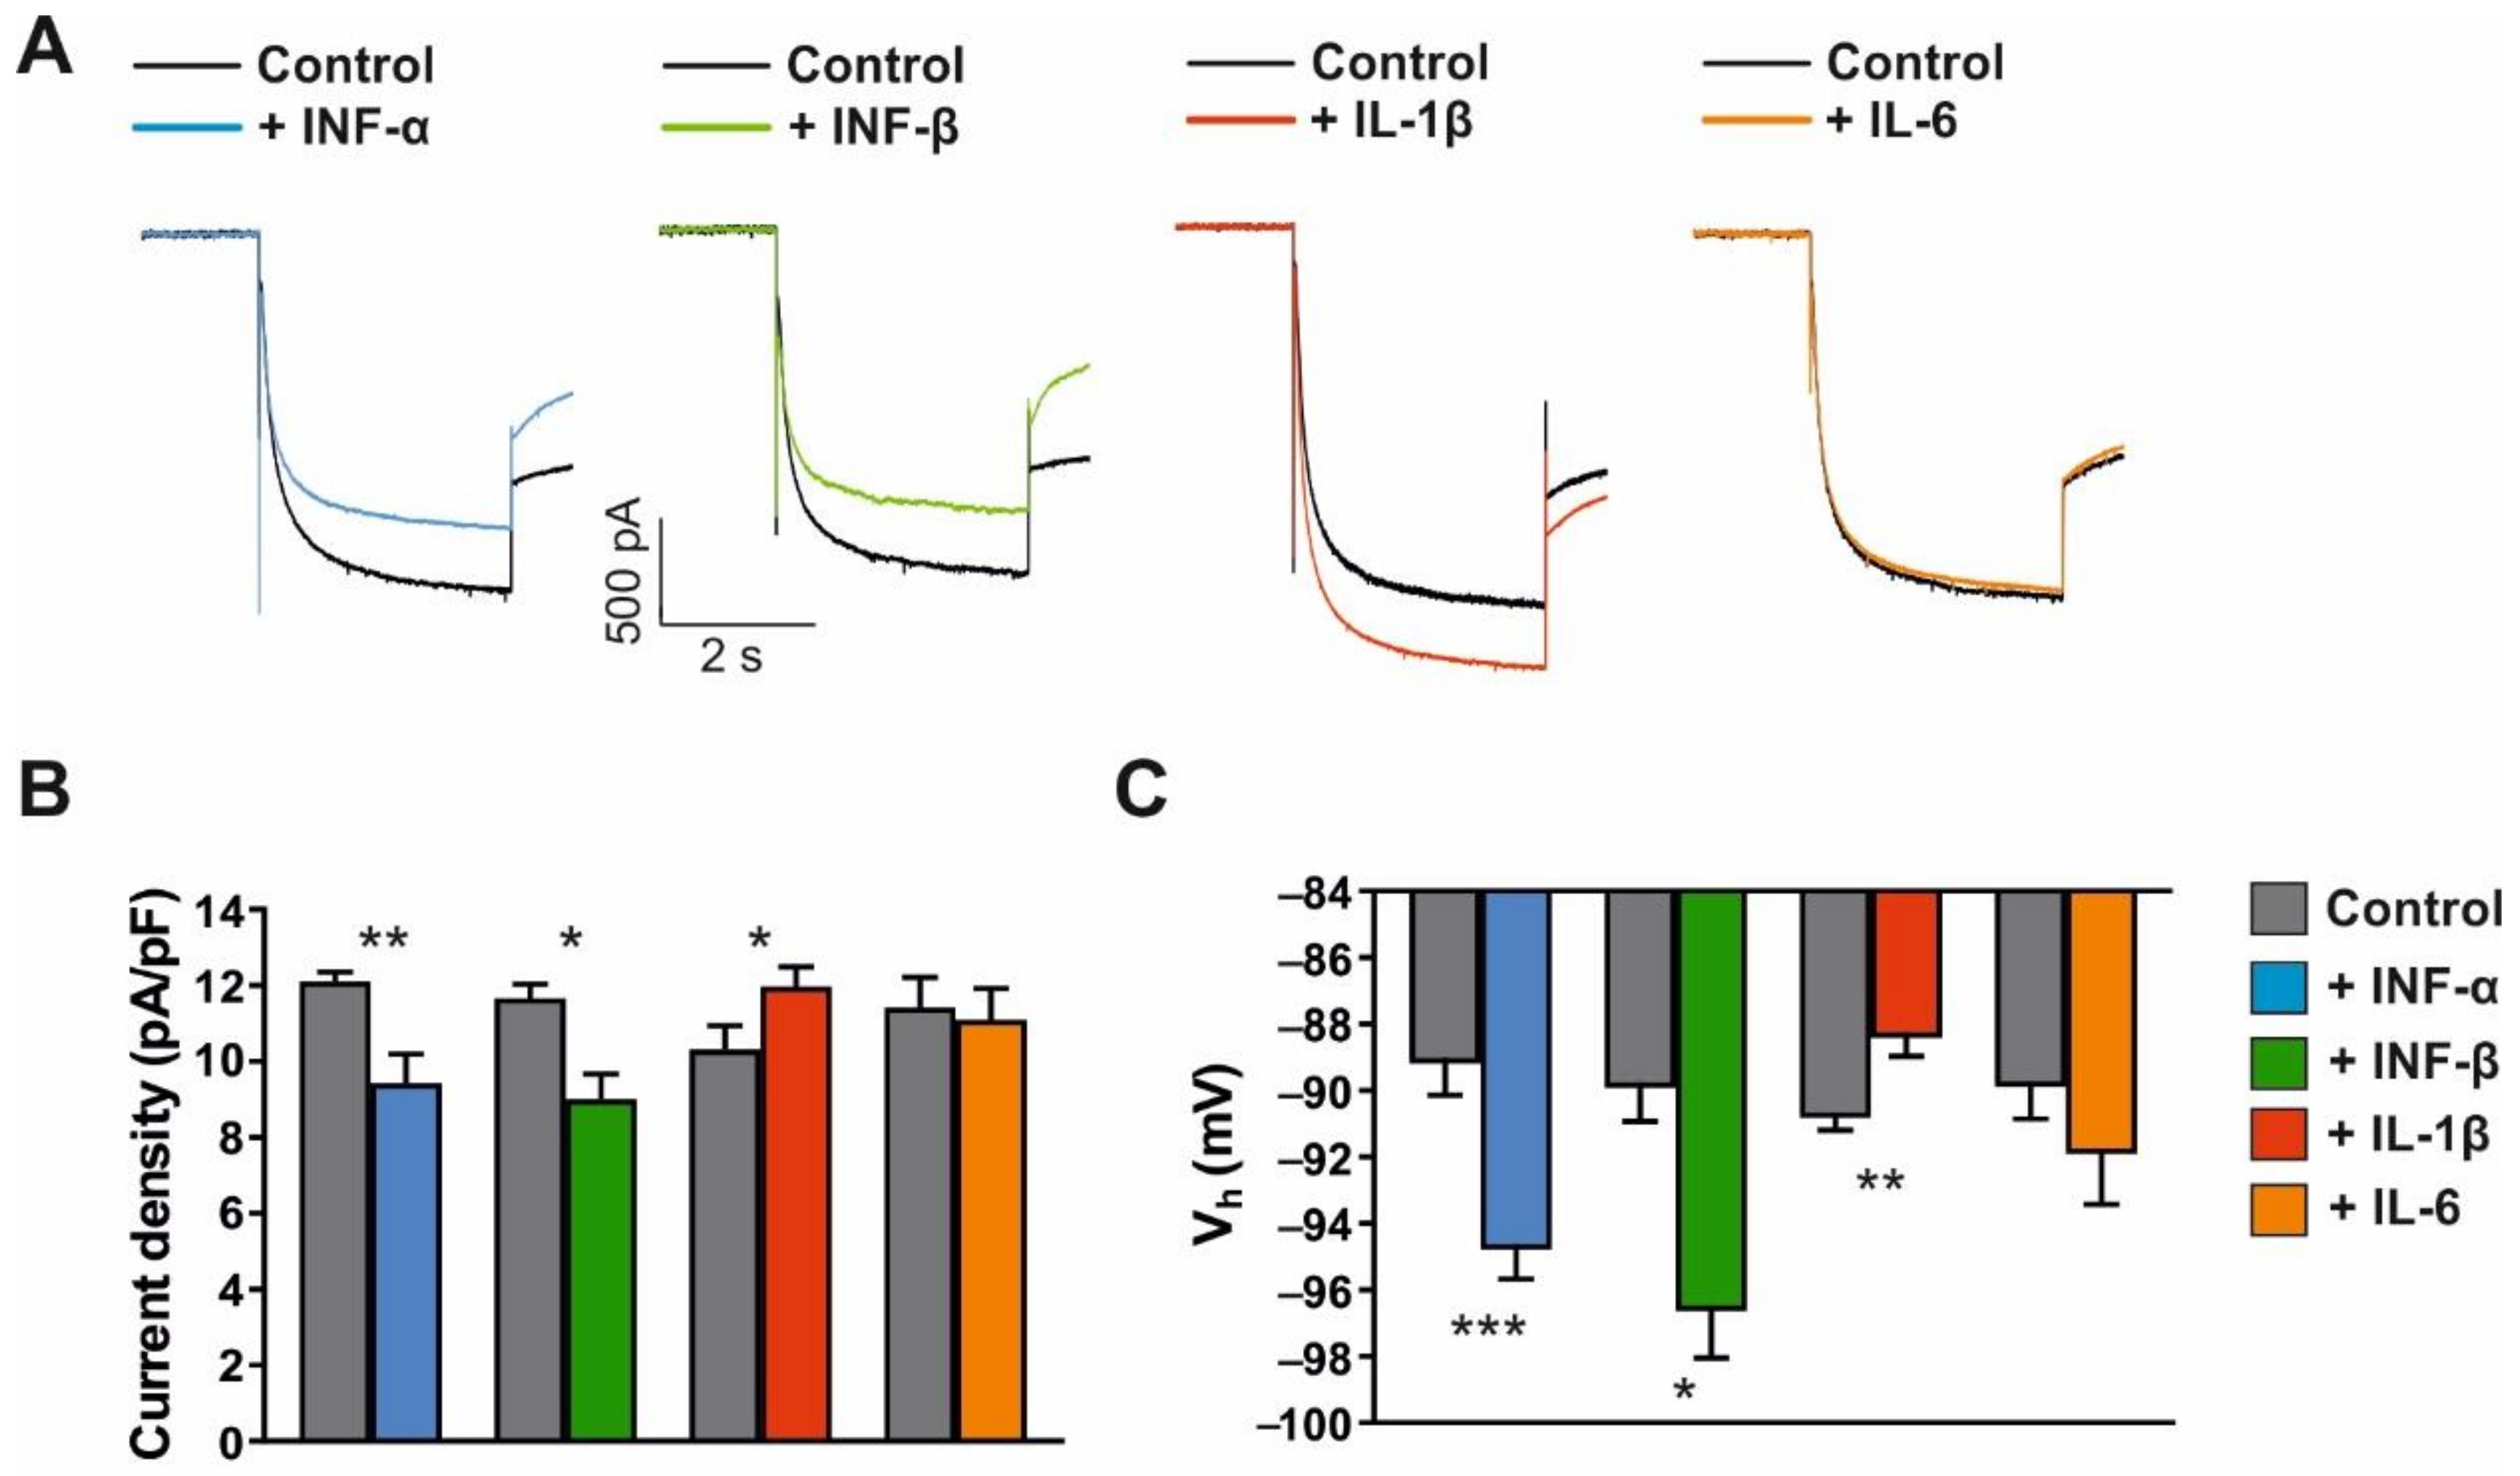
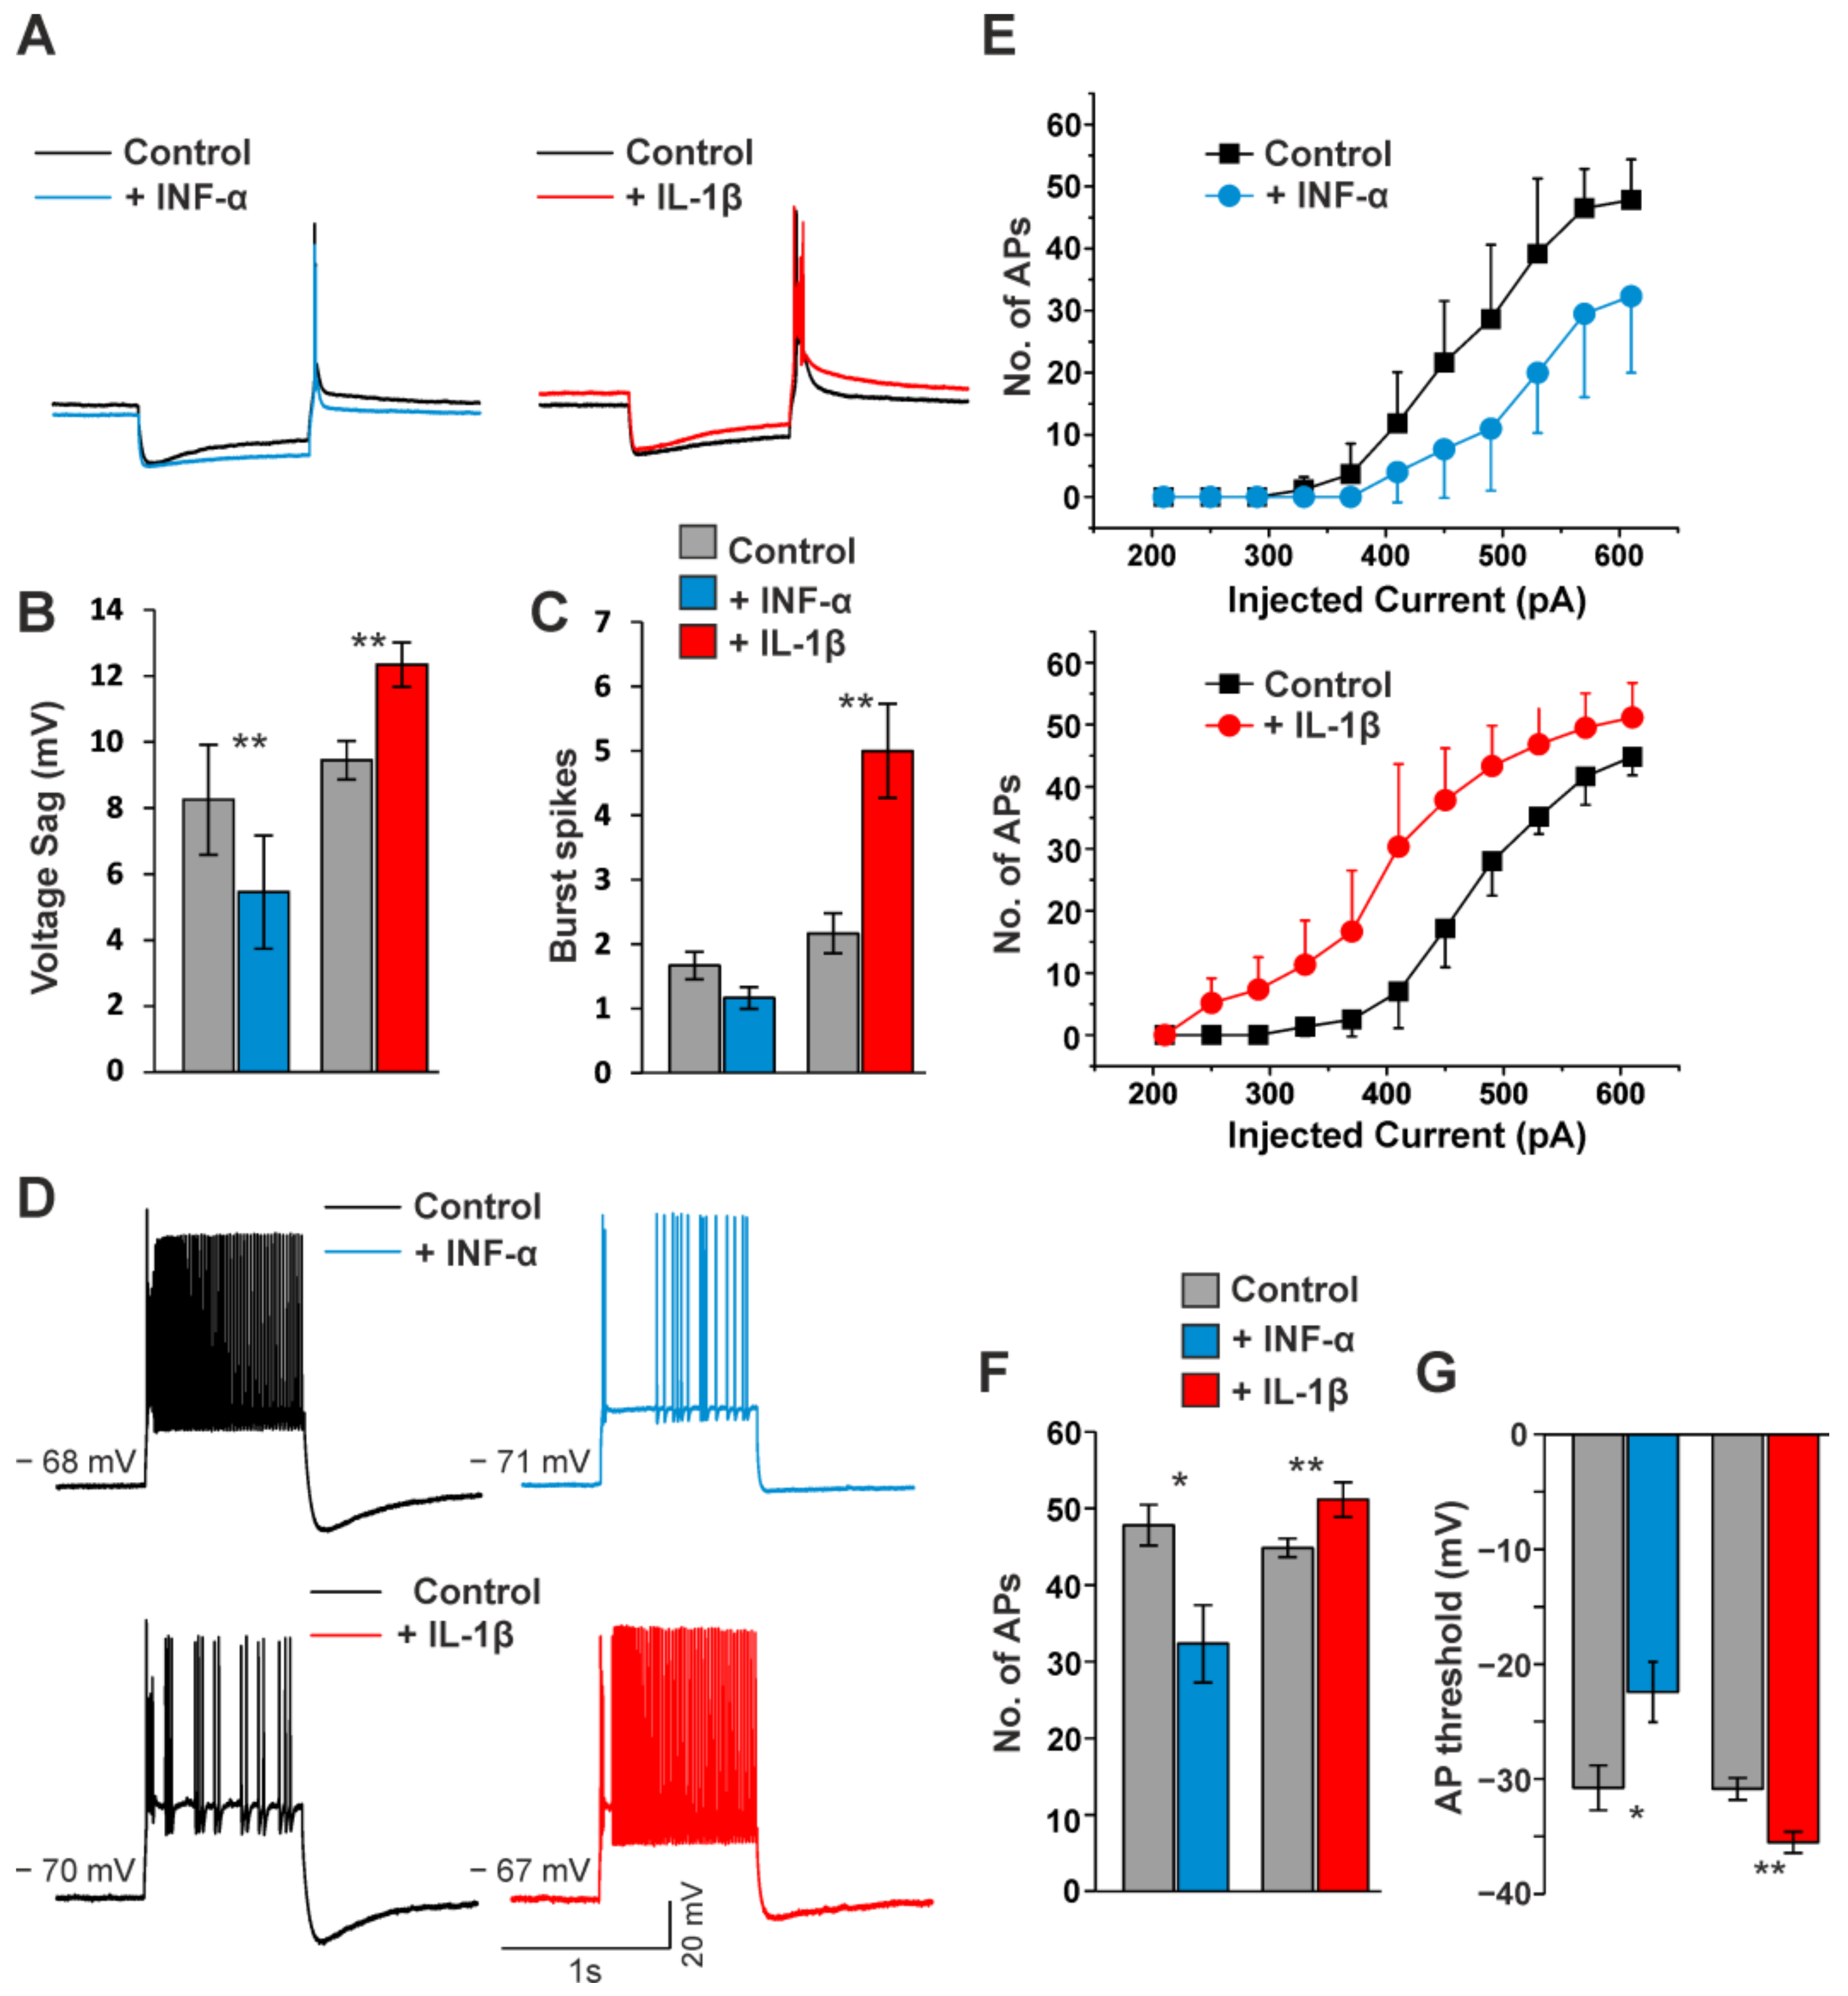
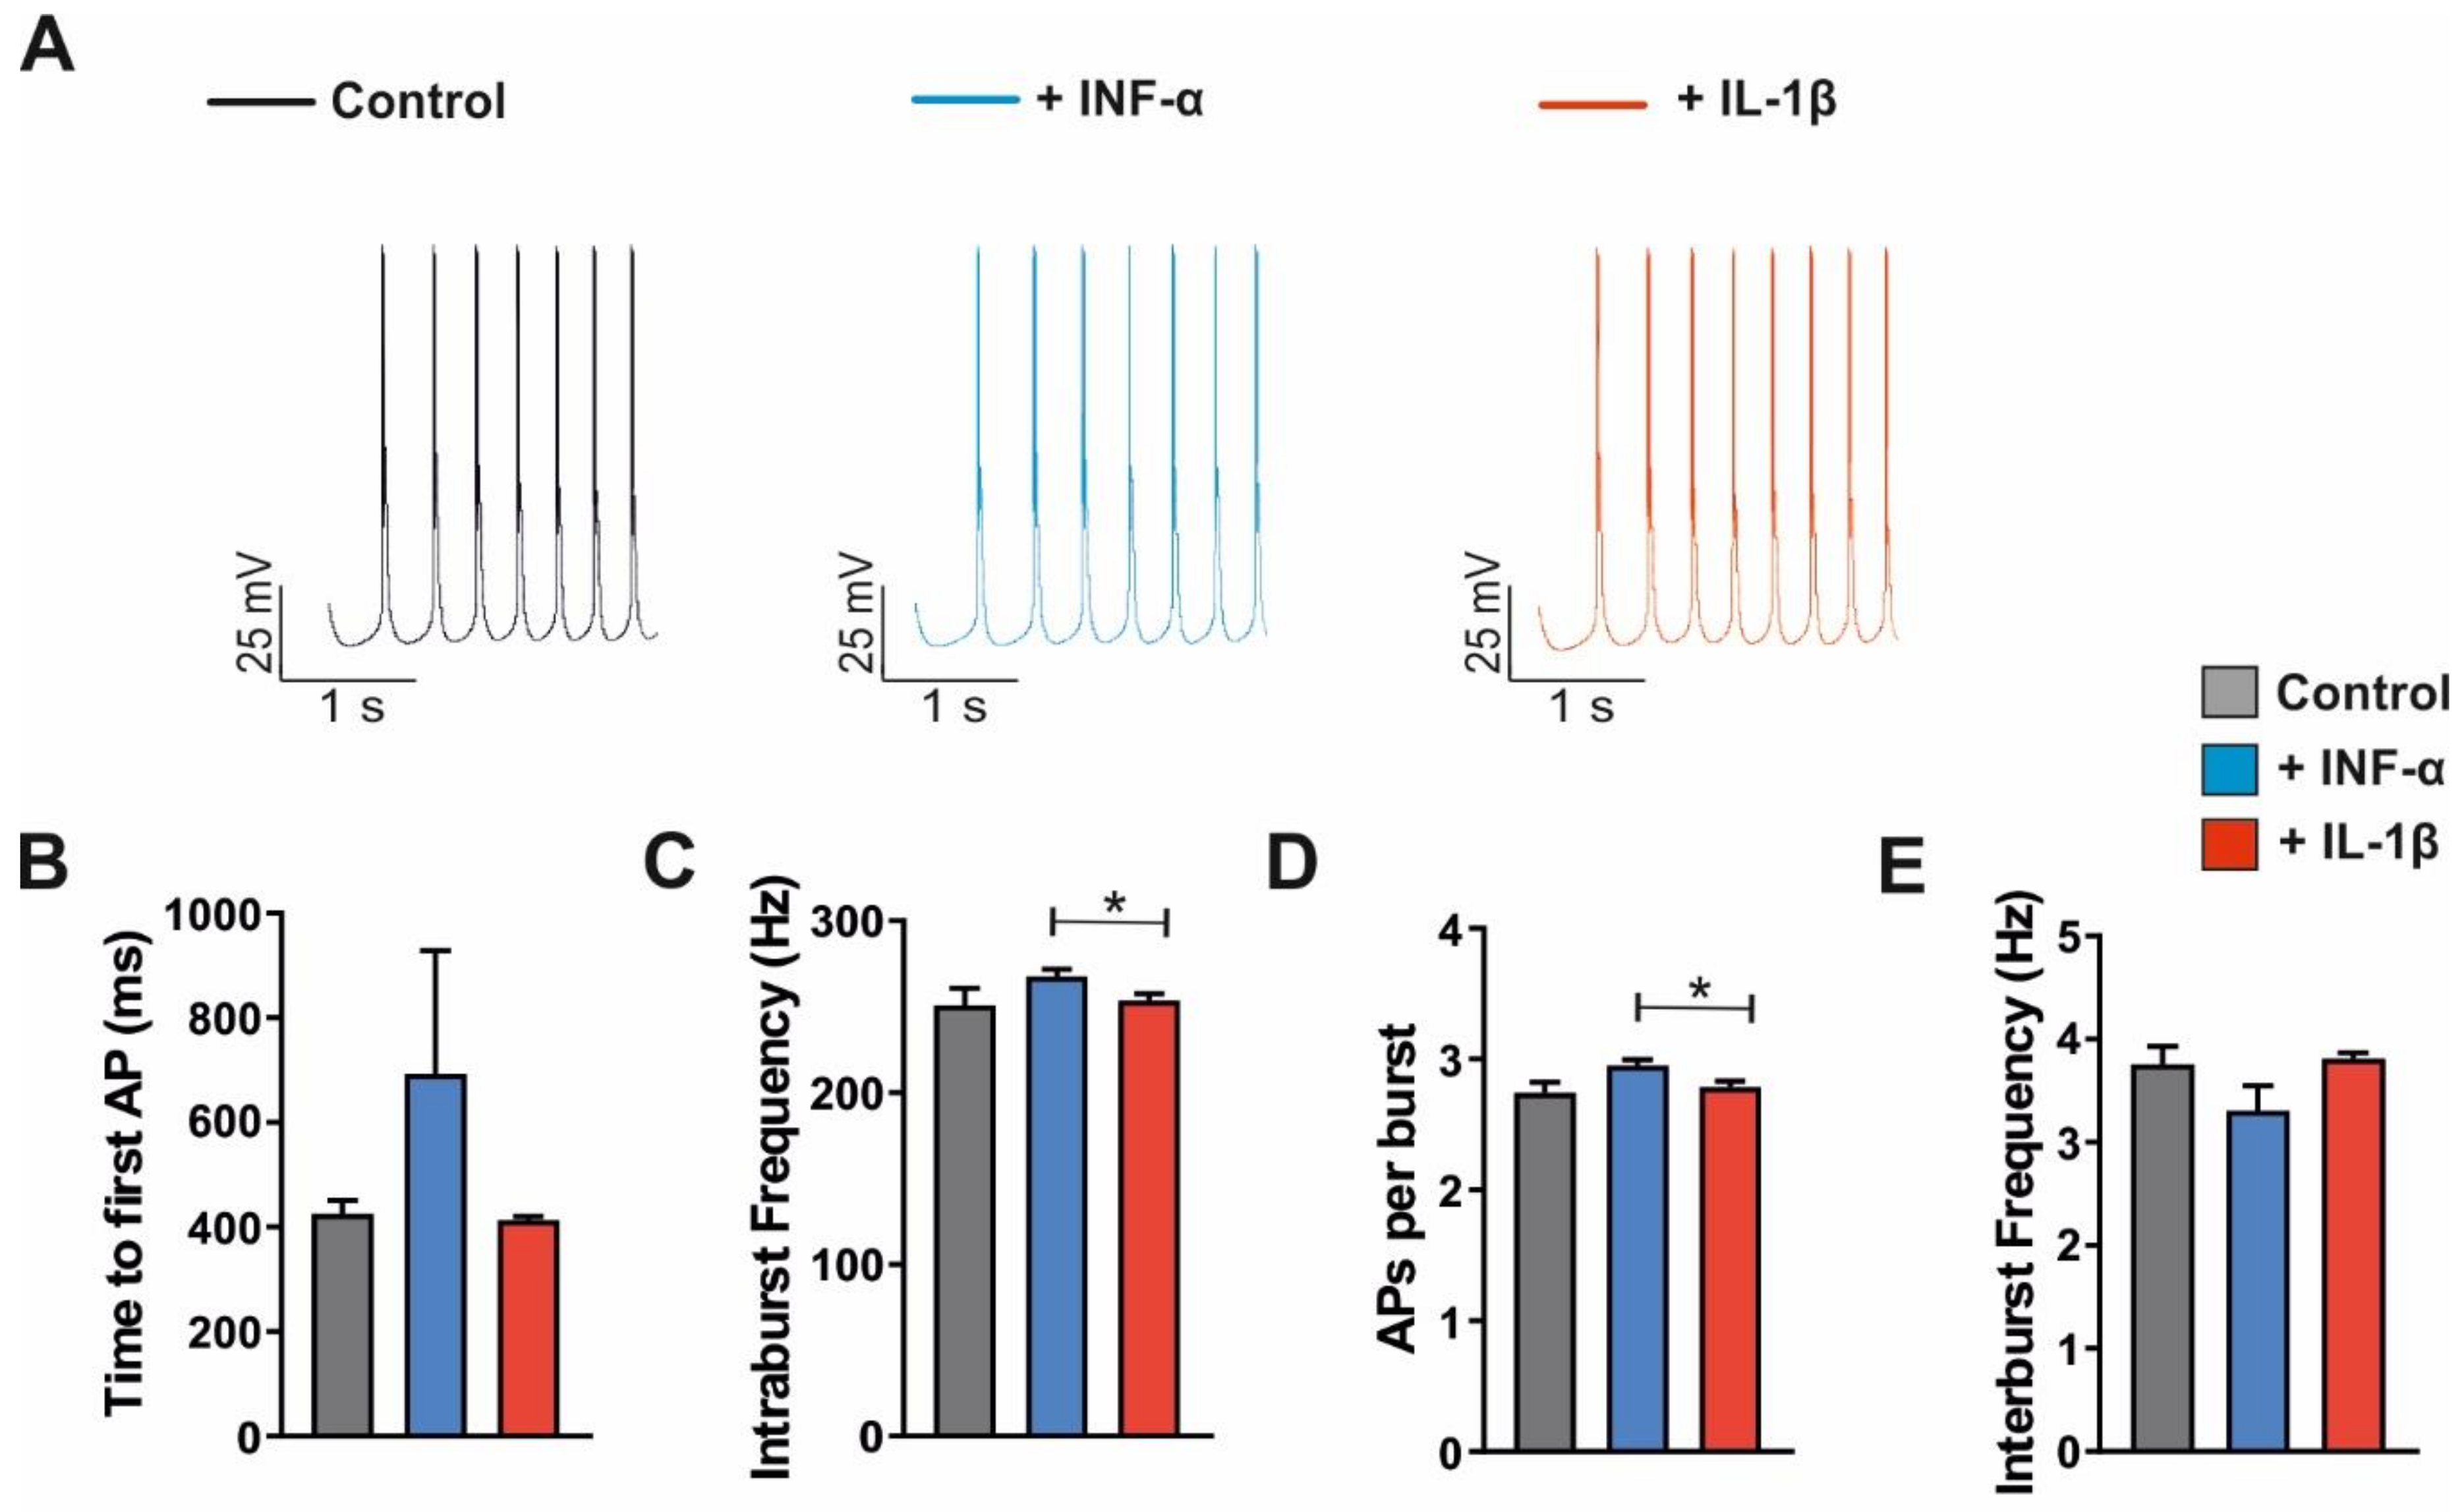
3.4. Modulation of Ih Current, Firing Pattern and Intrinsic Properties of VB TC Neurons by Cytokines
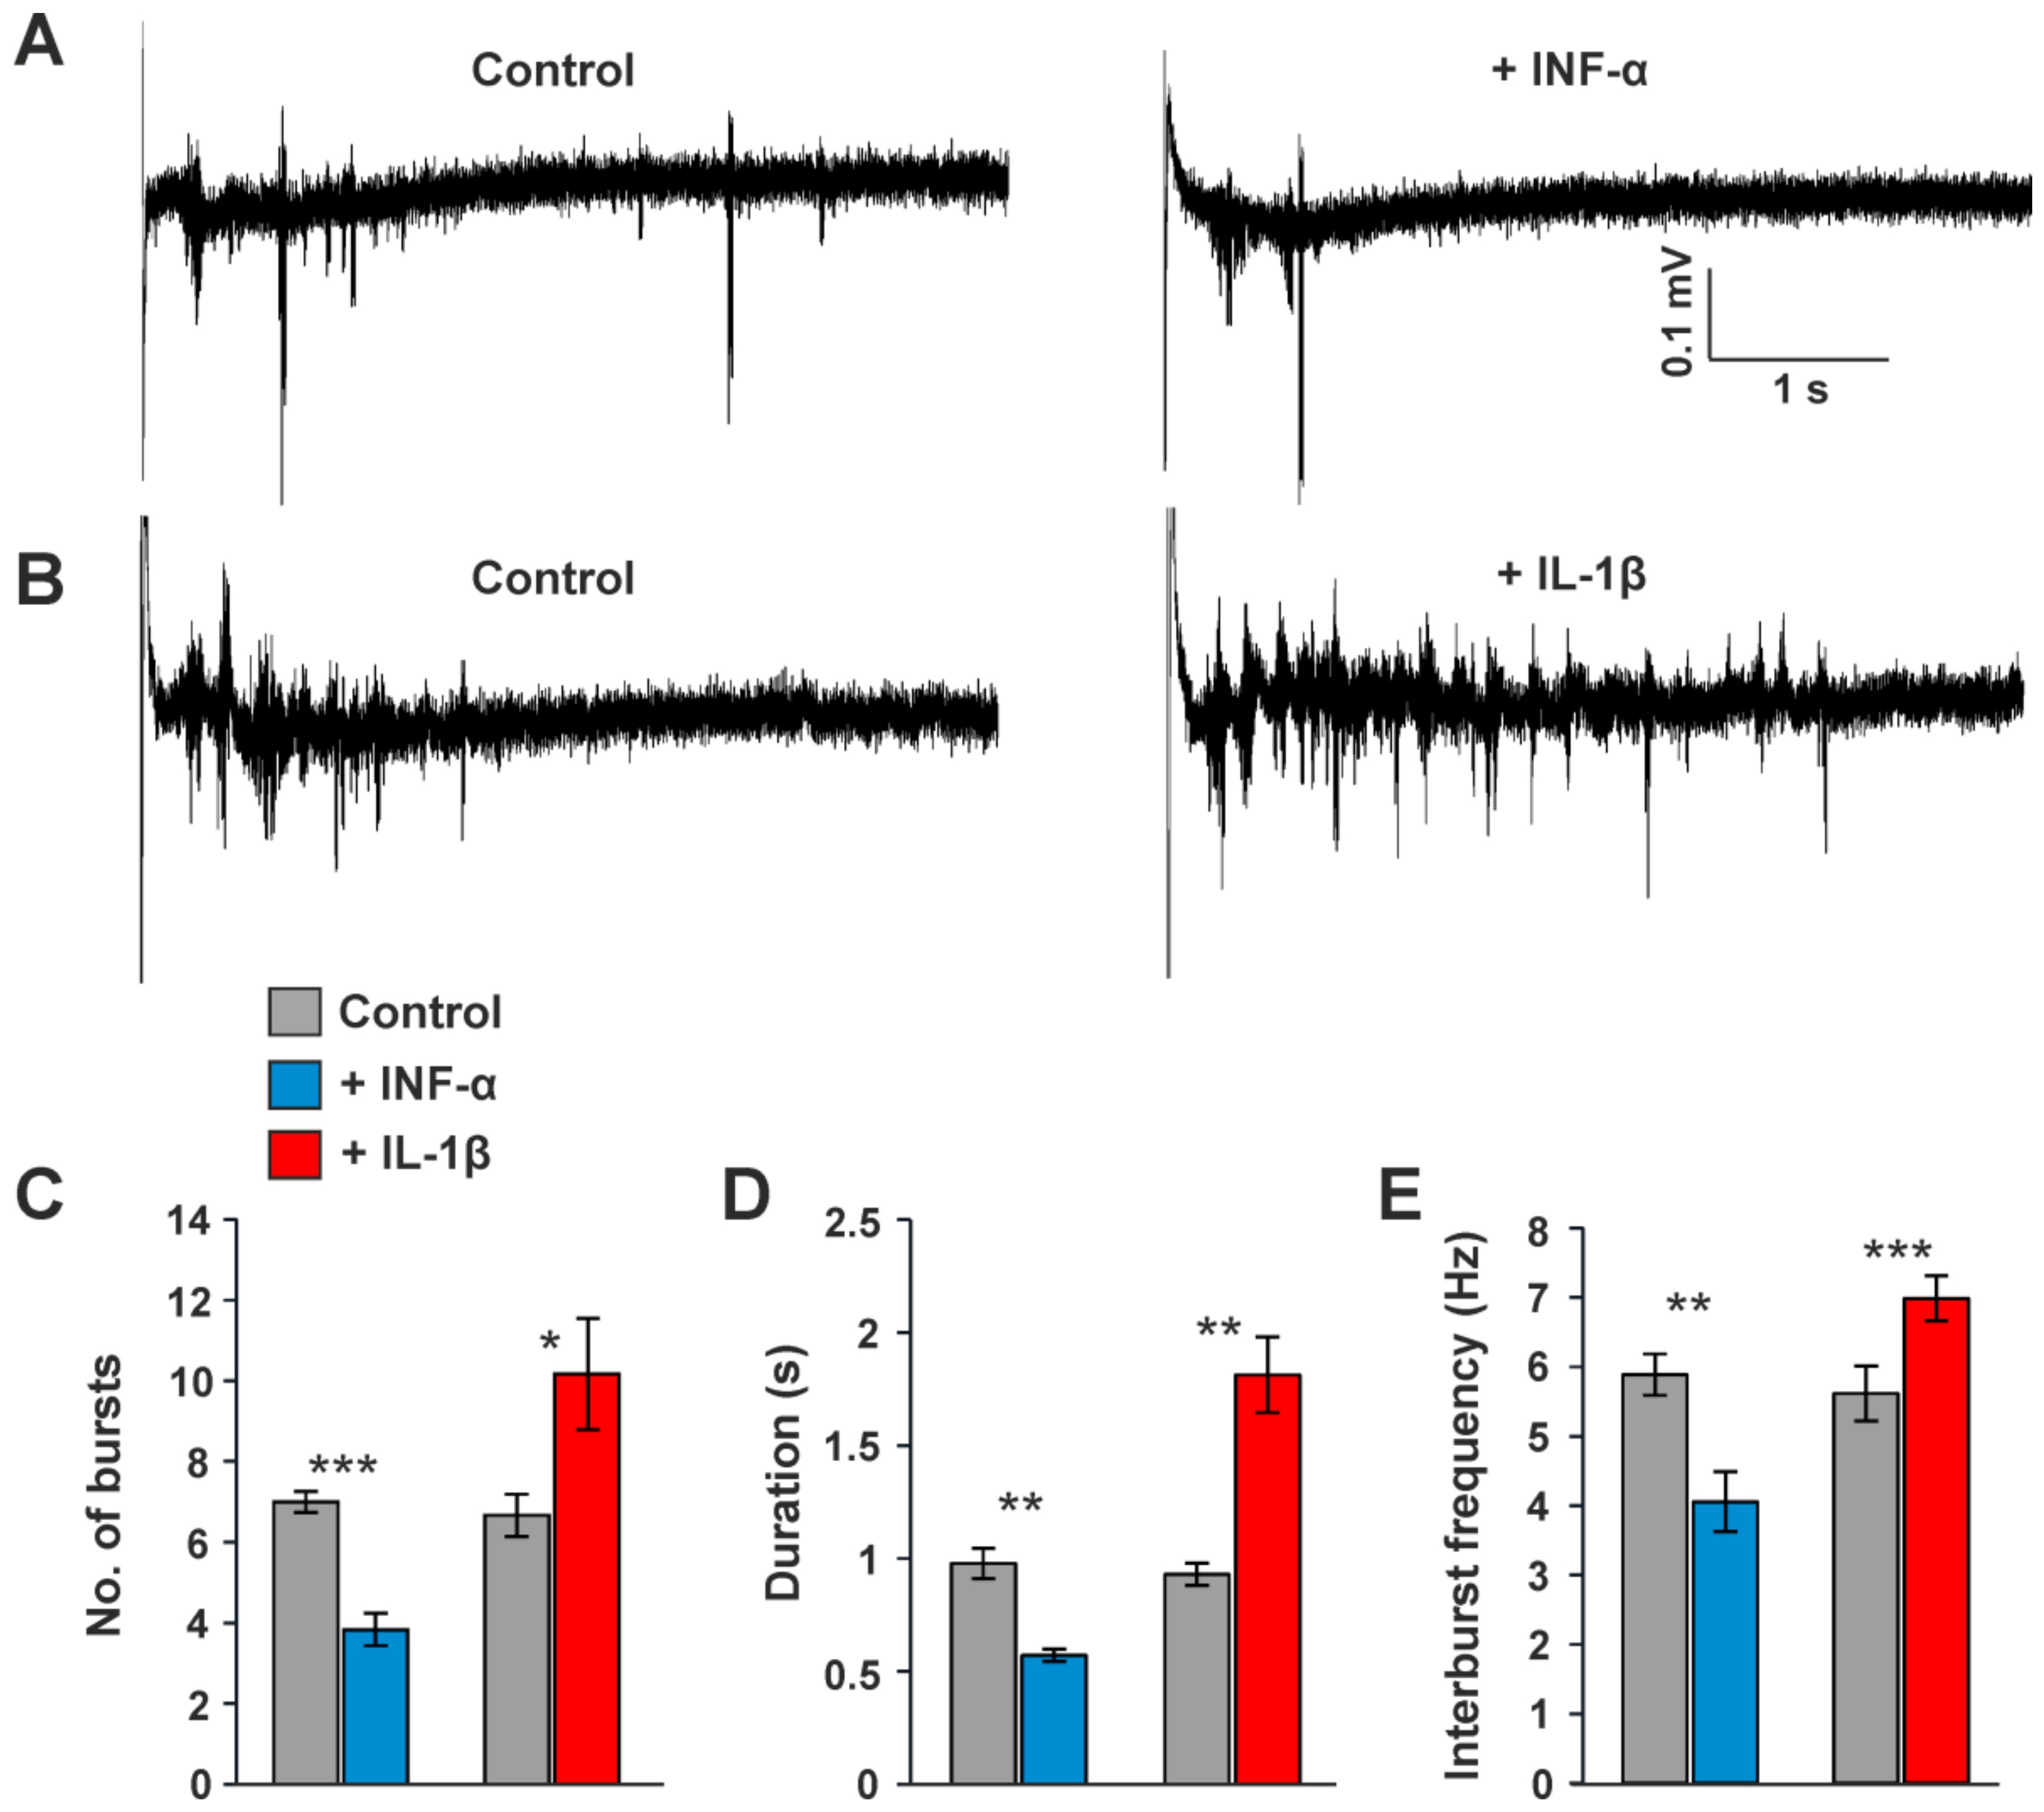
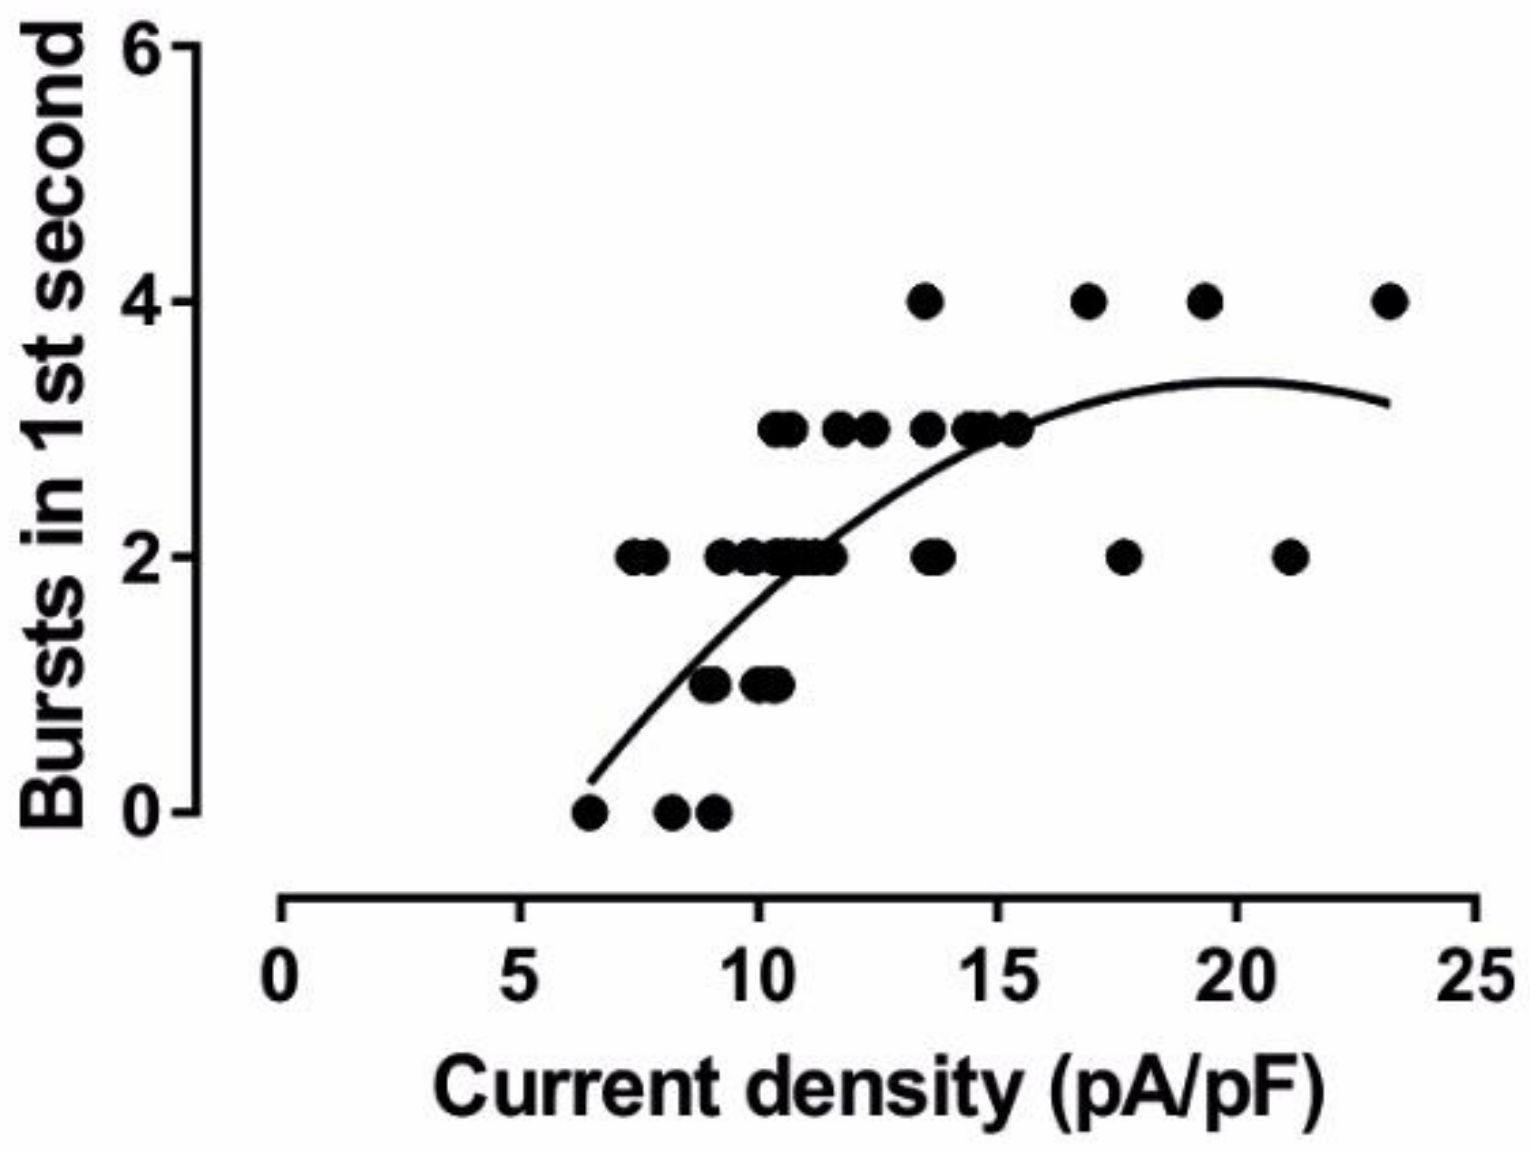
3.5. Influence of Cytokines on Intrathalamic Oscillatory Burst Activity
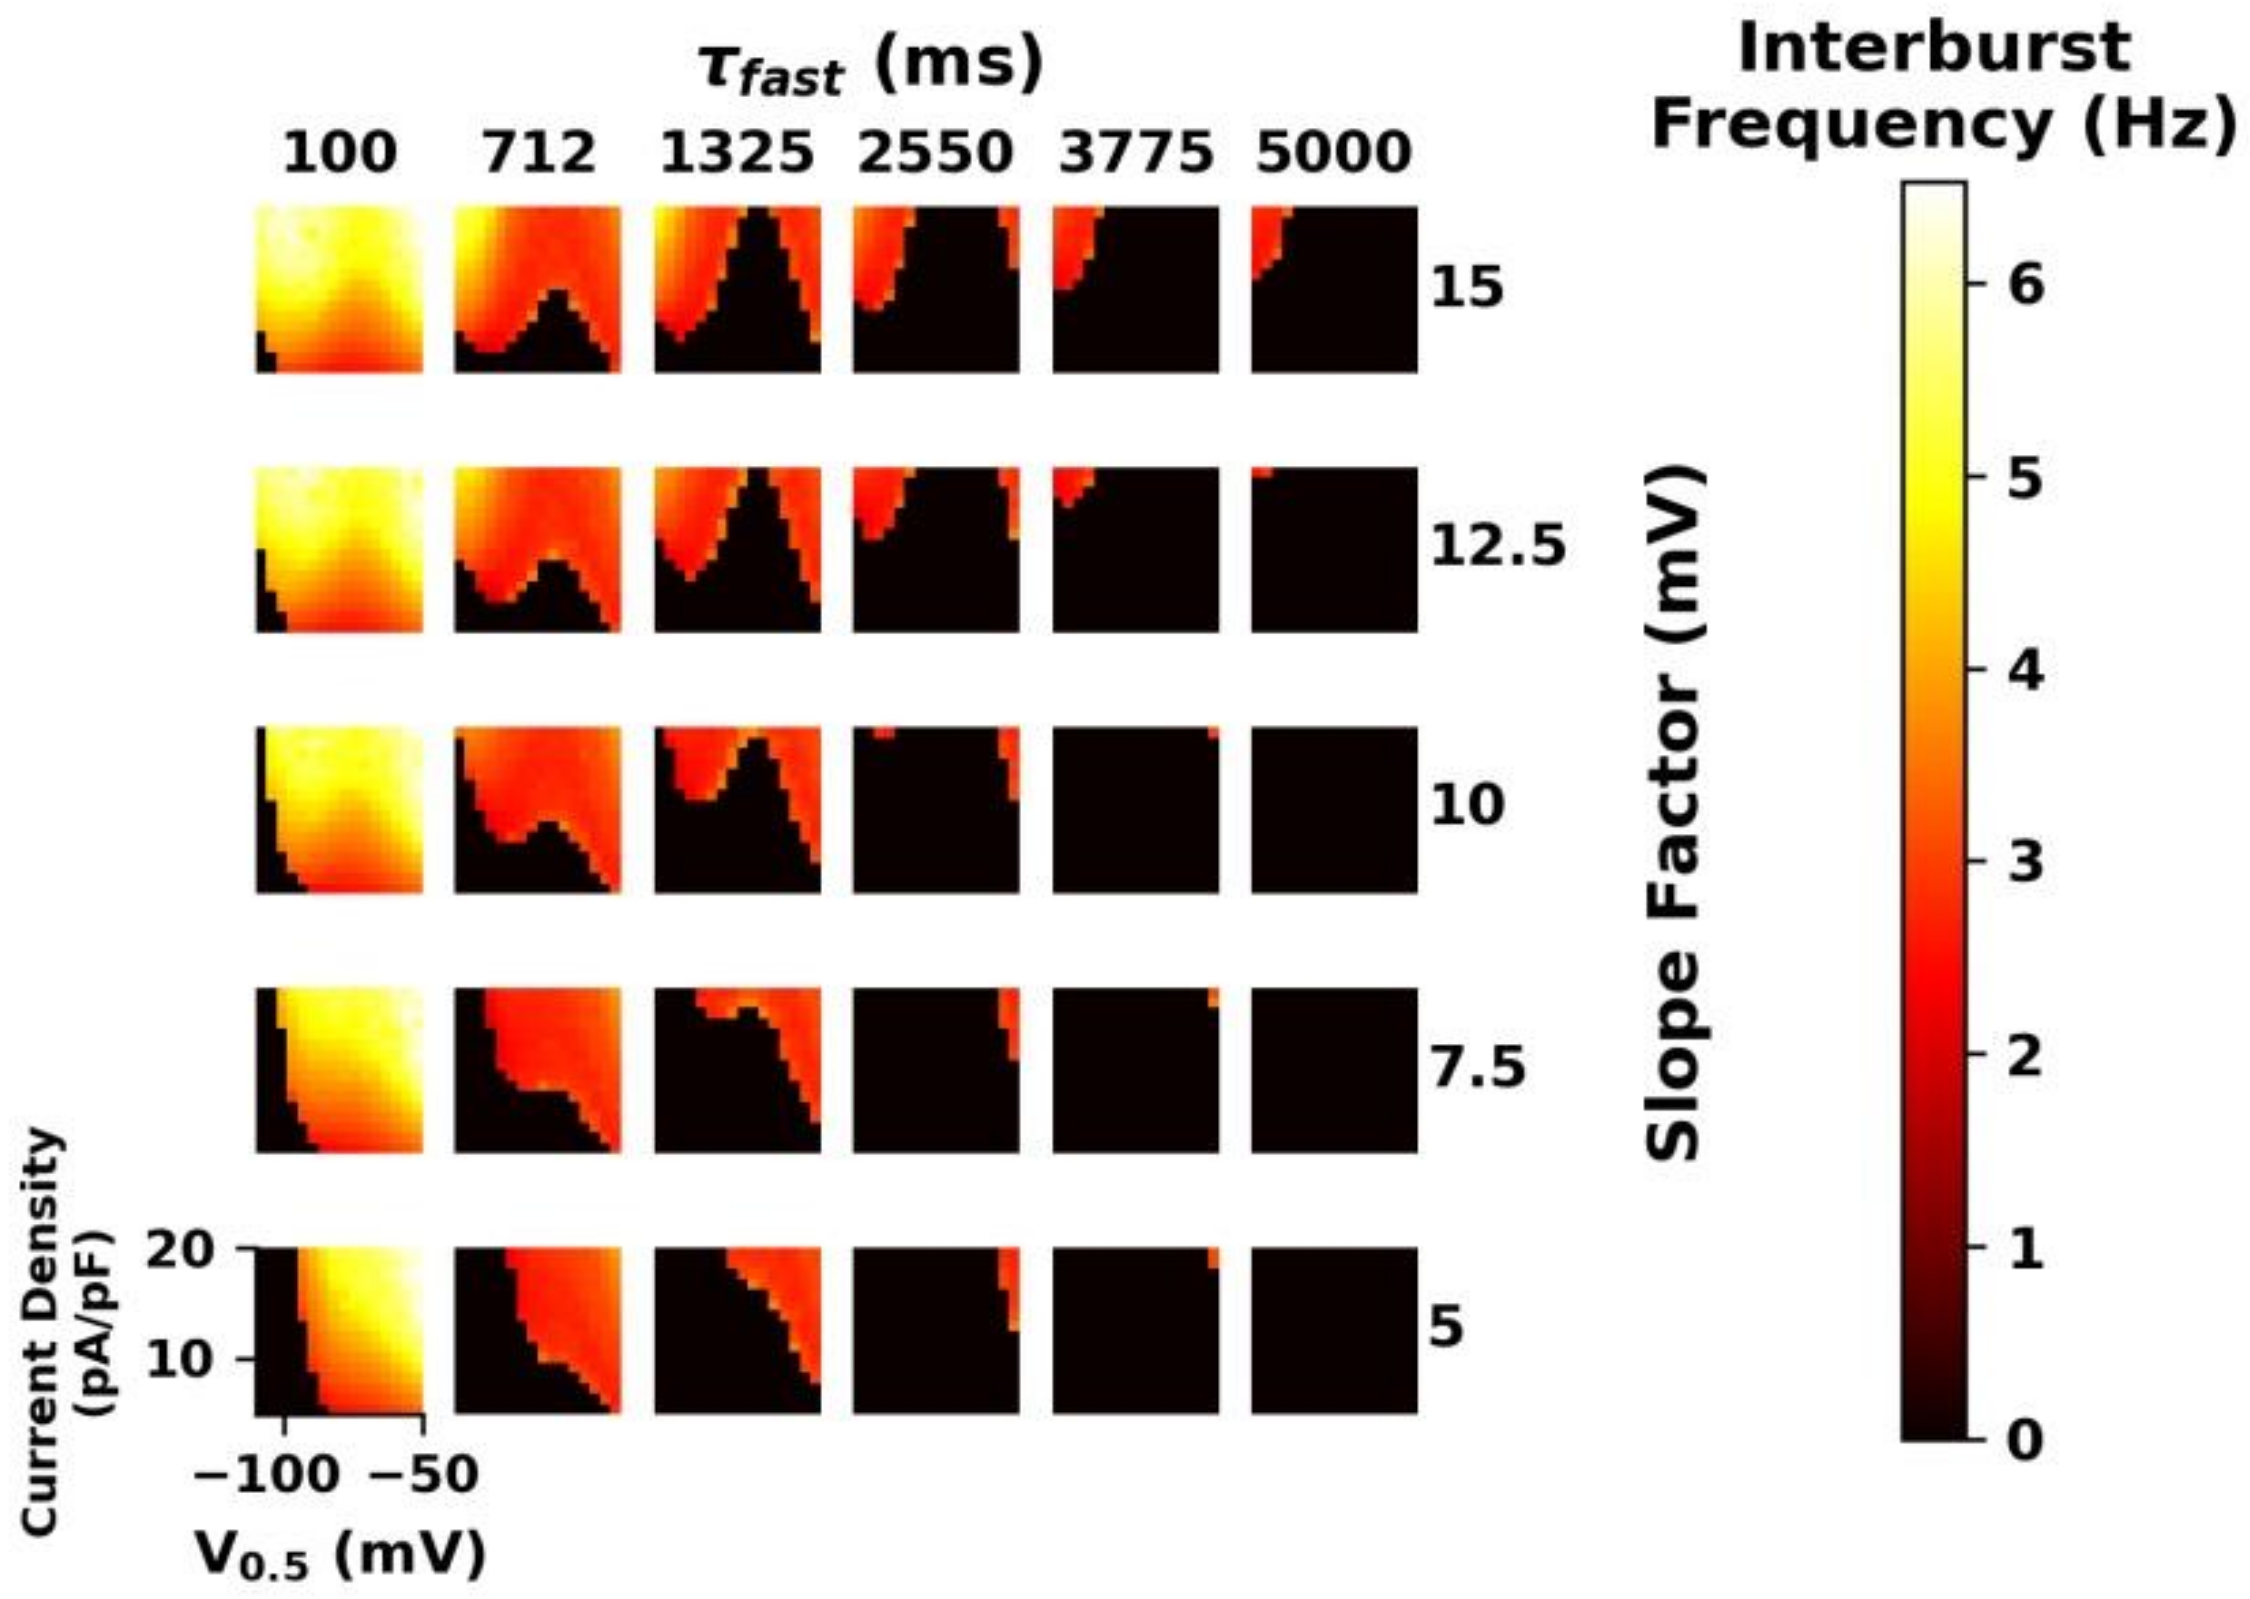
3.6. Mathematical Modeling of Intrathalamic Network Activity
4. Discussion
4.1. Alterations in HCN Channel Activity Due to CPZ Induced de-and Remyelination
4.2. HCN Channels Are Not Directly Modulated by Trace Metals and Divalent Cation Chelators
4.3. Modulation of Ih Current by Inflammatory Cytokines-Microglial Response
4.4. Changes of Intrathalamic Network Activity and Mathematical Modeling
5. Conclusions
Supplementary Materials
Author Contributions
Funding
Institutional Review Board Statement
Informed Consent Statement
Data Availability Statement
Acknowledgments
Conflicts of Interest
References
- Browne, S.H.; Kang, J.; Akk, G.; Chiang, L.W.; Schulman, H.; Huguenard, J.R.; Prince, D.A. Kinetic and pharmacological properties of GABA(A) receptors in single thalamic neurons and GABA(A) subunit expression. J. Neurophysiol. 2001, 86, 2312–2322. [Google Scholar] [CrossRef] [PubMed]
- Steriade, M. Synchronized activities of coupled oscillators in the cerebral cortex and thalamus at different levels of vigilance. Cereb. Cortex 1997, 7, 583–604. [Google Scholar] [CrossRef] [PubMed]
- Steriade, M.; McCormick, D.A.; Sejnowski, T.J. Thalamocortical oscillations in the sleeping and aroused brain. Science 1993, 262, 679–685. [Google Scholar] [CrossRef] [PubMed]
- Llinas, R.R.; Ribary, U.; Jeanmonod, D.; Kronberg, E.; Mitra, P.P. Thalamocortical dysrhythmia: A neurological and neuropsychiatric syndrome characterized by magnetoencephalography. Proc. Natl. Acad. Sci. USA 1999, 96, 15222–15227. [Google Scholar] [CrossRef]
- Jeanmonod, D.; Magnin, M.; Morel, A. Thalamus and neurogenic pain: Physiological, anatomical and clinical data. Neuroreport 1993, 4, 475–478. [Google Scholar] [CrossRef]
- Jeanmonod, D.; Magnin, M.; Morel, A. Low-threshold calcium spike bursts in the human thalamus. Common physiopathology for sensory, motor and limbic positive symptoms. Brain 1996, 119 Pt 2, 363–375. [Google Scholar] [CrossRef]
- Schulman, J.J.; Cancro, R.; Lowe, S.; Lu, F.; Walton, K.D.; Llinas, R.R. Imaging of thalamocortical dysrhythmia in neuropsychiatry. Front. Hum. Neurosci. 2011, 5, 69. [Google Scholar] [CrossRef]
- Broicher, T.; Seidenbecher, T.; Meuth, P.; Munsch, T.; Meuth, S.G.; Kanyshkova, T.; Pape, H.C.; Budde, T. T-current related effects of antiepileptic drugs and a Ca2+ channel antagonist on thalamic relay and local circuit interneurons in a rat model of absence epilepsy. Neuropharmacology 2007, 53, 431–446. [Google Scholar] [CrossRef]
- Kanyshkova, T.; Meuth, P.; Bista, P.; Liu, Z.; Ehling, P.; Caputi, L.; Doengi, M.; Chetkovich, D.M.; Pape, H.C.; Budde, T. Differential regulation of HCN channel isoform expression in thalamic neurons of epileptic and non-epileptic rat strains. Neurobiol. Dis. 2012, 45, 450–461. [Google Scholar] [CrossRef]
- Perez-Reyes, E. Molecular physiology of low-voltage-activated t-type calcium channels. Physiol. Rev. 2003, 83, 117–161. [Google Scholar] [CrossRef]
- Lory, P.; Nicole, S.; Monteil, A. Neuronal Cav3 channelopathies: Recent progress and perspectives. Pflugers Arch. 2020, 472, 831–844. [Google Scholar] [CrossRef] [PubMed]
- Spinelli, V.; Sartiani, L.; Mugelli, A.; Romanelli, M.N.; Cerbai, E. Hyperpolarization-activated cyclic-nucleotide-gated channels: Pathophysiological, developmental, and pharmacological insights into their function in cellular excitability. Can. J. Physiol. Pharmacol. 2018, 96, 977–984. [Google Scholar] [CrossRef] [PubMed]
- Sartiani, L.; Mannaioni, G.; Masi, A.; Novella Romanelli, M.; Cerbai, E. The Hyperpolarization-Activated Cyclic Nucleotide-Gated Channels: From Biophysics to Pharmacology of a Unique Family of Ion Channels. Pharmacol. Rev. 2017, 69, 354–395. [Google Scholar] [CrossRef]
- Llinas, R.R.; Steriade, M. Bursting of thalamic neurons and states of vigilance. J. Neurophysiol. 2006, 95, 3297–3308. [Google Scholar] [CrossRef] [PubMed]
- Ludwig, A.; Budde, T.; Stieber, J.; Moosmang, S.; Wahl, C.; Holthoff, K.; Langebartels, A.; Wotjak, C.; Munsch, T.; Zong, X.; et al. Absence epilepsy and sinus dysrhythmia in mice lacking the pacemaker channel HCN2. EMBO J. 2003, 22, 216–224. [Google Scholar] [CrossRef]
- Heuermann, R.J.; Jaramillo, T.C.; Ying, S.W.; Suter, B.A.; Lyman, K.A.; Han, Y.; Lewis, A.S.; Hampton, T.G.; Shepherd, G.M.G.; Goldstein, P.A.; et al. Reduction of thalamic and cortical Ih by deletion of TRIP8b produces a mouse model of human absence epilepsy. Neurobiol. Dis. 2016, 85, 81–92. [Google Scholar] [CrossRef] [PubMed][Green Version]
- Zobeiri, M.; Chaudhary, R.; Blaich, A.; Rottmann, M.; Herrmann, S.; Meuth, P.; Bista, P.; Kanyshkova, T.; Luttjohann, A.; Narayanan, V.; et al. The Hyperpolarization-Activated HCN4 Channel is Important for Proper Maintenance of Oscillatory Activity in the Thalamocortical System. Cereb. Cortex 2019, 29, 2291–2304. [Google Scholar] [CrossRef]
- Zobeiri, M.; Chaudhary, R.; Datunashvili, M.; Heuermann, R.J.; Luttjohann, A.; Narayanan, V.; Balfanz, S.; Meuth, P.; Chetkovich, D.M.; Pape, H.C.; et al. Modulation of thalamocortical oscillations by TRIP8b, an auxiliary subunit for HCN channels. Brain Struct. Funct. 2018, 223, 1537–1564. [Google Scholar] [CrossRef]
- Datunashvili, M.; Chaudhary, R.; Zobeiri, M.; Luttjohann, A.; Mergia, E.; Baumann, A.; Balfanz, S.; Budde, B.; van Luijtelaar, G.; Pape, H.C.; et al. Modulation of Hyperpolarization-Activated Inward Current and Thalamic Activity Modes by Different Cyclic Nucleotides. Front. Cell. Neurosci. 2018, 12, 369. [Google Scholar] [CrossRef]
- De Ridder, D.; Vanneste, S.; Langguth, B.; Llinas, R. Thalamocortical Dysrhythmia: A Theoretical Update in Tinnitus. Front. Neurol. 2015, 6, 124. [Google Scholar] [CrossRef]
- Zhang, D.; Choi, Y.S.; Madhok, J.; Jia, X.; Koenig, M.; Thakor, N. Neural signals in cortex and thalamus during brain injury from cardiac arrest in rats. Annu. Int. Conf. IEEE Eng. Med. Biol. Soc. 2009, 2009, 5946–5949. [Google Scholar] [CrossRef] [PubMed]
- Chung, W.K.; Shin, M.; Jaramillo, T.C.; Leibel, R.L.; LeDuc, C.A.; Fischer, S.G.; Tzilianos, E.; Gheith, A.A.; Lewis, A.S.; Chetkovich, D.M. Absence epilepsy in apathetic, a spontaneous mutant mouse lacking the h channel subunit, HCN2. Neurobiol. Dis. 2009, 33, 499–508. [Google Scholar] [CrossRef] [PubMed]
- Barnett, M.H.; Prineas, J.W. Relapsing and remitting multiple sclerosis: Pathology of the newly forming lesion. Ann. Neurol. 2004, 55, 458–468. [Google Scholar] [CrossRef] [PubMed]
- Kipp, M.; Wagenknecht, N.; Beyer, C.; Samer, S.; Wuerfel, J.; Nikoubashman, O. Thalamus pathology in multiple sclerosis: From biology to clinical application. Cell. Mol. Life Sci. 2015, 72, 1127–1147. [Google Scholar] [CrossRef]
- Chard, D.T.; Alahmadi, A.A.S.; Audoin, B.; Charalambous, T.; Enzinger, C.; Hulst, H.E.; Rocca, M.A.; Rovira, A.; Sastre-Garriga, J.; Schoonheim, M.M.; et al. Mind the gap: From neurons to networks to outcomes in multiple sclerosis. Nat. Rev. Neurol. 2021, 17, 173–184. [Google Scholar] [CrossRef]
- Deppe, M.; Kramer, J.; Tenberge, J.G.; Marinell, J.; Schwindt, W.; Deppe, K.; Groppa, S.; Wiendl, H.; Meuth, S.G. Early silent microstructural degeneration and atrophy of the thalamocortical network in multiple sclerosis. Hum. Brain Mapp. 2016, 37, 1866–1879. [Google Scholar] [CrossRef]
- Capone, F.; Collorone, S.; Cortese, R.; Di Lazzaro, V.; Moccia, M. Fatigue in multiple sclerosis: The role of thalamus. Mult. Scler. 2020, 26, 6–16. [Google Scholar] [CrossRef]
- Roostaei, T.; Sadaghiani, S.; Park, M.T.; Mashhadi, R.; Nazeri, A.; Noshad, S.; Salehi, M.J.; Naghibzadeh, M.; Moghadasi, A.N.; Owji, M.; et al. Channelopathy-related SCN10A gene variants predict cerebellar dysfunction in multiple sclerosis. Neurology 2016, 86, 410–417. [Google Scholar] [CrossRef]
- Correale, J.; Marrodan, M.; Benarroch, E.E. What is the role of axonal ion channels in multiple sclerosis? Neurology 2020, 95, 120–123. [Google Scholar] [CrossRef]
- Plastini, M.J.; Desu, H.L.; Brambilla, R. Dynamic Responses of Microglia in Animal Models of Multiple Sclerosis. Front. Cell. Neurosci. 2020, 14, 269. [Google Scholar] [CrossRef]
- Kipp, M. Remyelination strategies in multiple sclerosis: A critical reflection. Expert Rev. Neurother. 2016, 16, 1–3. [Google Scholar] [CrossRef] [PubMed]
- Hamada, M.S.; Goethals, S.; de Vries, S.I.; Brette, R.; Kole, M.H. Covariation of axon initial segment location and dendritic tree normalizes the somatic action potential. Proc. Natl. Acad. Sci. USA 2016, 113, 14841–14846. [Google Scholar] [CrossRef] [PubMed]
- Bagchi, B.; Al-Sabi, A.; Kaza, S.; Scholz, D.; O’Leary, V.B.; Dolly, J.O.; Ovsepian, S.V. Disruption of myelin leads to ectopic expression of K(V)1.1 channels with abnormal conductivity of optic nerve axons in a cuprizone-induced model of demyelination. PLoS ONE 2014, 9, e87736. [Google Scholar] [CrossRef] [PubMed]
- Tourdias, T.; Mori, N.; Dragonu, I.; Cassagno, N.; Boiziau, C.; Aussudre, J.; Brochet, B.; Moonen, C.; Petry, K.G.; Dousset, V. Differential aquaporin 4 expression during edema build-up and resolution phases of brain inflammation. J. Neuroinflamm. 2011, 8, 143. [Google Scholar] [CrossRef] [PubMed]
- Ellwardt, E.; Pramanik, G.; Luchtman, D.; Novkovic, T.; Jubal, E.R.; Vogt, J.; Arnoux, I.; Vogelaar, C.F.; Mandal, S.; Schmalz, M.; et al. Maladaptive cortical hyperactivity upon recovery from experimental autoimmune encephalomyelitis. Nat. Neurosci. 2018, 21, 1392–1403. [Google Scholar] [CrossRef] [PubMed]
- Ghaffarian, N.; Mesgari, M.; Cerina, M.; Gobel, K.; Budde, T.; Speckmann, E.J.; Meuth, S.G.; Gorji, A. Thalamocortical-auditory network alterations following cuprizone-induced demyelination. J. Neuroinflamm. 2016, 13, 160. [Google Scholar] [CrossRef]
- Cerina, M.; Narayanan, V.; Gobel, K.; Bittner, S.; Ruck, T.; Meuth, P.; Herrmann, A.M.; Stangel, M.; Gudi, V.; Skripuletz, T.; et al. The quality of cortical network function recovery depends on localization and degree of axonal demyelination. Brain Behav. Immun. 2017, 59, 103–117. [Google Scholar] [CrossRef]
- Narayanan, V.; Cerina, M.; Gobel, K.; Meuth, P.; Herrmann, A.M.; Fernandez-Orth, J.; Stangel, M.; Gudi, V.; Skripuletz, T.; Daldrup, T.; et al. Impairment of frequency-specific responses associated with altered electrical activity patterns in auditory thalamus following focal and general demyelination. Exp. Neurol. 2018, 309, 54–66. [Google Scholar] [CrossRef]
- Cerina, M.; Narayanan, V.; Delank, A.; Meuth, P.; Graebenitz, S.; Gobel, K.; Herrmann, A.M.; Albrecht, S.; Daldrup, T.; Seidenbecher, T.; et al. Protective potential of dimethyl fumarate in a mouse model of thalamocortical demyelination. Brain Struct. Funct. 2018, 223, 3091–3106. [Google Scholar] [CrossRef]
- Chaudhary, R.; Albrecht, S.; Datunashvili, M.; Cerina, M.; Luttjohann, A.; Han, Y.; Narayanan, V.; Chetkovich, D.M.; Ruck, T.; Kuhlmann, T.; et al. Modulation of Pacemaker Channel Function in a Model of Thalamocortical Hyperexcitability by Demyelination and Cytokines. Cereb. Cortex 2022, bhab491. [Google Scholar] [CrossRef]
- Praet, J.; Guglielmetti, C.; Berneman, Z.; Van der Linden, A.; Ponsaerts, P. Cellular and molecular neuropathology of the cuprizone mouse model: Clinical relevance for multiple sclerosis. Neurosci. Biobehav. Rev. 2014, 47, 485–505. [Google Scholar] [CrossRef] [PubMed]
- Vega-Riquer, J.M.; Mendez-Victoriano, G.; Morales-Luckie, R.A.; Gonzalez-Perez, O. Five Decades of Cuprizone, an Updated Model to Replicate Demyelinating Diseases. Curr. Neuropharmacol. 2019, 17, 129–141. [Google Scholar] [CrossRef] [PubMed]
- Carlton, W.W. Studies on the induction of hydrocephalus and spongy degeneration by cuprizone feeding and attempts to antidote the toxicity. Life Sci. 1967, 6, 11–19. [Google Scholar] [CrossRef]
- Carey, E.M.; Freeman, N.M. Biochemical changes in Cuprizone-induced spongiform encephalopathy. I. Changes in the activities of 2’,3’-cyclic nucleotide 3’-phosphohydrolase, oligodendroglial ceramide galactosyl transferase, and the hydrolysis of the alkenyl group of alkenyl, acyl-glycerophospholipids by plasmalogenase in different regions of the brain. Neurochem. Res. 1983, 8, 1029–1044. [Google Scholar] [CrossRef]
- Zatta, P.; Raso, M.; Zambenedetti, P.; Wittkowski, W.; Messori, L.; Piccioli, F.; Mauri, P.L.; Beltramini, M. Copper and zinc dismetabolism in the mouse brain upon chronic cuprizone treatment. Cell. Mol. Life Sci. 2005, 62, 1502–1513. [Google Scholar] [CrossRef]
- Hiremath, M.M.; Saito, Y.; Knapp, G.W.; Ting, J.P.; Suzuki, K.; Matsushima, G.K. Microglial/macrophage accumulation during cuprizone-induced demyelination in C57BL/6 mice. J. Neuroimmunol. 1998, 92, 38–49. [Google Scholar] [CrossRef]
- Mason, J.L.; Jones, J.J.; Taniike, M.; Morell, P.; Suzuki, K.; Matsushima, G.K. Mature oligodendrocyte apoptosis precedes IGF-1 production and oligodendrocyte progenitor accumulation and differentiation during demyelination/remyelination. J. Neurosci. Res. 2000, 61, 251–262. [Google Scholar] [CrossRef]
- Tezuka, T.; Tamura, M.; Kondo, M.A.; Sakaue, M.; Okada, K.; Takemoto, K.; Fukunari, A.; Miwa, K.; Ohzeki, H.; Kano, S.; et al. Cuprizone short-term exposure: Astrocytic IL-6 activation and behavioral changes relevant to psychosis. Neurobiol. Dis. 2013, 59, 63–68. [Google Scholar] [CrossRef]
- Samios, V.N.; Inoue, T. Interleukin-1beta and interleukin-6 affect electrophysiological properties of thalamic relay cells. Neurosci. Res. 2014, 87, 16–25. [Google Scholar] [CrossRef]
- Vemana, S.; Pandey, S.; Larsson, H.P. Intracellular Mg2+ is a voltage-dependent pore blocker of HCN channels. Am. J. Physiol. Cell Physiol. 2008, 295, C557–C565. [Google Scholar] [CrossRef]
- Notomi, T.; Kuno, M.; Hiyama, A.; Ohura, K.; Noda, M.; Skerry, T.M. Zinc-Induced Effects on Osteoclastogenesis Involves Activation of Hyperpolarization-Activated Cyclic Nucleotide Modulated Channels via Changes in Membrane Potential. J. Bone Miner. Res. 2015, 30, 1618–1626. [Google Scholar] [CrossRef] [PubMed]
- Notomi, T.; Hiyama, A.; Nozaki, T. Role of zinc and zinc-modulated ion channels, ORAI1 and HCN in osteoclasts. J. Transl. Sci. 2019, 6, 1–4. [Google Scholar] [CrossRef]
- Seifert, R.; Scholten, A.; Gauss, R.; Mincheva, A.; Lichter, P.; Kaupp, U.B. Molecular characterization of a slowly gating human hyperpolarization-activated channel predominantly expressed in thalamus, heart, and testis. Proc. Natl. Acad. Sci. USA 1999, 96, 9391–9396. [Google Scholar] [CrossRef] [PubMed]
- Fries, M.; Mertens, M.; Teske, N.; Kipp, M.; Beyer, C.; Willms, T.; Valkonen, A.; Rissanen, K.; Albrecht, M.; Clarner, T. Water-Soluble Cuprizone Derivative: Synthesis, Characterization, and in Vitro Studies. ACS Omega 2019, 4, 1685–1689. [Google Scholar] [CrossRef]
- Neumaier, F.; Akhtar-Schafer, I.; Luke, J.N.; Dibue-Adjei, M.; Hescheler, J.; Schneider, T. Reciprocal modulation of Cav 2.3 voltage-gated calcium channels by copper(II) ions and kainic acid. J. Neurochem. 2018, 147, 310–322. [Google Scholar] [CrossRef] [PubMed]
- Hammelmann, V.; Stieglitz, M.S.; Hulle, H.; Le Meur, K.; Kass, J.; Brummer, M.; Gruner, C.; Rotzer, R.D.; Fenske, S.; Hartmann, J.; et al. Abolishing cAMP sensitivity in HCN2 pacemaker channels induces generalized seizures. JCI Insight 2019, 4, e126418. [Google Scholar] [CrossRef] [PubMed]
- Fenske, S.; Hennis, K.; Rotzer, R.D.; Brox, V.F.; Becirovic, E.; Scharr, A.; Gruner, C.; Ziegler, T.; Mehlfeld, V.; Brennan, J.; et al. cAMP-dependent regulation of HCN4 controls the tonic entrainment process in sinoatrial node pacemaker cells. Nat. Commun. 2020, 11, 5555. [Google Scholar] [CrossRef]
- Moller, M.; Silbernagel, N.; Wrobel, E.; Stallmayer, B.; Amedonu, E.; Rinne, S.; Peischard, S.; Meuth, S.G.; Wunsch, B.; Strutz-Seebohm, N.; et al. In Vitro Analyses of Novel HCN4 Gene Mutations. Cell. Physiol. Biochem. 2018, 49, 1197–1207. [Google Scholar] [CrossRef]
- Neumaier, F.; Alpdogan, S.; Hescheler, J.; Schneider, T. A practical guide to the preparation and use of metal ion-buffered systems for physiological research. Acta Physiol. 2018, 222, e12988. [Google Scholar] [CrossRef]
- Rumschik, S.M.; Nydegger, I.; Zhao, J.; Kay, A.R. The interplay between inorganic phosphate and amino acids determines zinc solubility in brain slices. J. Neurochem. 2009, 108, 1300–1308. [Google Scholar] [CrossRef]
- Hines, M.L.; Carnevale, N.T. NEURON: A tool for neuroscientists. Neuroscientist 2001, 7, 123–135. [Google Scholar] [CrossRef] [PubMed]
- Destexhe, A.; Bal, T.; McCormick, D.A.; Sejnowski, T.J. Ionic mechanisms underlying synchronized oscillations and propagating waves in a model of ferret thalamic slices. J. Neurophysiol. 1996, 76, 2049–2070. [Google Scholar] [CrossRef] [PubMed]
- Skripuletz, T.; Gudi, V.; Hackstette, D.; Stangel, M. De- and remyelination in the CNS white and grey matter induced by cuprizone: The old, the new, and the unexpected. Histol. Histopathol. 2011, 26, 1585–1597. [Google Scholar] [CrossRef]
- Gibbs, J.W., 3rd; Zhang, Y.F.; Shumate, M.D.; Coulter, D.A. Regionally selective blockade of GABAergic inhibition by zinc in the thalamocortical system: Functional significance. J. Neurophysiol. 2000, 83, 1510–1521. [Google Scholar] [CrossRef] [PubMed]
- Meuth, S.G.; Aller, M.I.; Munsch, T.; Schuhmacher, T.; Seidenbecher, T.; Meuth, P.; Kleinschnitz, C.; Pape, H.C.; Wiendl, H.; Wisden, W.; et al. The contribution of TWIK-related acid-sensitive K+-containing channels to the function of dorsal lateral geniculate thalamocortical relay neurons. Mol. Pharmacol. 2006, 69, 1468–1476. [Google Scholar] [CrossRef] [PubMed]
- Ponomarev, E.D.; Maresz, K.; Tan, Y.; Dittel, B.N. CNS-derived interleukin-4 is essential for the regulation of autoimmune inflammation and induces a state of alternative activation in microglial cells. J. Neurosci. 2007, 27, 10714–10721. [Google Scholar] [CrossRef] [PubMed]
- Arnett, H.A.; Mason, J.; Marino, M.; Suzuki, K.; Matsushima, G.K.; Ting, J.P. TNF alpha promotes proliferation of oligodendrocyte progenitors and remyelination. Nat. Neurosci. 2001, 4, 1116–1122. [Google Scholar] [CrossRef]
- Pasquini, L.A.; Calatayud, C.A.; Bertone Una, A.L.; Millet, V.; Pasquini, J.M.; Soto, E.F. The neurotoxic effect of cuprizone on oligodendrocytes depends on the presence of pro-inflammatory cytokines secreted by microglia. Neurochem. Res. 2007, 32, 279–292. [Google Scholar] [CrossRef]
- Byczkowicz, N.; Eshra, A.; Montanaro, J.; Trevisiol, A.; Hirrlinger, J.; Kole, M.H.; Shigemoto, R.; Hallermann, S. HCN channel-mediated neuromodulation can control action potential velocity and fidelity in central axons. Elife 2019, 8, e42766. [Google Scholar] [CrossRef]
- Frigerio, F.; Flynn, C.; Han, Y.; Lyman, K.; Lugo, J.N.; Ravizza, T.; Ghestem, A.; Pitsch, J.; Becker, A.; Anderson, A.E.; et al. Neuroinflammation Alters Integrative Properties of Rat Hippocampal Pyramidal Cells. Mol. Neurobiol. 2018, 55, 7500–7511. [Google Scholar] [CrossRef]
- Doucette, J.R.; Jiao, R.; Nazarali, A.J. Age-related and cuprizone-induced changes in myelin and transcription factor gene expression and in oligodendrocyte cell densities in the rostral corpus callosum of mice. Cell. Mol. Neurobiol. 2010, 30, 607–629. [Google Scholar] [CrossRef] [PubMed]
- Wang, H.; Li, C.; Wang, H.; Mei, F.; Liu, Z.; Shen, H.Y.; Xiao, L. Cuprizone-induced demyelination in mice: Age-related vulnerability and exploratory behavior deficit. Neurosci. Bull. 2013, 29, 251–259. [Google Scholar] [CrossRef] [PubMed]
- Ludwin, S.K. Central nervous system demyelination and remyelination in the mouse: An ultrastructural study of cuprizone toxicity. Lab. Investig. 1978, 39, 597–612. [Google Scholar] [PubMed]
- Taylor, L.C.; Gilmore, W.; Matsushima, G.K. SJL mice exposed to cuprizone intoxication reveal strain and gender pattern differences in demyelination. Brain Pathol. 2009, 19, 467–479. [Google Scholar] [CrossRef]
- Skripuletz, T.; Lindner, M.; Kotsiari, A.; Garde, N.; Fokuhl, J.; Linsmeier, F.; Trebst, C.; Stangel, M. Cortical demyelination is prominent in the murine cuprizone model and is strain-dependent. Am. J. Pathol. 2008, 172, 1053–1061. [Google Scholar] [CrossRef]
- Taylor, L.C.; Gilmore, W.; Ting, J.P.; Matsushima, G.K. Cuprizone induces similar demyelination in male and female C57BL/6 mice and results in disruption of the estrous cycle. J. Neurosci. Res. 2010, 88, 391–402. [Google Scholar] [CrossRef]
- Santoro, B.; Wainger, B.J.; Siegelbaum, S.A. Regulation of HCN channel surface expression by a novel C-terminal protein-protein interaction. J. Neurosci. 2004, 24, 10750–10762. [Google Scholar] [CrossRef]
- Santoro, B.; Piskorowski, R.A.; Pian, P.; Hu, L.; Liu, H.; Siegelbaum, S.A. TRIP8b splice variants form a family of auxiliary subunits that regulate gating and trafficking of HCN channels in the brain. Neuron 2009, 62, 802–813. [Google Scholar] [CrossRef]
- Foote, K.M.; Lyman, K.A.; Han, Y.; Michailidis, I.E.; Heuermann, R.J.; Mandikian, D.; Trimmer, J.S.; Swanson, G.T.; Chetkovich, D.M. Phosphorylation of the HCN channel auxiliary subunit TRIP8b is altered in an animal model of temporal lobe epilepsy and modulates channel function. J. Biol. Chem. 2019, 294, 15743–15758. [Google Scholar] [CrossRef]
- Mathie, A.; Sutton, G.L.; Clarke, C.E.; Veale, E.L. Zinc and copper: Pharmacological probes and endogenous modulators of neuronal excitability. Pharmacol. Ther. 2006, 111, 567–583. [Google Scholar] [CrossRef]
- Traboulsie, A.; Chemin, J.; Chevalier, M.; Quignard, J.F.; Nargeot, J.; Lory, P. Subunit-specific modulation of T-type calcium channels by zinc. J. Physiol. 2007, 578, 159–171. [Google Scholar] [CrossRef] [PubMed]
- Castelli, L.; Tanzi, F.; Taglietti, V.; Magistretti, J. Cu2+, Co2+, and Mn2+ modify the gating kinetics of high-voltage-activated Ca2+ channels in rat palaeocortical neurons. J. Membr. Biol. 2003, 195, 121–136. [Google Scholar] [CrossRef] [PubMed]
- Neumaier, F.; Dibue-Adjei, M.; Hescheler, J.; Schneider, T. Voltage-gated calcium channels: Determinants of channel function and modulation by inorganic cations. Prog. Neurobiol. 2015, 129, 1–36. [Google Scholar] [CrossRef]
- Neumaier, F.; Schneider, T.; Albanna, W. Cav2.3 channel function and Zn(2+)-induced modulation: Potential mechanisms and (patho)physiological relevance. Channels 2020, 14, 362–379. [Google Scholar] [CrossRef] [PubMed]
- Cataldi, M.; Lariccia, V.; Marzaioli, V.; Cavaccini, A.; Curia, G.; Viggiano, D.; Canzoniero, L.M.; di Renzo, G.; Avoli, M.; Annunziato, L. Zn(2+) slows down Ca(V)3.3 gating kinetics: Implications for thalamocortical activity. J. Neurophysiol. 2007, 98, 2274–2284. [Google Scholar] [CrossRef]
- Gibbs, J.W., 3rd; Schroder, G.B.; Coulter, D.A. GABAA receptor function in developing rat thalamic reticular neurons: Whole cell recordings of GABA-mediated currents and modulation by clonazepam. J. Neurophysiol. 1996, 76, 2568–2579. [Google Scholar] [CrossRef] [PubMed]
- Zucconi, G.G.; Cipriani, S.; Scattoni, R.; Balgkouranidou, I.; Hawkins, D.P.; Ragnarsdottir, K.V. Copper deficiency elicits glial and neuronal response typical of neurodegenerative disorders. Neuropathol. Appl. Neurobiol. 2007, 33, 212–225. [Google Scholar] [CrossRef]
- Bista, P.; Pawlowski, M.; Cerina, M.; Ehling, P.; Leist, M.; Meuth, P.; Aissaoui, A.; Borsotto, M.; Heurteaux, C.; Decher, N.; et al. Differential phospholipase C-dependent modulation of TASK and TREK two-pore domain K+ channels in rat thalamocortical relay neurons. J. Physiol. 2015, 593, 127–144. [Google Scholar] [CrossRef]
- Musset, B.; Meuth, S.G.; Liu, G.X.; Derst, C.; Wegner, S.; Pape, H.C.; Budde, T.; Preisig-Muller, R.; Daut, J. Effects of divalent cations and spermine on the K+ channel TASK-3 and on the outward current in thalamic neurons. J. Physiol. 2006, 572, 639–657. [Google Scholar] [CrossRef]
- Gruss, M.; Mathie, A.; Lieb, W.R.; Franks, N.P. The two-pore-domain K(+) channels TREK-1 and TASK-3 are differentially modulated by copper and zinc. Mol. Pharmacol. 2004, 66, 530–537. [Google Scholar] [CrossRef]
- Iocca, H.A.; Plant, S.R.; Wang, Y.; Runkel, L.; O’Connor, B.P.; Lundsmith, E.T.; Hahm, K.; van Deventer, H.W.; Burkly, L.C.; Ting, J.P. TNF superfamily member TWEAK exacerbates inflammation and demyelination in the cuprizone-induced model. J. Neuroimmunol. 2008, 194, 97–106. [Google Scholar] [CrossRef] [PubMed]
- Petkovic, F.; Campbell, I.L.; Gonzalez, B.; Castellano, B. Astrocyte-targeted production of interleukin-6 reduces astroglial and microglial activation in the cuprizone demyelination model: Implications for myelin clearance and oligodendrocyte maturation. Glia 2016, 64, 2104–2119. [Google Scholar] [CrossRef] [PubMed]
- Sanchis, P.; Fernandez-Gayol, O.; Comes, G.; Escrig, A.; Giralt, M.; Palmiter, R.D.; Hidalgo, J. Interleukin-6 Derived from the Central Nervous System May Influence the Pathogenesis of Experimental Autoimmune Encephalomyelitis in a Cell-Dependent Manner. Cells 2020, 9, 330. [Google Scholar] [CrossRef]
- Stadler, K.; Bierwirth, C.; Stoenica, L.; Battefeld, A.; Reetz, O.; Mix, E.; Schuchmann, S.; Velmans, T.; Rosenberger, K.; Brauer, A.U.; et al. Elevation in type I interferons inhibits HCN1 and slows cortical neuronal oscillations. Cereb. Cortex 2014, 24, 199–210. [Google Scholar] [CrossRef] [PubMed][Green Version]
- Vezzani, A.; Maroso, M.; Balosso, S.; Sanchez, M.A.; Bartfai, T. IL-1 receptor/Toll-like receptor signaling in infection, inflammation, stress and neurodegeneration couples hyperexcitability and seizures. Brain Behav. Immun. 2011, 25, 1281–1289. [Google Scholar] [CrossRef] [PubMed]
- Mason, J.L.; Suzuki, K.; Chaplin, D.D.; Matsushima, G.K. Interleukin-1beta promotes repair of the CNS. J. Neurosci. 2001, 21, 7046–7052. [Google Scholar] [CrossRef] [PubMed]
- Li, S.; Liao, Y.; Dong, Y.; Li, X.; Li, J.; Cheng, Y.; Cheng, J.; Yuan, Z. Microglial deletion and inhibition alleviate behavior of post-traumatic stress disorder in mice. J. Neuroinflamm. 2021, 18, 7. [Google Scholar] [CrossRef] [PubMed]
- Destexhe, A.; Contreras, D.; Steriade, M. Mechanisms underlying the synchronizing action of corticothalamic feedback through inhibition of thalamic relay cells. J. Neurophysiol. 1998, 79, 999–1016. [Google Scholar] [CrossRef]
- Tscherter, A.; David, F.; Ivanova, T.; Deleuze, C.; Renger, J.J.; Uebele, V.N.; Shin, H.S.; Bal, T.; Leresche, N.; Lambert, R.C. Minimal alterations in T-type calcium channel gating markedly modify physiological firing dynamics. J. Physiol. 2011, 589, 1707–1724. [Google Scholar] [CrossRef]
- Choi, S.; Yu, E.; Lee, S.; Llinas, R.R. Altered thalamocortical rhythmicity and connectivity in mice lacking CaV3.1 T-type Ca2+ channels in unconsciousness. Proc. Natl. Acad. Sci. USA 2015, 112, 7839–7844. [Google Scholar] [CrossRef]
- Errington, A.C.; Hughes, S.W.; Crunelli, V. Rhythmic dendritic Ca2+ oscillations in thalamocortical neurons during slow non-REM sleep-related activity in vitro. J. Physiol. 2012, 590, 3691–3700. [Google Scholar] [CrossRef] [PubMed]


| BiMPi 1 mM | EDTA 1 mM | Tricine 1 mM | ||||||||
|---|---|---|---|---|---|---|---|---|---|---|
| Ctrl | BiMPi | n | Ctrl | EDTA | n | Ctrl | Tricine | n | ||
| V0.5 (mV) | −83.62 ± 0.93 | −81.25 ± 1.39 | 8 | −89.06 ± 1.49 | −89.16 ± 1.33 | 6 | −90.10 ± 1.0 | −86.56 ± 0.75 | 7 p < 0.01 | |
| Current density (pA/pF) | 10.86 ± 0.74 | 11.04 ± 0.68 | 8 | 10.54 ± 0.74 | 10.09 ± 0.44 | 6 | 9.50 ± 0.70 | 9.23 ± 0.87 | 7 | |
| Tau (ms) | fast | 151.68 ± 7.23 | 145.93 ± 7.22 | 8 | 309.47 ± 20.57 | 316.50 ± 14.87 | 6 | 292.91 ± 15.23 | 276.6 ± 12.03 | 7 |
| slow | 866 ± 44 | 886 ± 77 | 8 | 2445 ± 386 | 2626 ± 337 | 5 | 2407 ± 251 | 2130 ± 307 | 7 | |
| Zinc 0.3 mM | Phosphate-Free | |||||||
|---|---|---|---|---|---|---|---|---|
| Ctrl | Zinc | n | Ctrl | 20 min | 40 min | n | ||
| V0.5 (mV) | −87.29 ± 0.74 | −84.44 ± 0.68 | 14 p < 0.001 | −86.92 ± 1.30 | −84.86 ± 1.10 | −84.09 ± 0.95 | 8 | |
| Current density (pA/pF) | 9.54 ± 0.36 | 9.63 ± 0.33 | 14 | 9.20 ± 0.54 | 9.85 ± 0.55 | 9.48 ± 0.43 | 8 | |
| Tau (ms) | fast | 289.97 ± 13.91 | 285.98 ± 13.50 | 14 | 241.30 ± 14.40 | 234.54 ± 15.28 | 234.59 ± 16.84 | 7 |
| slow | 2511 ± 462 | 1931 ± 170 | 13 | 1487 ± 167 | 1393 ± 122 | 1433 ± 124 | 7 | |
| Cu2+ 1 nM | Cu2+ 10 nM | Cu2+ 100 nM | Zn2+ 10 µM | ||||||||||
|---|---|---|---|---|---|---|---|---|---|---|---|---|---|
| Ctrl | Cu2+ | n | Ctrl | Cu2+ | n | Ctrl | Cu2+ | n | Ctrl | Zn2+ | n | ||
| V0.5 (mV) | −82.67 ± 2.29 | −83.69 ± 1.41 | 5 | −79.01 ± 0.38 | −82.25 ± 0.68 | 5 | −78.49 ± 0.94 | −81.24 ± 1.60 | 8 | −79.14 ± 1.75 | −82.67 ± 1.98 | 6 | |
| Current density (pA/pF) | 48.68 ± 9.61 | 43.59 ± 8.82 | 5 | 65.50 ± 23.20 | 39.58 ± 8.62 | 5 | 55.89 ± 10.54 | 50.13 ± 11.63 | 8 | 40.36 ± 5.82 | 35.22 ± 4.75 | 6 | |
| Tau (ms) | fast | 75.37 ± 4.70 | 74.96 ± 7.53 | 5 | 86.06 ± 6.10 | 99.42 ± 8.80 | 5 | 97.16 ± 5.86 | 96.23 ± 10.82 | 8 | 100.18 ± 7.45 | 112.70 ± 7.97 | 6 |
| slow | 1472 ± 224 | 1326 ± 120 | 4 | 1445 ± 165 | 1489 ± 202 | 3 | 1254 ± 193 | 1209 ± 93 | 8 | 1388 ± 293 | 1729 ± 409 | 4 | |
| BiMPi 1 mM | EDTA 1 mM | ||||||
|---|---|---|---|---|---|---|---|
| Ctrl | BiMPi | n | Ctrl | EDTA | n | ||
| V0.5 (mV) | −79.62 ± 0.74 | −79.17 ± 1.39 | 5 | −81.87 ± 1.28 | −83.36 ± 1.50 | 11 | |
| Current density (pA/pF) | 78.76 ± 13.36 | 72.26 ± 13.42 | 5 | 38.87 ± 5.88 | 33.68 ± 4.8 | 11 | |
| Tau (ms) | fast | 112.98 ± 6.90 | 109.58 ± 7.31 | 5 | 96.80 ± 7.66 | 85.91± 6.78 | 11 |
| slow | 1290 ± 201 | 1245 ± 117 | 5 | 1211 ± 162 | 952 ± 141 | 9 | |
Publisher’s Note: MDPI stays neutral with regard to jurisdictional claims in published maps and institutional affiliations. |
© 2022 by the authors. Licensee MDPI, Basel, Switzerland. This article is an open access article distributed under the terms and conditions of the Creative Commons Attribution (CC BY) license (https://creativecommons.org/licenses/by/4.0/).
Share and Cite
Oniani, T.; Vinnenberg, L.; Chaudhary, R.; Schreiber, J.A.; Riske, K.; Williams, B.; Pape, H.-C.; White, J.A.; Junker, A.; Seebohm, G.; et al. Effects of Axonal Demyelination, Inflammatory Cytokines and Divalent Cation Chelators on Thalamic HCN Channels and Oscillatory Bursting. Int. J. Mol. Sci. 2022, 23, 6285. https://doi.org/10.3390/ijms23116285
Oniani T, Vinnenberg L, Chaudhary R, Schreiber JA, Riske K, Williams B, Pape H-C, White JA, Junker A, Seebohm G, et al. Effects of Axonal Demyelination, Inflammatory Cytokines and Divalent Cation Chelators on Thalamic HCN Channels and Oscillatory Bursting. International Journal of Molecular Sciences. 2022; 23(11):6285. https://doi.org/10.3390/ijms23116285
Chicago/Turabian StyleOniani, Tengiz, Laura Vinnenberg, Rahul Chaudhary, Julian A. Schreiber, Kathrin Riske, Brandon Williams, Hans-Christian Pape, John A. White, Anna Junker, Guiscard Seebohm, and et al. 2022. "Effects of Axonal Demyelination, Inflammatory Cytokines and Divalent Cation Chelators on Thalamic HCN Channels and Oscillatory Bursting" International Journal of Molecular Sciences 23, no. 11: 6285. https://doi.org/10.3390/ijms23116285
APA StyleOniani, T., Vinnenberg, L., Chaudhary, R., Schreiber, J. A., Riske, K., Williams, B., Pape, H.-C., White, J. A., Junker, A., Seebohm, G., Meuth, S. G., Hundehege, P., Budde, T., & Zobeiri, M. (2022). Effects of Axonal Demyelination, Inflammatory Cytokines and Divalent Cation Chelators on Thalamic HCN Channels and Oscillatory Bursting. International Journal of Molecular Sciences, 23(11), 6285. https://doi.org/10.3390/ijms23116285