Article

Copper Modulates Mitochondrial Oxidative Phosphorylation to Enhance Dermal Papilla Cells Proliferation in Rex Rabbits

1
College of Animal Science and Technology, Shandong Agricultural University, Tai’an 271018, China
2
Hebei Key Laboratory of Specialty Animal Germplasm Resources Exploration and Innovation, Department of Animal Science and Technology, Hebei Normal University of Science and Technology, Qinhuangdao 066004, China
*
Authors to whom correspondence should be addressed.
Int. J. Mol. Sci. 2022, 23(11), 6209; https://doi.org/10.3390/ijms23116209
Submission received: 12 May 2022 / Revised: 28 May 2022 / Accepted: 30 May 2022 / Published: 1 June 2022

Abstract

:
Copper (Cu) is an important coenzyme factor in cell signaling, such as cytochrome c oxidase (Complex IV). Metabolism plays an important role in regulating the fate of mammalian cells. The aim of this study is to experimentally investigate the effect of copper on cell metabolism in the dermal papilla cells of the Rex rabbit. In this study, Cu promoted proliferation of dermal papilla cells (p = 0.0008) while also increasing levels of cellular CIII, CIV, Complex IV and ATP. Moreover, fifty metabolites that were significantly different between Cu and controls were identified as potential biomarkers of Cu stimulation. Copper-stimulated cells had altered levels of arachidonic acid derivatives, S-glutamic acid, and citric acid, which were primarily linked to two different pathways: arachidonic acid metabolism (p < 0.0001) and alanine, aspartate and glutamate metabolism (p = 0.0003). The addition of Cu can increase the proliferation of Rex rabbit dermal papilla cells. Increased levels of ubiquinol-cytochrome c reductase complex core protein 2 (CIII) and cytochrome c oxidase subunit 1 (CIV) were associated with the increased levels of cellular cytochrome c oxidase (Complex IV) and adenosine triphosphate (ATP). In a word, copper promotes cell proliferation by maintaining the function of the cellular mitochondrial electron transport chain (ETC) pathway.

1. Introduction

Copper (Cu) has long been used as a growth stimulant; it can stimulate animal appetite and increase feed intake [1] as well as increase the digestibility of crude fat and lipolysis [2]. Dietary Cu supplementation can also improve the fur quality of fox [3] and mink [4]. In general, Cu is essential in all life-forms for the growth and development of multiple types of cells, tissues, and organs. Copper is involved in enzyme reactions as Cu-proteins (e.g., ceruloplasmin), Cu-containing enzymes (e.g., Cu–Zn superoxide dismutase, cytochrome c oxidase), or as a hormone (insulin) [5,6]. However, Cu can also directly regulate the metabolic state of cells through signal molecules [7]. Copper has direct regulatory roles in cyclic AMP-dependent lipolysis in 3T3-L1 adipocytes [8] and the mitogen-activated protein kinase pathway in tumor growth [9]. Moreover, copper is essential for the maintenance of the function of the mitochondrial electron transport chain (ETC); cytochrome c oxidase (Complex IV) is a metalloenzyme at the end of the mitochondrial respiratory chain, and three Cu-containing subunits encoded by mitochondria form the catalytic core of Complex IV [10]. In the absence of Cu ion, Complex IV subunit 1 (CIV) is rapidly degraded followed by failure of the Complex IV assembly; eventually, electron transfer in the respiratory chain is blocked, and synthesis of ATP is reduced [11,12,13]. According to Ramchandani [13], treatment with tetrathiomolybdate, a copper-chelating agent, significantly reduces ATP-linked respiration.
The dermal papillae (DP) are at the bases of hair follicles (HFs). They are composed of specialized mesenchymal cells [14] and are important in the development of mammal HFs. Mammalian dorsal skin HFs undergo a cycle of anagen, catagen, and telogen phases [15]. At the beginning of the anagen stage, signals emanating from DP activate quiescent hair follicle stem cells to produce progenitor cells, which subsequently differentiate into outer root sheath cells to supply the cells needed for hair follicle downgrowth [15]. In addition, the transition of hair follicles from telogen to anagen phases also depends on DP signals. Deficiencies in proteins, trace elements, essential fatty acids, and energy can lead to abnormal hair follicle structure, changes in pigment, or hair loss [14]. In addition to maintaining normal cytochrome c oxidase activity, Cu is also important for aminoxydases, which are essential for keratin fiber strength [16].
Cell metabolism is a complex network involving thousands of biochemical reactions, which is an indispensable link in cell growth, proliferation and responses to extracellular signals. In general, cell proliferation and differentiation are associated with changes in the metabolic program, characterized by a transition from glycolytic metabolism to oxidative phosphorylation (OXPHOS) [15]. According to Ramchandani, [13] Cu depletion leads to a decrease in the level of Complex IV subunits 1 and results in a functional deficiency of the mitochondrial electron transport chain (ETC). In fact, flexible metabolic changes (between glycolysis and OXPHOS) are essential in regulating cyclic changes and development in HFs [15]. Therefore, in this study, Ultra Performance Liquid Chromatography Tandem Mass Spectrometry (UHPLC–MS) was used to investigate metabolic changes in Cu-stimulated dermal papilla cells of the Rex rabbit in order to identify direct links between Cu-mediated metabolic reprogramming and dermal papilla cells proliferation.

2. Results

2.1. Copper Increases ATP Levels through Cytochrome c Oxidase

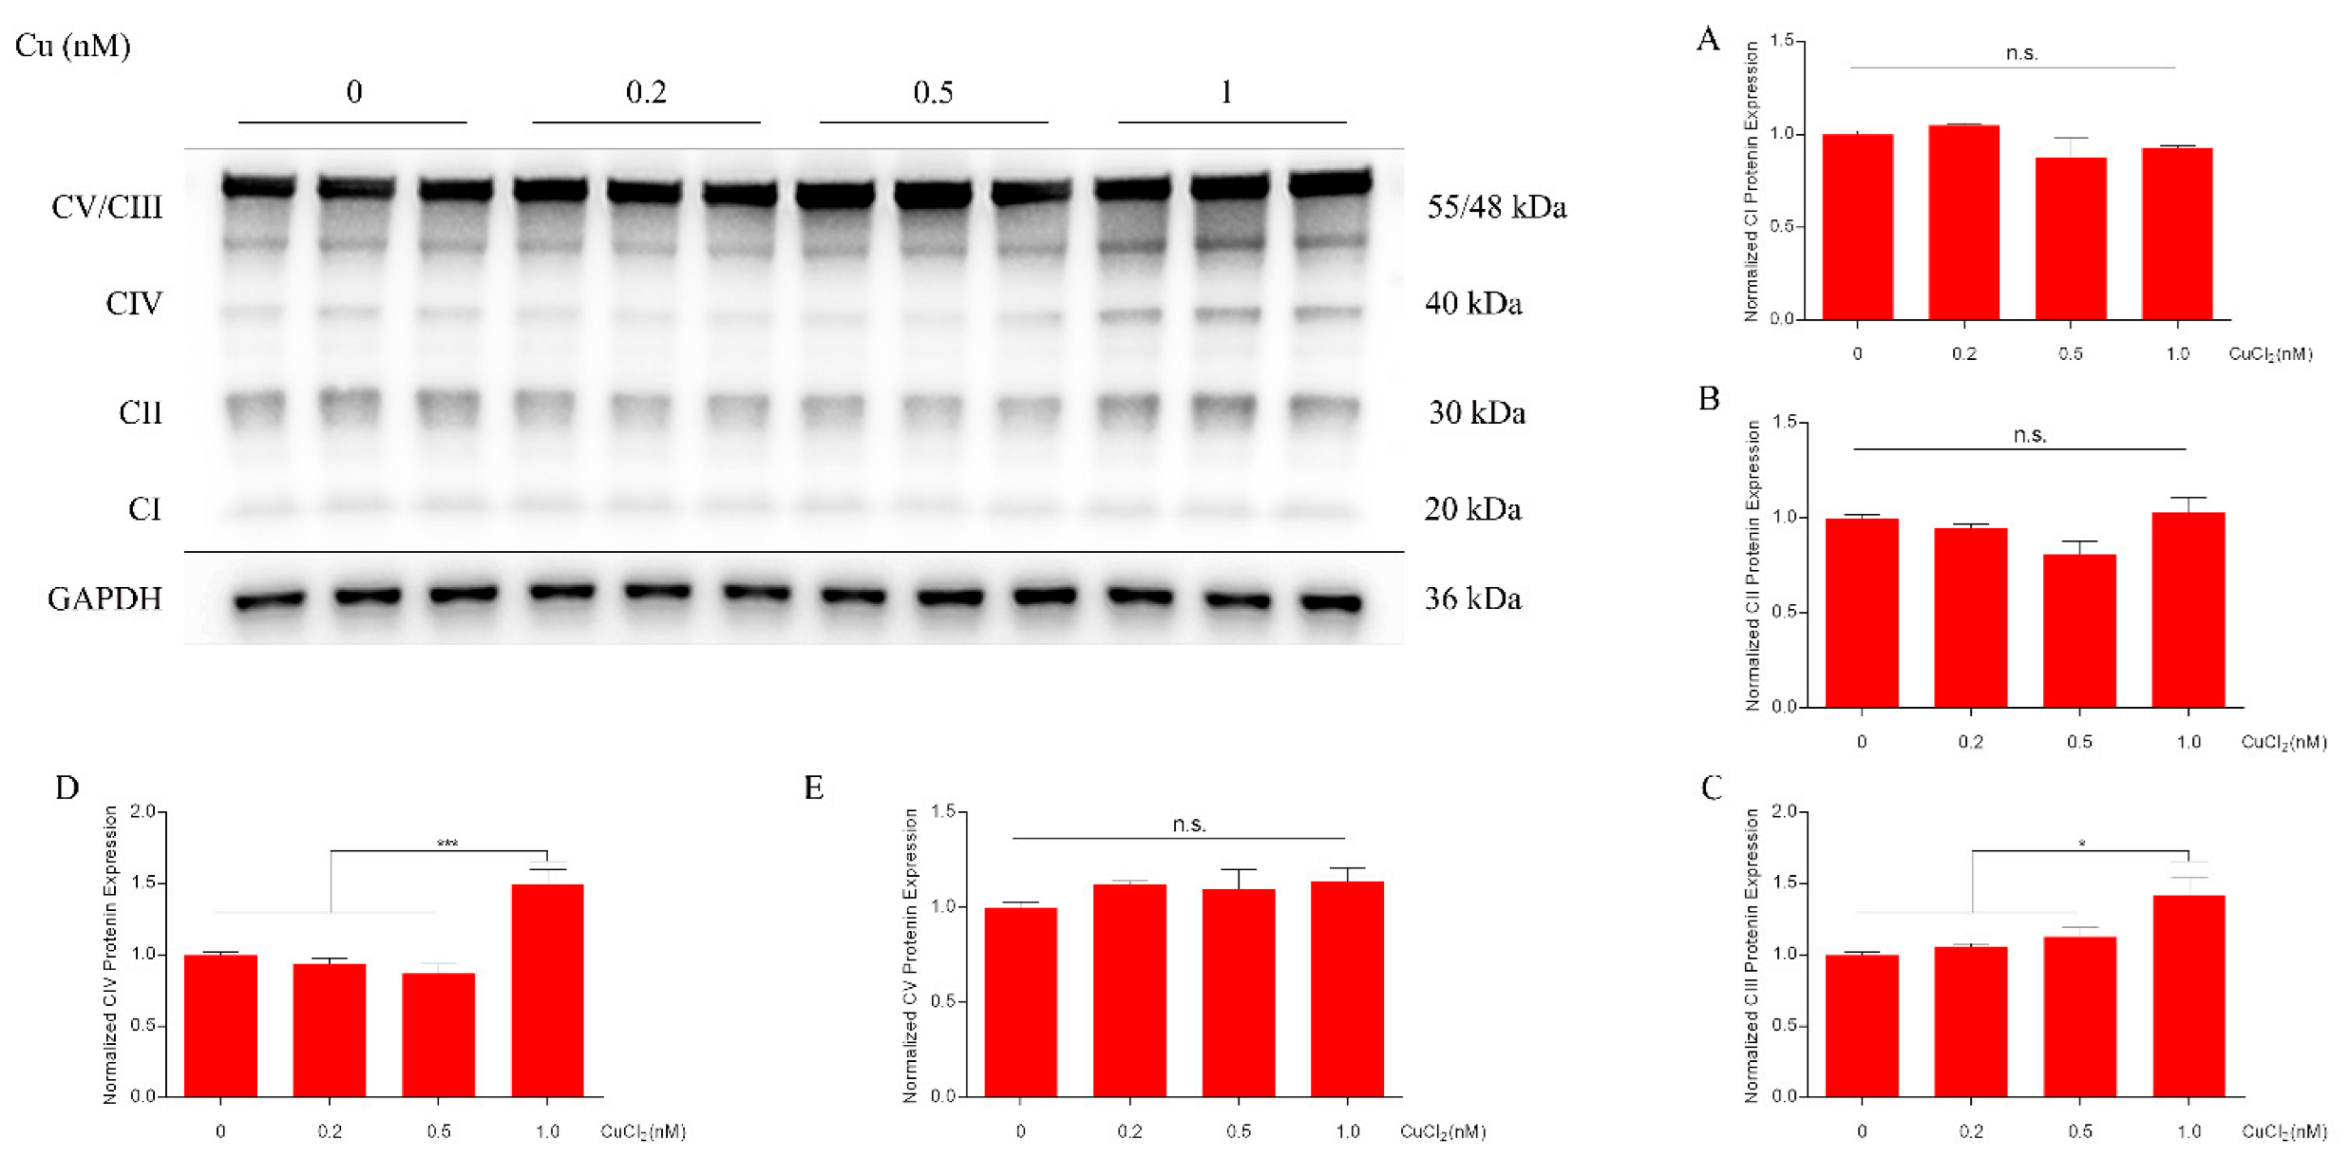
Cu (1 nM) significantly promoted proliferation of DPCs; with increased Cu concentration (5–1000 nM), Cu significantly inhibited proliferation of DPCs (Figure 1A). Cu (1 nM) also significantly increased intracellular ATP levels (Figure 1B). Because the catalytic core of Complex IV consists of three mitochondria-encoded subunits (containing three Cu atoms), further tests revealed that copper significantly increased cytochrome c oxidase Cu chaperone (COX17) mRNA expression level (Figure 1C), indicating an increase in Cu translocation to mitochondria, but no significant effect on mRNA expression of CIV (Figure 1C). Moreover, copper significantly increased intracellular Complex IV content (Figure 1D). In addition, western blot analysis confirmed an increase in CIII (Figure 2C) and CIV (Figure 2D). Together, these results suggest that Cu-mediated maintenance of mitochondrial function promotes the proliferation of DPc. Therefore, copper doses of 1nM were selected for the subsequent untargeted metabolomics.

2.2. Metabolites

The purpose of this study was to identify Cu-induced metabolic alterations (control vs treated) in DPCs of Rex rabbits. A total of 19,593 peaks (positive: 9855; negative: 9738) were detected in the LC/MS analysis. A total of 472 metabolites (positive: 231; negative: 241) were identified. In the PCA, QC samples were grouped together, indicating high reproducibility and instrument stability throughout the run (Figure 3A,B).

2.3. Multivariate Data Analysis

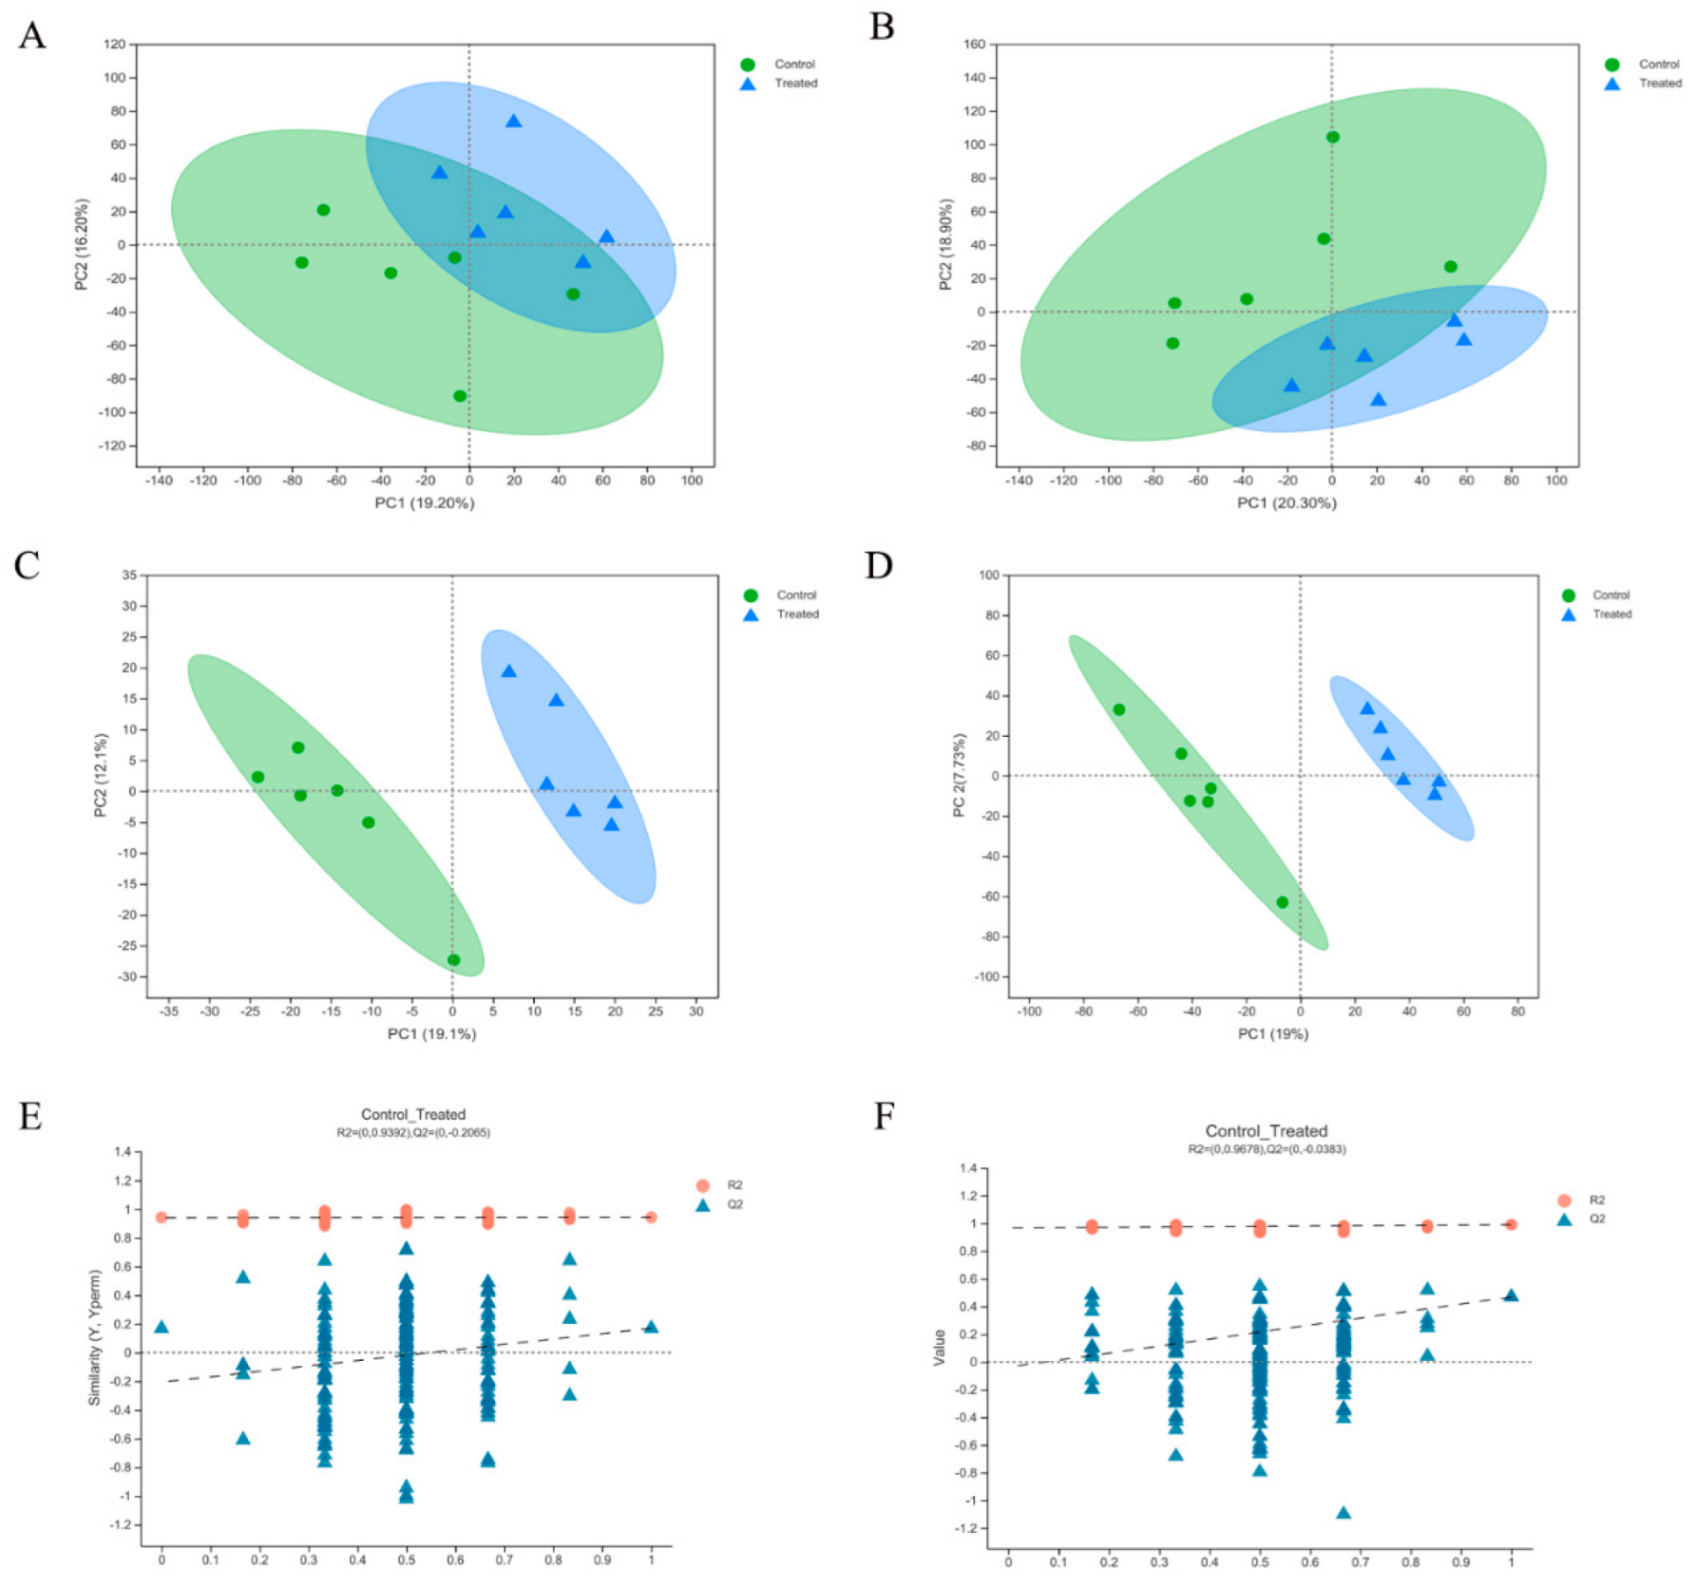
Principal component analysis models were constructed in positive ion and negative ion modes, and the first component (PC1) explained 19.2% and 20.3% of the variance, respectively (Figure 4A,B). Differences between groups were determined using PLS-DA, and the large separation between control and treated groups indicated a significant classification effect (Figure 4C,D). According to a previous study [17], the PLS-DA model was tested with response permutation testing. The intercept between the regression line of Q2 and the y-axis was less than 0, which indicated that the model was valid and reliable and there was no excess fitting (Figure 4E,F).

2.4. Significantly Different Metabolites

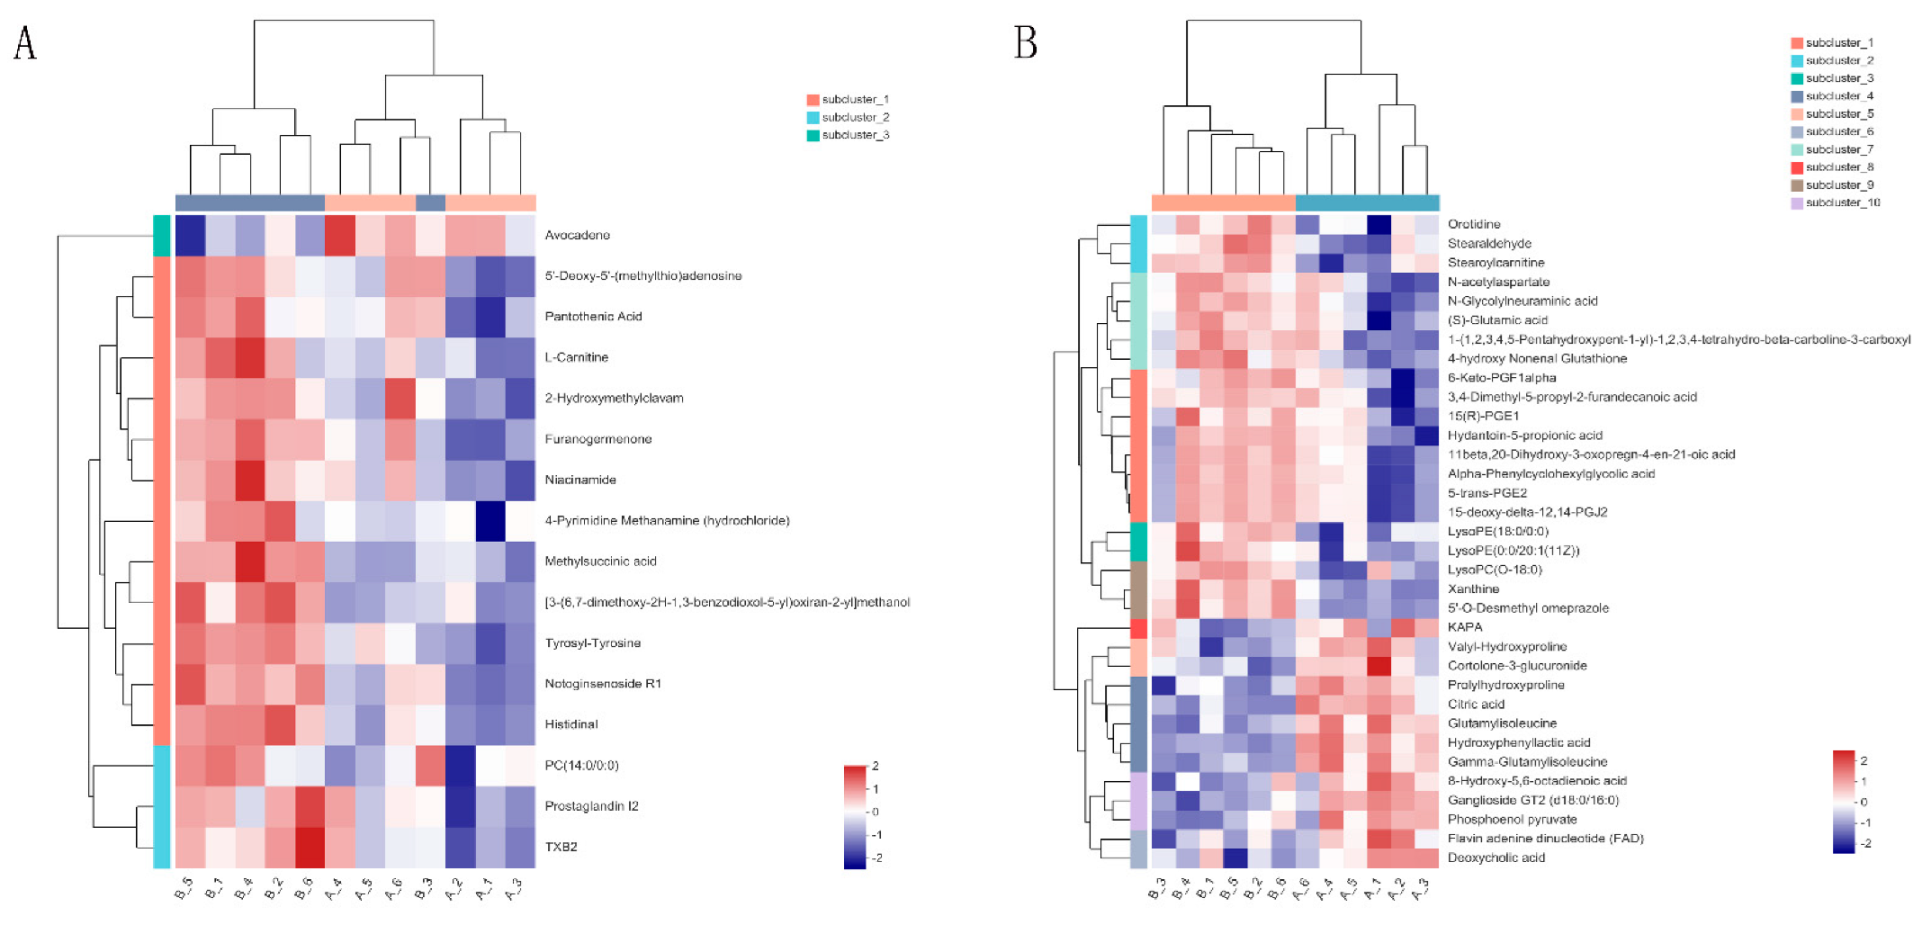
Significant differences in metabolites between control and Cu-treated groups were determined using PLS-DA and Student’s t-tests. According to a previous study, [18] the criteria were p < 0.05 and VIP > 1. Fifty significantly different metabolites were identified (Table 1 and Table 2). Figure 5 shows volcano plots, with one point representing a metabolite. There were 15 and 21 metabolites significantly up-regulated and 1 and 13 metabolites significantly down-regulated in positive ion (POS) (Figure 5A) and negative ion (NEG) modes (Figure 5B), respectively. Hierarchical clustering analysis was conducted to explore expression patterns of differential metabolites (Figure 6). Last, differential metabolites were classified using the KEGG and HMDB databases (Figure 7). Ten metabolites were matched and classified into the primary seven categories, with three of those metabolites included in eicosanoids (Figure 7A). Forty-three metabolites were matched and classified into eight HMDB superclasses, with 20 of those metabolites included in the “lipids and lipid-like molecules” term (Figure 7B).

2.5. Kyoto Encyclopedia of Genes and Genomes’ Functional Pathways

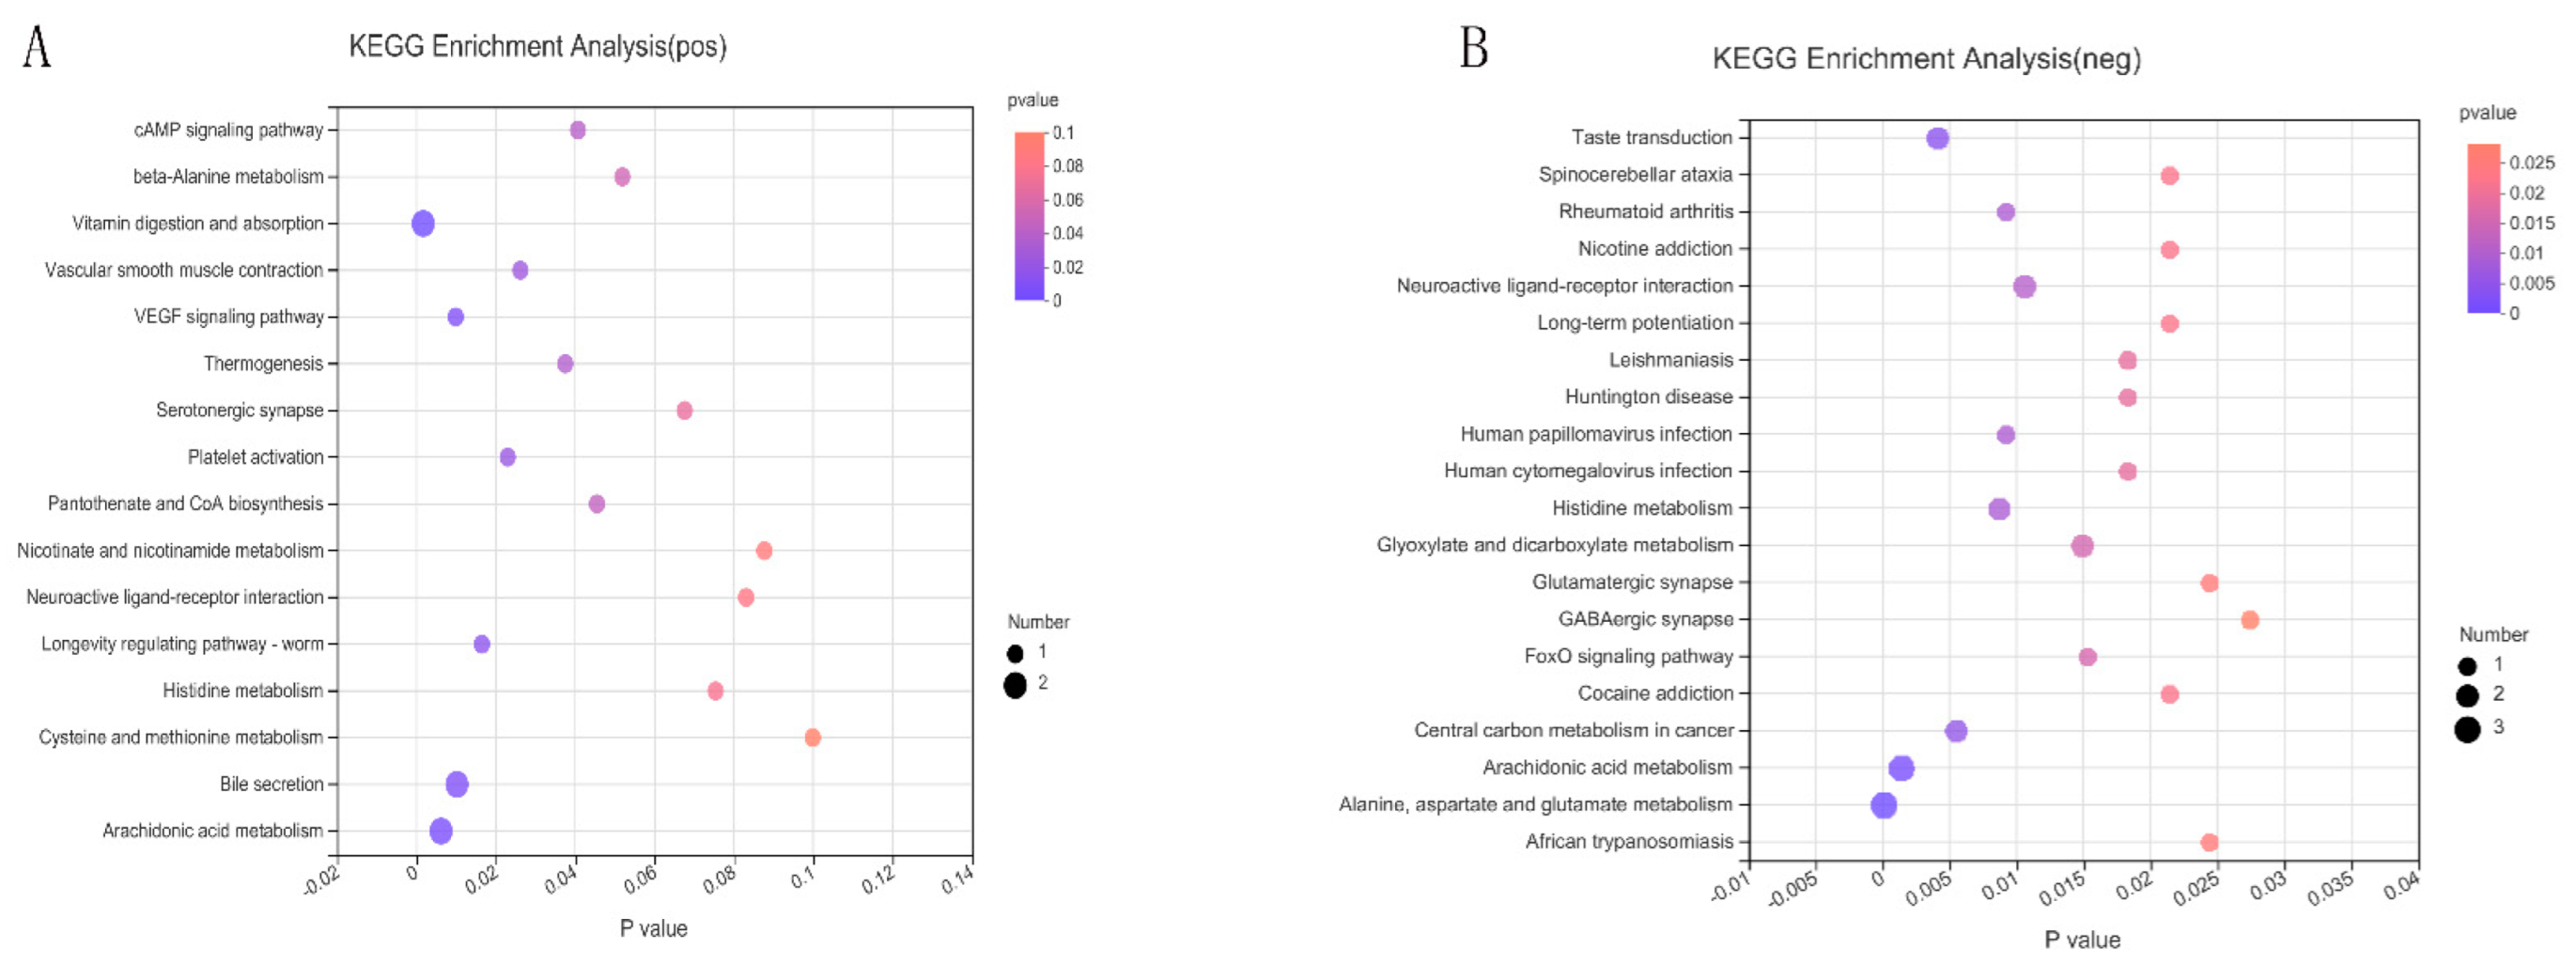
To explore the potential pathways of differential metabolites, metabolic pathway enrichment analysis was performed based on the KEGG database under positive and negative ion modes (Figure 8). Copper stimulation significantly affected arachidonic acid metabolism and alanine, aspartate and glutamate metabolism.

3. Discussion

Copper is a redox-active transition metal and is generally regarded as a static enzyme cofactor [8]. Recent studies have revealed the usefulness of Cu in the development of mammalian HFs. Zhang [19] reported that Cu effectively induces proliferation and differentiation of skin and HF-related cells, and 19 mg Cu/kg of dry matter (DM) increases the number of active secondary follicles [20]. Cell proliferation is generally associated with increases in metabolic requirements, [15] including for amino acids, fatty acids, and especially energy (ATP). In this study, the suitable concentration of Cu for DPCs was determined using Cell-Counting-Kit-8 (CCK-8). Copper at 1 nM promoted proliferation of DPCs (Figure 1A). Moreover, starting from a concentration of Cu of 5 nM, Cu significantly inhibited proliferation of DPCs; in fact, it is not uncommon with Cu and other metals to see increased proliferation at low concentrations followed by a sudden drop when the dose becomes cytotoxic. Cu stimulation also increased intracellular levels of ATP (Figure 1B). Here, qRT-PCR analysis confirmed an increase in COX17 mRNA expression (Figure 1C), indicating an increase in copper transport from the cytoplasm to the mitochondria. As shown in Figure 1D, copper increased the protein of Complex IV without impacting the mRNA level of CIV (Figure 1C), which is consistent with the study of Ramchandani [13]. Moreover, western blot analysis showed an increase in CIV (Figure 2D), a subunit of Complex IV. Horn [10] reported that three mitochondria-encoded subunits (CIV, MTCO2, and MTCO3) formed the catalytic core of Complex IV, containing three copper atoms; MTCO2 combines with two Cu atoms to form the CuA site and the heme a3 group of CIV combines with one Cu atoms to form the CuB site. Therefore, we suggest that copper-mediated CIV subunit expression promotes the assembly of Complex IV and maintains the function of ETC, which is consistent with the result that copper treatment increases the intracellular content of ATP. In fact, generation of energy by OXPHOS is highly efficient compared with that by anaerobic glycolysis [15].
To further explore the metabolic changes linked to Cu stimulation in DPCs, we performed untargeted metabolomics using LC-MS. The compounds’ classification was performed on the differential metabolites’ base in the HMDB database and KEGG database. Forty-three differential metabolites were classified in eight categories (Figure 7B). Of those metabolites, 20 metabolites were classified as lipids and lipid-like molecules, and 10 were classified as organic acids. Copper has long been associated with lipid metabolism. It has a positive role in lipid metabolism [2,9] can increase lipolysis in the liver and adipose tissue, and can promote fatty acid uptake in skeletal muscle. The results in this study also indicated high correlation between Cu and lipid metabolism in DPCs.
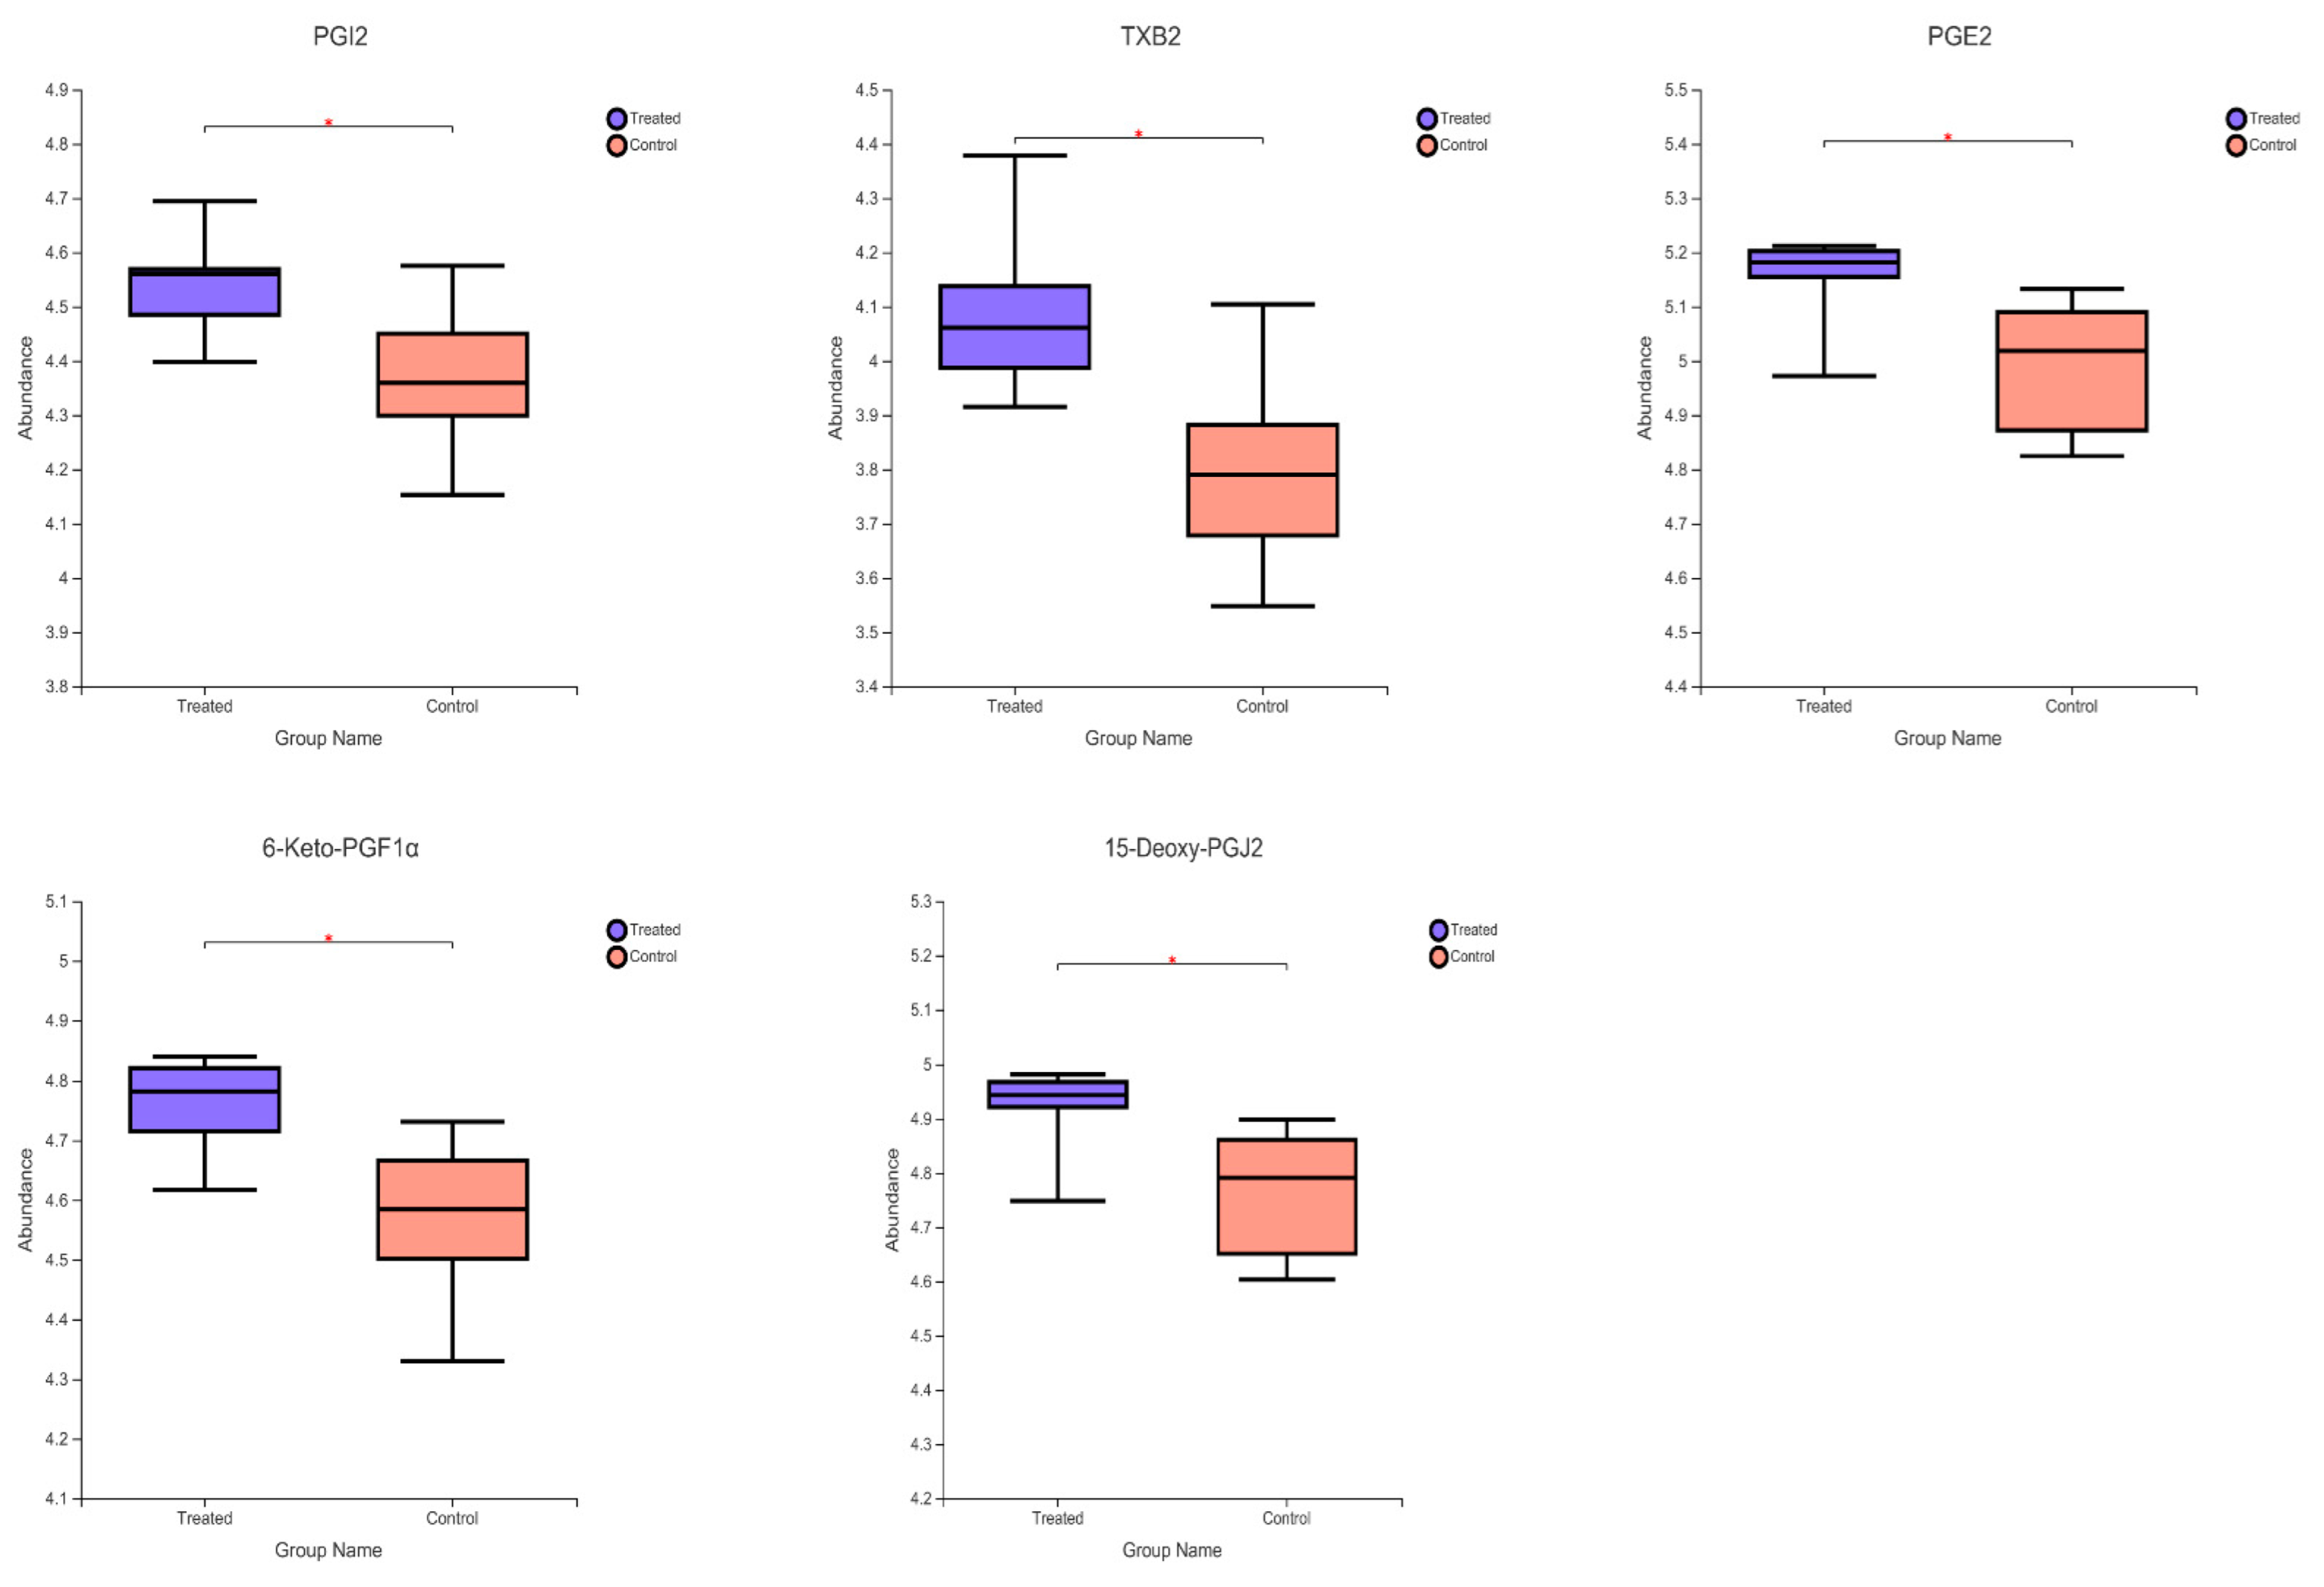
Pathway enrichment analysis was performed on differential metabolites to determine the most relevant pathways associated with Cu stimulation. Arachidonic acid metabolism (p < 0.0001), Histidine metabolism (p = 0.0013) and alanine, aspartate and glutamate metabolism (p = 0.0003) were the most significantly enriched pathways (Figure 8). In this study, the contents of prostaglandin I2 (PGI2), thromboxane (TXB2), 5-trans-PGE2 (PGE2), 6-keto-prostaglandin F1 alpha (6-keto-PGF1α), and 15-deoxy-delta-12,14-PGJ2 (15-Deoxy-PGJ2) increased significantly (Figure 9). Arachidonic acid is an ω-6 polyunsaturated fatty acid that is commonly found in mammalian cells, and has important biochemical roles, primarily as the direct precursor of many biologically active eicosanoic acid derivatives [21]. An increase in arachidonic acid and the concomitant production of eicosanoids can promote cell proliferation [22]. Arachidonic acid is released via cell membrane phospholipids catalyzed by phospholipase A2 in response to various physiological and pathological stimuli. Under the action of cyclooxygenase, it is converted to prostaglandin intermediate metabolites PGG2 and PGH2, in turn [23]. Various biologically active prostaglandins such as PGI2, PGE2, PGF2α, PGD2, and thromboxane A2 (TXA2) are produced by the action of different downstream prostaglandin synthases [24]. The most important metabolite is PGE2, because it has an irreplaceable role in cell proliferation [25]. The physiological function of PGE2 is achieved by activating its homologous G protein-coupled E prostaglandin receptor (EP1–EP4) [26]. According to Liu, [27] PGE2 can specifically activate the classical Wnt/β-catenin signaling pathway. In this study, the Cu-induced proliferation of DPCs (Figure 1A) might have been associated with increased levels of intracellular PGE2. In addition to PGE2, PGI2 is also one of the most important metabolites. Similar to TXA2, PGI2 contains epoxide bonds that can rapidly hydrolyze and have a short half-life of 30 s [22]. In this study, the contents of PGJ2 and 6-keto-PGF1α (final metabolite of PGJ2) also increased significantly. The compound PGI2 stimulates cAMP production via adenylate cyclase (AC) [8]. Krishnamoorthy [8] reported that Cu increases cAMP levels by inhibiting activity of the cAMP-degrading phosphodiesterase PDE3B. However, even if cAMP was regulated by both promotion of cAMP production (PGI2-AC-cAMP) and inhibition of cAMP degradation (PDE3B-cAMP), the absence of changes in cAMP content under Cu stimulation was unexpected. The absence of changes in the level of cAMP might have been due to differences in cell types.
Amino acids are the most important components of proteins and also serve as backup energy sources for cells [28]. Amino acids may also act as signaling molecules to regulate a variety of cellular physiological processes, including proliferation and autophagy [29]. Moreover, the chelation by amino acids is often important for copper homeostasis and storage. Copper homeostasis is maintained by a conserved group of proteins that often contain copper binding domains rich in cysteine, methionine or Histidine residues. [30,31] In monogastric animals, a set of sound regulatory mechanisms maintains Cu homeostasis [1]. Cu2+ is normally absorbed by the intestine, then enters blood circulation, and binds to serum albumin and L-histidine that form an exchangeable pool of copper [30]. Due to the high cytotoxicity of copper ions, intracellular copper ions are usually bound to specific copper chaperone proteins (e.g., cytochrome c oxidase 17, anti-oxidant 1, and copper chaperones for superoxide dismutase) and transported to specific target proteins; this is also considered to be a form of storage of copper ions [32]. In this study, Cu stimulation increased the contents of N-acetyl-aspartic acid, and Histidine metabolites (l-Histidinal, Hydantoin-5-propionic acid and S-glutamic acid) (Figure 5). We believe that the increased amino acid production may be due to the chelation by amino acids for copper homeostasis. Glutamic acid has an important role in hair growth and the proliferation of HF cells as an essential nutrient for DP and hair matrix cells. [33,34,35] N-acetyl aspartate is an important source of amino acids and acetates in the mammalian brain [36], and it is synthesized from aspartate and acetyl coenzyme A (acetyl-CoA) by the enzyme l-aspartate-N-acetyltransferase [37]. Acetyl-CoA is an important intermediate metabolite that is the hub of sugar, lipid, and protein metabolism [38]. The main sources of acetyl-CoA are the oxidative decarboxylation of pyruvate (a product of glycolysis) and the β-oxidation of fatty acids. However, no change in pyruvate and Acetyl-CoA contents were detected in this study, although phosphoenolpyruvate content simultaneously decreased significantly (Figure 5). The expression of CIV subunit (Figure 2D) due to Cu addition significantly increases the content of cytochrome c oxidase (Figure 1C), which ultimately leads to the attenuation of glycolysis accompanied by increased OXPHOS [8]. In this study, cytochrome c oxidase content increased significantly (Figure 1C), which is consistent with the study of Ramchandani [8]. However, Cu did not affect the mRNA expression of CIV (Figure 1D). In addition, Cu increased the mRNA expression of COX17, indicating an increase in Cu translocation from mitochondria to cytochrome c oxidase (Figure 1D). Thus, the decrease in phosphoenolpyruvate content was attributed to increased OXPHOS and weakened glycolysis. Furthermore, it is worth nothing that citric acid content decreased (Figure 5). The citric acid cycle (TCA cycle) is the final common oxidative pathway for carbohydrates, fats, and amino acids [39]. The first step in the TCA cycle is the condensation of acetyl-CoA and oxaloacetate to citric acid by the action of citrate synthase (CS) [40]. Metal ions such as Cu2+, Zn2+, and Mg+ have strong inhibitory effects on CS activity [41]. In addition, ATP is also an allosteric inhibitor of CS [42]. Therefore, inhibition of CS by Cu2+ and increased levels of ATP might explain the significant decrease in citric acid content.

4. Materials and Methods

4.1. Cells

Dermal papilla cells (DPCs) of Rex rabbits were kindly provided by Professor Xinsheng Wu (College of Animal Science and Technology, Yangzhou University, Jiangsu, China) and were identified as described previously [43].

4.2. Cell Culture

Dermal papilla cells were cultured at 37 °C in a cell incubator with 5% CO2. For the CCK-8 experiment, DPCs were serum starved in Dulbecco’s modified eagle medium (DMEM) (Thermo Fisher, Carlsbad, CA, USA) with 2% Fetal Bovine Serum (FBS) (Thermo Fisher, Carlsbad, CA, USA) overnight. Cells were then treated with 0, 0.2, 0.5, 0.75, 1.0, 2, 5, 10, 100, 1000 nM Cu (as copper chloride) for 24 h in DMEM with no serum. After treatment, cells were washed with PBS twice and then 200 µL of lysate was added to each well of a 6-well plate, and then the lysate was collected into a 1.5 mL centrifuge tube followed by centrifugation at 12,000× g for 5 min. Then, contents of ATP and Complex IV were determined using a Varioskan LUX plate reader (Thermo Fisher, Carlsbad, CA, USA). Solarbio provided a Cell Proliferation and Cytotoxicity Assay Kit (CCK-8) (CA1210; Beijing Solarbio Science & Technology Co., Ltd., Beijing, China); Beyotime supplied an ATP Assay Kit (S0026; Shanghai Beyotime Science & Technology Co., Ltd., Shanghai, China); and Enzyme-linked Biotechnology supplied a Complex IV assay kit (Shanghai Enzyme-Linked Biotechnology Co., Ltd., Shanghai, China). Simultaneously, the protein content of each sample was measured with a protein content assay kit (Thermo Fisher, Carlsbad, CA, USA). Contents of ATP and Complex IV were normalized to nmol/mg protein.

4.3. RNA Isolation and Analysis

Extraction of total RNA and reverse-transcription quantitative PCR were performed as described previously. Accurate Biotechnology supplied a reverse-transcription kit (Accurate Biotechnology Co., Ltd., Hunan, China) and Takara supplied SYBR Green master mix (Takara, Dalian, China). The gene for normalization was GAPDH (glyceraldehyde-3-phosphate dehydrogenase), and results of relative mRNA quantification were verified using β-actin levels. The mRNA expression was analyzed using the 2-ΔΔCT method. [1,2] Primer sequences are shown in Table 3.

4.4. Western Blot

Total protein was extracted using a radioimmunoprecipitation assay (RIPA) lysis buffer (Solarbio, Beijing, China) with addition of PMSF and protease inhibitor; the protein concentration was determined using a BCA assay kit (Beyotime, Shanghai, China). The proteins were separated on a 7.5–10% SDS polyacrylamide gel electrophoresis, transferred on PVDF membranes at 200 mA at 4 °C and closed in fast closing solution (New Cell Molecular Biotechnology Co., Ltd., Shanghai, China) for 30 min. Protein detection was performed using enhanced chemiluminescence detection reagents (Beyotime, Shanghai, China). Polyclonal rabbit anti-GAPDH antibody was used as a loading control. Western blots were developed and quantified with BioSpectrum 810 Imaging System using VisionWorksLS 7.1 software (UVP LLC, Upland, CA, USA). The standard markers for protein molecular masses were supplied by Thermo (Cat# 26617, Thermo Fisher, Carlsbad, CA, USA). The membranes were probed with the required antibodies: OXPHOS antibody cocktail (Cat# ab110413, abcam, Cambridge, UK), GAPDH (Cat# ab9485, abcam, Cambridge, UK). The horseradish peroxidase (HRP)-conjugated goat anti-rabbit IgG and goat anti-mouse IgG antibody were supplied by Beyotime (Beyotime, Shanghai, China).

4.5. Metabolite Extraction

Cell samples were added to 2-mL centrifuge tubes. Grinding beads (6 mm) and 400 µL of extract solution (methyl alcohol:water = 4:1) containing 0.02 mg/mL L-2-chlorophenylalanine were added to the tubes. Tubes were transferred to a frozen tissue grinder for 6 min (−10 °C, 50 Hz). Metabolites were extracted for 30 min (5 °C, 40 KHz) and then left for 30 min (−20 °C). Last, samples were centrifuged for 15 min (13,000× g, 4 °C). In addition, 20 µL of supernatant from each sample was mixed well and used as a quality control sample.

4.6. UHPLC–MS Analysis

The UHPLC–MS/MS testing was conducted by Shanghai Majorbio Bio-pharm Technology Co., Ltd. (Majorbio, Shanghai, China). The LC–MS/MS analyses were performed using a Vanquish UHPLC system (Thermo Fisher, Carlsbad, CA, USA) coupled with an Orbitrap Q Exactive series mass spectrometer (Thermo Fisher, Carlsbad, CA, USA). Samples were injected onto an ACQUITY UPLC HSS T3 column (100 mm × 2.1 mm i.d., 1.8 μm) using a 16-min linear gradient at a flow rate of 0.2 mL/min. Mobile phase A was 95% water + 5% acetonitrile (including 0.1% formic acid), and mobile phase B was 47.5% acetonitrile + 47.5% isopropanol + 5% water (containing 0.1% formic acid). The flow rate was 0.40 mL/min, the injection volume was 2 μL, and the column temperature was 40 °C. The Q Exactive series mass spectrometer was operated in positive and negative polarity modes with spray voltage of 3.5 kV and −2.9 kV, respectively, capillary temperature of 320 °C, sheath gas flow rate of 40 arb, aux gas flow rate of 10 arb, and resolution of 17,500 MS2.

4.7. Database Search

Raw data files generated by LC/MS were processed using Progenesis QI (Waters, Milford, CT, USA) to perform peak alignment, peak selection, and quantitation of each metabolite. Peaks with a relative standard deviation greater than 30% in QC samples were excluded. Last, peak intensities were normalized to the total spectral intensity.

4.8. Data Analysis

Metabolites were annotated using the Kyoto Encyclopedia of Genes and Genomes (KEGG) database (http://www.genome.jp/kegg/), Human Metabolome Database (HMDB) (www.hmdb.ca/), and Lipidmaps database (http://www.lipidmaps.org/). Principal component analysis (PCA) and partial least squares discriminant analysis (PLS-DA) were performed using the online Majorbio Cloud Platform (www.majorbio.com). Statistical significance (p-value) was determined using univariate analysis (t-test). Metabolites with VIP_PLS-DA > 1 and p < 0.05 were considered to be differential metabolites. Volcano plots were prepared at BIC (http://www.ehbio.com/Cloud_Platform/front/#/), with Log2 (fold change) on the x-axis and −Log10 (p-value) on the y-axis. Cluster and functional analyses of metabolites were performed using the online Majorbio Cloud Platform (www.majorbio.com). Metabolic pathways at p < 0.05 were considered to be significantly enriched.

5. Conclusions

Cu is essential for maintaining the function of the cellular mitochondrial electron transport chain (ETC) pathway and an appropriate concentration of Cu (1 nM) can promote the proliferation of DPc. In addition, we use untargeted metabolomics to provide a direct link between Cu-mediated metabolic reprograming and the proliferation of DPc. In brief, a direct regulatory role of Cu in the cellular metabolism of DPCs was revealed in this study, which will provide an important reference basis for future studies on the biological roles of Cu and highlight its potential to be developed as a metabolic regulatory factor.

Author Contributions

Conceptualization, F.L. (Fan Li) and H.L.; Data curation, F.L. (Fan Li); Formal Analysis, F.L. (Fan Li); Investigation, F.L. (Fan Li) and X.W.; Methodology, H.L.; investigation, M.L.; resources, F.L. (Fuchang Li); Software, F.L. (Fan Li) and Z.Y.; Supervision, F.L. (Fan Li); Validation, F.L. (Fan Li); visualization, F.L. (Fan Li); Writing—original draft, F.L. (Fan Li); Writing—review & editing, F.L. (Fan Li); project administration, L.L. and F.L. (Fuchang Li); funding acquisition, F.L. (Fuchang Li). All authors have read and agreed to the published version of the manuscript.

Funding

This research was funded by the Natural Science Foundation of China, grant number 31972594, The China Agriculture Research System of MOF and MARA, grant number CARS-43-B-1, and the Shandong “Double Tops” Program.

Institutional Review Board Statement

All the experimental procedures were carried out in accordance with the local Experimental Animal Care Committee and approved by the Ethics Committee of the Department of Nutrition and Clinical Nutrition of Shandong Agricultural University.

Informed Consent Statement

Not applicable.

Data Availability Statement

The datasets generated during and/or analyzed during the current study are available from the corresponding author on reasonable request.

Conflicts of Interest

The authors declare no conflict of interest in the submission of this manuscript.

References

  1. Li, F.; Liu, L.; Chen, X.; Zhang, B.; Li, F. Dietary Copper Supplementation Increases Growth Performance by Increasing Feed Intake, Digestibility, and Antioxidant Activity in Rex Rabbits. Biol. Trace Elem. Res. 2021, 199, 4614–4623. [Google Scholar] [CrossRef] [PubMed]
  2. Li, F.; Wu, X.; Liu, H.; Zhang, B.; Liu, L.; Li, F. Dietary copper supplementation enhances lipolysis in Rex rabbits. J. Trace Elem. Med. Biol. 2021, 68, 126851. [Google Scholar] [CrossRef]
  3. Liu, Z.; Wu, X.; Zhang, T.; Guo, J.; Gao, X.; Yang, F.; Xing, X. Effects of Dietary Copper and Zinc Supplementation on Growth Performance, Tissue Mineral Retention, Antioxidant Status, and Fur Quality in Growing-Furring Blue Foxes (Alopex lagopus). Biol. Trace Elem. Res. 2015, 168, 401–410. [Google Scholar] [CrossRef] [PubMed]
  4. Wu, X.; Liu, Z.; Guo, J.; Wan, C.; Zhang, T.; Cui, H.; Yang, F.; Gao, X. Influence of dietary zinc and copper on apparent mineral retention and serum biochemical indicators in young male mink (Mustela vison). Biol. Trace Elem. Res. 2015, 165, 59–66. [Google Scholar] [CrossRef] [PubMed]
  5. Harris, E.D. Basic and clinical aspects of copper. Crit. Rev. Clin. Lab. Sci. 2003, 40, 547–586. [Google Scholar] [CrossRef]
  6. Turski, M.L.; Thiele, D.J. New roles for copper metabolism in cell proliferation, signaling, and disease. J. Biol. Chem. 2009, 284, 717–721. [Google Scholar] [CrossRef] [PubMed] [Green Version]
  7. Lippard, S.J.; Berg, J.M. Principles of Bioinorganic Chemistry; University Science Books: Mill Valley, CA, USA, 1994. [Google Scholar]
  8. Krishnamoorthy, L.; Cotruvo, J.A.; Chan, J., Jr.; Kaluarachchi, H.; Muchenditsi, A.; Pendyala, V.S.; Jia, S.; Aron, A.T.; Ackerman, C.M.; Wal, M.N.; et al. Copper regulates cyclic-AMP-dependent lipolysis. Nat. Chem. Biol. 2016, 12, 586–592. [Google Scholar] [CrossRef] [Green Version]
  9. Brady, D.C.; Crowe, M.S.; Turski, M.L.; Hobbs, G.A.; Yao, X.; Chaikuad, A.; Knapp, S.; Xiao, K.; Campbell, S.L.; Thiele, D.J.; et al. Copper is required for oncogenic BRAF signalling and tumorigenesis. Nature 2014, 509, 492–496. [Google Scholar] [CrossRef] [Green Version]
  10. Horn, D.; Barrientos, A. Mitochondrial copper metabolism and delivery to cytochrome c oxidase. IUBMB Life 2008, 60, 421–429. [Google Scholar] [CrossRef] [Green Version]
  11. Barrientos, A.; Barros, M.H.; Valnot, I.; Rötig, A.; Rustin, P.; Tzagoloff, A. Cytochrome oxidase in health and disease. Gene 2002, 286, 53–63. [Google Scholar] [CrossRef]
  12. Stiburek, L.; Hansikova, H.; Tesarova, M.; Cerna, L.; Zeman, J. Biogenesis of eukaryotic cytochrome c oxidase. Physiol. Res. 2006, 55, S27–S41. [Google Scholar] [CrossRef] [PubMed]
  13. Ramchandani, D.; Berisa, M.; Tavarez, D.A.; Li, Z.; Miele, M.; Bai, Y.; Lee, S.B.; Ban, Y.; Dephoure, N.; Hendrickson, R.C.; et al. Copper depletion modulates mitochondrial oxidative phosphorylation to impair triple negative breast cancer metastasis. Nat. Commun. 2021, 12, 7311. [Google Scholar] [CrossRef]
  14. Yu, Z.; Jiang, K.; Xu, Z.; Huang, H.; Qian, N.; Lu, Z.; Chen, D.; Di, R.; Yuan, T.; Du, Z.; et al. Hoxc-Dependent Mesenchymal Niche Heterogeneity Drives Regional Hair Follicle Regeneration. Cell Stem Cell 2018, 23, 487–500.e6. [Google Scholar] [CrossRef] [PubMed] [Green Version]
  15. Kim, C.S.; Ding, X.; Allmeroth, K.; Biggs, L.C.; Kolenc, O.I.; L’Hoest, N.; Chacón-Martínez, C.A.; Edlich-Muth, C.; Giavalisco, P.; Quinn, K.P.; et al. Glutamine Metabolism Controls Stem Cell Fate Reversibility and Long-Term Maintenance in the Hair Follicle. Cell Metab. 2020, 32, 629–642.e8. [Google Scholar] [CrossRef] [PubMed]
  16. Finner, A.M. Nutrition and hair: Deficiencies and supplements. Dermatol. Clin. 2013, 31, 167–172. [Google Scholar] [CrossRef]
  17. Xiong, Q.Q.; Shen, T.H.; Zhong, L.; Zhu, C.L.; Peng, X.S.; He, X.P.; Fu, J.R.; Ouyang, L.J.; Bian, J.M.; Hu, L.F.; et al. Comprehensive metabolomic, proteomic and physiological analyses of grain yield reduction in rice under abrupt drought-flood alternation stress. Physiol. Plant. 2019, 167, 564–584. [Google Scholar] [CrossRef] [PubMed]
  18. Li, C.; Zhang, J.; Wu, R.; Liu, Y.; Hu, X.; Yan, Y.; Ling, X. A novel strategy for rapidly and accurately screening biomarkers based on ultraperformance liquid chromatography-mass spectrometry metabolomics data. Anal. Chim. Acta 2019, 1063, 47–56. [Google Scholar] [CrossRef]
  19. Zhang, Z.; Dai, Q.; Zhang, Y.; Zhuang, H.; Wang, E.; Xu, Q.; Ma, L.; Wu, C.; Huan, Z.; Guo, F.; et al. Design of a Multifunctional Biomaterial Inspired by Ancient Chinese Medicine for Hair Regeneration in Burned Skin. ACS Appl. Mater. Interfaces 2020, 12, 12489–12499. [Google Scholar] [CrossRef]
  20. Zhang, W.; Zhang, Y.S.; Zhu, X.P.; Wang, R.L.; Jia, Z.H. Effect of different levels of copper and molybdenum supplements on performance, nutrient digestibility, and follicle characteristics in cashmere goats. Biol. Trace Elem. Res. 2011, 143, 1470–1479. [Google Scholar] [CrossRef]
  21. Martin, S.A.; Brash, A.R.; Murphy, R.C. The discovery and early structural studies of arachidonic acid. J. Lipid Res. 2016, 57, 1126–1132. [Google Scholar] [CrossRef] [Green Version]
  22. Koundouros, N.; Karali, E.; Tripp, A.; Valle, A.; Inglese, P.; Perry, N.; Magee, D.J.; Anjomani Virmouni, S.; Elder, G.A.; Tyson, A.L.; et al. Metabolic Fingerprinting Links Oncogenic PIK3CA with Enhanced Arachidonic Acid-Derived Eicosanoids. Cell 2020, 181, 1596–1611. [Google Scholar] [CrossRef] [PubMed]
  23. Bui, P.; Imaizumi, S.; Beedanagari, S.R.; Reddy, S.T.; Hankinson, O. Human CYP2S1 metabolizes cyclooxygenase- and lipoxygenase-derived eicosanoids. Drug Metab. Dispos. Biol. Fate Chem. 2011, 39, 180–190. [Google Scholar] [CrossRef] [Green Version]
  24. Kanikarla-Marie, P.; Kopetz, S.; Hawk, E.T.; Millward, S.W.; Sood, A.K.; Gresele, P.; Overman, M.; Honn, K.; Menter, D.G. Bioactive lipid metabolism in platelet "first responder" and cancer biology. Cancer Metastasis Rev. 2018, 37, 439–454. [Google Scholar] [CrossRef]
  25. Yang, C.; Li, C.; Li, M.; Tong, X.; Hu, X.; Yang, X.; Yan, X.; He, L.; Wan, C. CYP2S1 depletion enhances colorectal cell proliferation is associated with PGE2-mediated activation of β-catenin signaling. Exp. Cell Res. 2015, 331, 377–386. [Google Scholar] [CrossRef] [PubMed]
  26. Wang, D.; Dubois, R.N. Prostaglandins and cancer. Gut 2006, 55, 115–122. [Google Scholar] [CrossRef] [PubMed]
  27. Liu, C.; Li, Y.; Semenov, M.; Han, C.; Baeg, G.; Tan, Y.; Zhang, Z.; Lin, X.; He, X. Control of β-Catenin Phosphorylation/Degradation by a Dual-Kinase Mechanism. Cell 2002, 108, 837–847. [Google Scholar] [CrossRef] [Green Version]
  28. Wu, G. Dietary requirements of synthesizable amino acids by animals: A paradigm shift in protein nutrition. J. Anim. Sci. Biotechnol. 2014, 5, 34. [Google Scholar] [CrossRef] [Green Version]
  29. Jewett, M.C.; Miller, M.L.; Chen, Y.; Swartz, J.R. Continued protein synthesis at low [ATP] and [GTP] enables cell adaptation during energy limitation. J. Bacteriol. 2009, 191, 1083–1091. [Google Scholar] [CrossRef] [Green Version]
  30. Wang, T.; Guo, Z. Copper in medicine: Homeostasis, chelation therapy and antitumor drug design. Curr. Med. Chem. 2006, 13, 525–537. [Google Scholar] [CrossRef]
  31. Lau, S.J.; Sarkar, B. Ternary coordination complex between human serum albumin, copper (II), and L-histidine. J. Biol. Chem. 1971, 246, 5938–5943. [Google Scholar] [CrossRef]
  32. Prohaska, J.R. Role of copper transporters in copper homeostasis. Am. J. Clin. Nutr. 2008, 88, 826S–829S. [Google Scholar] [CrossRef] [PubMed] [Green Version]
  33. Jara, C.P.; de Andrade Berti, B.; Mendes, N.F.; Engel, D.F.; Zanesco, A.M.; Pereira de Souza, G.F.; de Medeiros Bezerra, R.; de Toledo Bagatin, J.; Maria-Engler, S.S.; Morari, J.; et al. Glutamic acid promotes hair growth in mice. Sci. Rep. 2021, 11, 15453. [Google Scholar] [CrossRef]
  34. Kim, H.S.; Kwon, H.K.; Lee, D.H.; Le, T.N.; Park, H.J.; Kim, M.I. Poly(γ-Glutamic Acid)/Chitosan Hydrogel Nanoparticles For Effective Preservation And Delivery Of Fermented Herbal Extract For Enlarging Hair Bulb And Enhancing Hair Growth. Int. J. Nanomed. 2019, 14, 8409–8419. [Google Scholar] [CrossRef] [Green Version]
  35. Choi, J.C.; Uyama, H.; Lee, C.H.; Sung, M.H. In vivo hair growth promotion effects of ultra-high molecular weight poly-γ-glutamic acid from Bacillus subtilis (Chungkookjang). J. Microbiol. Biotechnol. 2015, 25, 407–412. [Google Scholar] [CrossRef] [PubMed] [Green Version]
  36. Rigotti, D.J.; Kirov, I.I.; Djavadi, B.; Perry, N.; Babb, J.S.; Gonen, O. Longitudinal whole-brain N-acetylaspartate concentration in healthy adults. Am. J. Neuroradiol. 2011, 32, 1011–1015. [Google Scholar] [CrossRef] [PubMed] [Green Version]
  37. Mekala, J.R.; Kurappalli, R.K.; Ramalingam, P.; Moparthi, N.R. N-acetyl l-aspartate and Triacetin modulate tumor suppressor MicroRNA and class I and II HDAC gene expression induce apoptosis in Glioblastoma cancer cells in vitro. Life Sci. 2021, 286, 120024. [Google Scholar] [CrossRef]
  38. Shi, L.; Tu, B.P. Acetyl-CoA and the regulation of metabolism: Mechanisms and consequences. Curr. Opin. Cell Biol. 2015, 33, 125–131. [Google Scholar] [CrossRef] [Green Version]
  39. Akram, M. Citric acid cycle and role of its intermediates in metabolism. Cell Biochem. Biophys. 2014, 68, 475–478. [Google Scholar] [CrossRef]
  40. Baldwin, J.E.; Krebs, H. The evaluation of metabolic cycle. Nature 1981, 292, 291–381. [Google Scholar]
  41. Ge, Y.D.; Pan, W.; Wang, J.; Zhu, G.P. Advances in molecular biology of citrate synthase. J. Biol. 2010, 27, 59–62. [Google Scholar]
  42. Bond, D.R.; Mester, T.; Nesbø, C.L.; Izquierdo-Lopez, A.V.; Collart, F.L.; Lovley, D.R. Characterization of citrate synthase from Geobacter sulfurreducens and evidence for a family of citrate synthases similar to those of eukaryotes throughout the Geobacteraceae. Appl. Environ. Microbiol. 2005, 71, 3858–3865. [Google Scholar] [CrossRef] [PubMed] [Green Version]
  43. Li, J.l.; Liu, M.; Zhou, J.; Chen, Q.R.; Chen, Y.; Chen, S.; Shen, J.Y.; Wu, X. Isolation, Culture and Identification of Rabbit Dermal Papilla Cells. Chin. J. Rabbit. Farm. 2020, 3, 4–7. [Google Scholar]
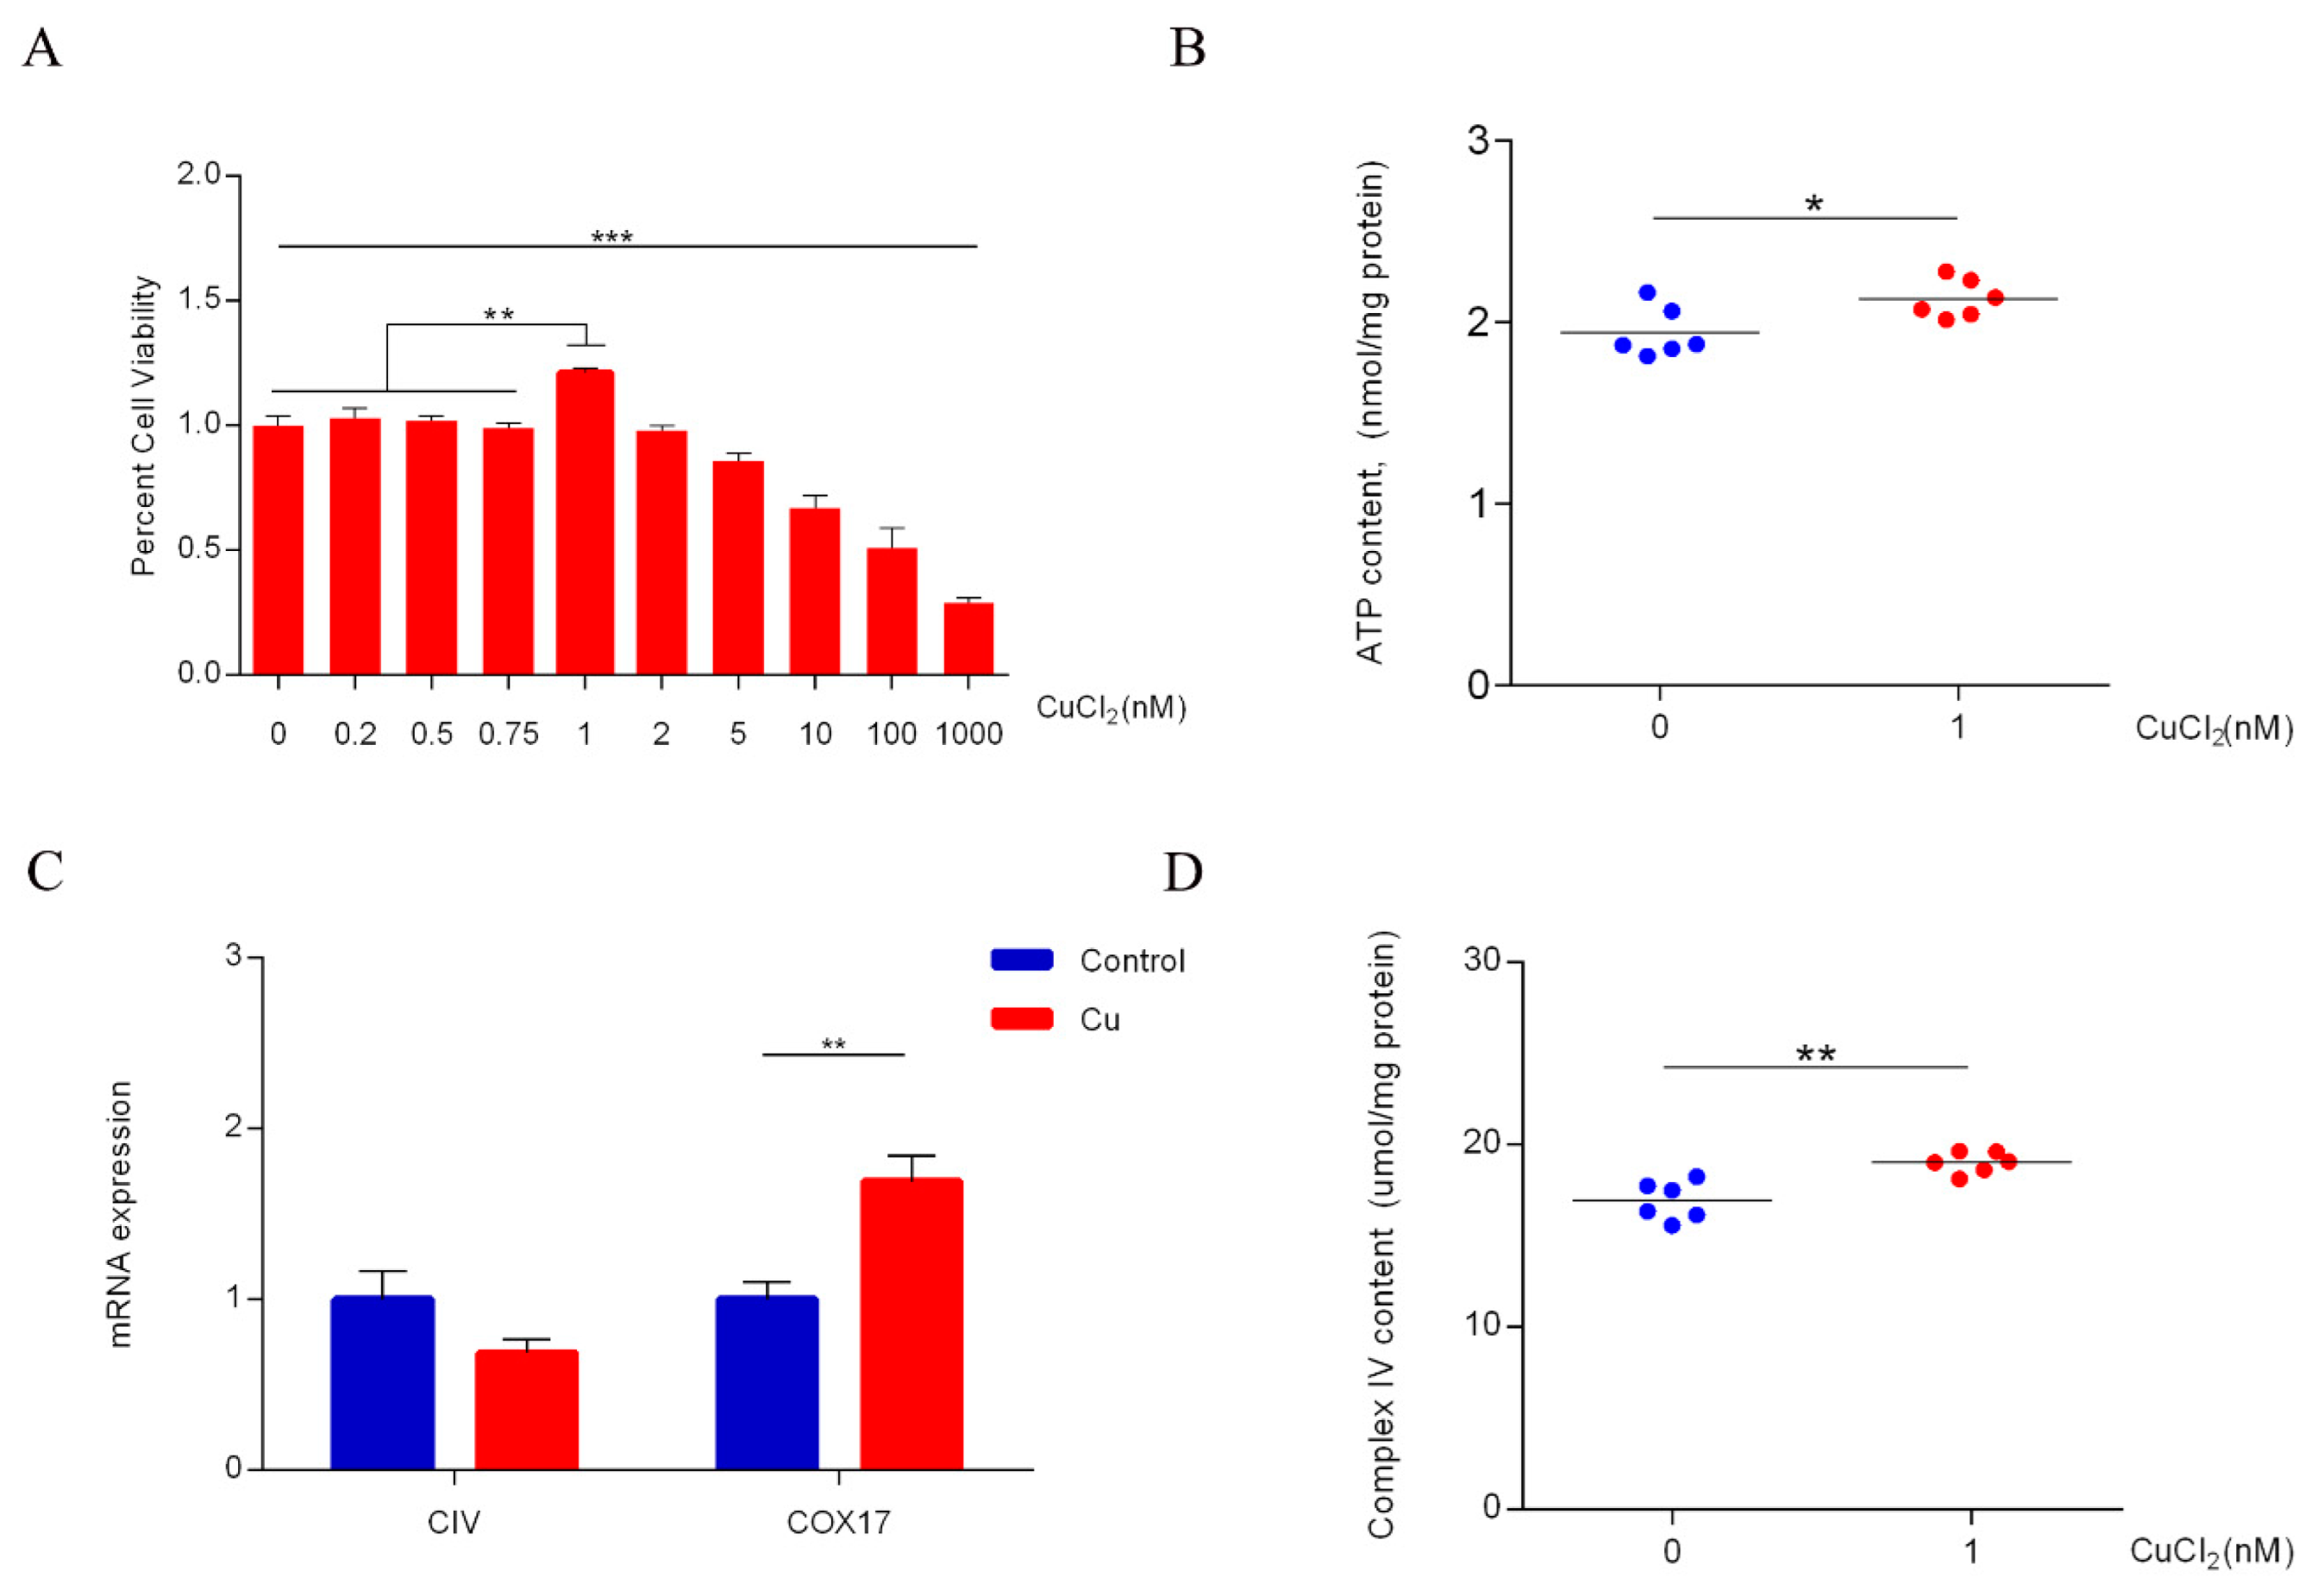
Figure 1. (A) CCK-8 assay for cell viability with increasing copper concentration; dermal papilla cells were serum starved in DMEM overnight followed by addition of different amounts of CuCI2 for 24 h (n = 6). Significance was calculated using One-way ANOVA with Tukey post-test for comparing multiple groups. * p < 0.05, ** p < 0.01, *** p < 0.001. (B) Measurement of intracellular adenosine triphosphate (ATP) content; dermal papilla cells were serum starved in DMEM overnight followed by addition of CuCI2 for 24 h (n = 6). Analysis was performed by unpaired two-sided t-test. * p < 0.05. (C) qPCR analysis showing transcript levels of cytochrome c oxidase subunit 1 (CIV) and cytochrome c oxidase copper chaperone (COX17) in control and copper (1 nM)-treated dermal papilla cells, treated with copper for 1 h (n = 6). Analysis was performed by unpaired two-sided t-test. ** p < 0.01. (D) Measurement of intracellular Complex IV content; dermal papilla cells were serum starved in DMEM overnight followed by addition of CuCI2 for 24 h (n = 6). Analysis was performed by unpaired two-sided t-test. ** p < 0.01.
Ijms 23 06209 g001
Figure 2. Western blot showing respiratory complexes in dermal papilla cells following 24 h Cu treatment (0, 0.2, 0.5, 1 µM). Complexes I–V are referred to as CI (A) (mol. wt. ~19 kDa), CII (B) (mol. wt. ~30 kDa), CIII (C) (mol. wt. ~48 kDa), (D) CIV (mol. wt. ~40 kDa), and (E) CV (mol.wt. ~55 kDa), respectively. Significance was calculated using one-way ANOVA with Tukey post-test for comparing multiple groups. n.s. represents no significant difference. * p < 0.05, *** p < 0.001.
Ijms 23 06209 g002
Figure 3. Principal component analysis (PCA) score plot of control; treated and QC samples under positive ion mode (POS) (A) and negative ion mode (NEG) (B). PCA based on the UHPLC-MS/MS spectra of quality control (QC) samples and metabolites in dermal papilla cells obtained from the control group and treated group (copper group) (n = 6).
Ijms 23 06209 g003
Figure 4. PCA scores of total samples under the positive ion mode (A) and negative ion mode (B), respectively (n = 6). Partial least squares discriminant analysis (PLS-DA) with a 2D score plot of copper group and controls under the positive ion mode (C) and negative ion mode (D), respectively. Permutation analysis plotting R2 and Q2 from 200 permutation tests in the PLS-DA model, under the positive ion mode (E) and negative mode (F), respectively. Treated represented copper groups.
Ijms 23 06209 g004
Figure 5. Volcano plot by metabolomics analysis under positive ion mode (A) and negative ion mode (B), respectively (n = 6). The red points represent significantly up-regulated metabolites (p-value < 0.05 and VIP > 1) according to the univariate statistical analysis; the green points represent significantly down-regulated metabolites (p-value < 0.05 and VIP > 1) and the gray points represent metabolites that did not change.
Ijms 23 06209 g005
Figure 6. Heat maps of significantly different metabolites under positive ion mode (A) and negative ion mode (B), respectively (n = 6). The color in the panel represents the relative levels of each metabolite: purple represents low levels, and red represents high levels. In maps, class (A) represented control samples and class (B) represented copper samples.
Ijms 23 06209 g006
Figure 7. Classification analysis of differential metabolites based on KEGG database (A) and HMDB database (B).
Ijms 23 06209 g007
Figure 8. Differential metabolomic pathways of differentially expressed metabolites according to the KEGG database matched results under positive ion mode (A) and negative ion mode (B), respectively (n = 6). The size of each point represents the metabolite number, and the color represents p-value.
Ijms 23 06209 g008
Figure 9. Relative abundance of arachidonic acid derivative prostaglandin I2 (PGI2), thromboxane (TXB2), 5-trans-PGE2 (PGE2), 6-Keto-prostaglandin F1alpha (6-Keto-PGF1α) and 15-deoxy- delta-12,14-PGJ2 (15-Deoxy-PGJ2) (n = 6). * p < 0.05. In maps, control represented control group and treated represented copper group.
Ijms 23 06209 g009
Table 1. Positively identified significantly differentially expressed metabolites in the dermal papilla cells after copper treatment under positive ion mode (n = 6).
MetaboliteFormulaM/ZRT (Min)FCp-ValueVIPRegulate
PC (14:0/0:0)C22H46NO7P468.317.421.020.01281.21up
Prostaglandin I2C20H32O5353.234.751.040.03941.44up
NiacinamideC6H6N2O123.061.321.020.0441.18up
5’-Deoxy-5’-(methylthio)adenosineC11H15N5O3S298.11.851.040.00931.75up
Pantothenic AcidC9H17NO5220.121.761.030.01971.38up
[3-(6,7-dimethoxy-2H-1,3-benzodioxol-5-yl)oxiran-2-yl]methanolC12H14O6237.083.241.020.00231.06up
Methylsuccinic acidC5H8O4133.051.651.110.00042.37up
4-Pyrimidine Methanamine (hydrochloride)C5H7N3110.070.641.020.04790.94up
HistidinalC6H9N3O122.070.681.050.00061.74up
L-CarnitineC7H15NO3162.110.681.020.03611.15up
Tyrosyl-TyrosineC18H20N2O5309.133.481.030.01391.28up
FuranogermenoneC15H20O2215.146.061.040.0321.35up
AvocadeneC17H34O3304.286.30.960.00941.55down
TXB2C20H34O6393.224.751.080.01861.98up
Notoginsenoside R1C47H80O18478.272.381.070.00042.07up
2-HydroxymethylclavamC6H9NO3144.070.761.020.03221.06up
M/Z: mass charge ratio; RT: Retention time; FC: Fold change; VIP: Variable Importance for Projection, one indicator reflecting the capability of the variables to explain Y.
Table 2. Positively identified significantly differentially expressed metabolites in the dermal papilla cells after copper treatment under negative ion mode (n = 6).
MetaboliteFormulaM/ZRT (Min)FCp-ValueVIPRegulate
5-trans-PGE2C20H32O5333.20725.49261.0324780.034041.23838up
11beta,20-Dihydroxy-3-oxopregn-4-en-21-oic acidC22H30O5419.20535.49261.0390480.029041.25489up
OrotidineC10H12N2O8333.05920.651.0349720.025171.268658up
(S)-Glutamic acidC5H9NO4146.04470.67881.0354620.036971.329292up
Flavin adenine dinucleotide (FAD)C27H33N9O15P2784.15111.97150.9754010.03711.047502down
Hydroxyphenyllactic acidC9H10O4181.04982.12690.8988611.51E-052.355815down
KAPAC9H17NO3186.11272.98610.9716010.043261.199216down
1-(1,2,3,4,5-Pentahydroxypent-1-yl)-1,2,3,4-tetrahydro-beta-carboline-3-carboxylateC17H22N2O7365.13611.74691.0431250.021771.30918up
4-hydroxy Nonenal GlutathioneC19H33N3O8S462.1923.35351.0573590.0058531.52711up
3,4-Dimethyl-5-propyl-2-furandecanoic acidC19H32O3307.22797.56021.0570210.042611.368364up
LysoPC(O-18:0)C26H56NO6P554.3839.05841.021860.0043981.2194up
Citric acidC6H8O7191.01891.50580.8761690.0001092.687449down
N-Glycolylneuraminic acidC11H19NO10324.09350.70091.052180.012191.55297up
Hydantoin-5-propionic acidC6H8N2O4343.09110.74311.0314650.04791.059106up
XanthineC5H4N4O2151.02511.65271.1070710.0002082.243746up
5′-O-Desmethyl omeprazoleC16H17N3O3S368.04611.65271.1015959.80E-052.193221up
ProlylhydroxyprolineC10H16N2O4227.10332.03530.9432730.0021481.599332down
Cortolone-3-glucuronideC27H42O11587.2692.32480.9531630.018741.39429down
Gamma-GlutamylisoleucineC11H20N2O5241.11912.64730.9021020.0001212.100603down
6-Keto-PGF1alphaC20H34O6369.22824.75241.042050.019691.421972up
Deoxycholic acidC24H40O4391.28587.42980.8992430.038531.777803down
LysoPE(18:0/0:0)C23H48NO7P480.30978.83371.0148790.0050510.995126up
LysoPE(0:0/20:1(11Z))C25H50NO7P506.32518.87891.0255030.0095241.055846up
StearoylcarnitineC25H49NO4464.31479.05841.0235180.0039411.197591up
StearaldehydeC18H36O313.27489.01361.1232570.010912.161813up
15(R)-PGE1C20H34O5353.23335.55081.0333590.045411.076758up
15-deoxy-delta-12,14-PGJ2C20H28O3315.19645.49261.0325490.034071.213301up
Alpha-Phenylcyclohexylglycolic acidC14H18O3233.11785.49261.0397930.040391.189628up
GlutamylisoleucineC11H20N2O5241.11912.82730.9423130.0005731.700102down
Ganglioside GT2 (d18:0/16:0)C88H154N4O42968.49492.57820.950.000891.774021down
8-Hydroxy-5,6-octadienoic acidC8H12O3467.22632.19580.9016080.04061.763572down
Valyl-HydroxyprolineC10H18N2O4251.10361.70570.9570970.016741.273209down
N-acetylaspartateC6H9NO5174.03981.26711.0683410.039571.420163up
Phosphoenol pyruvateC3H5O6P166.9740.76560.932010.023861.694889down
M/Z: mass charge ratio; RT: Retention time; FC: Fold change; VIP: Variable Importance for Projection, one indicator reflecting the capability of the variables to explain Y.
Table 3. Primer sequences of related genes.
Genes 1GenBank Accession NumberPrimer Sequences (5′–3′)Product Size/bp
CIVXM_008252337.2F: 5′-CTATTTGGAGCTTGAGCTGGGATGG-3′
R:5′-AAGGCATGTGCGGTGACGATTAC-3′
128
COX17XM_002716664.3F: 5′-CAGGAGAAGAAGCCGCTGAAGC-3′
R:5′-GGGCCTCAATTAGATGTCCACAGTG-3′
141
GAPDHNM_001082253.1F: 5′-CACCAGGGCTGCTTTTAACTCT-3′
R:5′-CTTCCCGTTCTCAGCCTTGACC-3′
163
β-actinXM_002722894.3F: 5′-CGCAGAAACGAGACGAGATT-3′
R:5′-GCAGAACTTTGGGGACTTTG-3′
123
1 CIV = cytochrome c oxidase subunit 1; COX17 = cytochrome c oxidase copper chaperone; GAPDH = glyceraldehyde phosphate dehydrogenase; β-actin = actin alpha.
Publisher’s Note: MDPI stays neutral with regard to jurisdictional claims in published maps and institutional affiliations.