
Social Isolation Stress Modulates Pregnancy Outcomes and the Inflammatory Profile of Rat Uterus

 , ,
, ,
Abstract
:
1. Introduction
2. Results
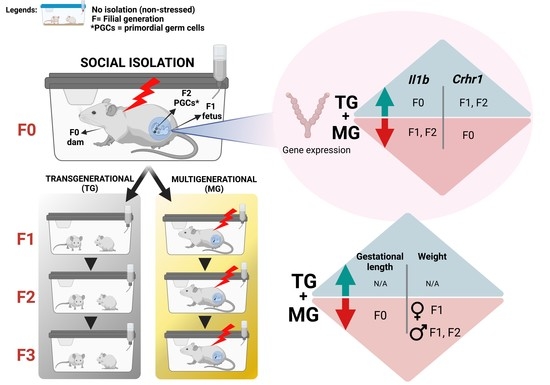
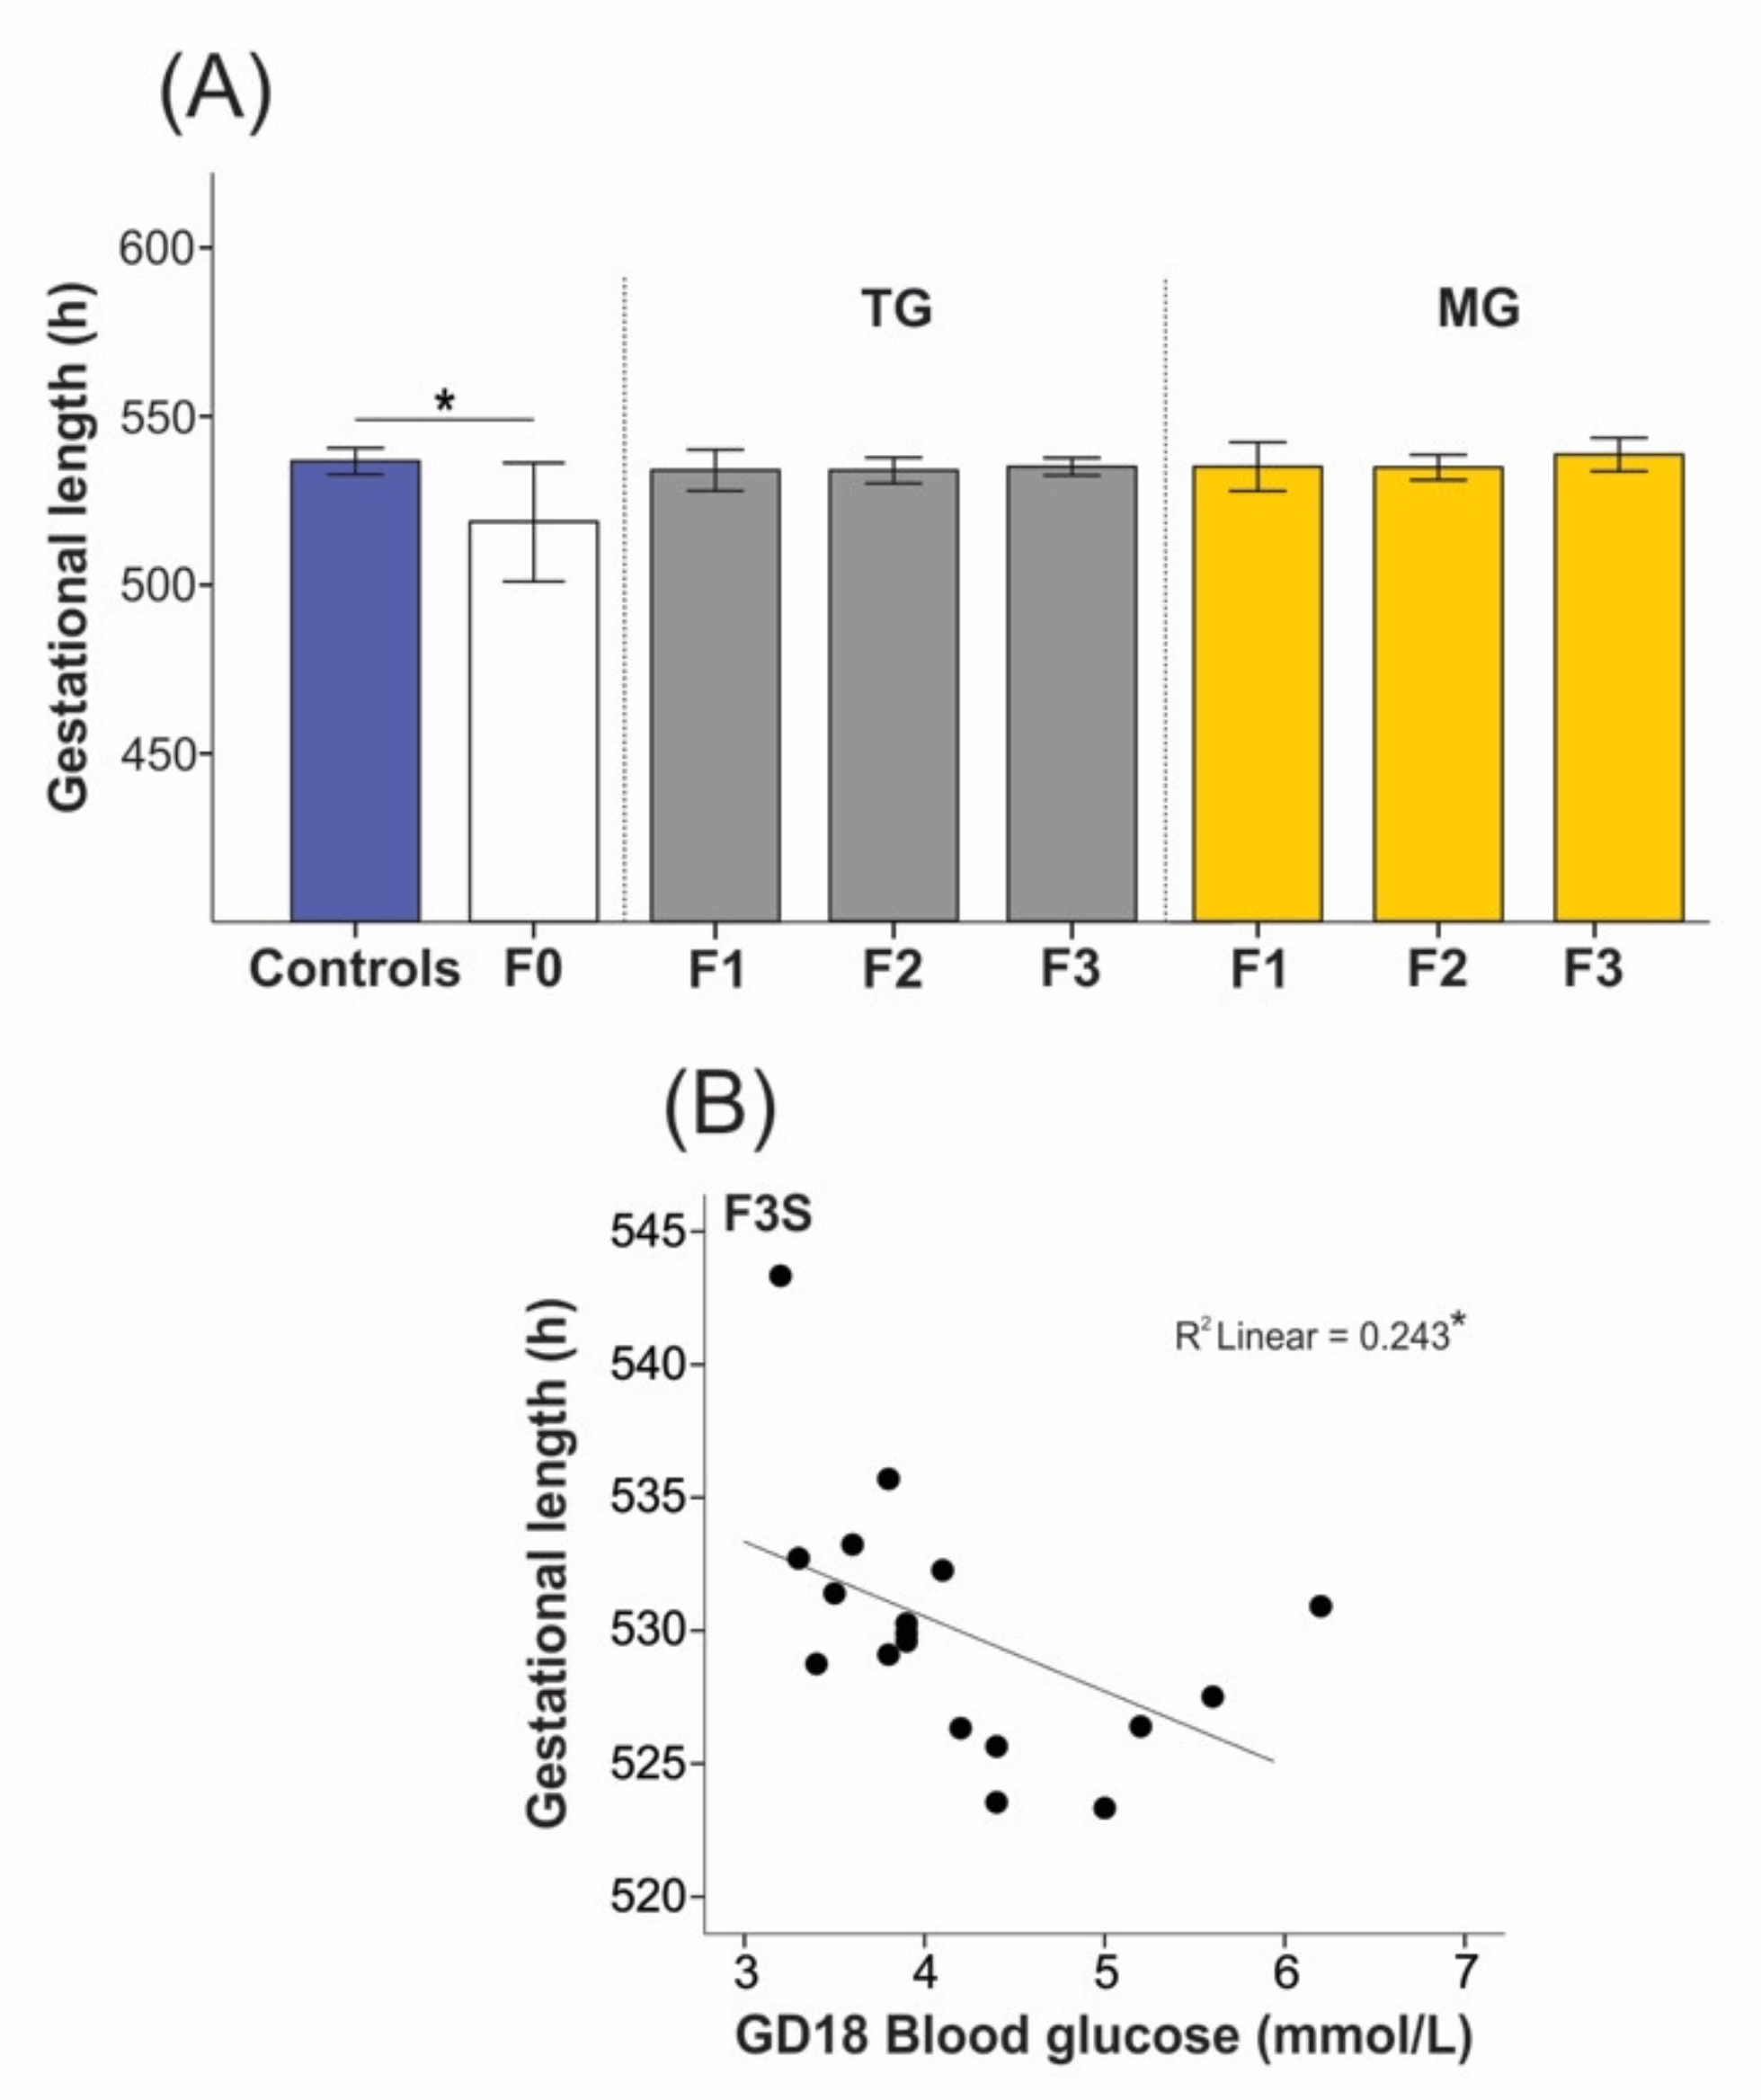
2.1. Social Isolation Stress Shortened Gestational Lengths in F0 Dams
2.2. Social Isolation Stress Moderately Impacted the Breeding of Dams
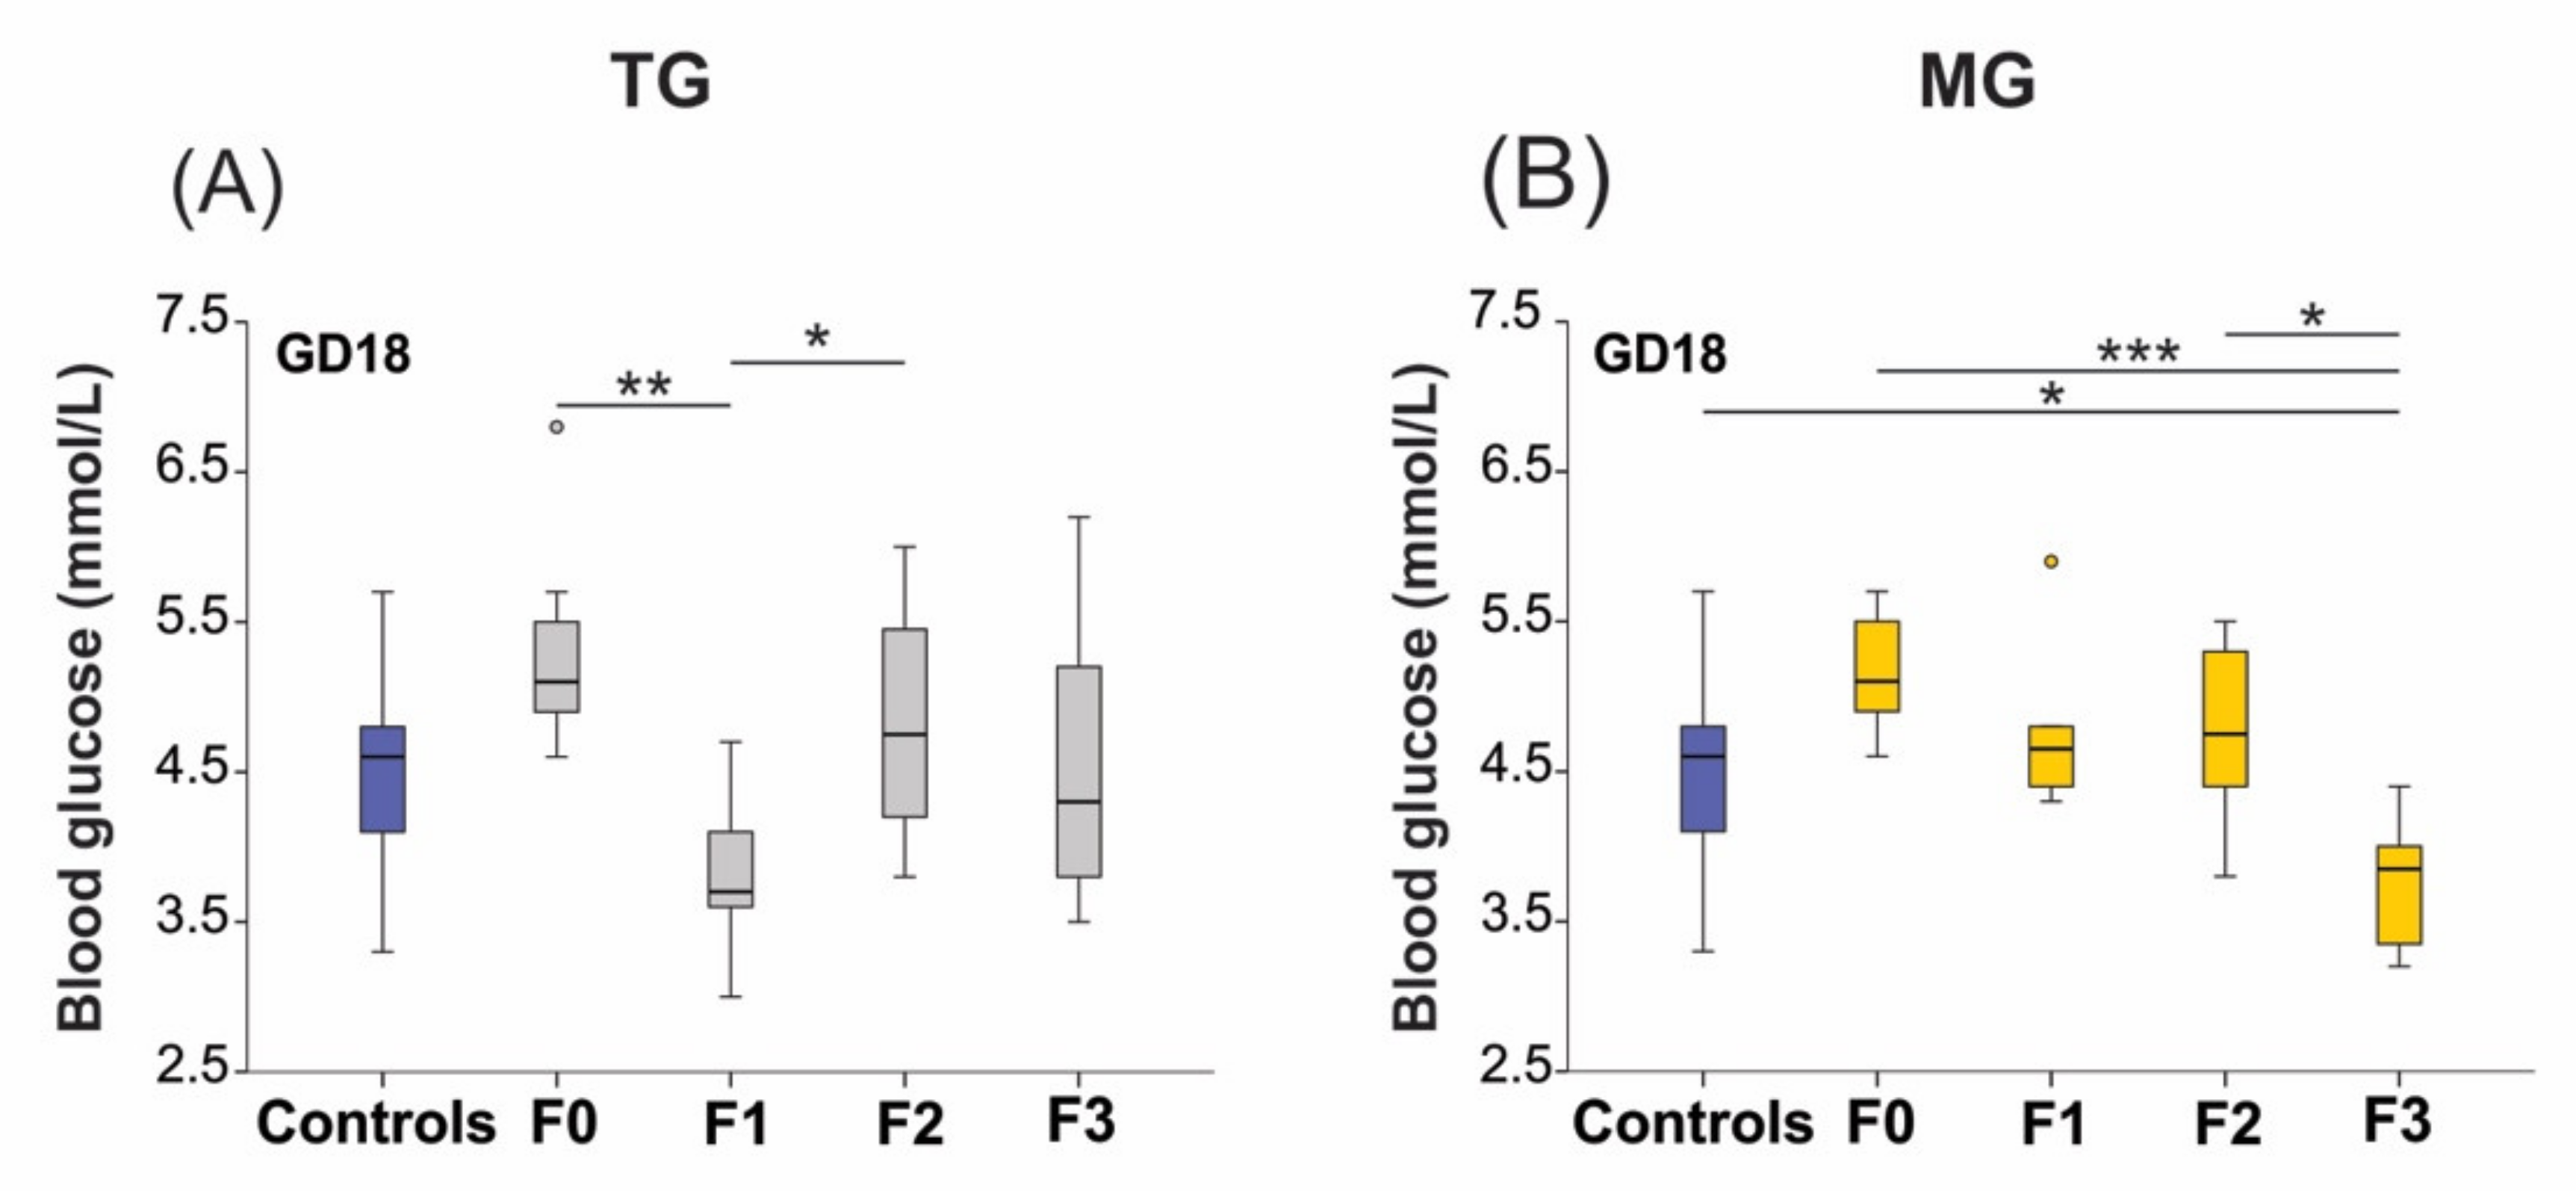
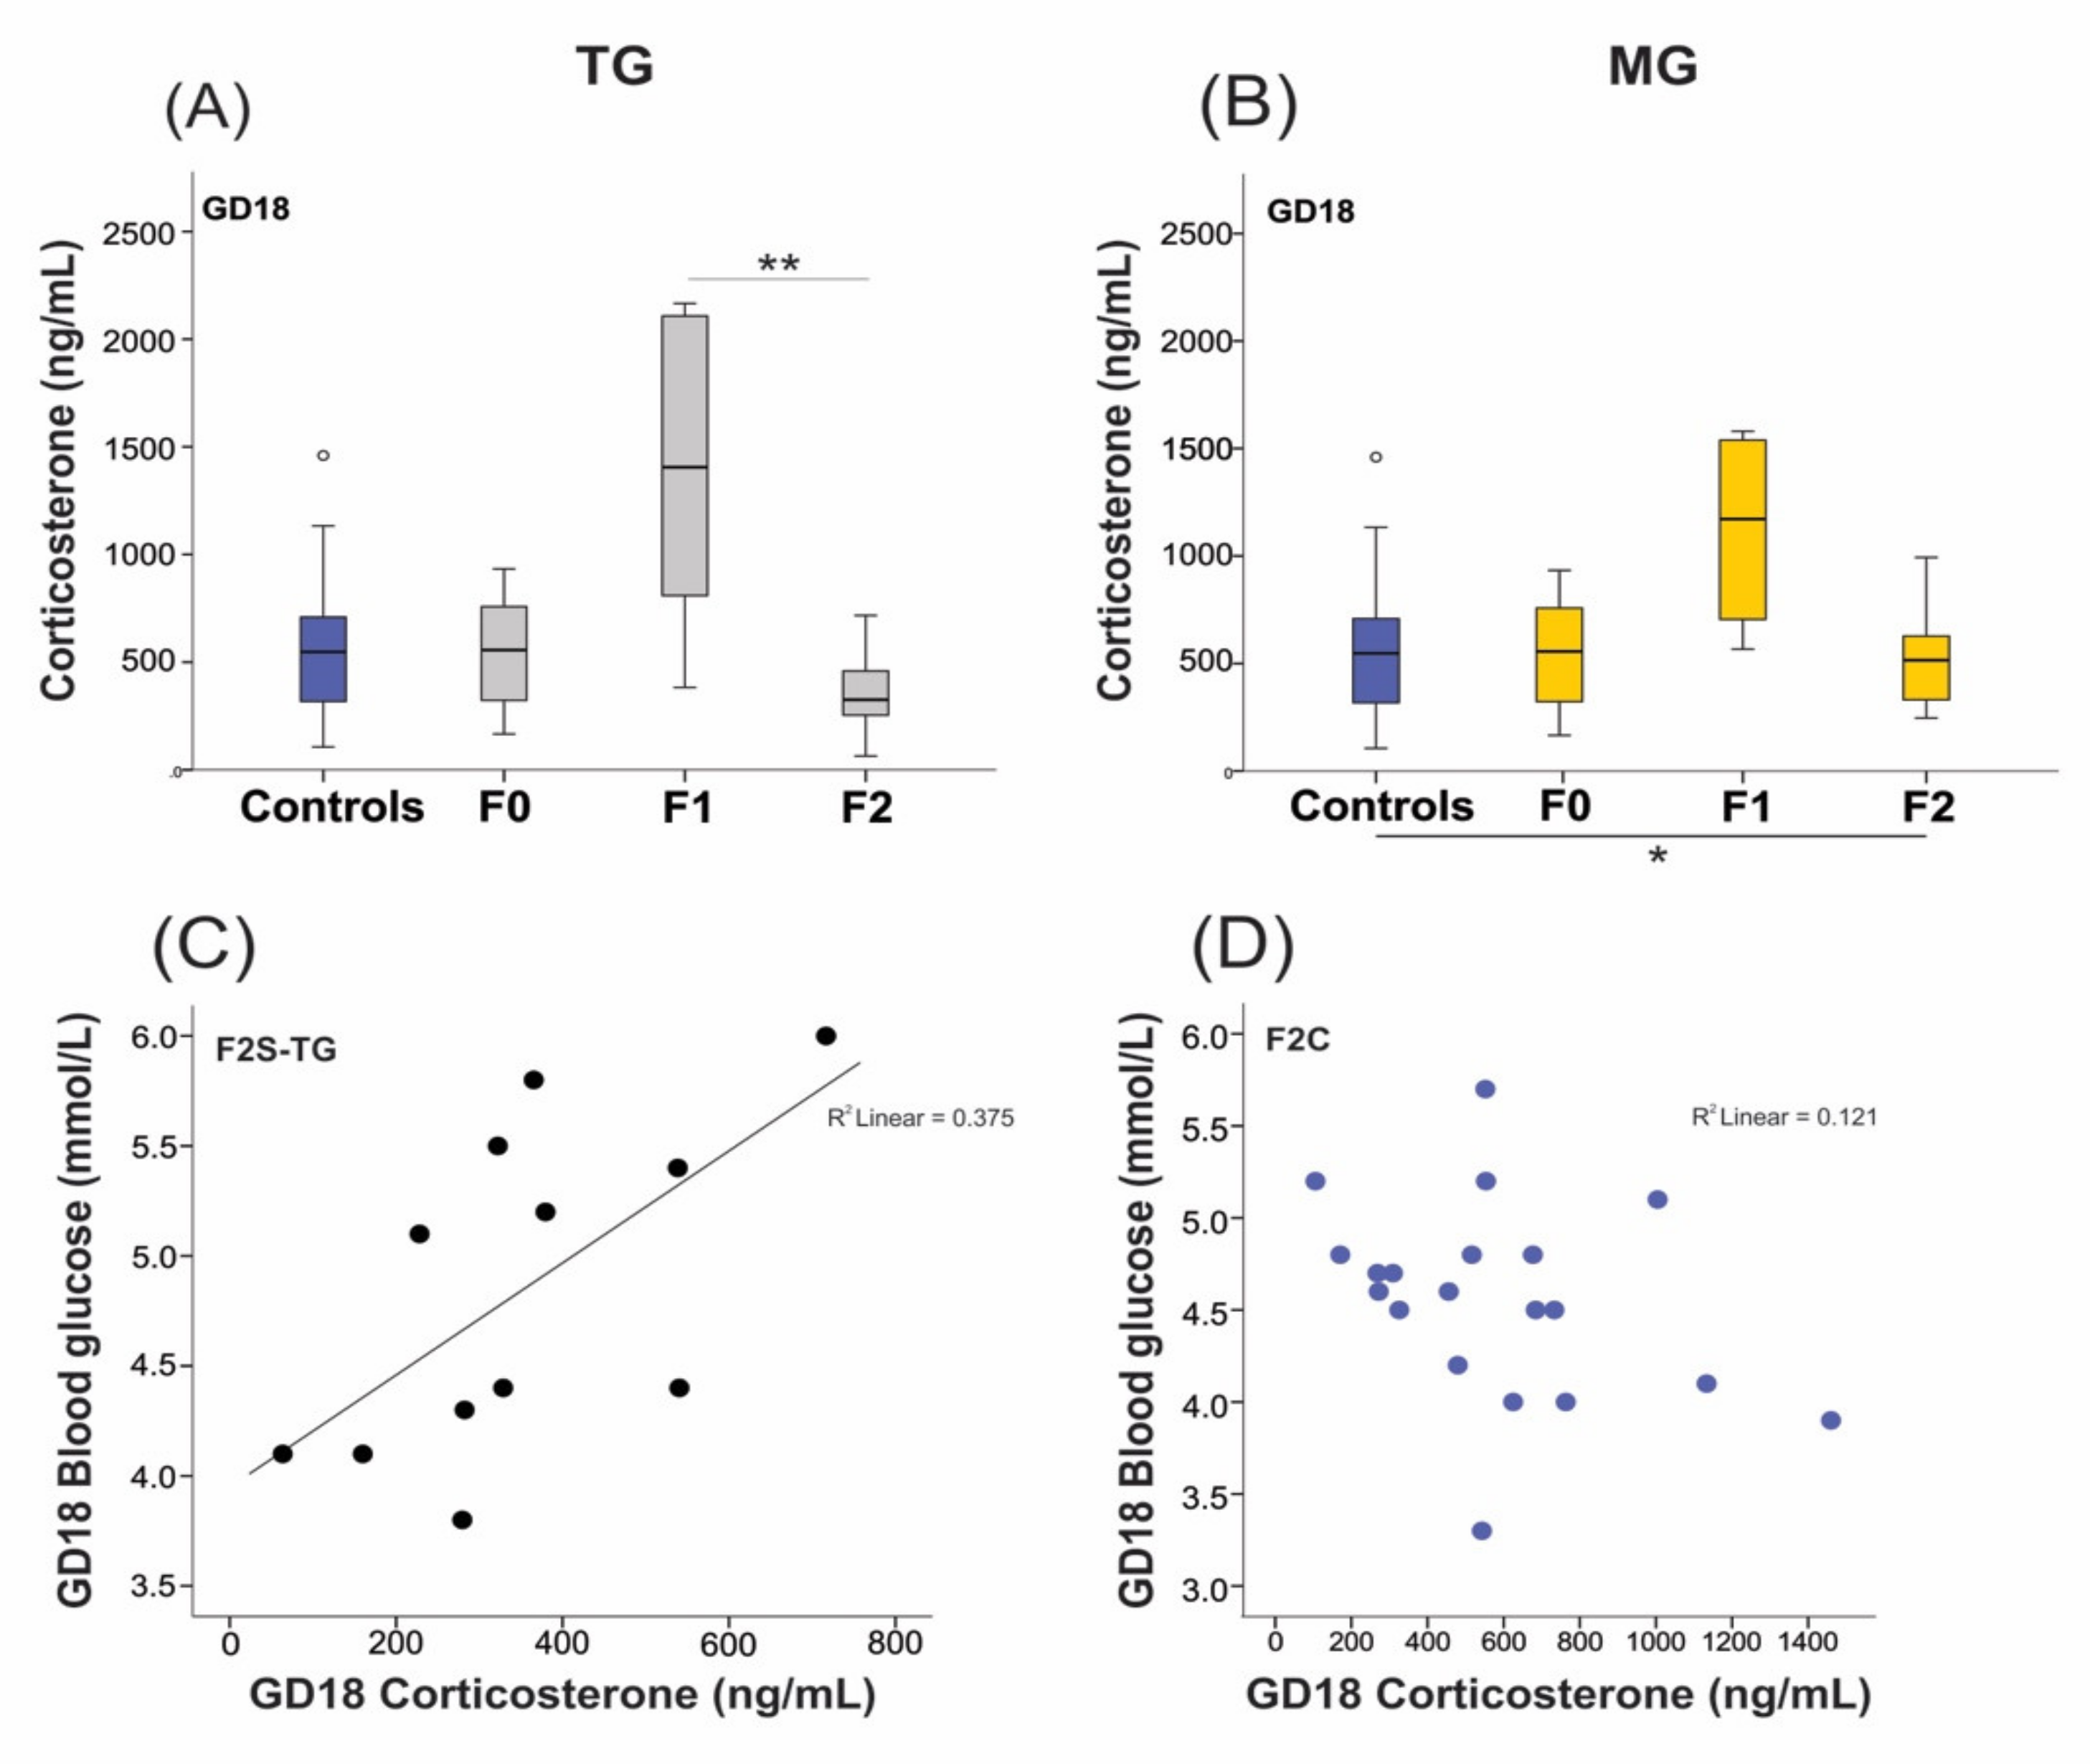
2.3. Blood Glucose Levels Were Reduced in the Offspring Exposed to Transgenerational or Multigenerational SIS
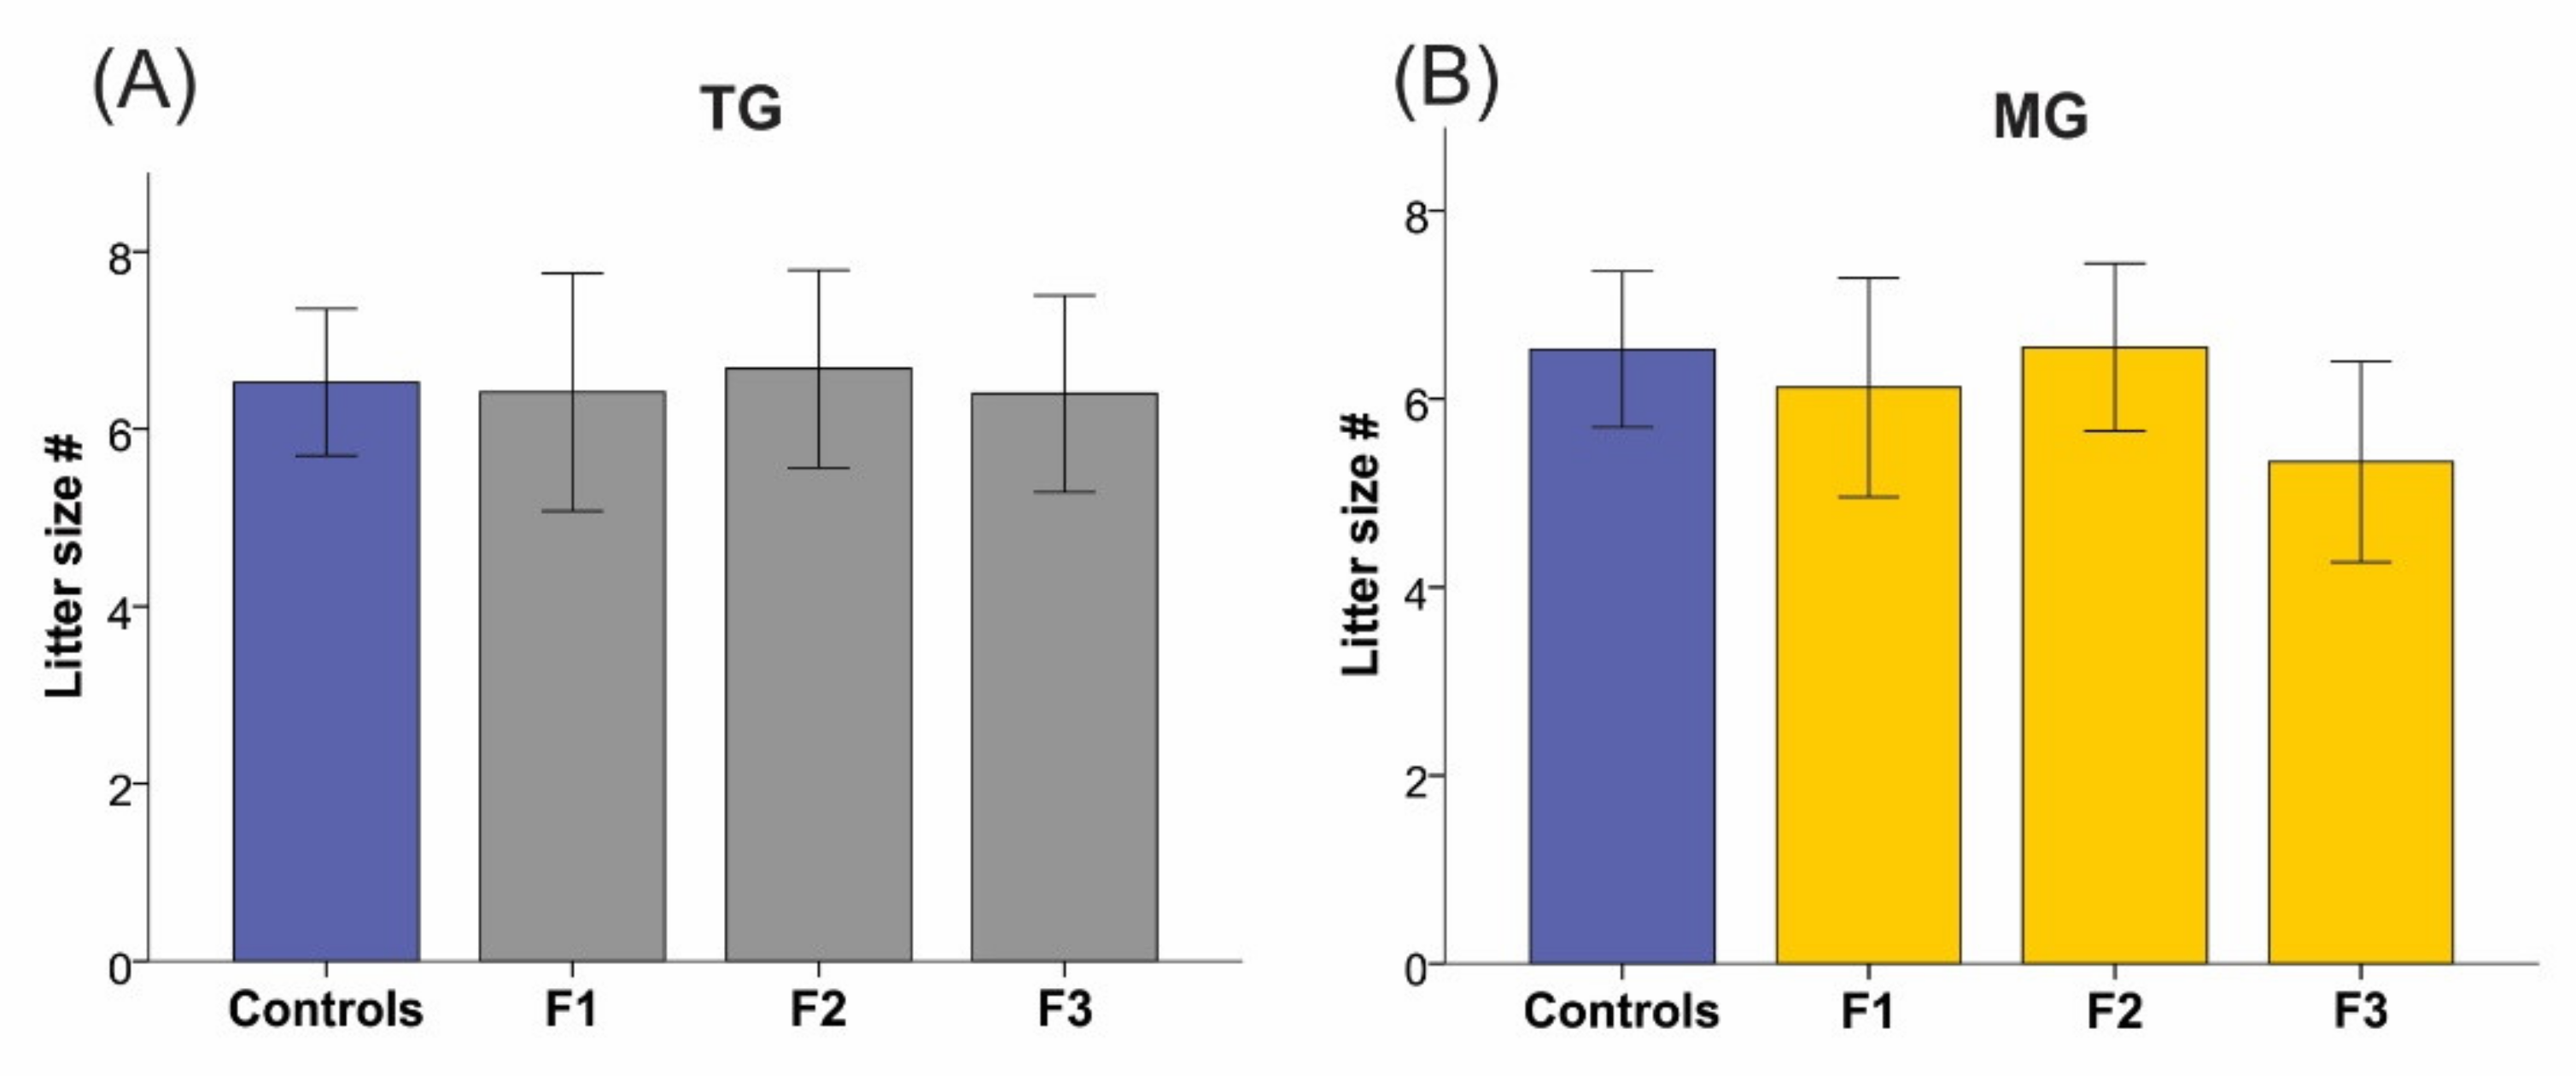
2.4. Maternal Weight and Litter Size Were Unchanged by TG and MG SIS
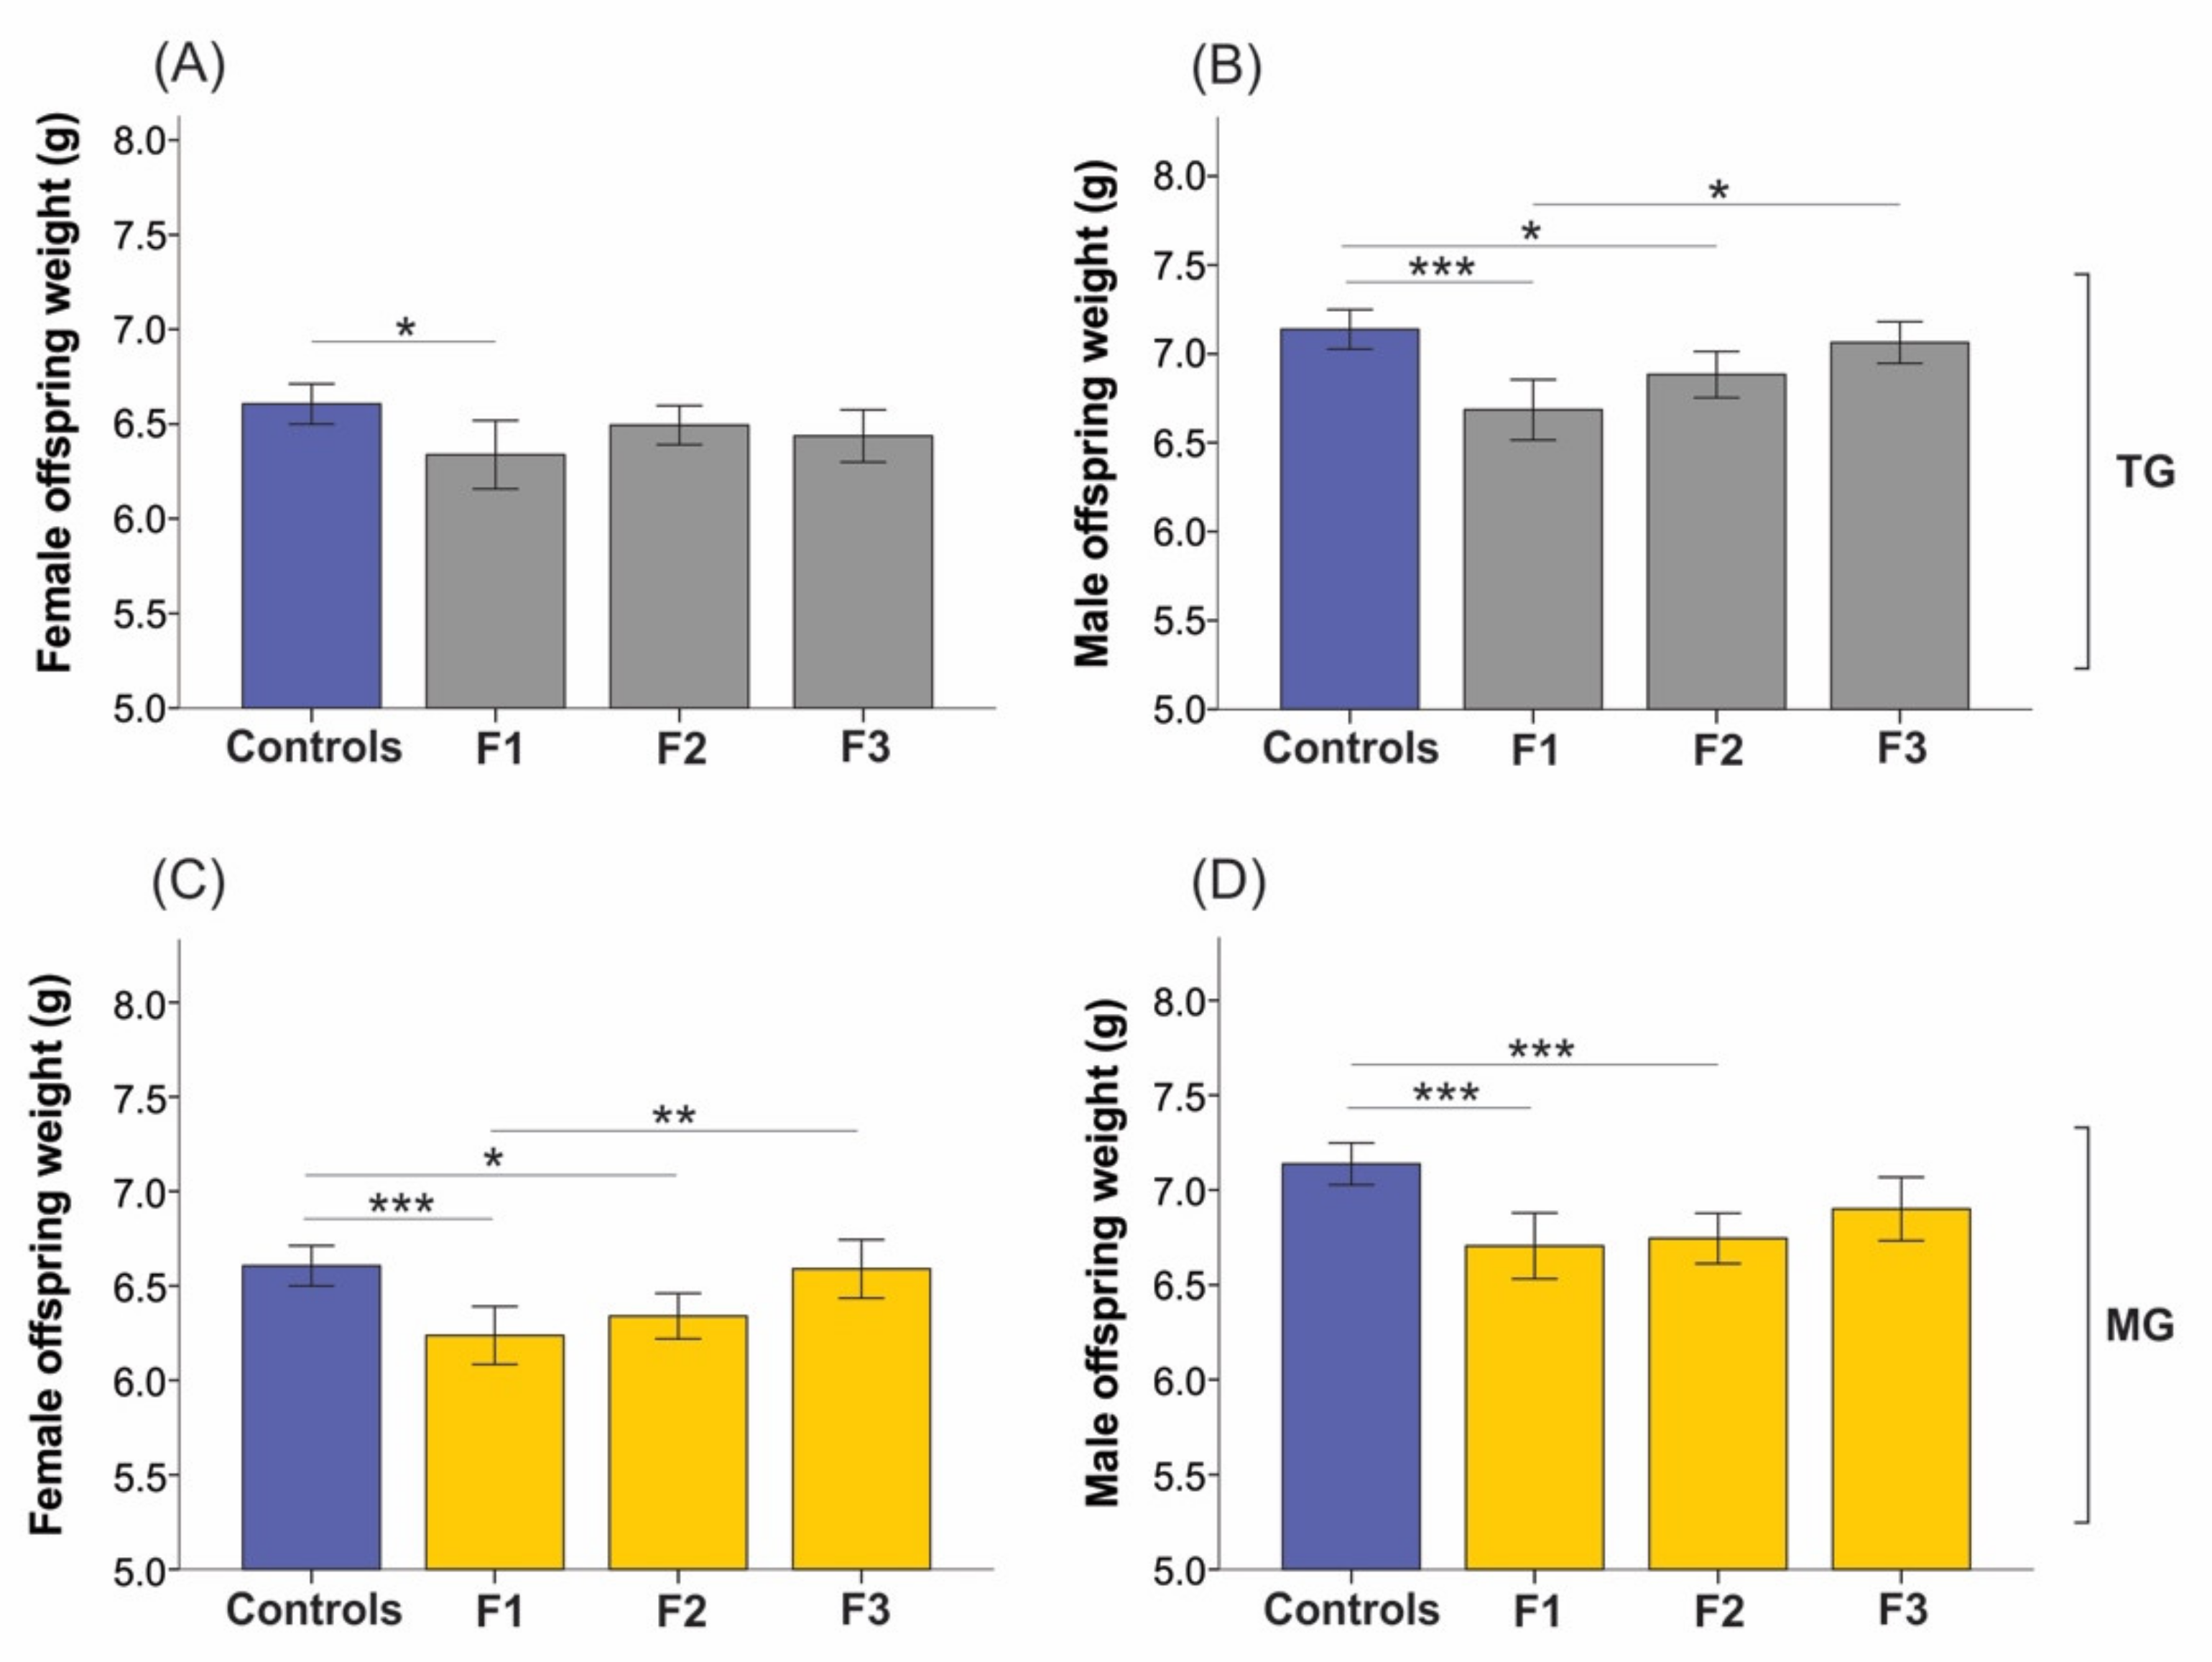
2.5. Neonatal Growth was Affected in Animals Exposed to SIS, While Plasma Levels of Corticosterone (CORT) Remained Unchanged in the Parental Generation
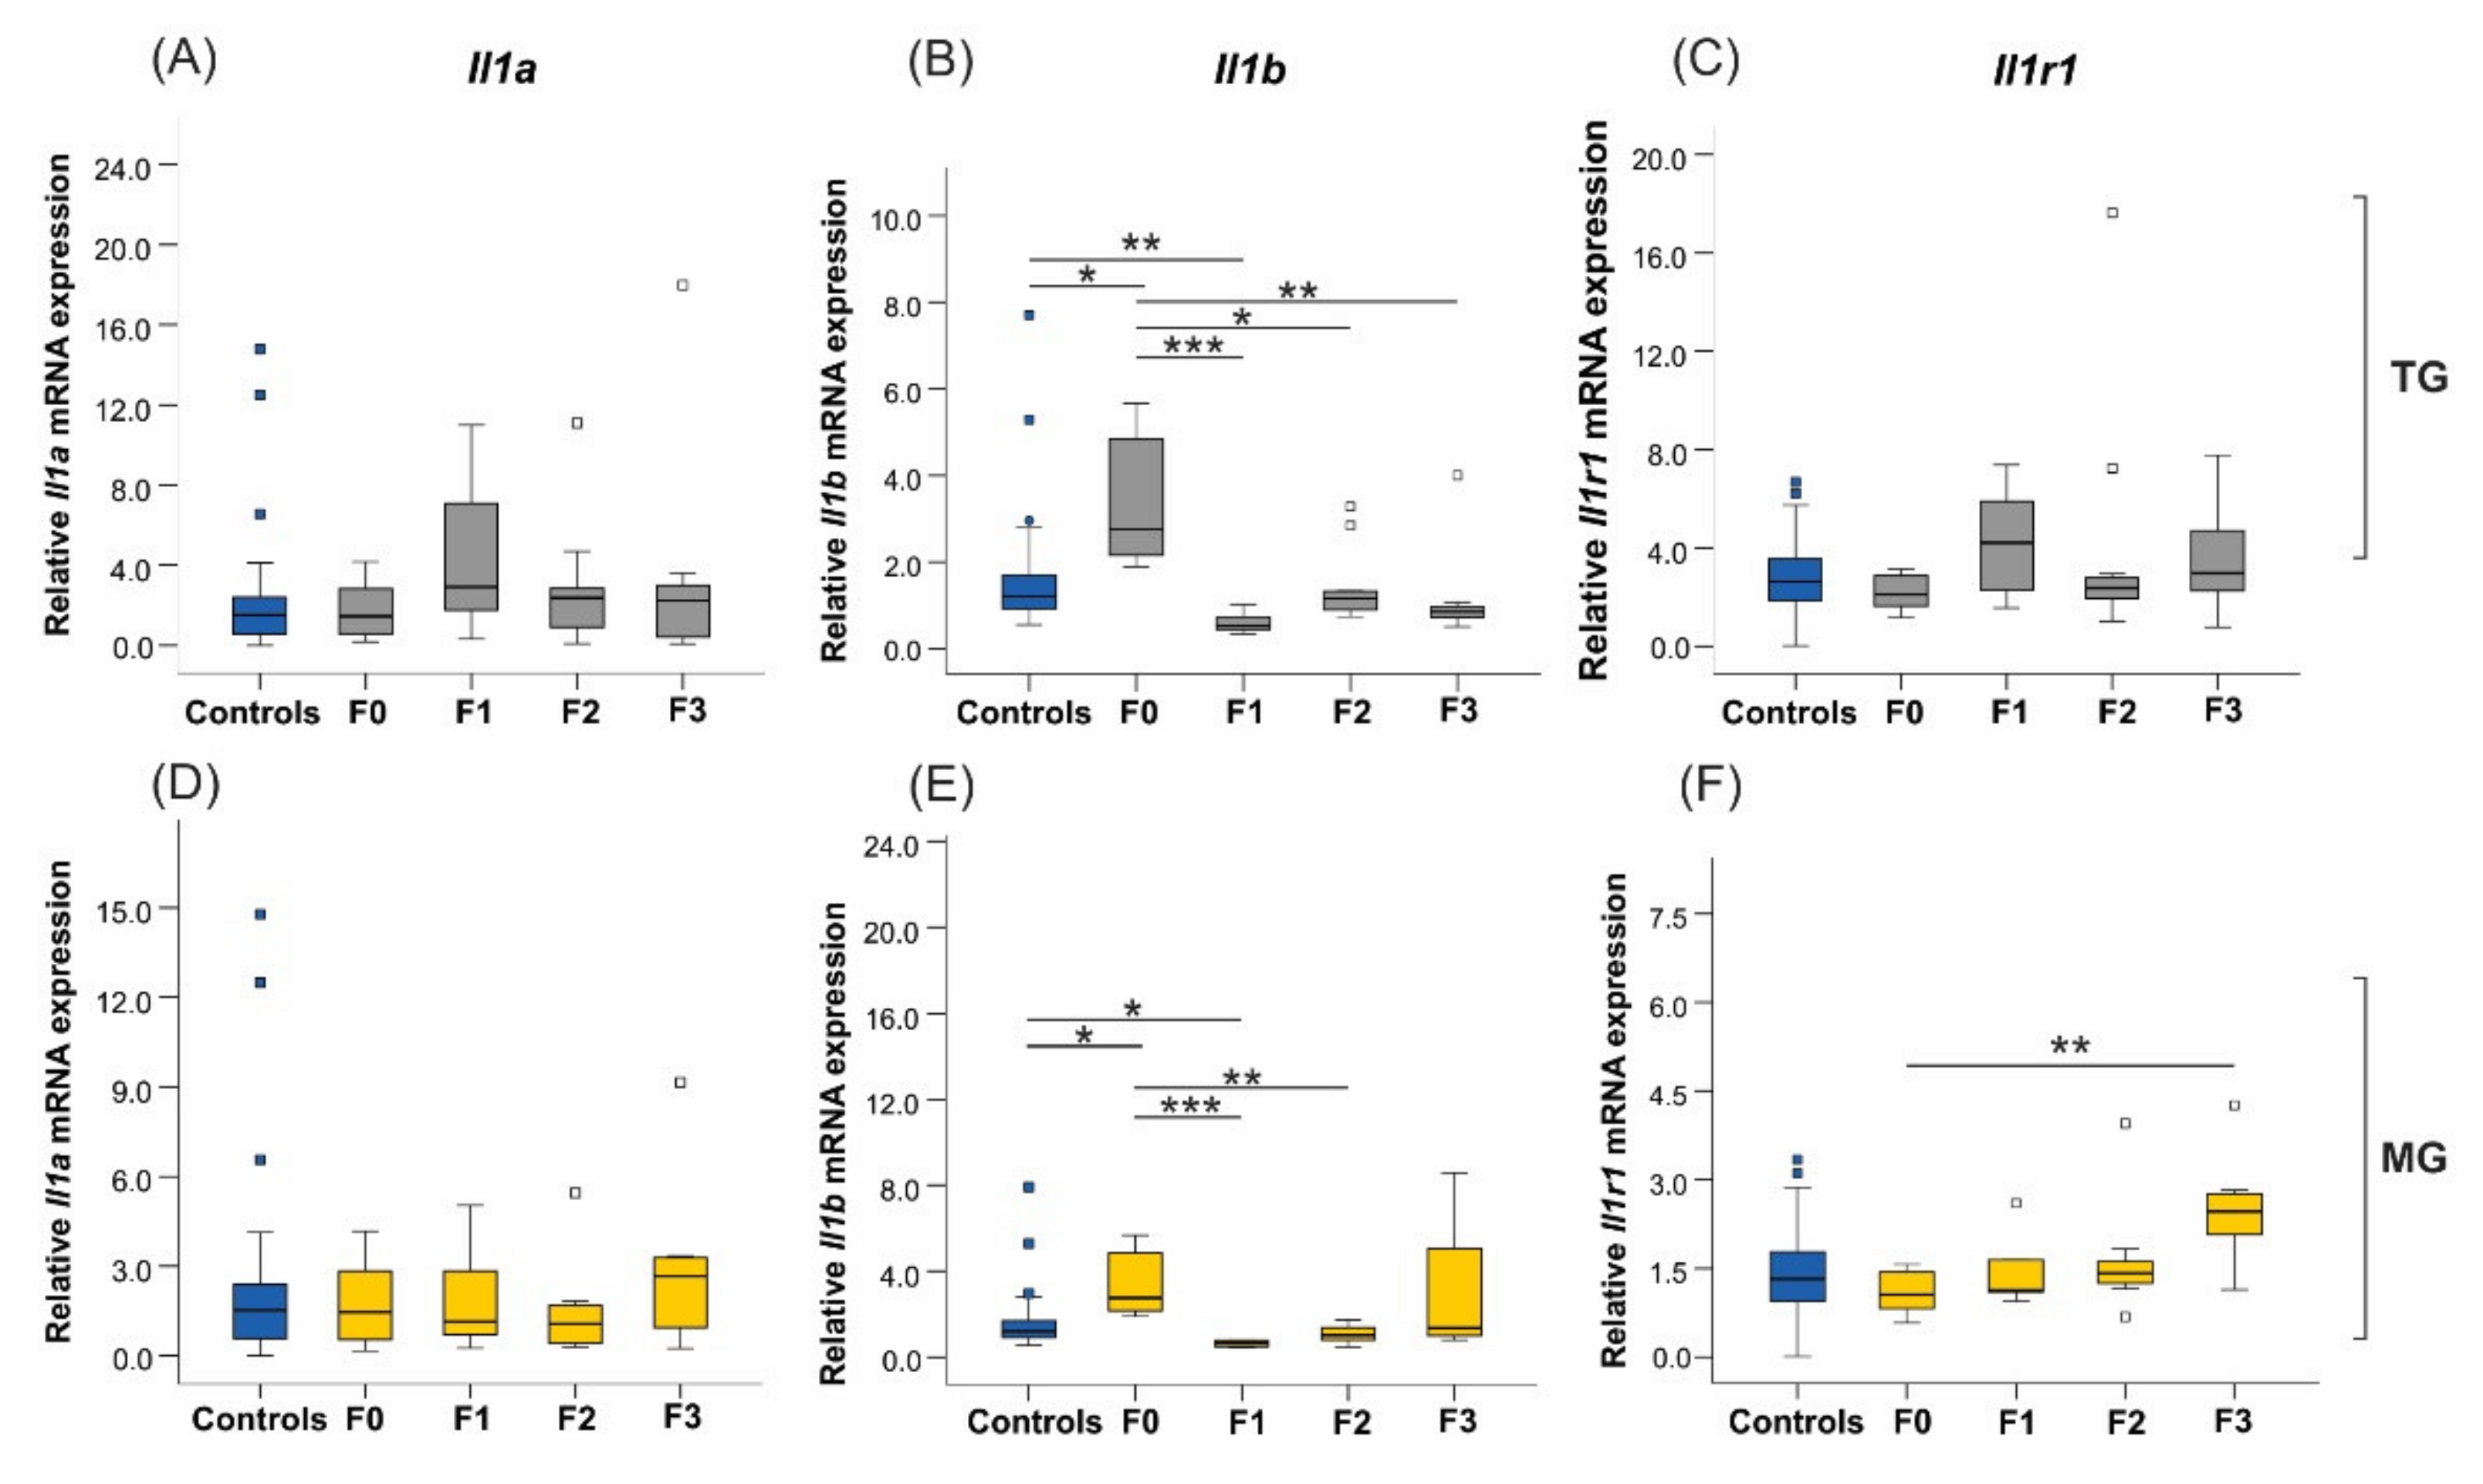
2.6. Uterine mRNA Expression of Inflammatory and Stress Response Genes Was Altered in Both SIS TG and MG in a Generation-Dependent Manner
2.6.1. Proinflammatory Cytokines and Their Receptors
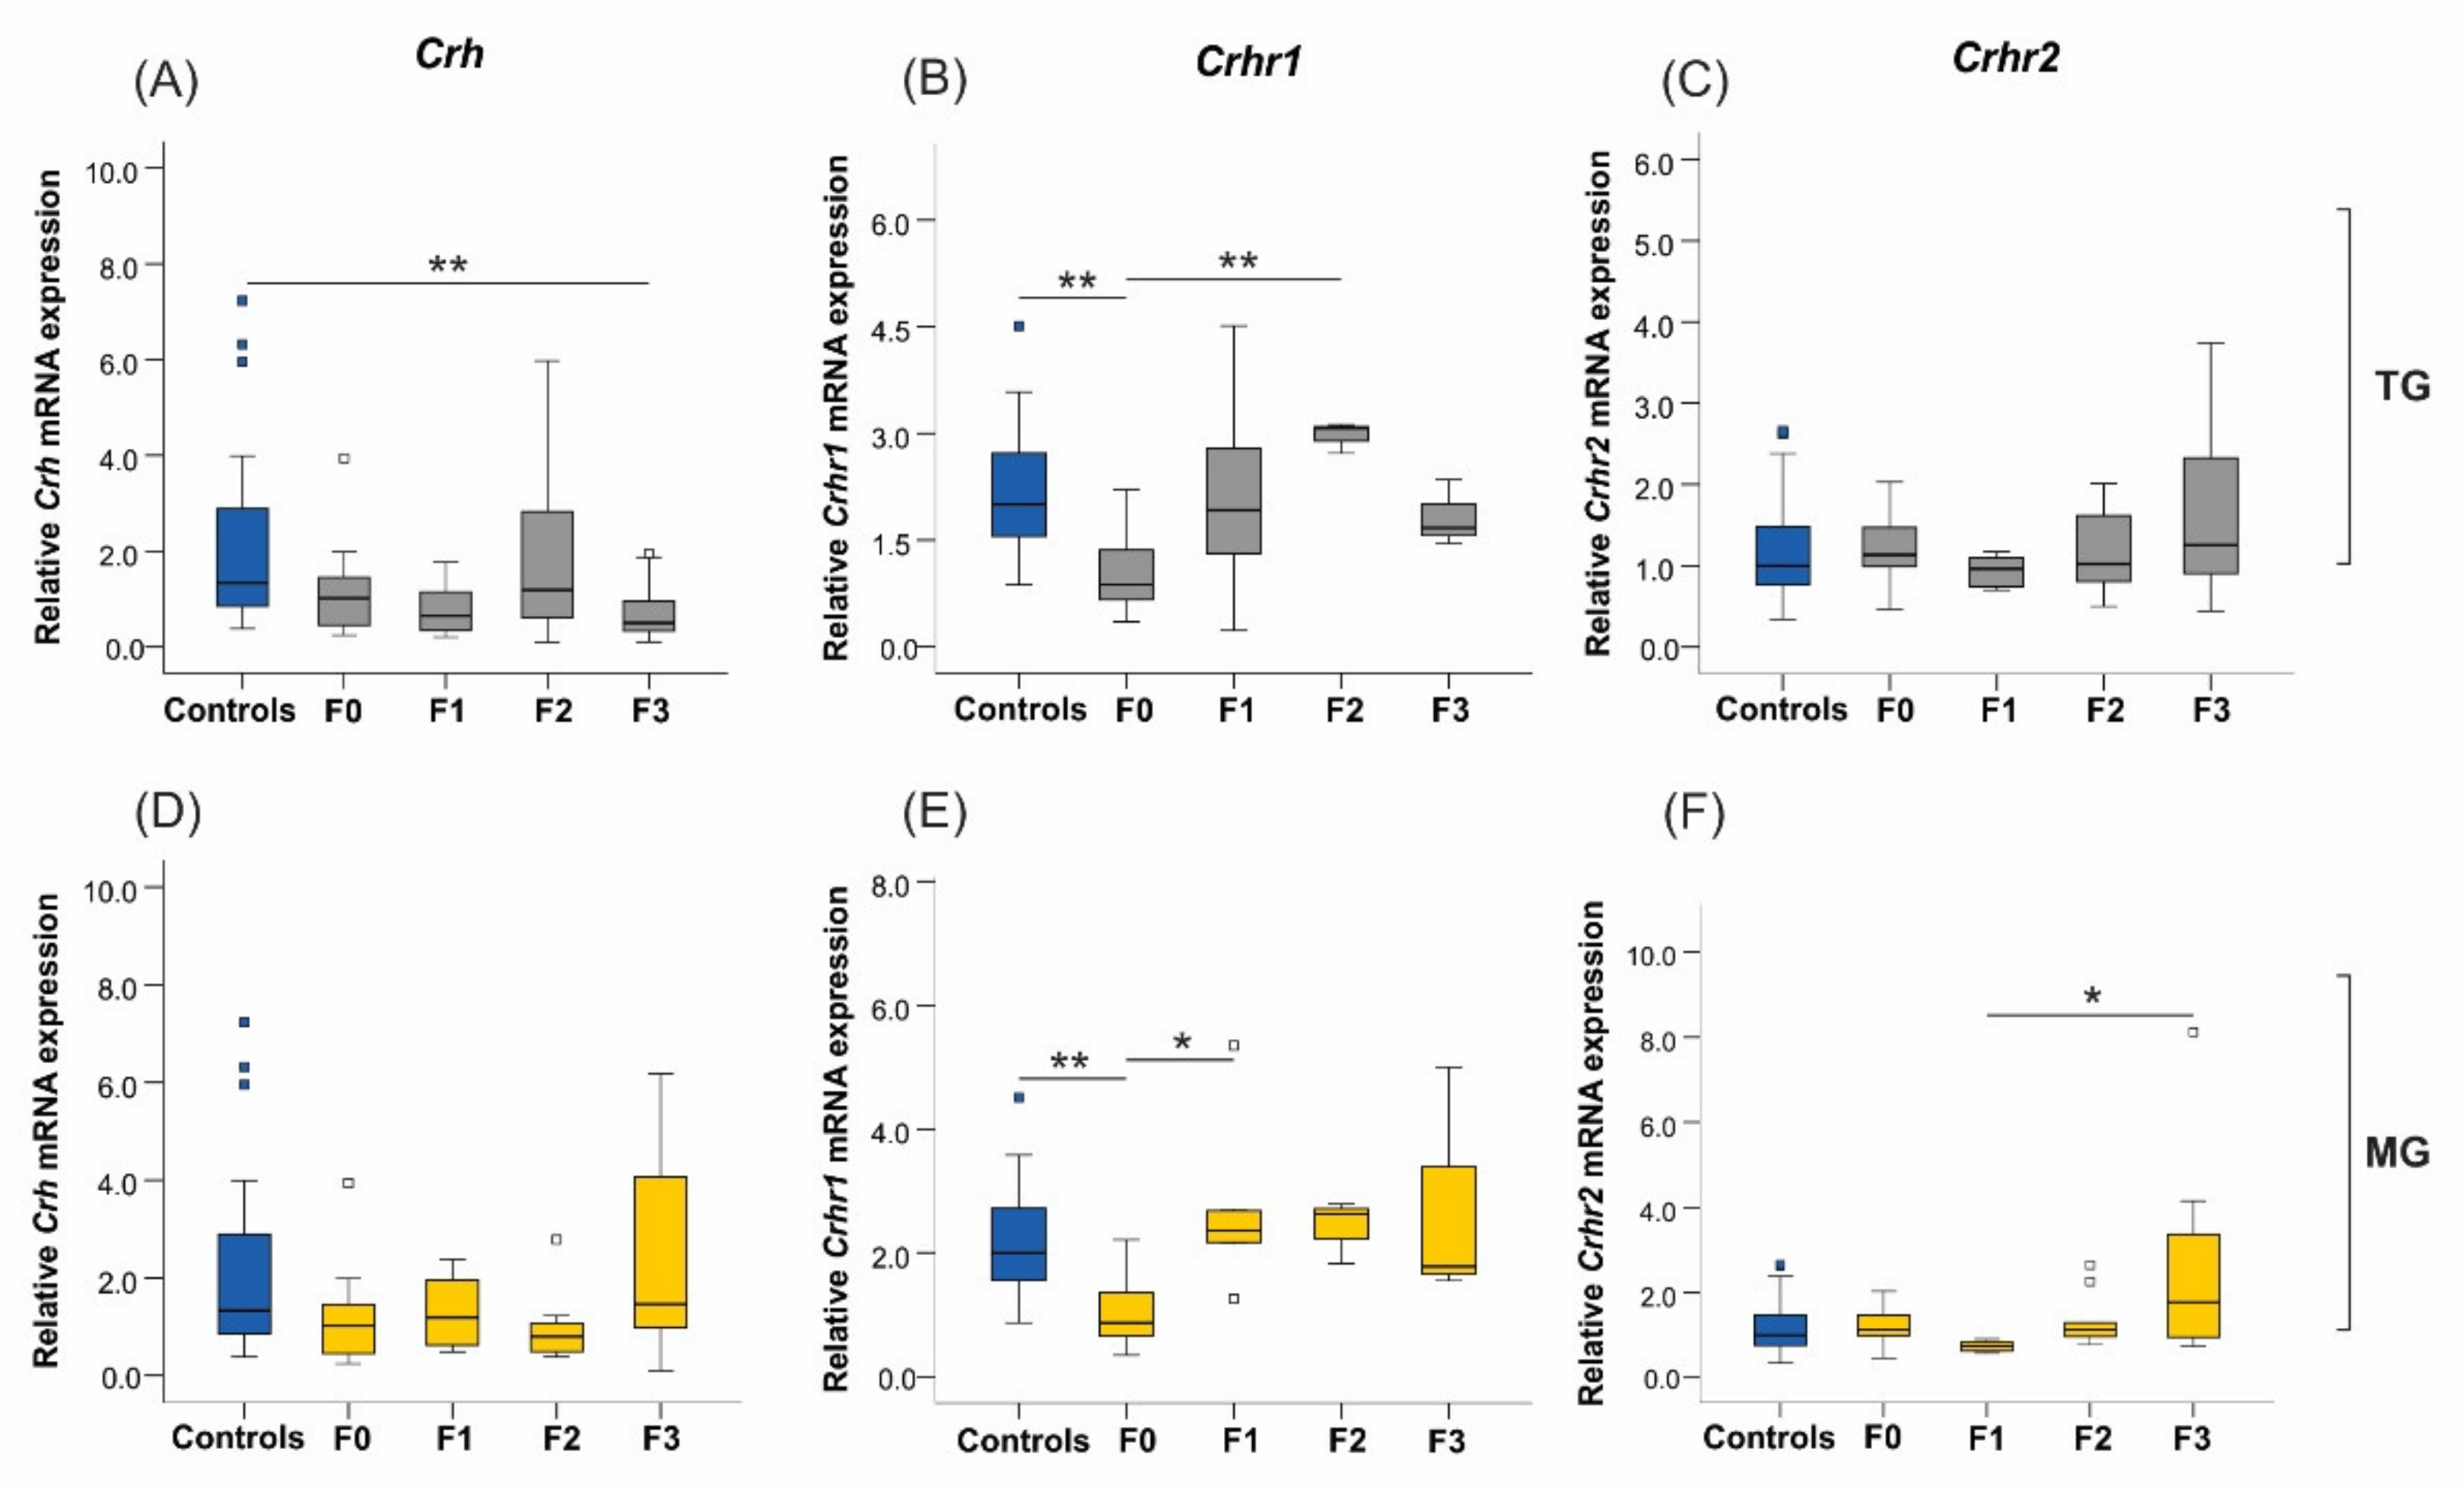
2.6.2. Corticotrophin-Releasing Hormone (Crh) and Its Receptors
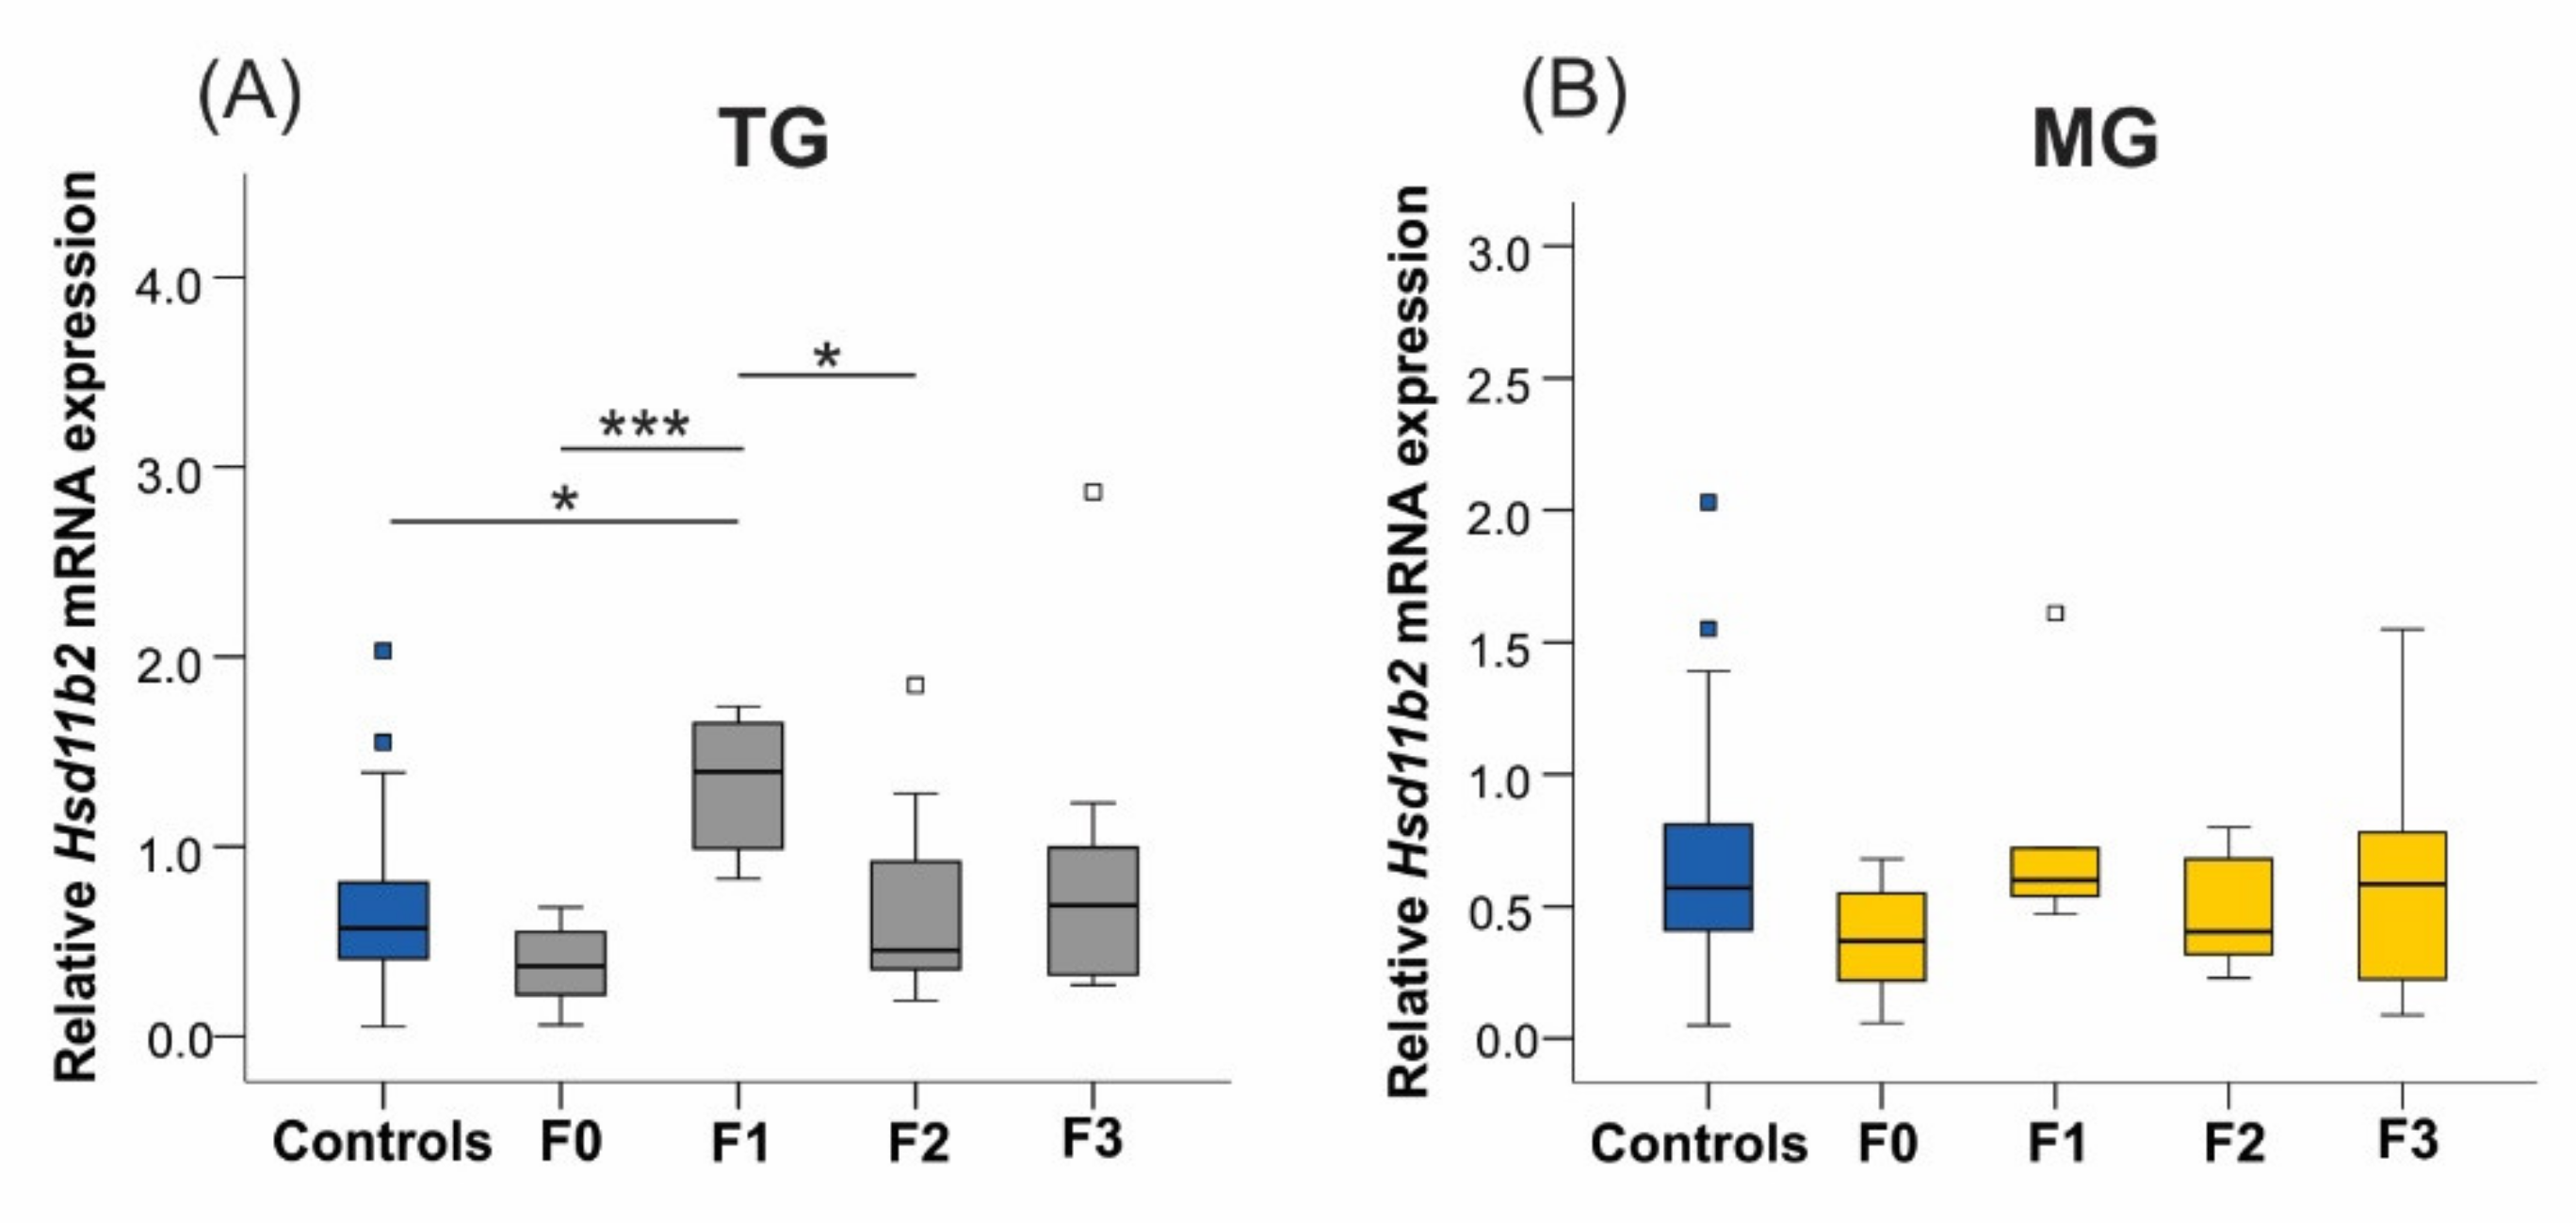
2.6.3. 11β-. Hydroxysteroid Dehydrogenase Type 2
2.7. Social Isolation Stress Reduces Protein Concentration of IL-1β in F1 Offspring Uteri of Exposed Mothers
3. Discussion
4. Materials and Methods
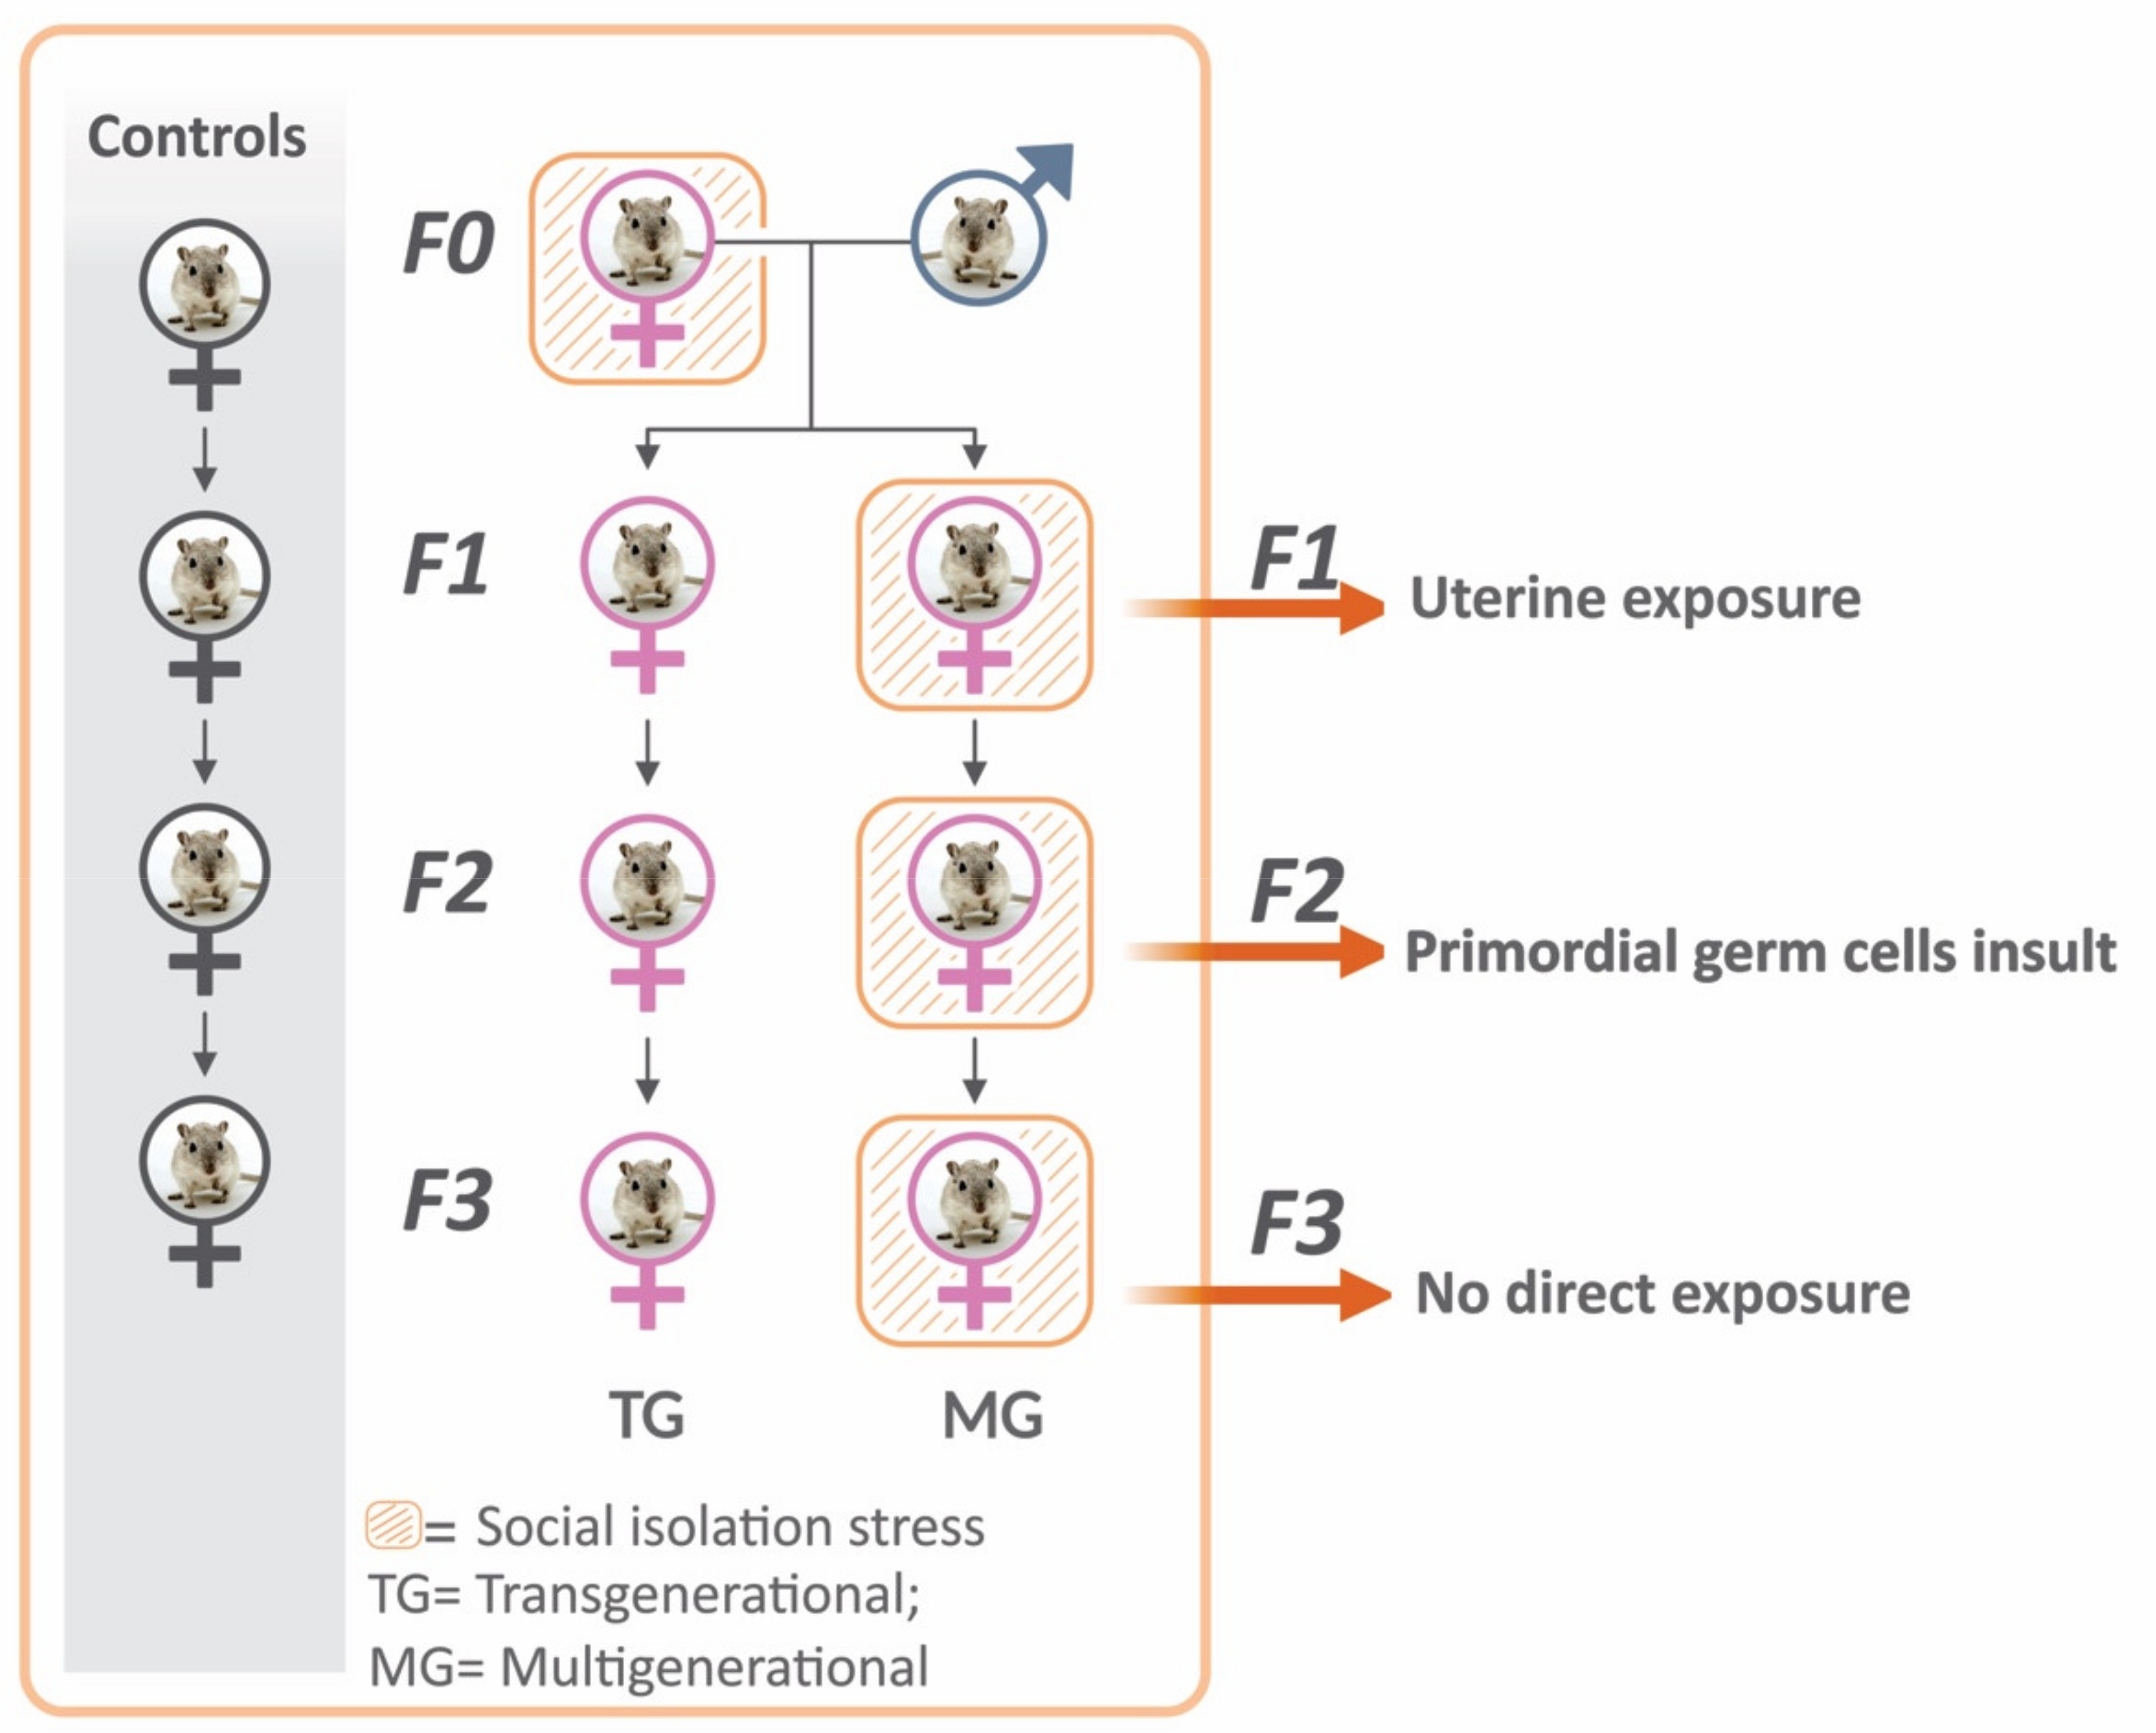
4.1. Animals and Experimental Design
4.2. Pre-Conceptional and Gestational Stress
4.3. Tissue Collection
4.3.1. Uteri
4.3.2. Blood Sample and Corticosterone Assay
4.4. Gene Expression
4.4.1. RNA Extraction
4.4.2. Quantitative Real-Time Polymerase Chain Reaction (RT–qPCR)
4.5. Luminex Cytokine Assays
4.6. Statistical Analyses
4.6.1. Descriptive Statistics
4.6.2. Biological Data
4.6.3. Molecular Data
Author Contributions
Funding
Institutional Review Board Statement
Informed Consent Statement
Data Availability Statement
Acknowledgments
Conflicts of Interest
Abbreviations
| SIS | social isolation stress |
| PNMS | prenatal maternal stress |
| AL | allostatic load |
| HPA | hypothalamic-pituitary-adrenal axis |
| GCs | glucocorticoids |
| CORT | corticosterone |
| PTB | preterm birth |
| LBW | low birth weight |
| TG | transgenerational |
| MG | multigenerational |
| IL1-β | interleukin-1β |
| IL-1α | interleukin-1α |
| IL1-R1 | interleukin-1 receptor 1 |
| IL-6 | interleukin-6 |
| CRH | Corticotrophin-releasing hormone |
| CRHR1 | corticotrophin-releasing hormone receptor 1 |
| CRHR2 | corticotrophin-releasing hormone receptor 2 |
| HSD11β1 | 11β-hydroxysteroid dehydrogenase type 1 |
| HSD11β2 | 11β-hydroxysteroid dehydrogenase type 2 |
| TNF-α | tumour necrosis factor α |
| LD | lactational day |
| GD | gestational day |
| P | postnatal day |
| F | filial |
| RT-qPCR | quantitative real-time polymerase chain reaction |
| Ct | threshold cycles |
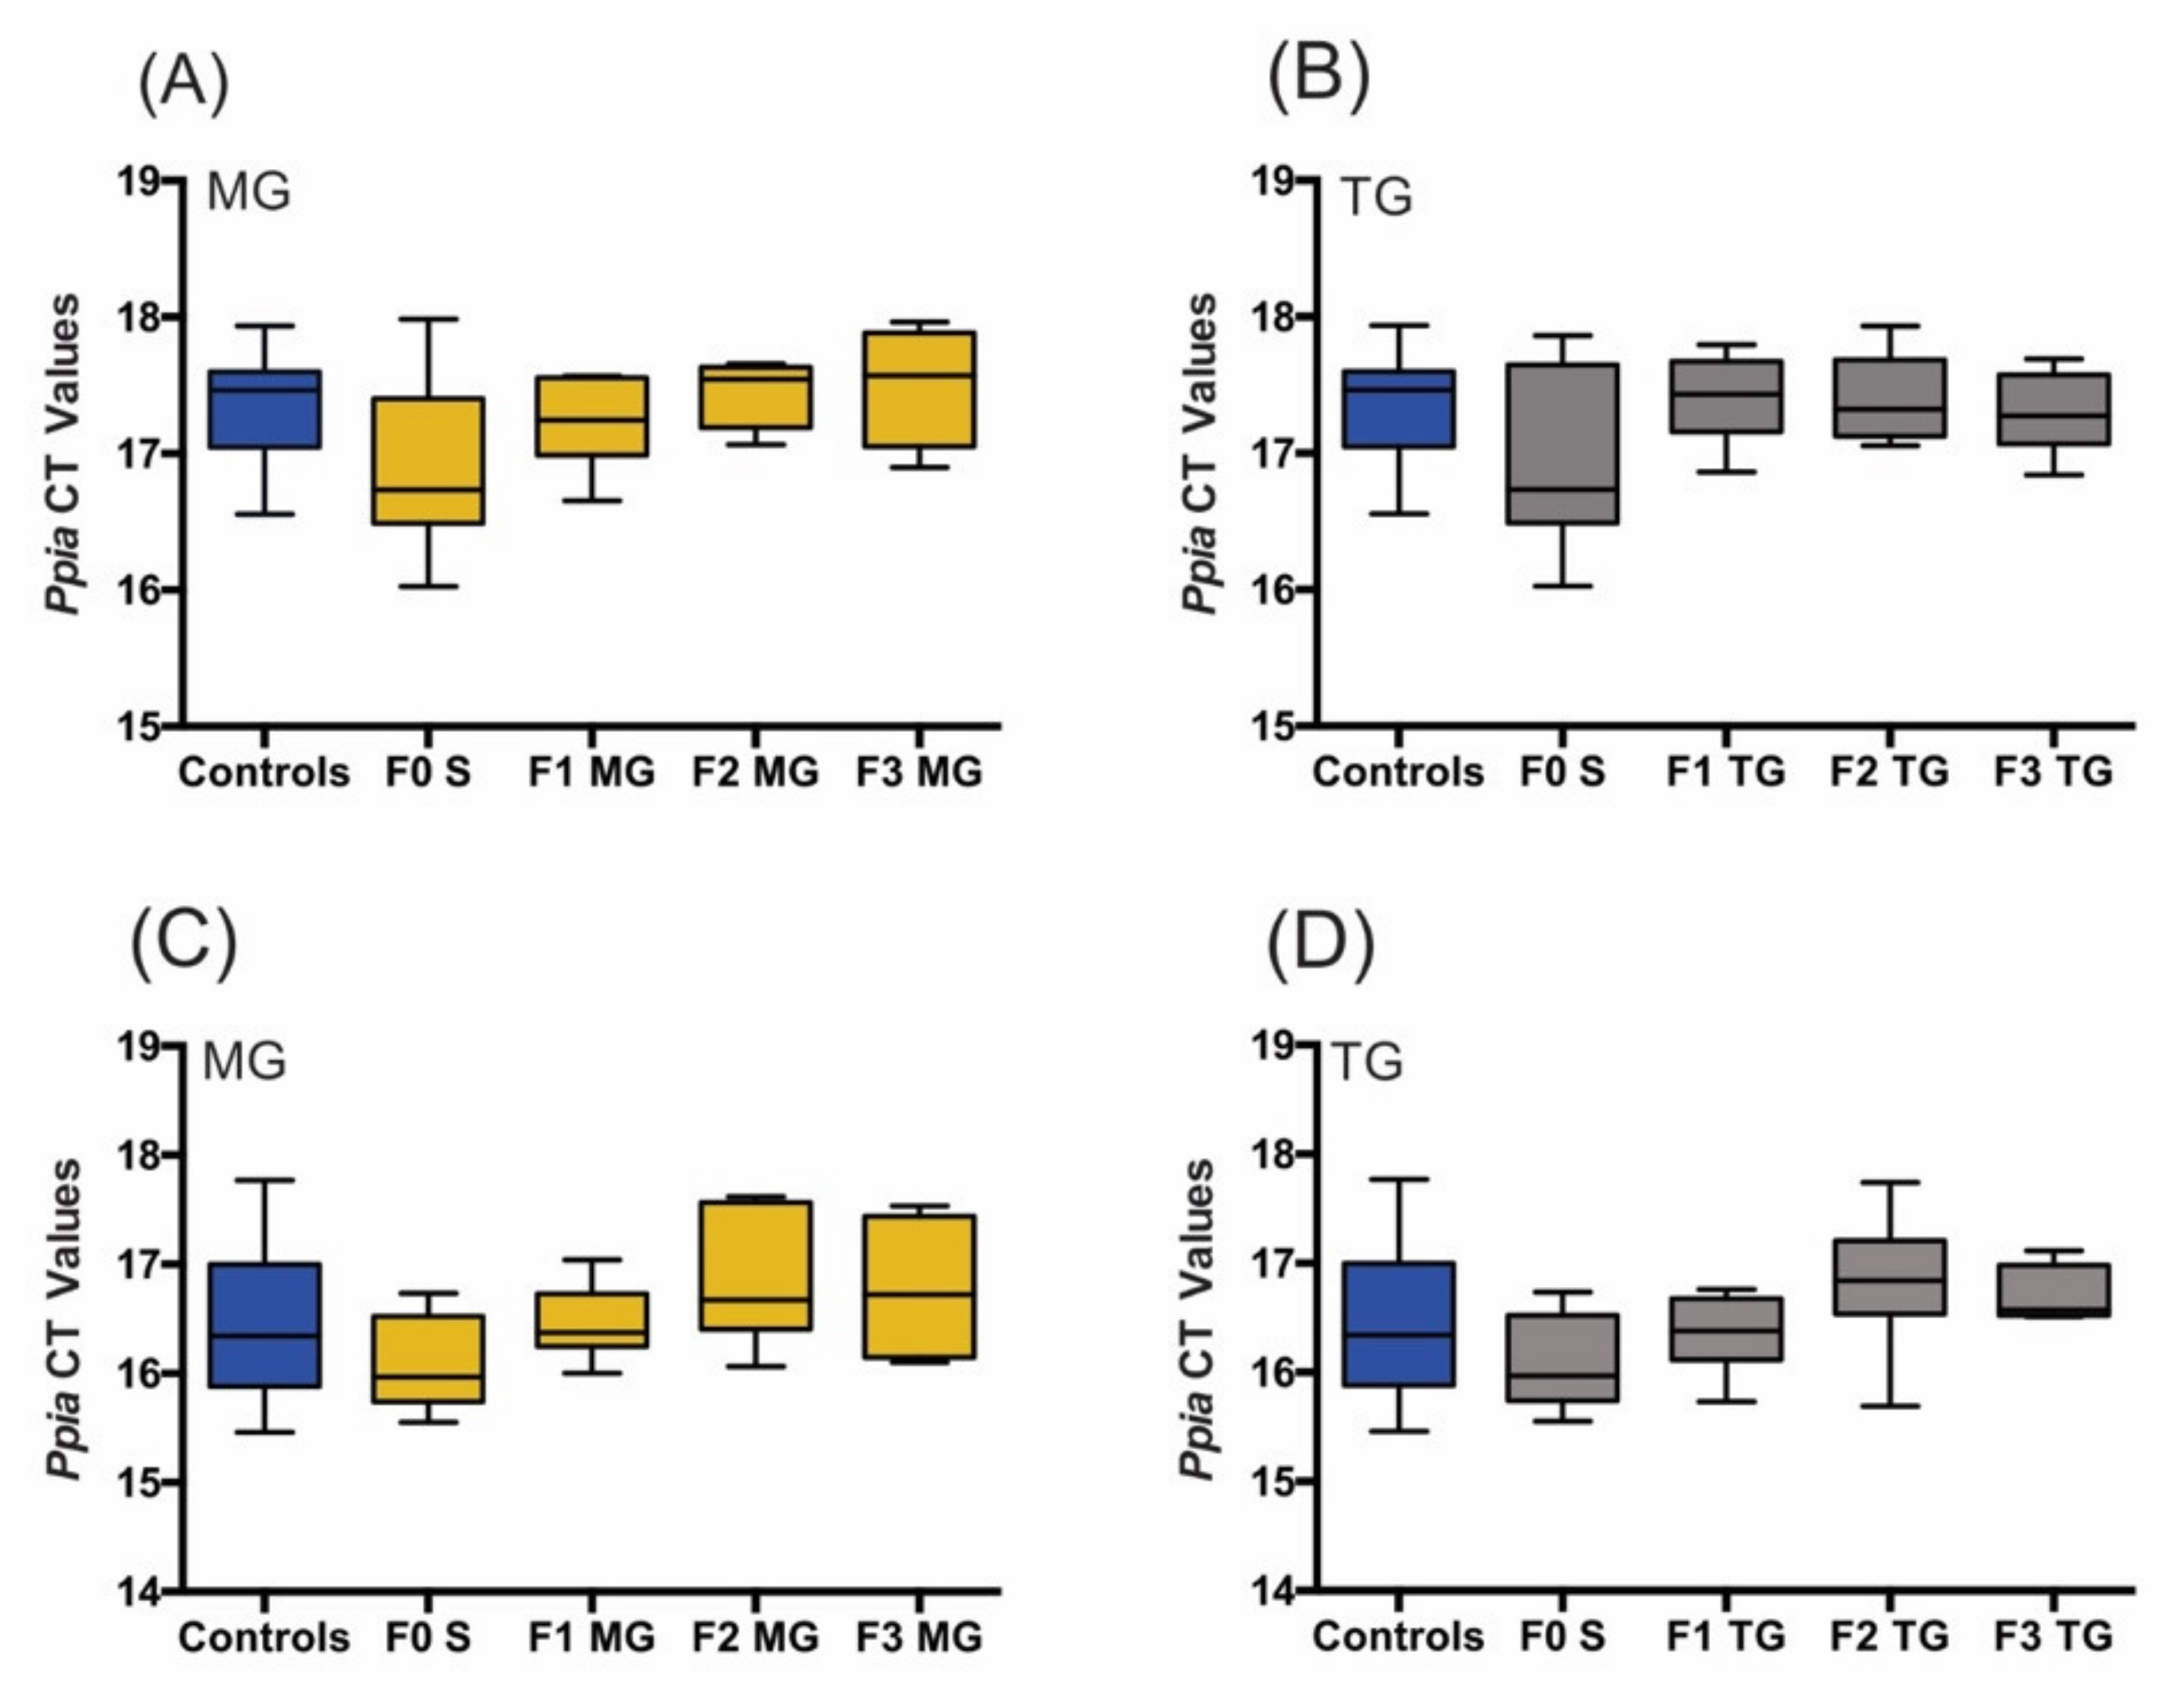
| Ppia | cyclophilin A |
| SD | standard deviations |
| SEM | standard error of the mean |
| ANOVA | analysis of variance |
Appendix A

| Outcome | Generations | Stress Model | |||
|---|---|---|---|---|---|
| F0 | F1 | F2 | F3 | ||
| Gestational length (h) | ▼ | ns | ns | N/A | SIS |
| ns | ▼ TG, MG | ▼ TG, MG | N/A | Single-hit | |
| Increased variation in gestational length | N/A | - | - | Two-hit | |
| Maternal weight (g) | ns | ns | ns | ns | SIS |
| ▼GD21 | ▼ MG | ▼ MG | N/A | Single-hit | |
| ▼ GD11-18 | N/A | - | - | Two-hit | |
| Pup weight (g) on P1 | N/A | ▼ TG, MG♂ ♀ | ▼ MG♀/TG, MG♂ | ▲ MG♀/TG♂ | SIS |
| N/A | ns | ns | ▼ TG, MG | Single-hit | |
| N/A | ▼ two-hit♂ ♀ | - | - | Two-hit | |
| Blood glucose (mmol/L) on GD18 | ns | ▼ TG | ns | ▼ MG | SIS |
| ns | ns | ▲MG | ns | Single-hit | |
| ns | ns | - | - | Two-hit | |
| CORT (ng/mL) | ns | ▲ TG, MG | ns | - | SIS |
| ns | ns | ▲MG | ns | Single-hit | |
| ns | ns | - | - | Two-hit | |
| Adverse health outcomes | Moderate disinterest in breeding | SIS | |||
| - | Single-hit | ||||
| Resorption, preterm, and post-term delivery | Two-hit | ||||
| Gene Expression | Generations | Stress Model | |||
|---|---|---|---|---|---|
| F0 | F1 | F2 | F3 | ||
| Il1a | ns | ns | ns | ns | SIS |
| ns | ▼ two-hit | - | - | Two-hit | |
| Il1b | ▲ TG, MG | ▼ TG, MG | ▼ TG, MG | ▼ TG | SIS |
| ▲ two-hit | ns | - | - | Two-hit | |
| Il1r1 | ns | ns | ns | ▲MG | SIS |
| ns | ns | - | - | Two-hit | |
| Crh | ns | ns | ns | ▼ MG | SIS |
| ▲ two-hit | ▼ two-hit | - | - | Two-hit | |
| Crhr1 | ▼ TG, MG | ▲MG | ▲TG | ns | SIS |
| ▲ two-hit | ▼ two-hit | - | - | Two-hit | |
| Crhr2 | ns | ns | ns | ▲MG | SIS |
| ns | trend to ▼ two-hit | - | - | Two-hit | |
| Hsd11b2 | ns | ▲TG | ns | ns | SIS |
| ns | ns | - | - | Two-hit | |
| Target Gene | Forward Primer (5′ → 3′) | Reverse Primer (5′ → 3′) | Annealing Temperature (°C) | NCBI Reference Sequences * |
|---|---|---|---|---|
| Ppia (Cyclophilin A) | CAC CGT GTT CTT CGA CAT CAC | CCA GTG CTC AGA GCT CGA AAG | 60 | NM_017101.1 |
| Crh | ATCTCACCTTCCACCTTCTG | GTGTGCTAAATGCAGAATCG | 60 | NM_031019.1 |
| Crhr1 | GGTGACAGCCGCCTACAATT | AAGGTACACCCCAGCCAA | 60 | NM_030999.4 |
| Crhr2 | TGGTGCATACCCTGCCCTAT | GTGGAGGCTCGCAGTTTTGT | 60 | NM_022714.1 |
| Hsd11b1 | GAAGAAGCATGGAGGTCAAC | GCAATCAGAGGTTGGGTCAT | 60 | NM_017080.2 |
| Hsd11b2 | CGTCACTCAAGGGGACGTAT | AGGGGTATGGCATGTCTCC | 55 | NM_017081.2 |
| Il1a | AAGACAAGCCTGTGTTGCTGAAGG | TCCCAGAAGAAAATGAGGTCGGTC | 55 | NM_017019.1 |
| Il1b | CTCAATGGACAGAACATAAGCC | GGTGTGCCGTCTTTCATCA | 51 | NM_031512.2 |
| Il1r1 | CCTGTGATTATGAGCCCACG | CGTGTGCAGTCTCCAGAATATG | 58 | NM_013123.3 |
| Il6 | TCCTACCCCAACTTCCAATGCTC | TTGGATGGTXTTGGTCCTTAGCC | 65 | NM_012589.2 |
| (A) | Transgenerational Group | |||||||||||||||||||||||||||||
|---|---|---|---|---|---|---|---|---|---|---|---|---|---|---|---|---|---|---|---|---|---|---|---|---|---|---|---|---|---|---|
| Control | F0 | F1 | F2 | F3 | ||||||||||||||||||||||||||
| Total N | Mean | SD | SEM | Min | Max | Total N | Mean | SD | SEM | Min | Max | Total N | Mean | SD | SEM | Min | Max | Total N | Mean | SD | SEM | Min | Max | Total N | Mean | SD | SEM | Min | Max | |
| Gestational Length | 28 | 530.06 | 9.27 | 1.82 | 520.77 | 572.8 | 11 | 519.24 | 24.74 | 7.82 | 449.4 | 532.45 | 8 | 528.35 | 7 | 2.48 | 511.77 | 534.27 | 12 | 528.09 | 5.79 | 1.67 | 514 | 536.85 | 11 | 529.28 | 3.73 | 1.12 | 523.33 | 535.7 |
| Baseline Body weight | 28 | 306.87 | 29.02 | 5.48 | 256 | 375.3 | 11 | 322.68 | 23.5 | 7.08 | 274.6 | 347 | 8 | 299.83 | 22.18 | 7.84 | 261.4 | 335.7 | 12 | 302.37 | 19.21 | 5.55 | 271.5 | 332.8 | 11 | 312.95 | 29.41 | 8.87 | 269.1 | 380.1 |
| GD18 Body weight | 28 | 406.35 | 34.36 | 6.49 | 354.4 | 478.9 | 11 | 419.85 | 38.71 | 11.67 | 345.8 | 467.4 | 8 | 396.29 | 20.2 | 7.14 | 363.6 | 422.6 | 12 | 413.62 | 25.85 | 7.46 | 377.2 | 459.5 | 11 | 410.21 | 30.54 | 9.21 | 374.7 | 474.1 |
| Baseline Blood glucose | 28 | 7.95 | 0.96 | 0.18 | 5.8 | 9.7 | 11 | 7.95 | 0.66 | 0.2 | 7.3 | 9.2 | 8 | 7.48 | 0.6 | 0.21 | 6.7 | 8.3 | 12 | 7.92 | 0.98 | 0.28 | 6.6 | 10 | 11 | 7.59 | 0.51 | 0.15 | 6.6 | 8.2 |
| GD18 Blood glucose | 28 | 4.54 | 0.55 | 0.11 | 3.3 | 5.7 | 11 | 5.25 | 0.63 | 0.2 | 4.6 | 6.8 | 8 | 3.81 | 0.52 | 0.19 | 3 | 4.7 | 12 | 4.84 | 0.74 | 0.21 | 3.8 | 6 | 11 | 4.54 | 0.92 | 0.29 | 3.5 | 6.2 |
| Baseline CORT | 28 | 886.7 | 344.19 | 71.77 | 412.5 | 1671.7 | 11 | 1027.86 | 395.13 | 119.14 | 496.8 | 1548.1 | 8 | 2022.46 | 1214.44 | 429.37 | 389 | 3940.6 | 12 | 775.27 | 326.61 | 94.28 | 309.3 | 1450.6 | -- | -- | -- | -- | -- | -- |
| GD18 CORT | 28 | 581.56 | 331.99 | 74.24 | 105.6 | 1459.8 | 11 | 543.9 | 261.17 | 82.59 | 166 | 932.9 | 8 | 1398.99 | 721.76 | 255.18 | 382.4 | 2165.8 | 12 | 350.42 | 178.65 | 51.57 | 63.7 | 716.7 | -- | -- | -- | -- | -- | -- |
| (B) | Multigenerational group | |||||||||||||||||||||||||||||
| Control | F0 | F1 | F2 | F3 | ||||||||||||||||||||||||||
| Total N | Mean | SD | SEM | Min | Max | Total N | Mean | SD | SEM | Min | Max | Total N | Mean | SD | SEM | Min | Max | Total N | Mean | SD | SEM | Min | Max | Total N | Mean | SD | SEM | Min | Max | |
| Gestational Length | 28 | 530.06 | 9.27 | 1.82 | 520.77 | 572.8 | 11 | 519.24 | 24.74 | 7.82 | 449.4 | 532.45 | 6 | 527.82 | 6.54 | 2.67 | 518.37 | 534.78 | 10 | 527.59 | 4.97 | 1.57 | 522.07 | 535.92 | 8 | 531.2 | 5.64 | 2 | 523.55 | 543.33 |
| Baseline Body weight | 28 | 306.87 | 29.02 | 5.48 | 256 | 375.3 | 11 | 322.68 | 23.5 | 7.08 | 274.6 | 347 | 6 | 313.48 | 24.62 | 10.05 | 280.5 | 340.6 | 10 | 310.27 | 28.74 | 9.09 | 262.5 | 338.6 | 8 | 306.51 | 29.96 | 10.59 | 266.5 | 366.6 |
| GD18 Body weight | 28 | 406.4 | 34.4 | 6.5 | 354.4 | 478.9 | 11 | 419.9 | 38.7 | 11.7 | 345.8 | 467.4 | 6 | 401.9 | 40.7 | 16.6 | 345.2 | 448.5 | 10 | 419 | 34 | 10.7 | 351.7 | 470.9 | 8 | 396.9 | 37.1 | 13.1 | 337.4 | 456.2 |
| Baseline Blood glucose | 28 | 7.95 | 0.96 | 0.18 | 5.8 | 9.7 | 11 | 7.95 | 0.66 | 0.2 | 7.3 | 9.2 | 6 | 8.28 | 0.72 | 0.29 | 7.6 | 9.1 | 10 | 7.95 | 0.75 | 0.24 | 6.7 | 9.1 | 8 | 7.76 | 1.08 | 0.38 | 6.6 | 9.6 |
| GD18 Blood glucose | 28 | 4.54 | 0.55 | 0.11 | 3.3 | 5.7 | 11 | 5.25 | 0.63 | 0.2 | 4.6 | 6.8 | 6 | 4.78 | 0.58 | 0.24 | 4.3 | 5.9 | 10 | 4.8 | 0.55 | 0.17 | 3.8 | 5.5 | 8 | 3.75 | 0.42 | 0.15 | 3.2 | 4.4 |
| Baseline CORT | 28 | 886.7 | 344.19 | 71.77 | 412.5 | 1671.7 | 11 | 1027.86 | 395.13 | 119.14 | 496.8 | 1548.1 | 6 | 2139.37 | 1297.8 | 529.83 | 892.5 | 4493.9 | 10 | 626.85 | 309.28 | 97.8 | 236.7 | 1201.1 | -- | -- | -- | -- | -- | -- |
| GD18 CORT | 28 | 581.56 | 331.99 | 74.24 | 105.6 | 1459.8 | 11 | 543.9 | 261.17 | 82.59 | 166 | 932.9 | 6 | 1122.57 | 429.1 | 175.18 | 566.6 | 1580.5 | 10 | 527.89 | 228.9 | 72.38 | 246.6 | 993.6 | -- | -- | -- | -- | -- | -- |
References
- Petraglia, F.; Imperatore, A.; Challis, J.R. Neuroendocrine mechanisms in pregnancy and parturition. Endocr. Rev. 2010, 31, 783–816. [Google Scholar] [CrossRef] [PubMed] [Green Version]
- Schumacher, A.; Costa, S.D.; Zenclussen, A.C. Endocrine factors modulating immune responses in pregnancy. Front. Immunol. 2014, 5, 196. [Google Scholar] [CrossRef] [Green Version]
- Coussons-Read, M.E. Effects of prenatal stress on pregnancy and human development: Mechanisms and pathways. Obstet. Med. 2013, 6, 52–57. [Google Scholar] [CrossRef] [PubMed] [Green Version]
- McGowan, P.O.; Matthews, S.G. Prenatal Stress, Glucocorticoids, and Developmental Programming of the Stress Response. Endocrinology 2018, 159, 69–82. [Google Scholar] [CrossRef] [PubMed]
- Entringer, S.; Kumsta, R.; Nelson, E.L.; Hellhammer, D.H.; Wadhwa, P.D.; Wüst, S. Influence of prenatal psychosocial stress on cytokine production in adult women. Dev. Psychobiol. 2008, 50, 579–587. [Google Scholar] [CrossRef] [PubMed] [Green Version]
- Pandey, M.; Chauhan, M.; Awasthi, S. Interplay of cytokines in preterm birth. Indian J. Med. Res. 2017, 146, 316–327. [Google Scholar] [CrossRef] [PubMed]
- Lilliecreutz, C.; Larén, J.; Sydsjö, G.; Josefsson, A. Effect of maternal stress during pregnancy on the risk for preterm birth. BMC Pregnancy Childbirth 2016, 16, 5. [Google Scholar] [CrossRef] [Green Version]
- Rappaport, S.M.; Smith, M.T. Epidemiology. Environment and disease risks. Science 2010, 330, 460–461. [Google Scholar] [CrossRef] [Green Version]
- Marinello, W.P.; Patisaul, H.B. Endocrine disrupting chemicals (EDCs) and placental function: Impact on fetal brain development. Adv. Pharmacol. 2021, 92, 347–400. [Google Scholar] [CrossRef]
- Fitzgerald, E.; Hor, K.; Drake, A.J. Maternal influences on fetal brain development: The role of nutrition, infection and stress, and the potential for intergenerational consequences. Early Hum. Dev. 2020, 150, 105190. [Google Scholar] [CrossRef]
- McEwen, B.S.; Stellar, E. Stress and the individual. Mechanisms leading to disease. Arch. Intern. Med. 1993, 153, 2093–2101. [Google Scholar] [CrossRef] [PubMed]
- McEwen, B.S.; Wingfield, J.C. The concept of allostasis in biology and biomedicine. Horm. Behav. 2003, 43, 2–15. [Google Scholar] [CrossRef]
- Olson, D.M.; Severson, E.M.; Verstraeten, B.S.; Ng, J.W.; McCreary, J.K.; Metz, G.A. Allostatic Load and Preterm Birth. Int. J. Mol. Sci. 2015, 16, 29856–29874. [Google Scholar] [CrossRef] [PubMed]
- Yao, Y.; Robinson, A.M.; Zucchi, F.C.; Robbins, J.C.; Babenko, O.; Kovalchuk, O.; Kovalchuk, I.; Olson, D.M.; Metz, G.A. Ancestral exposure to stress epigenetically programs preterm birth risk and adverse maternal and newborn outcomes. BMC Med. 2014, 12, 121. [Google Scholar] [CrossRef] [PubMed] [Green Version]
- Verstraeten, B.S.E.; McCreary, J.K.; Weyers, S.; Metz, G.A.S.; Olson, D.M. Prenatal two-hit stress affects maternal and offspring pregnancy outcomes and uterine gene expression in rats: Match or mismatch? Biol. Reprod. 2019, 100, 195–207. [Google Scholar] [CrossRef] [PubMed]
- Faraji, J.; Soltanpour, N.; Lotfi, H.; Moeeini, R.; Moharreri, A.R.; Roudaki, S.; Hosseini, S.A.; Olson, D.M.; Abdollahi, A.A.; Mohajerani, M.H.; et al. Lack of Social Support Raises Stress Vulnerability in Rats with a History of Ancestral Stress. Sci. Rep. 2017, 7, 5277. [Google Scholar] [CrossRef] [Green Version]
- Ward, I.D.; Zucchi, F.C.; Robbins, J.C.; Falkenberg, E.A.; Olson, D.M.; Benzies, K.; Metz, G.A. Transgenerational programming of maternal behaviour by prenatal stress. BMC Pregnancy Childbirth 2013, 13 (Suppl. 1), S9. [Google Scholar] [CrossRef] [Green Version]
- Kiss, D.; Ambeskovic, M.; Montina, T.; Metz, G.A. Stress transgenerationally programs metabolic pathways linked to altered mental health. Cell Mol. Life Sci. 2016, 73, 4547–4557. [Google Scholar] [CrossRef]
- Holt-Lunstad, J. The Potential Public Health Relevance of Social Isolation and Loneliness: Prevalence, Epidemiology, and Risk Factors. Public Policy Aging Rep. 2017, 27, 127–130. [Google Scholar] [CrossRef] [Green Version]
- Hwang, T.J.; Rabheru, K.; Peisah, C.; Reichman, W.; Ikeda, M. Loneliness and social isolation during the COVID-19 pandemic. Int. Psychogeriatr. 2020, 32, 1217–1220. [Google Scholar] [CrossRef]
- Valtorta, N.K.; Kanaan, M.; Gilbody, S.; Ronzi, S.; Hanratty, B. Loneliness and social isolation as risk factors for coronary heart disease and stroke: Systematic review and meta-analysis of longitudinal observational studies. Heart 2016, 102, 1009–1016. [Google Scholar] [CrossRef] [PubMed] [Green Version]
- Alcaraz, K.I.; Eddens, K.S.; Blase, J.L.; Diver, W.R.; Patel, A.V.; Teras, L.R.; Stevens, V.L.; Jacobs, E.J.; Gapstur, S.M. Social Isolation and Mortality in US Black and White Men and Women. Am. J. Epidemiol. 2019, 188, 102–109. [Google Scholar] [CrossRef] [PubMed] [Green Version]
- Chou, K.L.; Liang, K.; Sareen, J. The association between social isolation and DSM-IV mood, anxiety, and substance use disorders: Wave 2 of the National Epidemiologic Survey on Alcohol and Related Conditions. J. Clin. Psychiatry 2011, 72, 1468–1476. [Google Scholar] [CrossRef]
- Pancani, L.; Marinucci, M.; Aureli, N.; Riva, P. Forced Social Isolation and Mental Health: A Study on 1006 Italians Under COVID-19 Lockdown. Front. Psychol. 2021, 12, 663799. [Google Scholar] [CrossRef]
- Pietrabissa, G.; Simpson, S.G. Psychological Consequences of Social Isolation During COVID-19 Outbreak. Front. Psychol. 2020, 11, 2201. [Google Scholar] [CrossRef] [PubMed]
- Holt-Lunstad, J.; Smith, T.B.; Baker, M.; Harris, T.; Stephenson, D. Loneliness and social isolation as risk factors for mortality: A meta-analytic review. Perspect. Psychol. Sci. 2015, 10, 227–237. [Google Scholar] [CrossRef] [Green Version]
- Faraji, J.; Metz, G.A.S. Aging, Social Distancing, and COVID-19 Risk: Who is more Vulnerable and Why? Aging Dis. 2021, 12, 1624–1643. [Google Scholar] [CrossRef]
- Arakawa, H. Ethological approach to social isolation effects in behavioral studies of laboratory rodents. Behav. Brain Res. 2018, 341, 98–108. [Google Scholar] [CrossRef]
- Veenema, A.H. Early life stress, the development of aggression and neuroendocrine and neurobiological correlates: What can we learn from animal models? Front. Neuroendocrinol. 2009, 30, 497–518. [Google Scholar] [CrossRef]
- Mumtaz, F.; Khan, M.I.; Zubair, M.; Dehpour, A.R. Neurobiology and consequences of social isolation stress in animal model-A comprehensive review. Biomed. Pharmacother. 2018, 105, 1205–1222. [Google Scholar] [CrossRef]
- McCreary, J.K.; Erickson, Z.T.; Metz, G.A. Environmental enrichment mitigates the impact of ancestral stress on motor skill and corticospinal tract plasticity. Neurosci. Lett. 2016, 632, 181–186. [Google Scholar] [CrossRef] [PubMed]
- Fone, K.C.; Porkess, M.V. Behavioural and neurochemical effects of post-weaning social isolation in rodents-relevance to developmental neuropsychiatric disorders. Neurosci. Biobehav. Rev. 2008, 32, 1087–1102. [Google Scholar] [CrossRef] [PubMed]
- Weiss, I.C.; Pryce, C.R.; Jongen-Rêlo, A.L.; Nanz-Bahr, N.I.; Feldon, J. Effect of social isolation on stress-related behavioural and neuroendocrine state in the rat. Behav. Brain Res. 2004, 152, 279–295. [Google Scholar] [CrossRef] [PubMed]
- Hermes, G.L.; Rosenthal, L.; Montag, A.; McClintock, M.K. Social isolation and the inflammatory response: Sex differences in the enduring effects of a prior stressor. Am. J. Physiol. Regul. Integr. Comp. Physiol. 2006, 290, R273–R282. [Google Scholar] [CrossRef] [PubMed] [Green Version]
- Al Omran, A.J.; Shao, A.S.; Watanabe, S.; Zhang, Z.; Zhang, J.; Xue, C.; Watanabe, J.; Davies, D.L.; Shao, X.M.; Liang, J. Social Isolation Induces Neuroinflammation And Microglia Overactivation, While Dihydromyricetin Prevents And Improves Them. J. Neuroinflamm. 2022, 19, 2. [Google Scholar] [CrossRef]
- Liu, N.; Wang, Y.; An, A.Y.; Banker, C.; Qian, Y.H.; O’Donnell, J.M. Single housing-induced effects on cognitive impairment and depression-like behavior in male and female mice involve neuroplasticity-related signaling. Eur. J. Neurosci. 2020, 52, 2694–2704. [Google Scholar] [CrossRef]
- Leigh-Hunt, N.; Bagguley, D.; Bash, K.; Turner, V.; Turnbull, S.; Valtorta, N.; Caan, W. An overview of systematic reviews on the public health consequences of social isolation and loneliness. Public Health 2017, 152, 157–171. [Google Scholar] [CrossRef] [Green Version]
- Choi, H.; Irwin, M.R.; Cho, H.J. Impact of social isolation on behavioral health in elderly: Systematic review. World J. Psychiatry 2015, 5, 432–438. [Google Scholar] [CrossRef]
- Leff Gelman, P.; Mancilla-Herrera, I.; Flores-Ramos, M.; Saravia Takashima, M.F.; Cruz Coronel, F.M.; Cruz Fuentes, C.; Pérez Molina, A.; Hernández-Ruiz, J.; Silva-Aguilera, F.S.; Farfan-Labonne, B.; et al. The cytokine profile of women with severe anxiety and depression during pregnancy. BMC Psychiatry 2019, 19, 104. [Google Scholar] [CrossRef] [Green Version]
- Karlsson, L.; Nousiainen, N.; Scheinin, N.M.; Maksimow, M.; Salmi, M.; Lehto, S.M.; Tolvanen, M.; Lukkarinen, H.; Karlsson, H. Cytokine profile and maternal depression and anxiety symptoms in mid-pregnancy-the FinnBrain Birth Cohort Study. Arch. Womens Ment. Health 2017, 20, 39–48. [Google Scholar] [CrossRef]
- Rosenblat, J.D.; Cha, D.S.; Mansur, R.B.; McIntyre, R.S. Inflamed moods: A review of the interactions between inflammation and mood disorders. Prog. Neuropsychopharmacol. Biol. Psychiatry 2014, 53, 23–34. [Google Scholar] [CrossRef] [PubMed]
- Field, T.; Diego, M. Cortisol: The culprit prenatal stress variable. Int. J. Neurosci. 2008, 118, 1181. [Google Scholar] [CrossRef] [PubMed]
- Nandam, L.S.; Brazel, M.; Zhou, M.; Jhaveri, D.J. Cortisol and Major Depressive Disorder-Translating Findings From Humans to Animal Models and Back. Front. Psychiatry 2019, 10, 974. [Google Scholar] [CrossRef] [PubMed]
- Venkatesh, K.K.; Riley, L.; Castro, V.M.; Perlis, R.H.; Kaimal, A.J. Association of Antenatal Depression Symptoms and Antidepressant Treatment With Preterm Birth. Obstet. Gynecol. 2016, 127, 926–933. [Google Scholar] [CrossRef] [Green Version]
- Dayan, J.; Creveuil, C.; Marks, M.N.; Conroy, S.; Herlicoviez, M.; Dreyfus, M.; Tordjman, S. Prenatal depression, prenatal anxiety, and spontaneous preterm birth: A prospective cohort study among women with early and regular care. Psychosom. Med. 2006, 68, 938–946. [Google Scholar] [CrossRef]
- Hu, R.; Li, Y.; Zhang, Z.; Yan, W. Antenatal depressive symptoms and the risk of preeclampsia or operative deliveries: A meta-analysis. PLoS ONE 2015, 10, e0119018. [Google Scholar] [CrossRef] [Green Version]
- Damiani, F.; Makieva, S.; Rinaldi, S.F.; Hua, L.; Marcolongo, P.; Petraglia, F.; Norman, J.E. 11β-hydroxysteroid dehydrogenase type 1 and pregnancy: Role in the timing of labour onset and in myometrial contraction. Mol. Cell Endocrinol. 2017, 447, 79–86. [Google Scholar] [CrossRef]
- Osman, I.; Young, A.; Ledingham, M.A.; Thomson, A.J.; Jordan, F.; Greer, I.A.; Norman, J.E. Leukocyte density and pro-inflammatory cytokine expression in human fetal membranes, decidua, cervix and myometrium before and during labour at term. Mol. Hum. Reprod. 2003, 9, 41–45. [Google Scholar] [CrossRef] [Green Version]
- Blencowe, H.; Cousens, S.; Chou, D.; Oestergaard, M.; Say, L.; Moller, A.B.; Kinney, M.; Lawn, J.; Group, B.T.S.P.B.A. Born too soon: The global epidemiology of 15 million preterm births. Reprod. Health 2013, 10 (Suppl. 1), S2. [Google Scholar] [CrossRef] [Green Version]
- Liu, L.; Oza, S.; Hogan, D.; Chu, Y.; Perin, J.; Zhu, J.; Lawn, J.E.; Cousens, S.; Mathers, C.; Black, R.E. Global, regional, and national causes of under-5 mortality in 2000-15: An updated systematic analysis with implications for the Sustainable Development Goals. Lancet 2016, 388, 3027–3035. [Google Scholar] [CrossRef] [Green Version]
- Coler, B.S.; Shynlova, O.; Boros-Rausch, A.; Lye, S.; McCartney, S.; Leimert, K.B.; Xu, W.; Chemtob, S.; Olson, D.; Li, M.; et al. Landscape of Preterm Birth Therapeutics and a Path Forward. J. Clin. Med. 2021, 10, 2912. [Google Scholar] [CrossRef] [PubMed]
- Govindaraj, S.; Shanmuganathan, A.; Rajan, R. Maternal psychological stress-induced developmental disability, neonatal mortality and stillbirth in the offspring of Wistar albino rats. PLoS ONE 2017, 12, e0171089. [Google Scholar] [CrossRef] [PubMed]
- Garcia-Flores, V.; Romero, R.; Furcron, A.E.; Levenson, D.; Galaz, J.; Zou, C.; Hassan, S.S.; Hsu, C.D.; Olson, D.; Metz, G.A.S.; et al. Prenatal Maternal Stress Causes Preterm Birth and Affects Neonatal Adaptive Immunity in Mice. Front. Immunol. 2020, 11, 254. [Google Scholar] [CrossRef] [PubMed]
- Paris, J.J.; Brunton, P.J.; Russell, J.A.; Frye, C.A. Immune stress in late pregnant rats decreases length of gestation and fecundity, and alters later cognitive and affective behaviour of surviving pre-adolescent offspring. Stress 2011, 14, 652–664. [Google Scholar] [CrossRef] [Green Version]
- Dancause, K.N.; Laplante, D.P.; Oremus, C.; Fraser, S.; Brunet, A.; King, S. Disaster-related prenatal maternal stress influences birth outcomes: Project Ice Storm. Early Hum. Dev. 2011, 87, 813–820. [Google Scholar] [CrossRef]
- Nakagawa, Y.; To, M.; Saruta, J.; Yamamoto, Y.; Yamamoto, T.; Shimizu, T.; Kamata, Y.; Matsuo, M.; Tsukinoki, K. Effect of social isolation stress on saliva BDNF in rat. J. Oral Sci. 2019, 61, 516–520. [Google Scholar] [CrossRef] [Green Version]
- Pais, A.B.; Pais, A.C.; Elmisurati, G.; Park, S.H.; Miles, M.F.; Wolstenholme, J.T. A Novel Neighbor Housing Environment Enhances Social Interaction and Rescues Cognitive Deficits from Social Isolation in Adolescence. Brain Sci. 2019, 9, 336. [Google Scholar] [CrossRef] [Green Version]
- Van den Hove, D.L.; Leibold, N.K.; Strackx, E.; Martinez-Claros, M.; Lesch, K.P.; Steinbusch, H.W.; Schruers, K.R.; Prickaerts, J. Prenatal stress and subsequent exposure to chronic mild stress in rats; interdependent effects on emotional behavior and the serotonergic system. Eur. Neuropsychopharmacol. 2014, 24, 595–607. [Google Scholar] [CrossRef]
- Xianglian Jia, Y.H.; Yang, X.; Liu, T.; Huang, Y.; Wei, P.; Hao, Y.; Wan, L. Stress affects the oscillation of blood glucose levels in rodents. Biological. Rhythm. Res. 2020, 51, 699–708. [Google Scholar] [CrossRef]
- Scholl, T.O.; Sowers, M.; Chen, X.; Lenders, C. Maternal glucose concentration influences fetal growth, gestation, and pregnancy complications. Am. J. Epidemiol. 2001, 154, 514–520. [Google Scholar] [CrossRef] [Green Version]
- Geurtsen, M.L.; van Soest, E.E.L.; Voerman, E.; Steegers, E.A.P.; Jaddoe, V.W.V.; Gaillard, R. High maternal early-pregnancy blood glucose levels are associated with altered fetal growth and increased risk of adverse birth outcomes. Diabetologia 2019, 62, 1880–1890. [Google Scholar] [CrossRef] [PubMed] [Green Version]
- Hawkley, L.C.; Cole, S.W.; Capitanio, J.P.; Norman, G.J.; Cacioppo, J.T. Effects of social isolation on glucocorticoid regulation in social mammals. Horm. Behav. 2012, 62, 314–323. [Google Scholar] [CrossRef] [Green Version]
- Ambeskovic, M.; Babenko, O.; Ilnytskyy, Y.; Kovalchuk, I.; Kolb, B.; Metz, G.A.S. Ancestral Stress Alters Lifetime Mental Health Trajectories and Cortical Neuromorphology via Epigenetic Regulation. Sci. Rep. 2019, 9, 6389. [Google Scholar] [CrossRef] [PubMed] [Green Version]
- Morinan, A.; Leonard, B.E. Some anatomical and physiological correlates of social isolation in the young rat. Physiol. Behav. 1980, 24, 637–640. [Google Scholar] [CrossRef]
- Holson, R.R.; Scallet, A.C.; Ali, S.F.; Turner, B.B. “Isolation stress” revisited: Isolation-rearing effects depend on animal care methods. Physiol. Behav. 1991, 49, 1107–1118. [Google Scholar] [CrossRef]
- Ieraci, A.; Mallei, A.; Popoli, M. Social Isolation Stress Induces Anxious-Depressive-Like Behavior and Alterations of Neuroplasticity-Related Genes in Adult Male Mice. Neural. Plast. 2016, 2016, 6212983. [Google Scholar] [CrossRef] [Green Version]
- Hermes, G.L.; Delgado, B.; Tretiakova, M.; Cavigelli, S.A.; Krausz, T.; Conzen, S.D.; McClintock, M.K. Social isolation dysregulates endocrine and behavioral stress while increasing malignant burden of spontaneous mammary tumors. Proc. Natl. Acad. Sci. USA 2009, 106, 22393–22398. [Google Scholar] [CrossRef] [Green Version]
- Audet, M.C.; McQuaid, R.J.; Merali, Z.; Anisman, H. Cytokine variations and mood disorders: Influence of social stressors and social support. Front. Neurosci. 2014, 8, 416. [Google Scholar] [CrossRef] [Green Version]
- Leimert, K.B.; Xu, W.; Princ, M.M.; Chemtob, S.; Olson, D.M. Inflammatory Amplification: A Central Tenet of Uterine Transition for Labor. Front. Cell. Infect. Microbiol. 2021, 11, 660983. [Google Scholar] [CrossRef]
- Romero, R.; Miranda, J.; Chaiworapongsa, T.; Korzeniewski, S.J.; Chaemsaithong, P.; Gotsch, F.; Dong, Z.; Ahmed, A.I.; Yoon, B.H.; Hassan, S.S.; et al. Prevalence and clinical significance of sterile intra-amniotic inflammation in patients with preterm labor and intact membranes. Am. J. Reprod. Immunol. 2014, 72, 458–474. [Google Scholar] [CrossRef] [Green Version]
- Mastorakos, G.; Ilias, I. Maternal and fetal hypothalamic-pituitary-adrenal axes during pregnancy and postpartum. Ann. N. Y. Acad. Sci. 2003, 997, 136–149. [Google Scholar] [CrossRef] [PubMed]
- Xu, C.; Gao, L.; You, X.; Dai, L.; Li, Y.; Gu, H.; Slater, D.M.; Olson, D.M.; Ni, X. CRH acts on CRH-R1 and -R2 to differentially modulate the expression of large-conductance calcium-activated potassium channels in human pregnant myometrium. Endocrinology 2011, 152, 4406–4417. [Google Scholar] [CrossRef] [PubMed] [Green Version]
- You, X.; Liu, J.; Xu, C.; Liu, W.; Zhu, X.; Li, Y.; Sun, Q.; Gu, H.; Ni, X. Corticotropin-releasing hormone (CRH) promotes inflammation in human pregnant myometrium: The evidence of CRH initiating parturition? J. Clin. Endocrinol. Metab. 2014, 99, E199–E208. [Google Scholar] [CrossRef] [PubMed] [Green Version]
- Ishiguro, T.; Takeda, J.; Fang, X.; Bronson, H.; Olson, D.M. Interleukin (IL)-1 in rat parturition: IL-1 receptors 1 and 2 and accessory proteins abundance in pregnant rat uterus at term—Regulation by progesterone. Physiol. Rep. 2016, 4, e12866. [Google Scholar] [CrossRef] [Green Version]
- Markovic, D.; Vatish, M.; Gu, M.; Slater, D.; Newton, R.; Lehnert, H.; Grammatopoulos, D.K. The onset of labor alters corticotropin-releasing hormone type 1 receptor variant expression in human myometrium: Putative role of interleukin-1beta. Endocrinology 2007, 148, 3205–3213. [Google Scholar] [CrossRef]
- Markovic, D.; Bari, M.F.; Lu, B.; Vatish, M.; Grammatopoulos, D.K. Corticotropin-releasing hormone interacts with interleukin-1β to regulate prostaglandin H synthase-2 expression in human myometrium during pregnancy and labor. J. Clin. Endocrinol. Metab. 2013, 98, 2864–2875. [Google Scholar] [CrossRef] [Green Version]
- Coffman, J.A. Chronic stress, physiological adaptation and developmental programming of the neuroendocrine stress system. Future Neurol. 2020, 15, FNL39. [Google Scholar] [CrossRef]
- Nederhof, E.; Schmidt, M.V. Mismatch or cumulative stress: Toward an integrated hypothesis of programming effects. Physiol. Behav. 2012, 106, 691–700. [Google Scholar] [CrossRef]
- Kwon, E.J.; Kim, Y.J. What is fetal programming?: A lifetime health is under the control of in utero health. Obstet. Gynecol. Sci. 2017, 60, 506–519. [Google Scholar] [CrossRef]
- Reyes, L.; Mañalich, R. Long-term consequences of low birth weight. Kidney Int. Suppl. 2005, 68, S107–S111. [Google Scholar] [CrossRef] [Green Version]
- Risnes, K.R.; Vatten, L.J.; Baker, J.L.; Jameson, K.; Sovio, U.; Kajantie, E.; Osler, M.; Morley, R.; Jokela, M.; Painter, R.C.; et al. Birthweight and mortality in adulthood: A systematic review and meta-analysis. Int. J. Epidemiol. 2011, 40, 647–661. [Google Scholar] [CrossRef] [PubMed] [Green Version]
- Dole, N.; Savitz, D.A.; Hertz-Picciotto, I.; Siega-Riz, A.M.; McMahon, M.J.; Buekens, P. Maternal stress and preterm birth. Am. J. Epidemiol. 2003, 157, 14–24. [Google Scholar] [CrossRef] [PubMed]
- Serpeloni, F.; Radtke, K.; de Assis, S.G.; Henning, F.; Nätt, D.; Elbert, T. Grandmaternal stress during pregnancy and DNA methylation of the third generation: An epigenome-wide association study. Transl. Psychiatry 2017, 7, e1202. [Google Scholar] [CrossRef] [PubMed]
- Veenendaal, M.V.; Painter, R.C.; de Rooij, S.R.; Bossuyt, P.M.; van der Post, J.A.; Gluckman, P.D.; Hanson, M.A.; Roseboom, T.J. Transgenerational effects of prenatal exposure to the 1944-45 Dutch famine. BJOG 2013, 120, 548–553. [Google Scholar] [CrossRef]
- Murayama, H.; Okubo, R.; Tabuchi, T. Increase in Social Isolation during the COVID-19 Pandemic and Its Association with Mental Health: Findings from the JACSIS 2020 Study. Int. J. Environ. Res. Public Health 2021, 18, 8238. [Google Scholar] [CrossRef]
- Davenport, M.H.; Meyer, S.; Meah, V.L.; Strynadka, M.C.; Khurana, R. Moms Are Not OK: COVID-19 and Maternal Mental Health. Front. Glob. Womens Health 2020, 1, 1. [Google Scholar] [CrossRef]
- Milne, S.J.; Corbett, G.A.; Hehir, M.P.; Lindow, S.W.; Mohan, S.; Reagu, S.; Farrell, T.; O’Connell, M.P. Effects of isolation on mood and relationships in pregnant women during the covid-19 pandemic. Eur. J. Obstet. Gynecol. Reprod. Biol. 2020, 252, 610–611. [Google Scholar] [CrossRef]
- Mortazavi, F.; Mehrabadi, M.; KiaeeTabar, R. Pregnant women’s well-being and worry during the COVID-19 pandemic: A cross-sectional study. BMC Pregnancy Childbirth 2021, 21, 59. [Google Scholar] [CrossRef]
- Kotlar, B.; Gerson, E.; Petrillo, S.; Langer, A.; Tiemeier, H. The impact of the COVID-19 pandemic on maternal and perinatal health: A scoping review. Reprod. Health 2021, 18, 10. [Google Scholar] [CrossRef]
- Wei, S.Q.; Bilodeau-Bertrand, M.; Liu, S.; Auger, N. The impact of COVID-19 on pregnancy outcomes: A systematic review and meta-analysis. CMAJ 2021, 193, E540–E548. [Google Scholar] [CrossRef]
- Koyama, Y.; Nawa, N.; Yamaoka, Y.; Nishimura, H.; Sonoda, S.; Kuramochi, J.; Miyazaki, Y.; Fujiwara, T. Interplay between social isolation and loneliness and chronic systemic inflammation during the COVID-19 pandemic in Japan: Results from U-CORONA study. Brain Behav. Immun. 2021, 94, 51–59. [Google Scholar] [CrossRef] [PubMed]
- Lyerly, A.D. Pregnancy and the Origins of Illness; Perspectives; University of North Carolina: Chapel Hill, NC, USA, 2022; Volume 399. [Google Scholar]
- Smith, A.J.; Clutton, R.E.; Lilley, E.; Hansen, K.E.A.; Brattelid, T. PREPARE: Guidelines for planning animal research and testing. Lab. Anim. 2018, 52, 135–141. [Google Scholar] [CrossRef] [PubMed] [Green Version]
- Percie du Sert, N.; Hurst, V.; Ahluwalia, A.; Alam, S.; Avey, M.T.; Baker, M.; Browne, W.J.; Clark, A.; Cuthill, I.C.; Dirnagl, U.; et al. The ARRIVE guidelines 2.0: Updated guidelines for reporting animal research. PLoS Biol. 2020, 18, e3000410. [Google Scholar] [CrossRef]
- Faraji, J.; Singh, S.; Soltanpour, N.; Sutherland, R.J.; Metz, G.A.S. Environmental determinants of behavioural responses to short-term stress in rats: Evidence for inhibitory effect of ambient landmarks. Behav. Brain Res. 2020, 379, 112332. [Google Scholar] [CrossRef]
- Kemp, M.W.; Saito, M.; Newnham, J.P.; Nitsos, I.; Okamura, K.; Kallapur, S.G. Preterm birth, infection, and inflammation advances from the study of animal models. Reprod. Sci. 2010, 17, 619–628. [Google Scholar] [CrossRef]
- Dudley, D.J. Immunoendocrinology of preterm labor: The link between corticotropin-releasing hormone and inflammation. Am. J. Obstet. Gynecol. 1999, 180, S251–S256. [Google Scholar] [CrossRef]
- Leimert, K.B.; Messer, A.; Gray, T.; Fang, X.; Chemtob, S.; Olson, D.M. Maternal and fetal intrauterine tissue crosstalk promotes proinflammatory amplification and uterine transition†. Biol. Reprod. 2019, 100, 783–797. [Google Scholar] [CrossRef]
- Pfaffl, M.W. A new mathematical model for relative quantification in real-time RT-PCR. Nucleic Acids Res. 2001, 29, e45. [Google Scholar] [CrossRef]


| Outcomes % (n) | Controls (n = 15) | Stressed (n = 22) | p | Strength of Association (φ) |
|---|---|---|---|---|
| Inability to become pregnant | 8.1 (3) | 10.8 (4) | 1.000 | 0.023 |
| Health complication | 8.1 (3) | 5.4 (2) | 0.377 | 0.157 |
| Pregnancy-related complication | 2.7 (1) | 2.7 (1) | 1.000 | 0.046 |
| Disinterest in breeding | (0) | 13.5 (5) | 0.067 | 0.326 |
| Controls (n = 20–28) | F0 Stress (n = 10–11) | F1 Stress (n = 6–8) | F2 Stress (n = 10–12) | F3 stress (n = 8–11) | ||||||||
|---|---|---|---|---|---|---|---|---|---|---|---|---|
| Bodyweight (g) | Mean | SD | Mean | SD | Mean | SD | Mean | SD | Mean | SD | p-Value | |
| Transgenerational (TG) group | Baseline (preconception) | 306.87 | 29.02 | 322.68 | 23.50 | 299.83 | 22.18 | 302.37 | 19.21 | 312.95 | 29.41 | 0.212 |
| GD18 | 406.35 | 34.36 | 419.86 | 38.71 | 396.29 | 20.20 | 413.62 | 25.85 | 410.21 | 30.54 | 0.631 | |
| Multigenerational (MG) group | Baseline (preconception) | 306.87 | 29.02 | 322.68 | 23.50 | 313.48 | 24.62 | 310.27 | 28.74 | 306.51 | 29.96 | 0.372 |
| GD18 | 406.35 | 34.36 | 419.86 | 38.71 | 401.88 | 40.70 | 419.01 | 33.96 | 396.85 | 37.09 | 0.565 | |
Publisher’s Note: MDPI stays neutral with regard to jurisdictional claims in published maps and institutional affiliations. |
© 2022 by the authors. Licensee MDPI, Basel, Switzerland. This article is an open access article distributed under the terms and conditions of the Creative Commons Attribution (CC BY) license (https://creativecommons.org/licenses/by/4.0/).
Share and Cite
Lopes, N.A.; Falkenberg, E.A.; Wiley, C.; Patel, V.; Serrano-Lomelin, J.; Fang, X.; Weiler, A.M.; McCreary, J.K.; Metz, G.A.S.; Olson, D.M. Social Isolation Stress Modulates Pregnancy Outcomes and the Inflammatory Profile of Rat Uterus. Int. J. Mol. Sci. 2022, 23, 6169. https://doi.org/10.3390/ijms23116169
Lopes NA, Falkenberg EA, Wiley C, Patel V, Serrano-Lomelin J, Fang X, Weiler AM, McCreary JK, Metz GAS, Olson DM. Social Isolation Stress Modulates Pregnancy Outcomes and the Inflammatory Profile of Rat Uterus. International Journal of Molecular Sciences. 2022; 23(11):6169. https://doi.org/10.3390/ijms23116169
Chicago/Turabian StyleLopes, Nayara A., Erin A. Falkenberg, Camille Wiley, Vaishvi Patel, Jesus Serrano-Lomelin, Xin Fang, Amanda M. Weiler, J. Keiko McCreary, Gerlinde A. S. Metz, and David M. Olson. 2022. "Social Isolation Stress Modulates Pregnancy Outcomes and the Inflammatory Profile of Rat Uterus" International Journal of Molecular Sciences 23, no. 11: 6169. https://doi.org/10.3390/ijms23116169
APA StyleLopes, N. A., Falkenberg, E. A., Wiley, C., Patel, V., Serrano-Lomelin, J., Fang, X., Weiler, A. M., McCreary, J. K., Metz, G. A. S., & Olson, D. M. (2022). Social Isolation Stress Modulates Pregnancy Outcomes and the Inflammatory Profile of Rat Uterus. International Journal of Molecular Sciences, 23(11), 6169. https://doi.org/10.3390/ijms23116169