
Disruption of Redox Homeostasis by Alterations in Nitric Oxide Synthase Activity and Tetrahydrobiopterin along with Melanoma Progression

 , , and
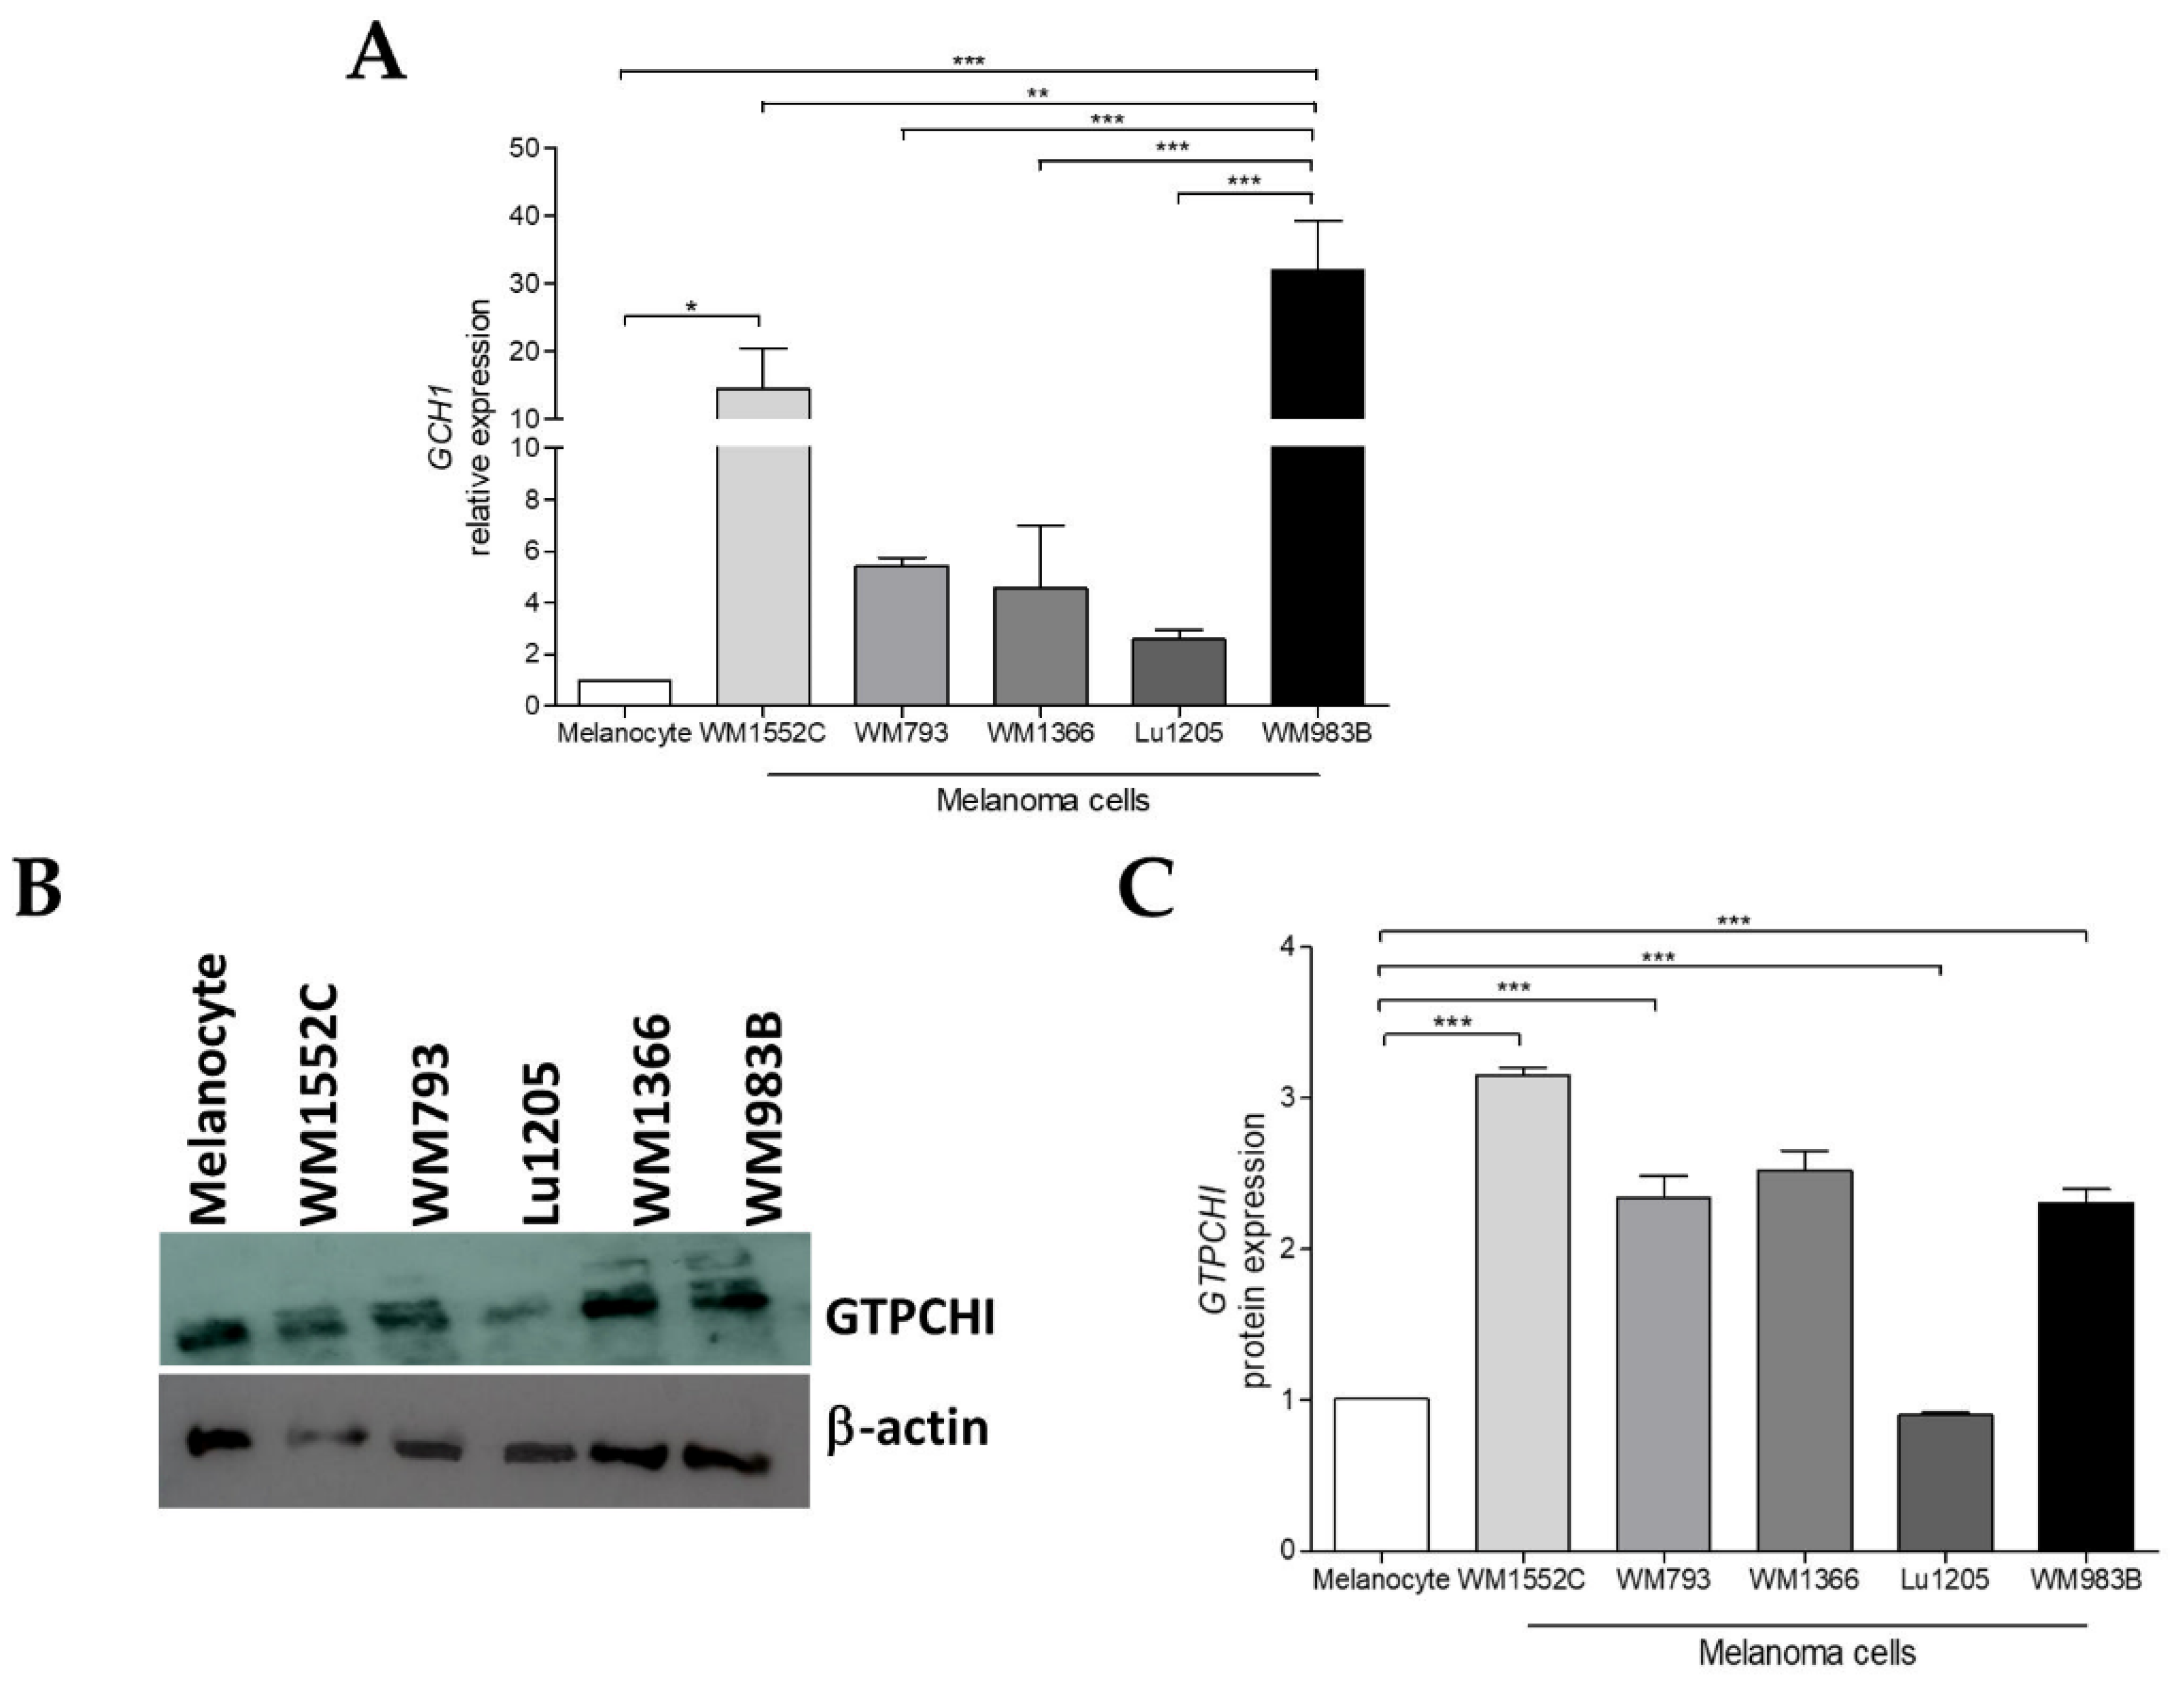
Abstract
1. Introduction
2. Results
2.1. GCH1 Expression Is Elevated in Melanoma Cell Lines Compared to Melanocytes
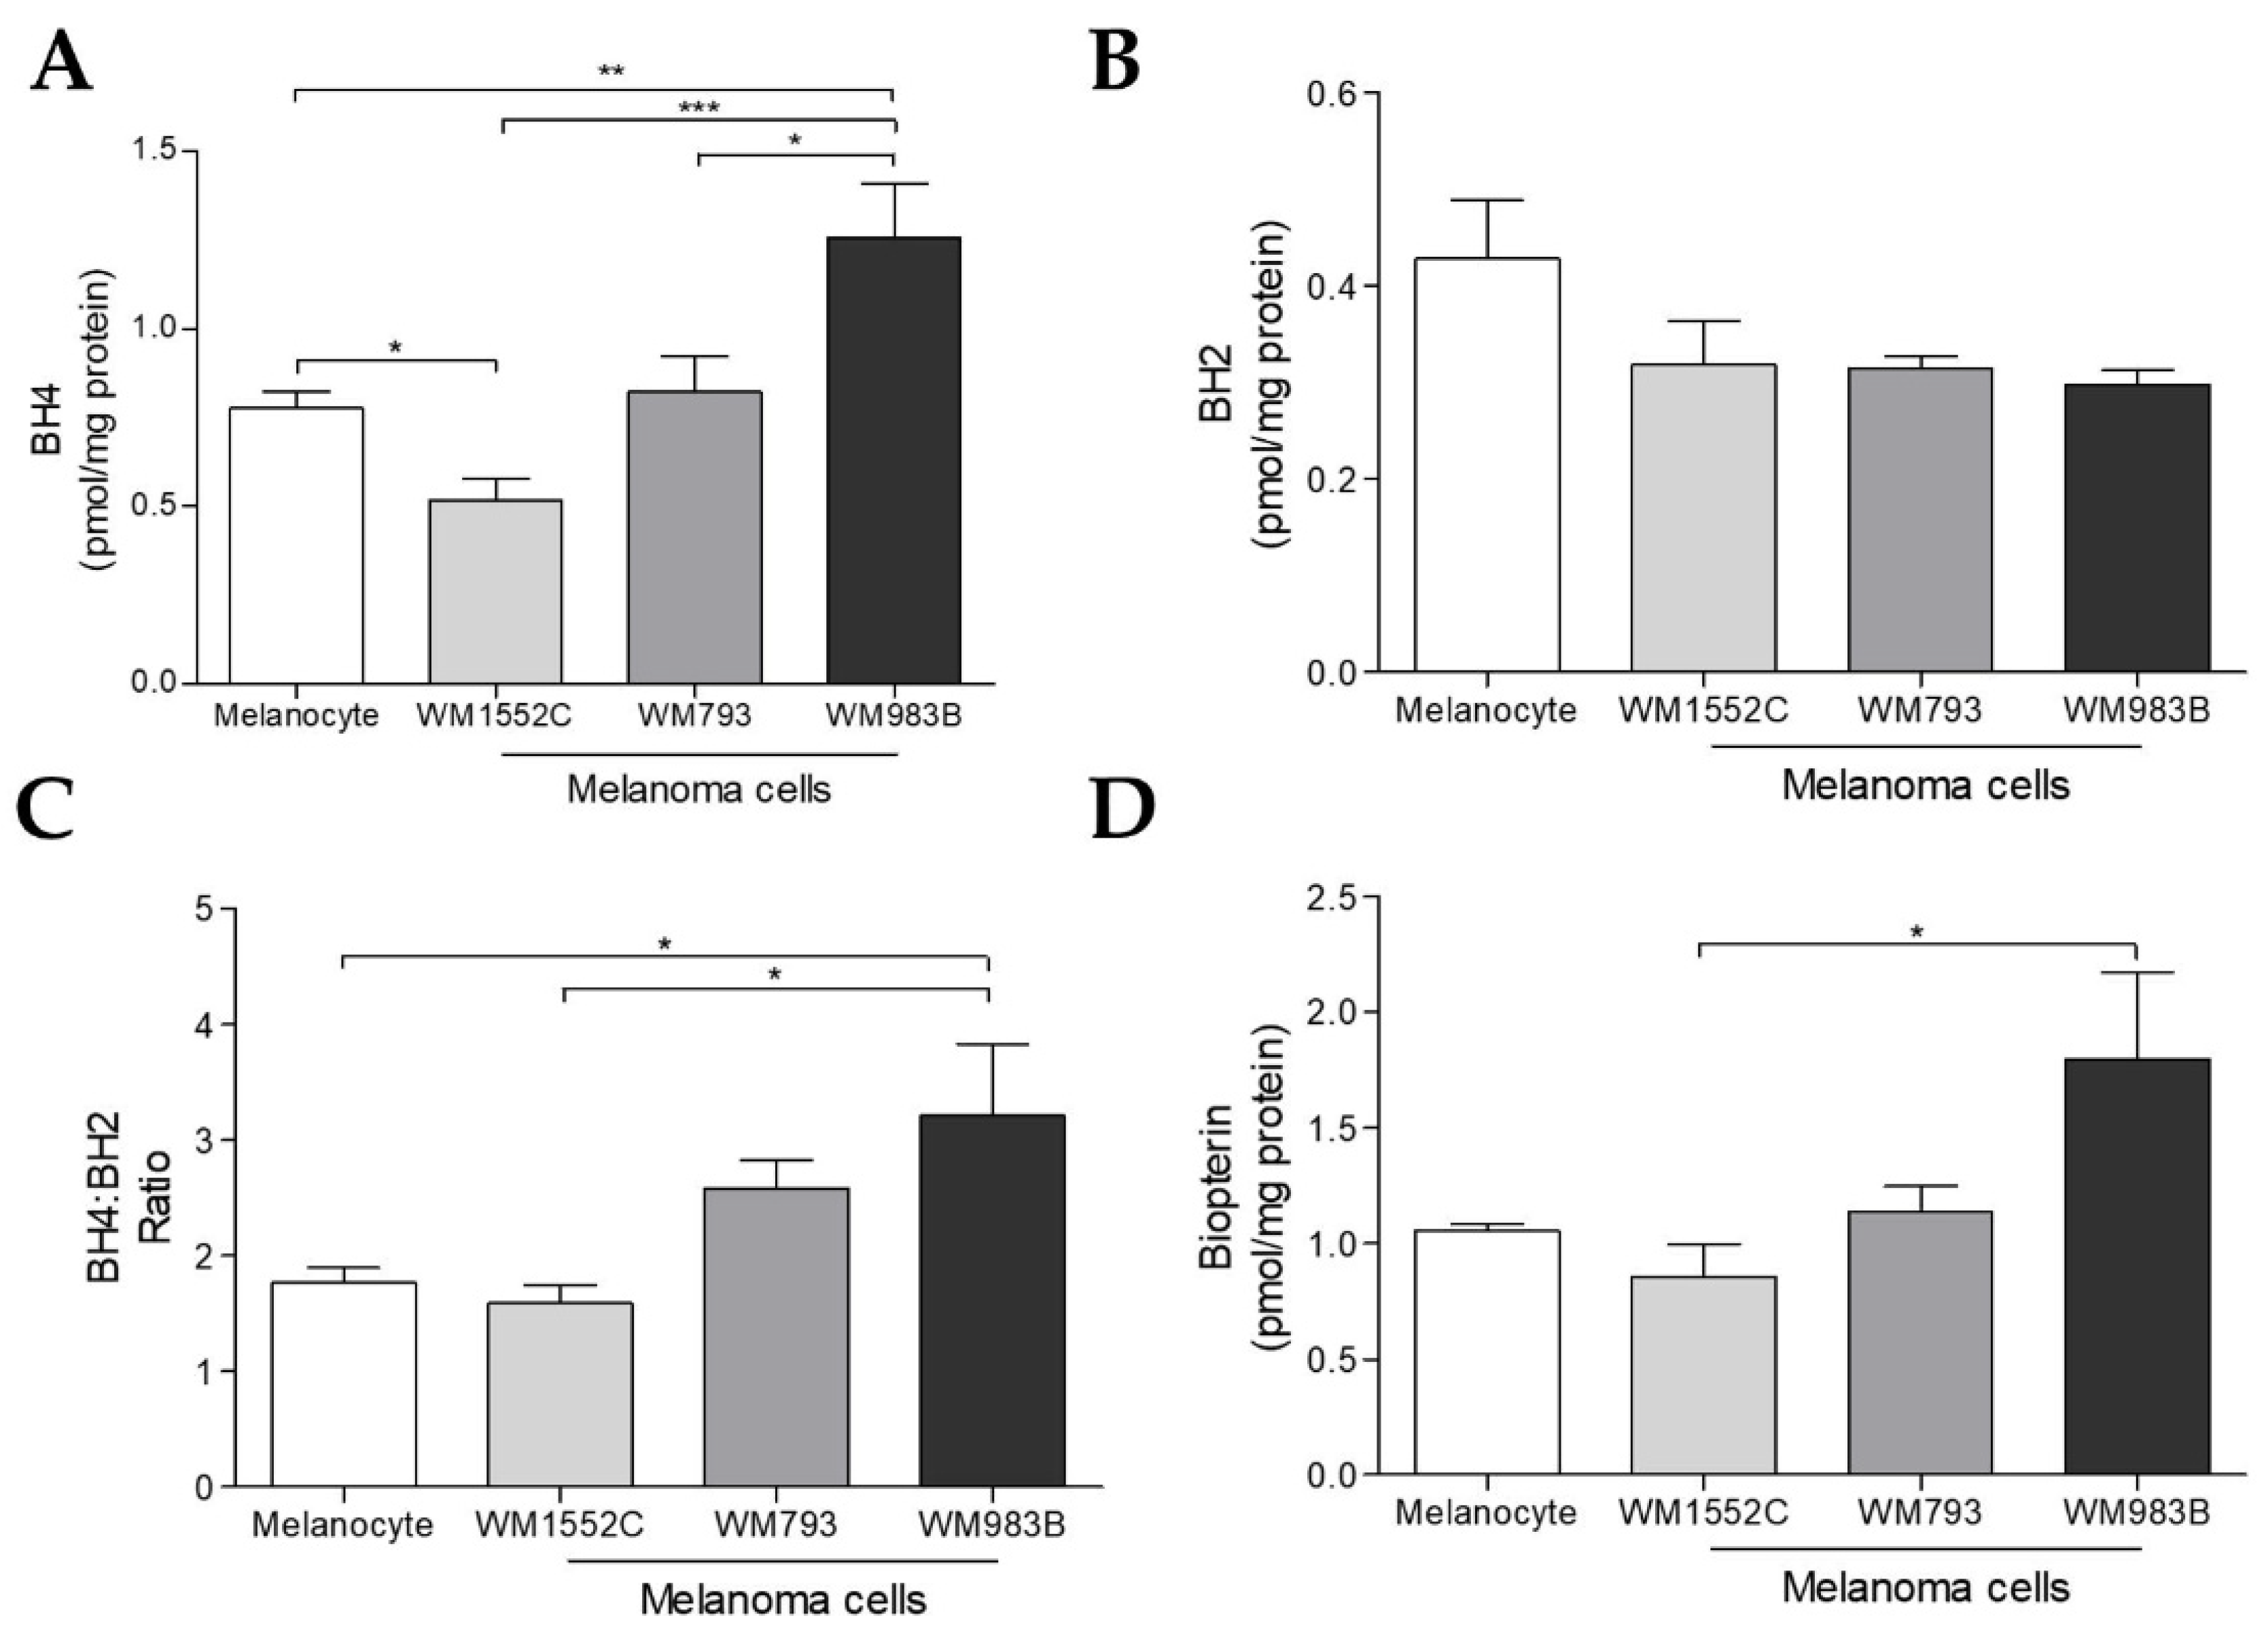
2.2. Tetrahydrobiopterin Concentration Is Elevated in Metastatic Melanoma Cells
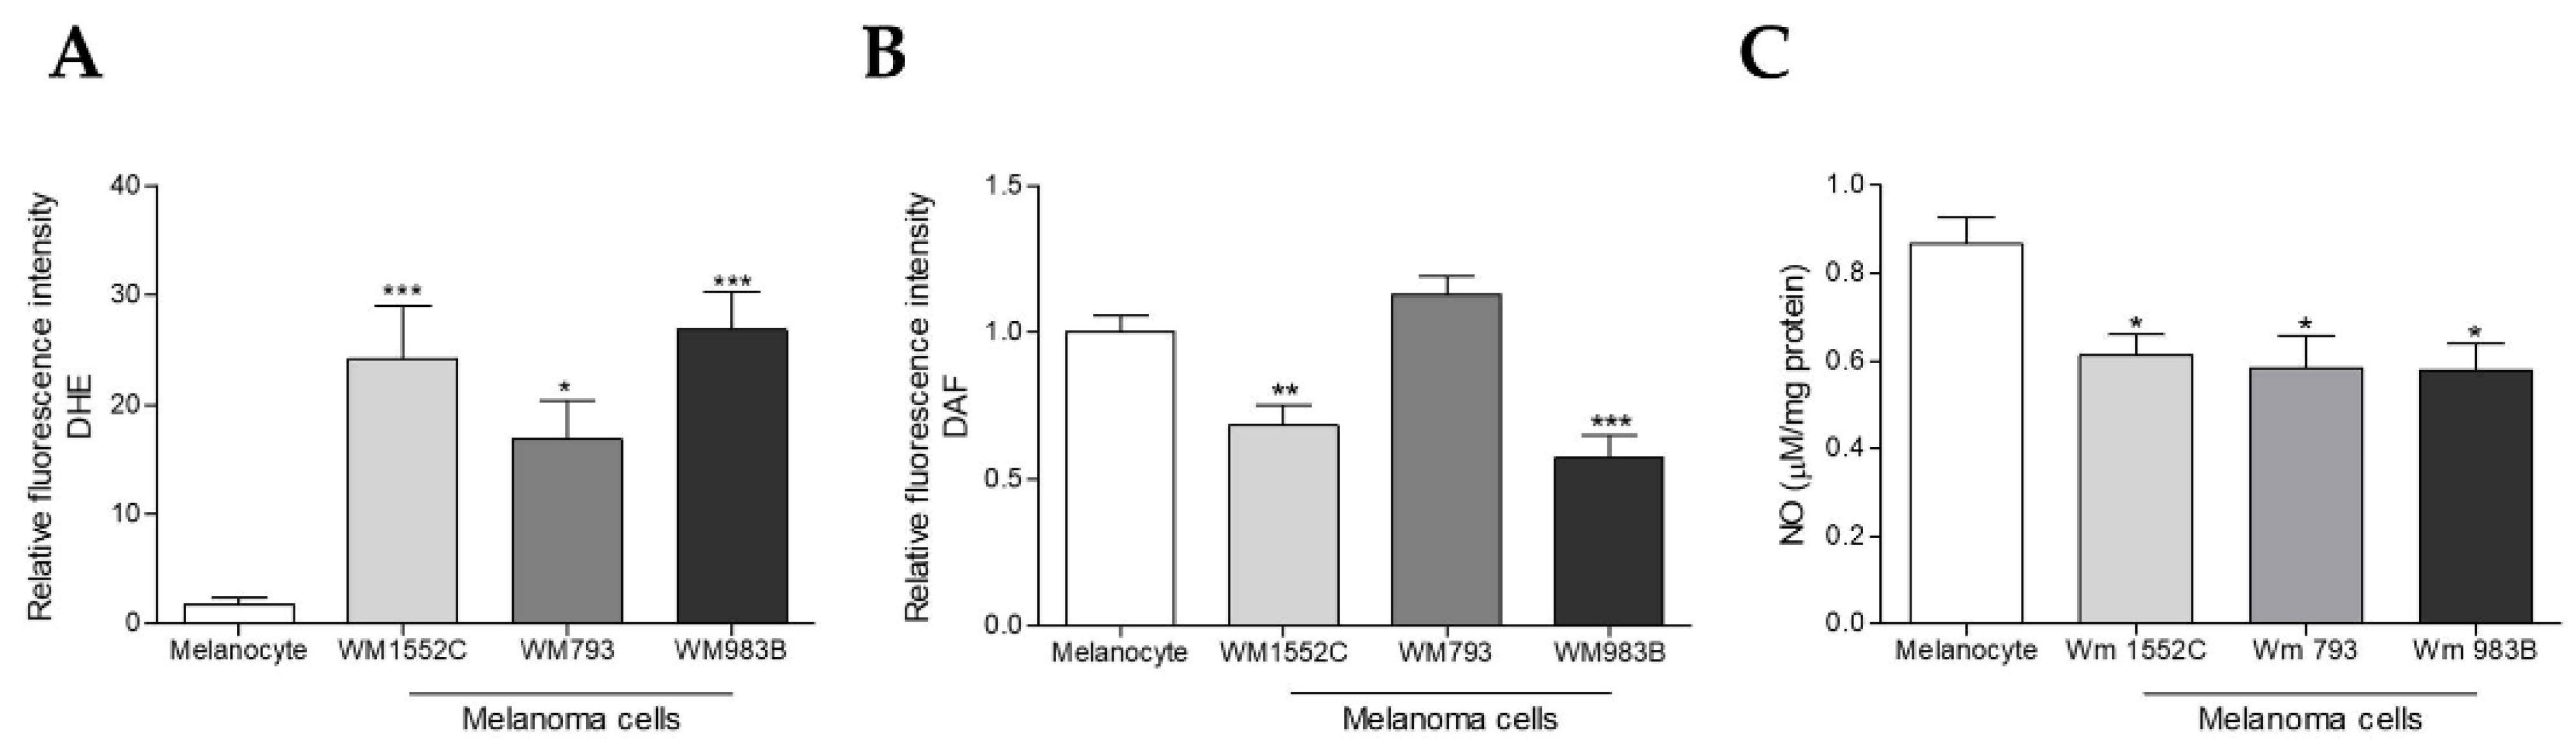
2.3. Melanoma Cells Show Increased Superoxide Anion Levels and Decreased Nitric Oxide Concentration
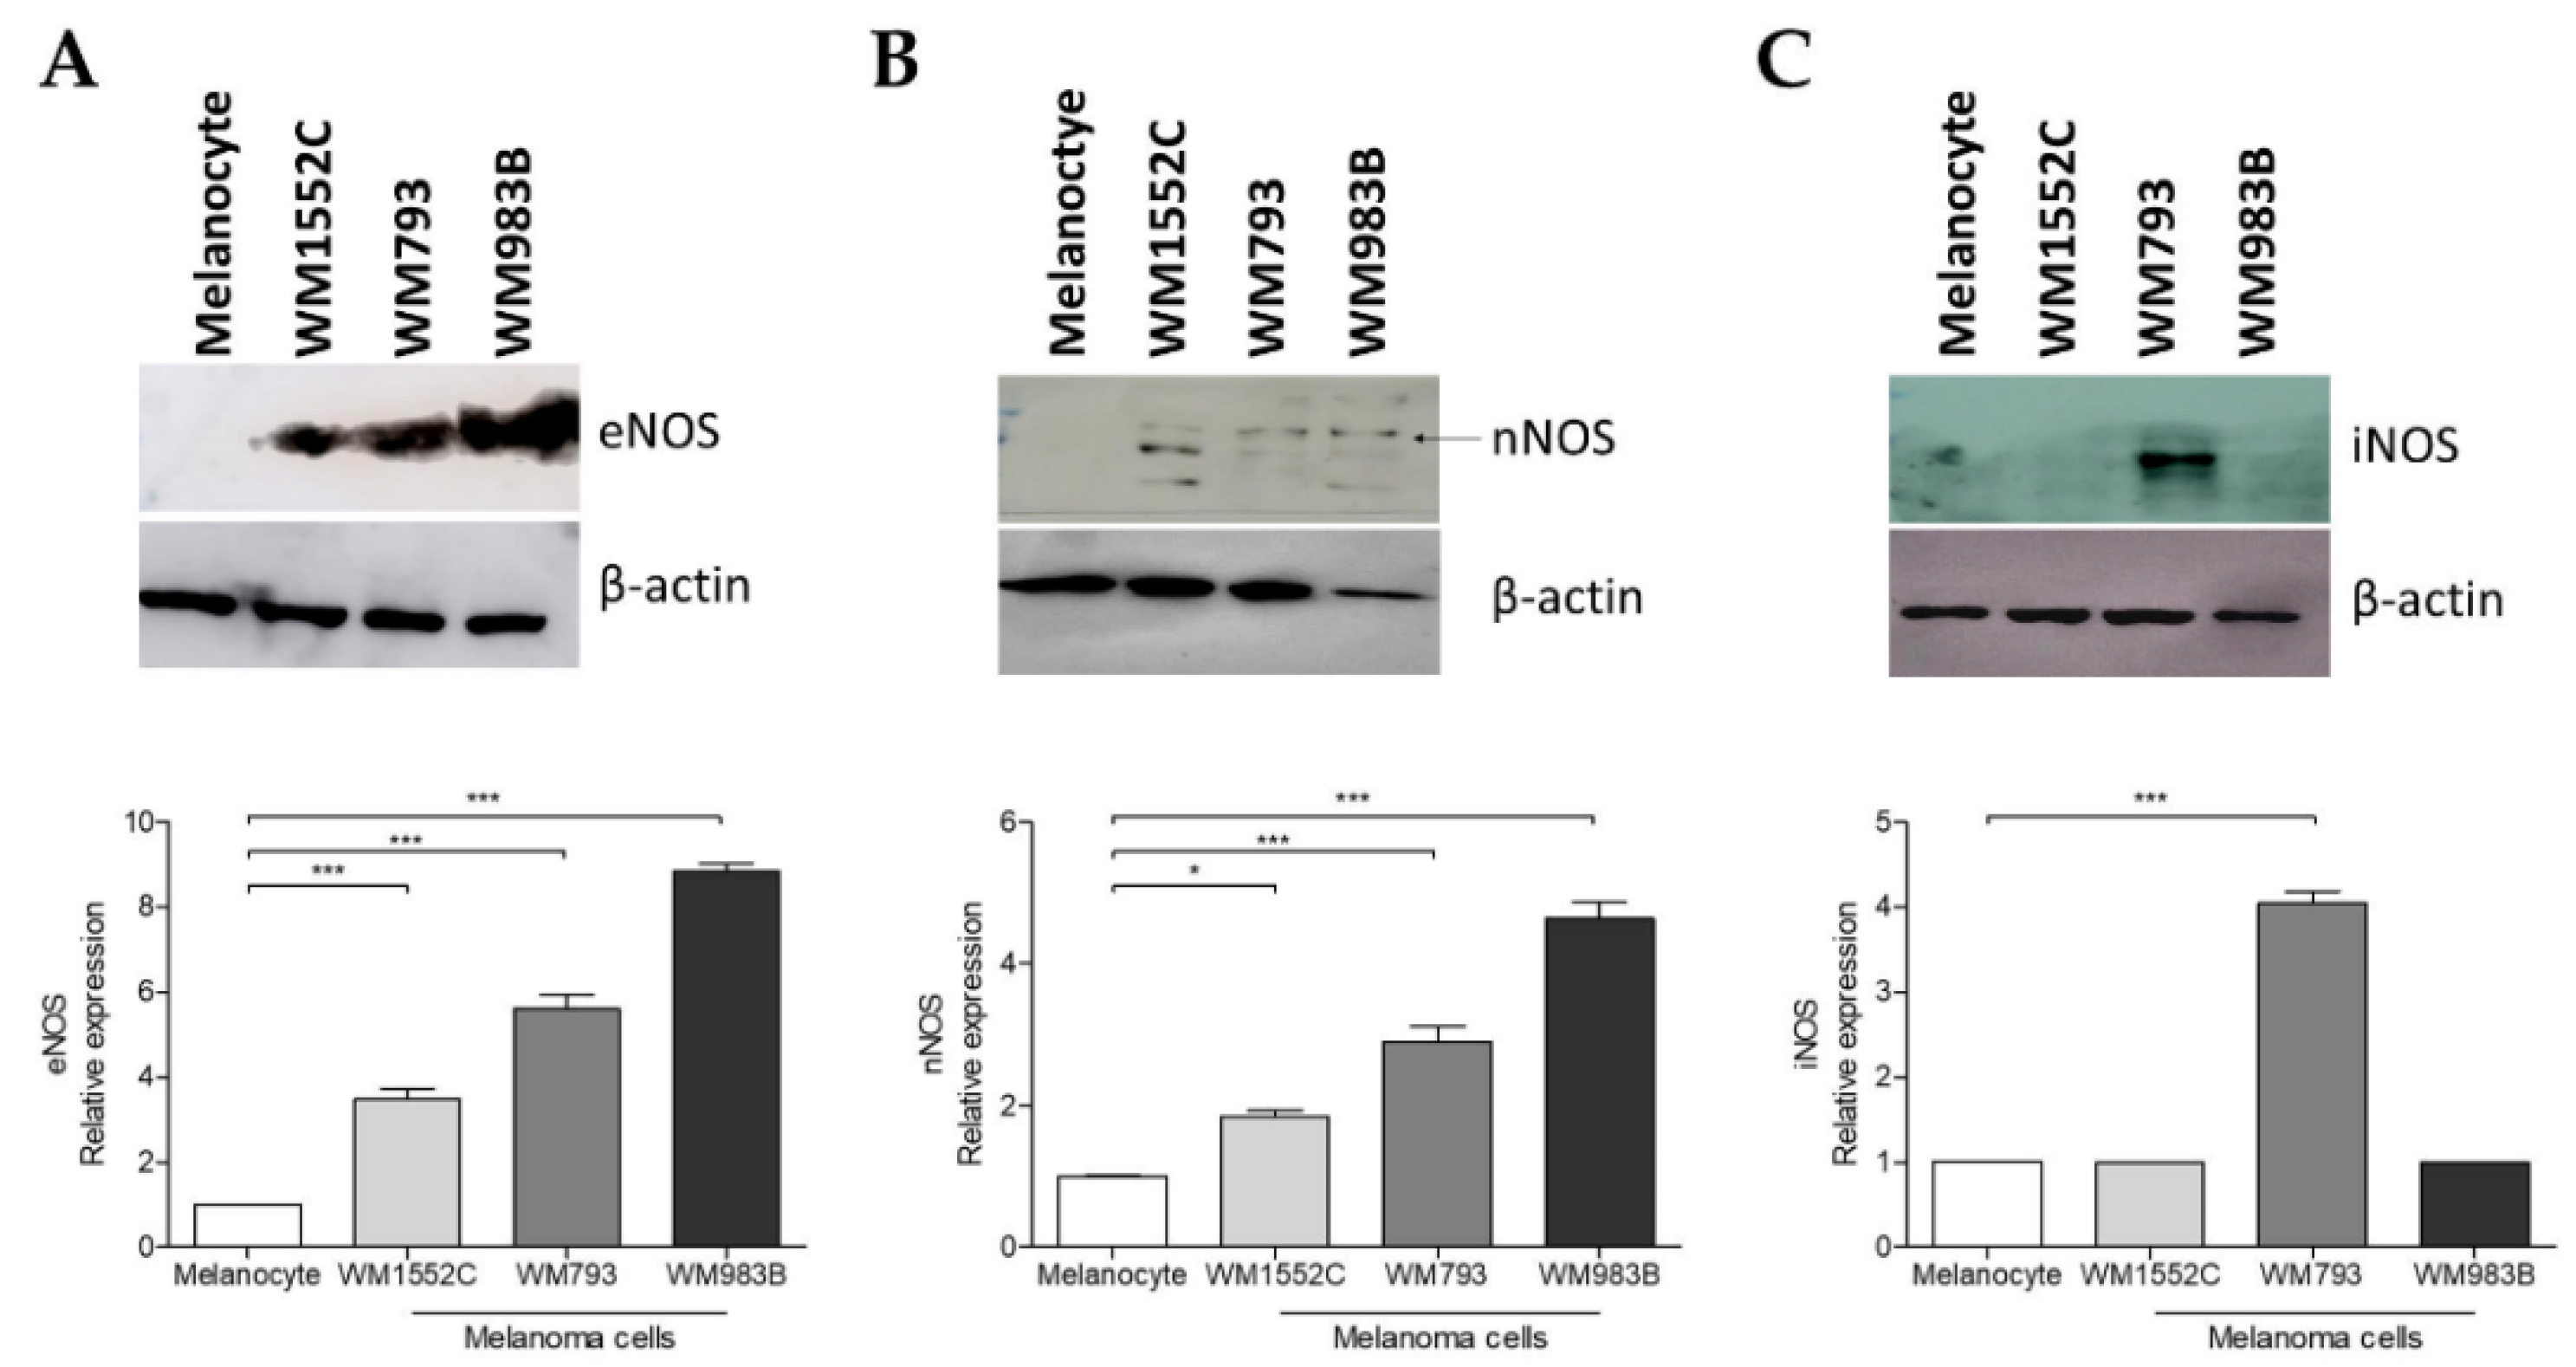
2.4. Increased Expression of Nitric Oxide Synthases in Melanoma Cells
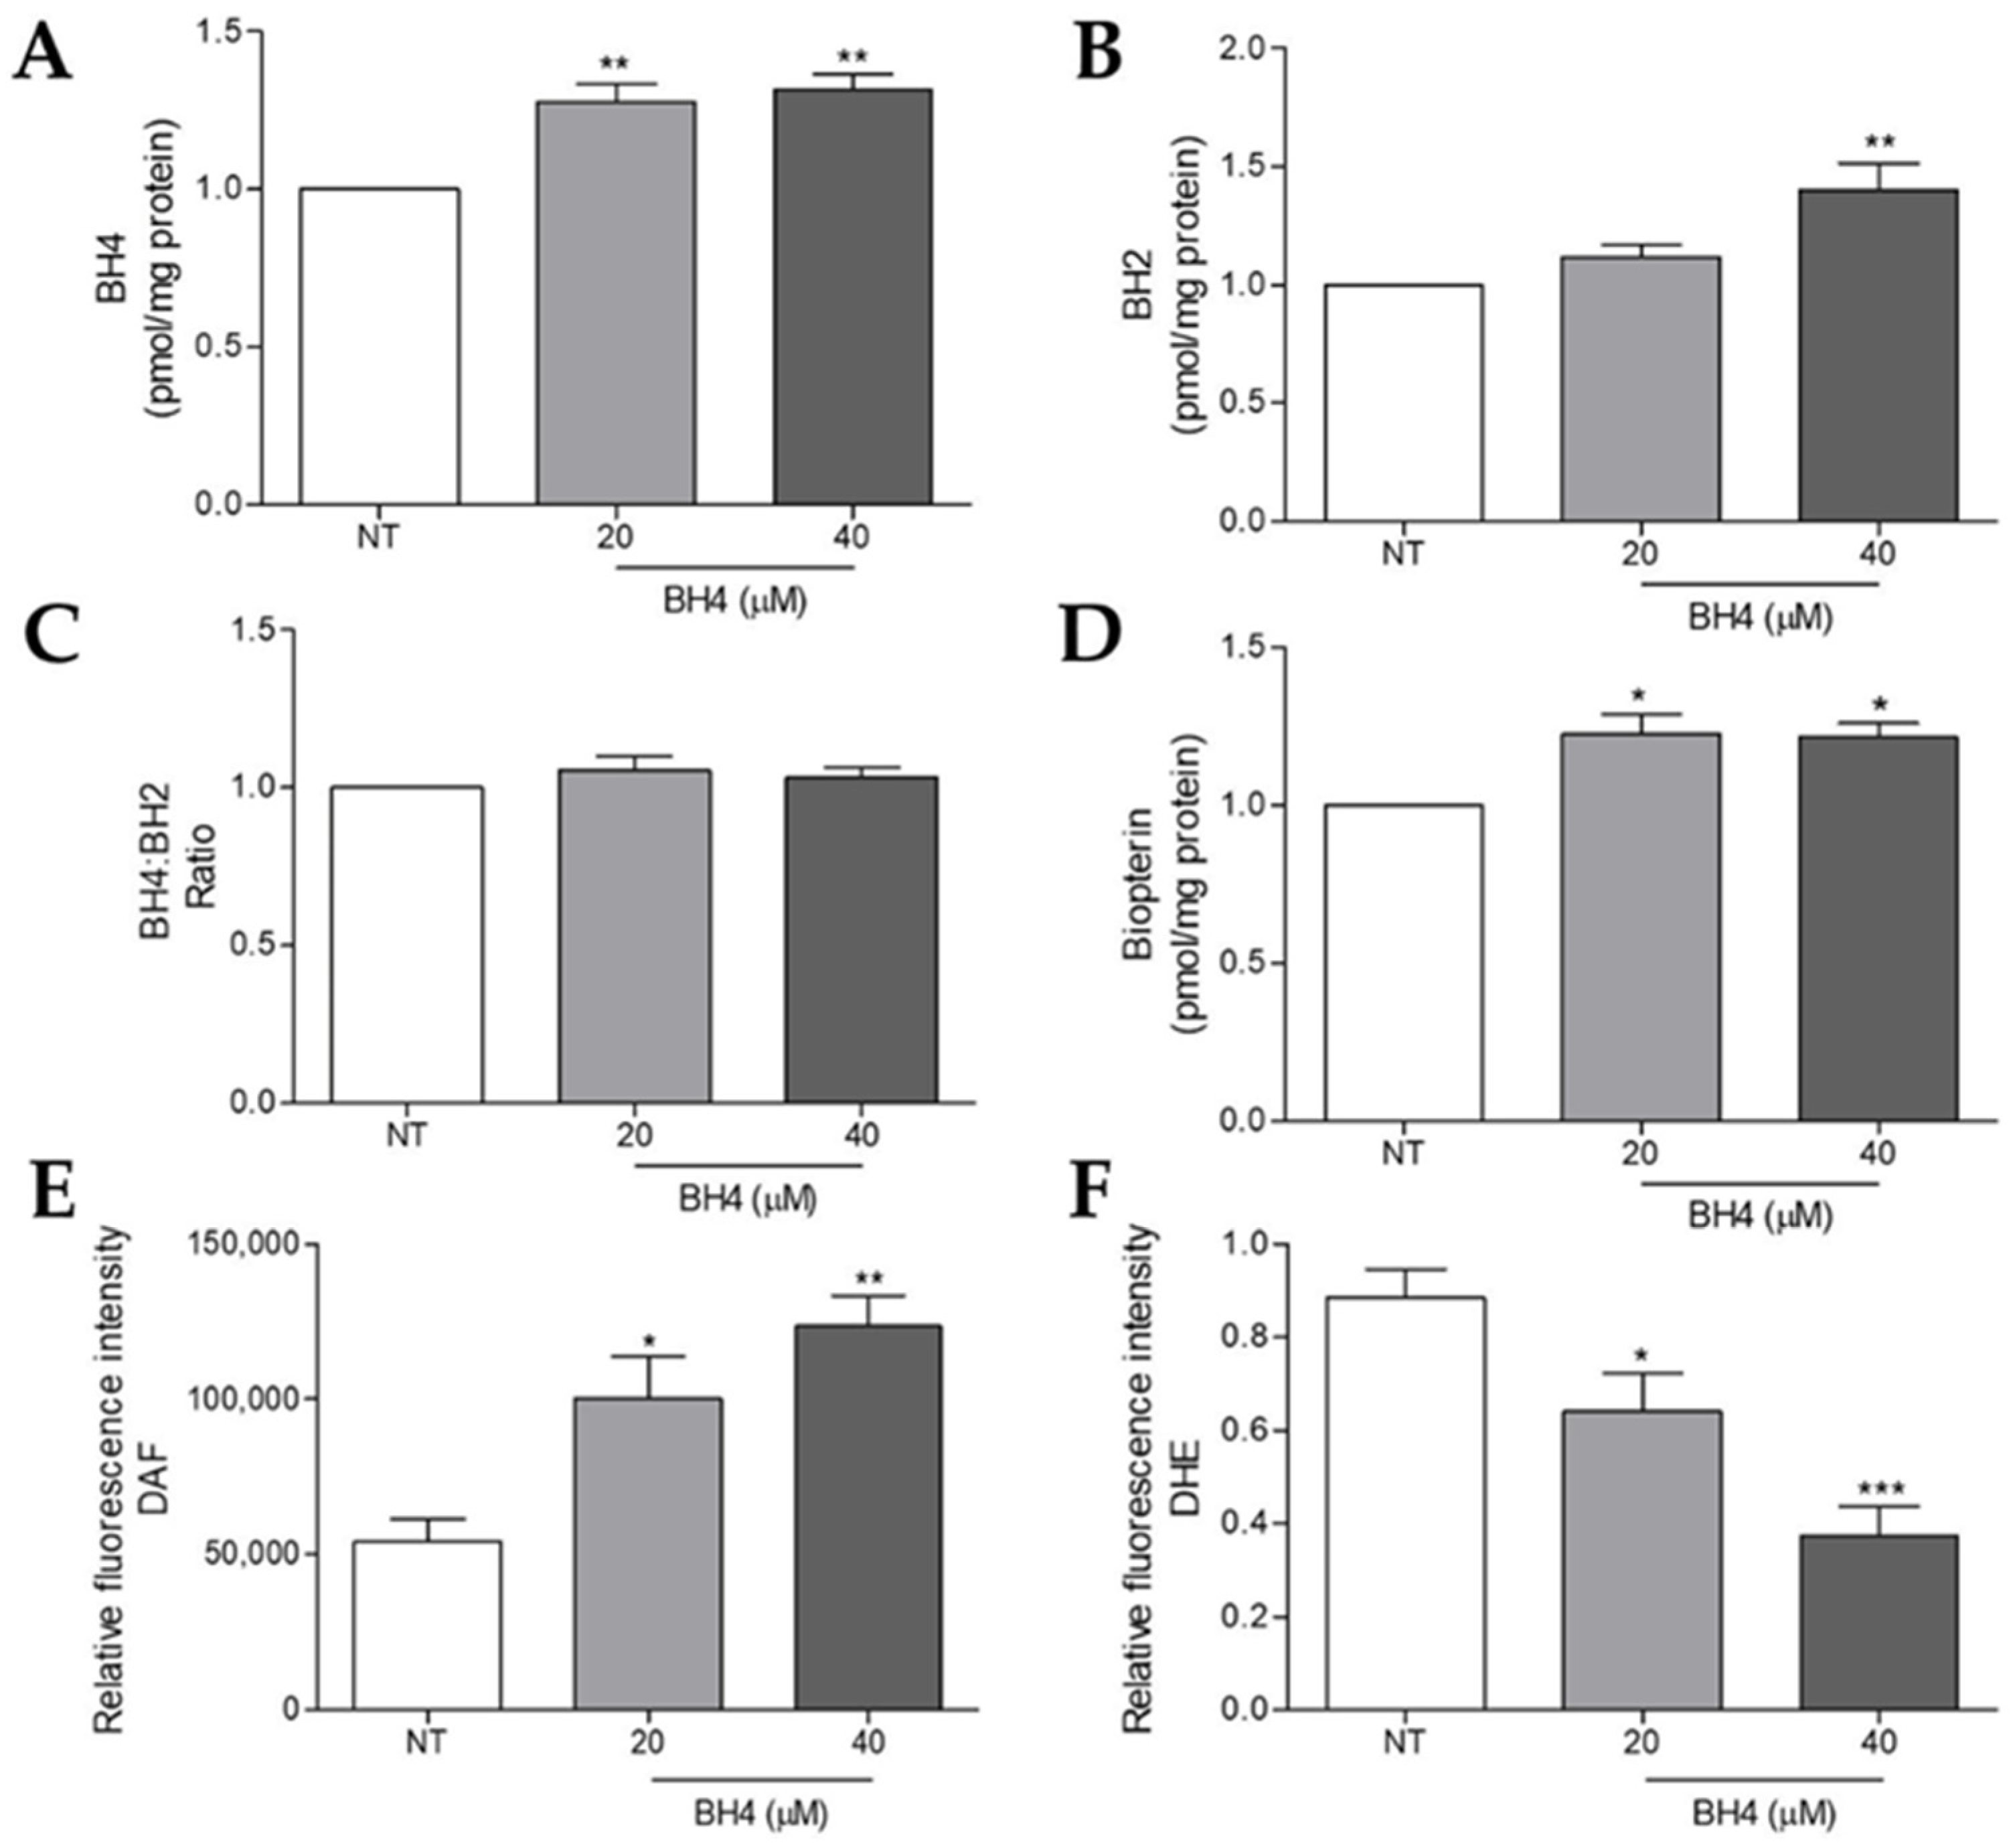
2.5. Tetrahydrobiopterin Supplementation Impairs Superoxide Anion and Increases Nitric Oxide Production in WM1552C Melanoma Cells
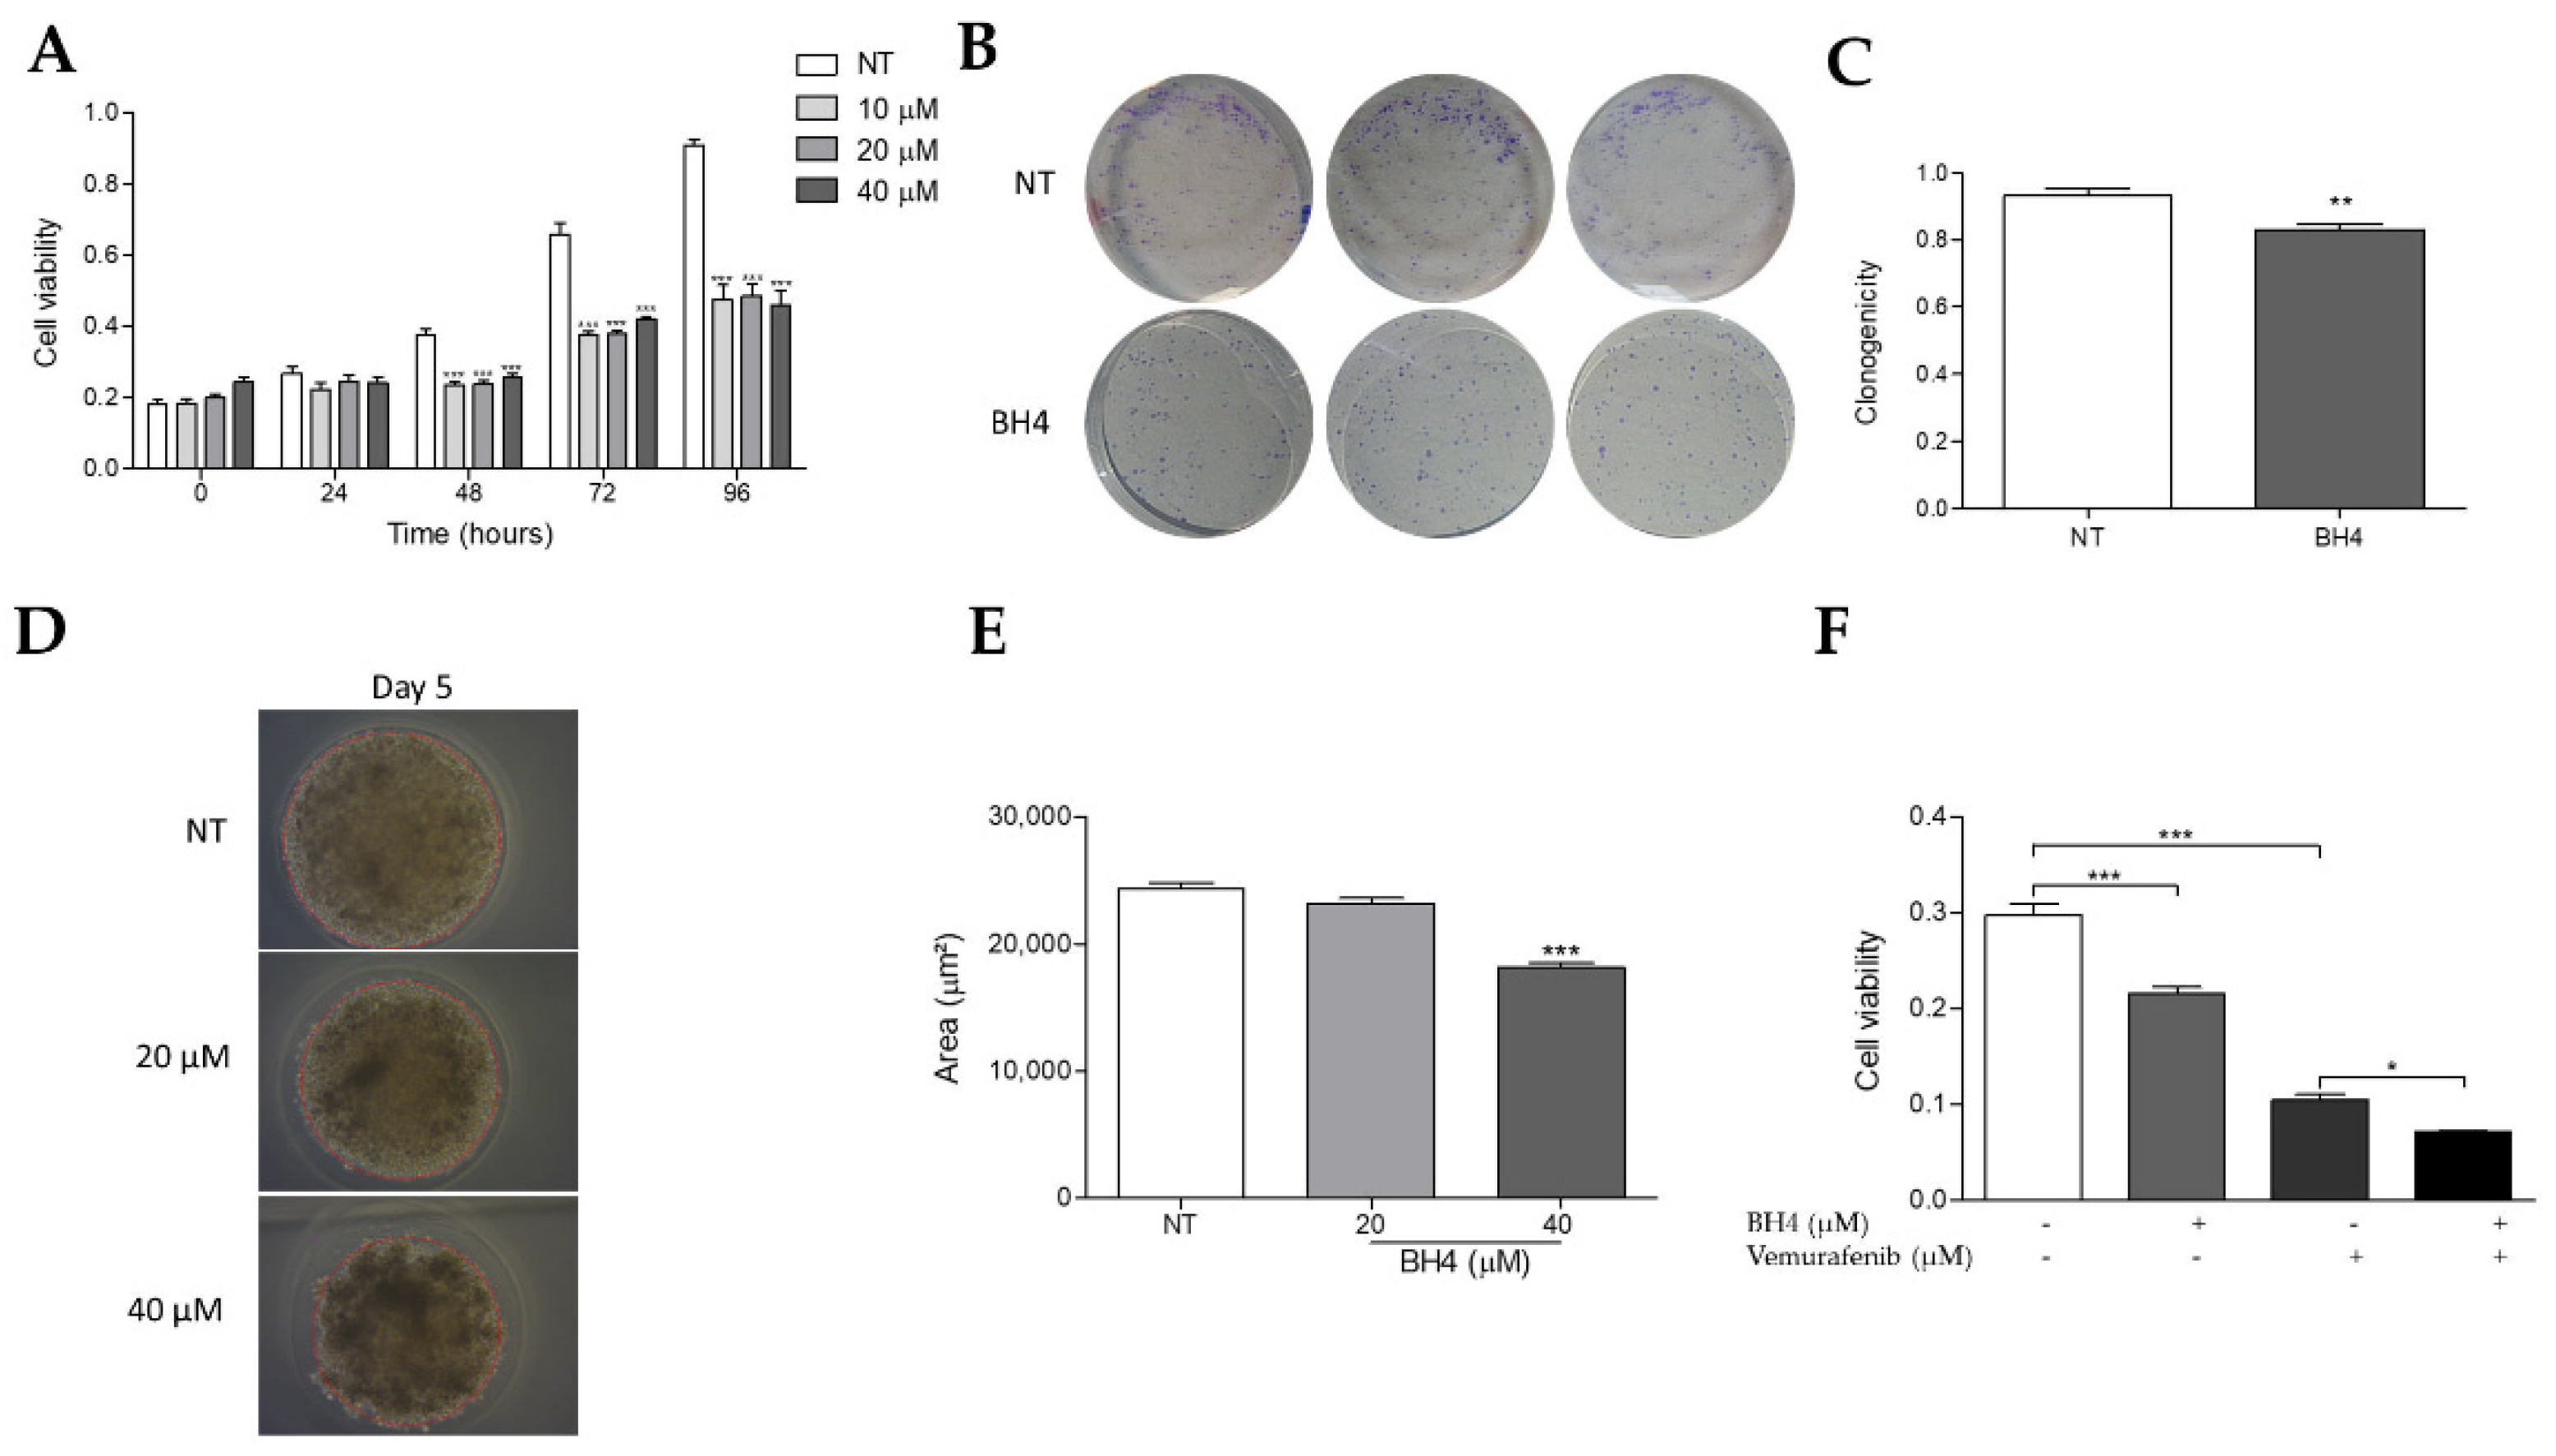
2.6. Tetrahydrobiopterin Inhibits the Growth of WM1552C Melanoma Cells
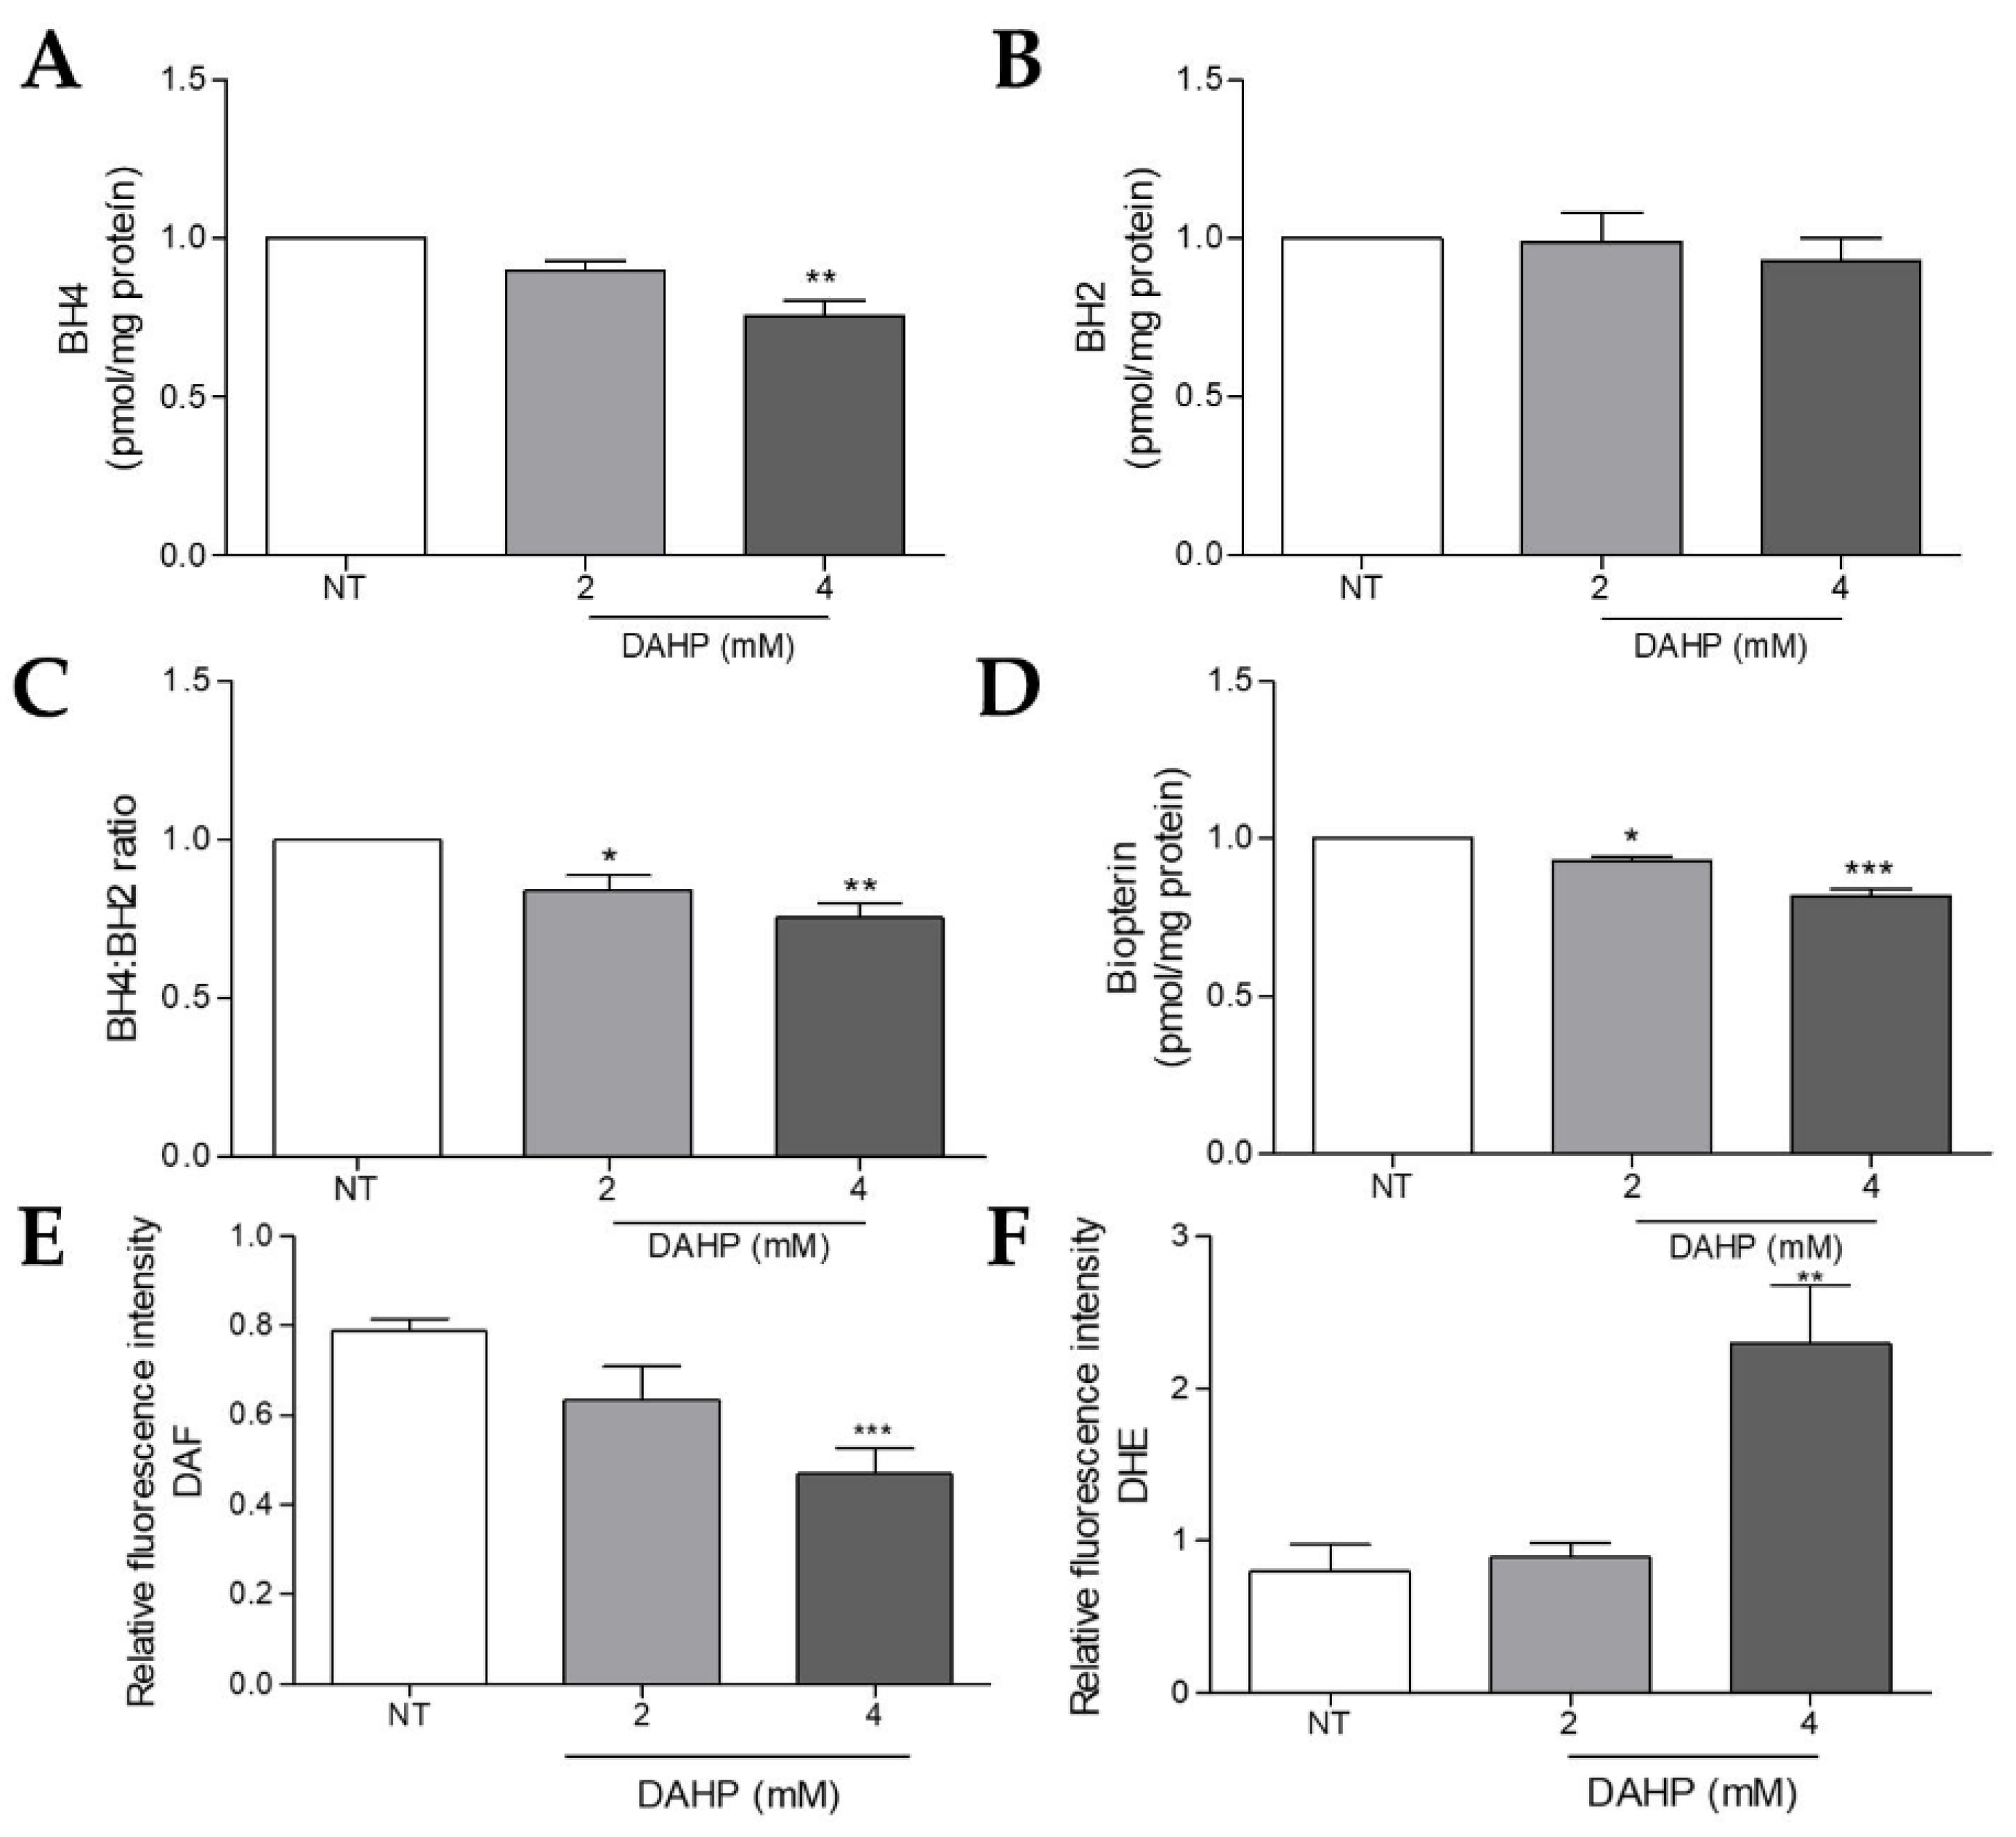
2.7. DAHP Supplementation Potentiated ROS Production and NO Loss by Decreasing BH4 Levels in WM983B Metastatic Melanoma Cells
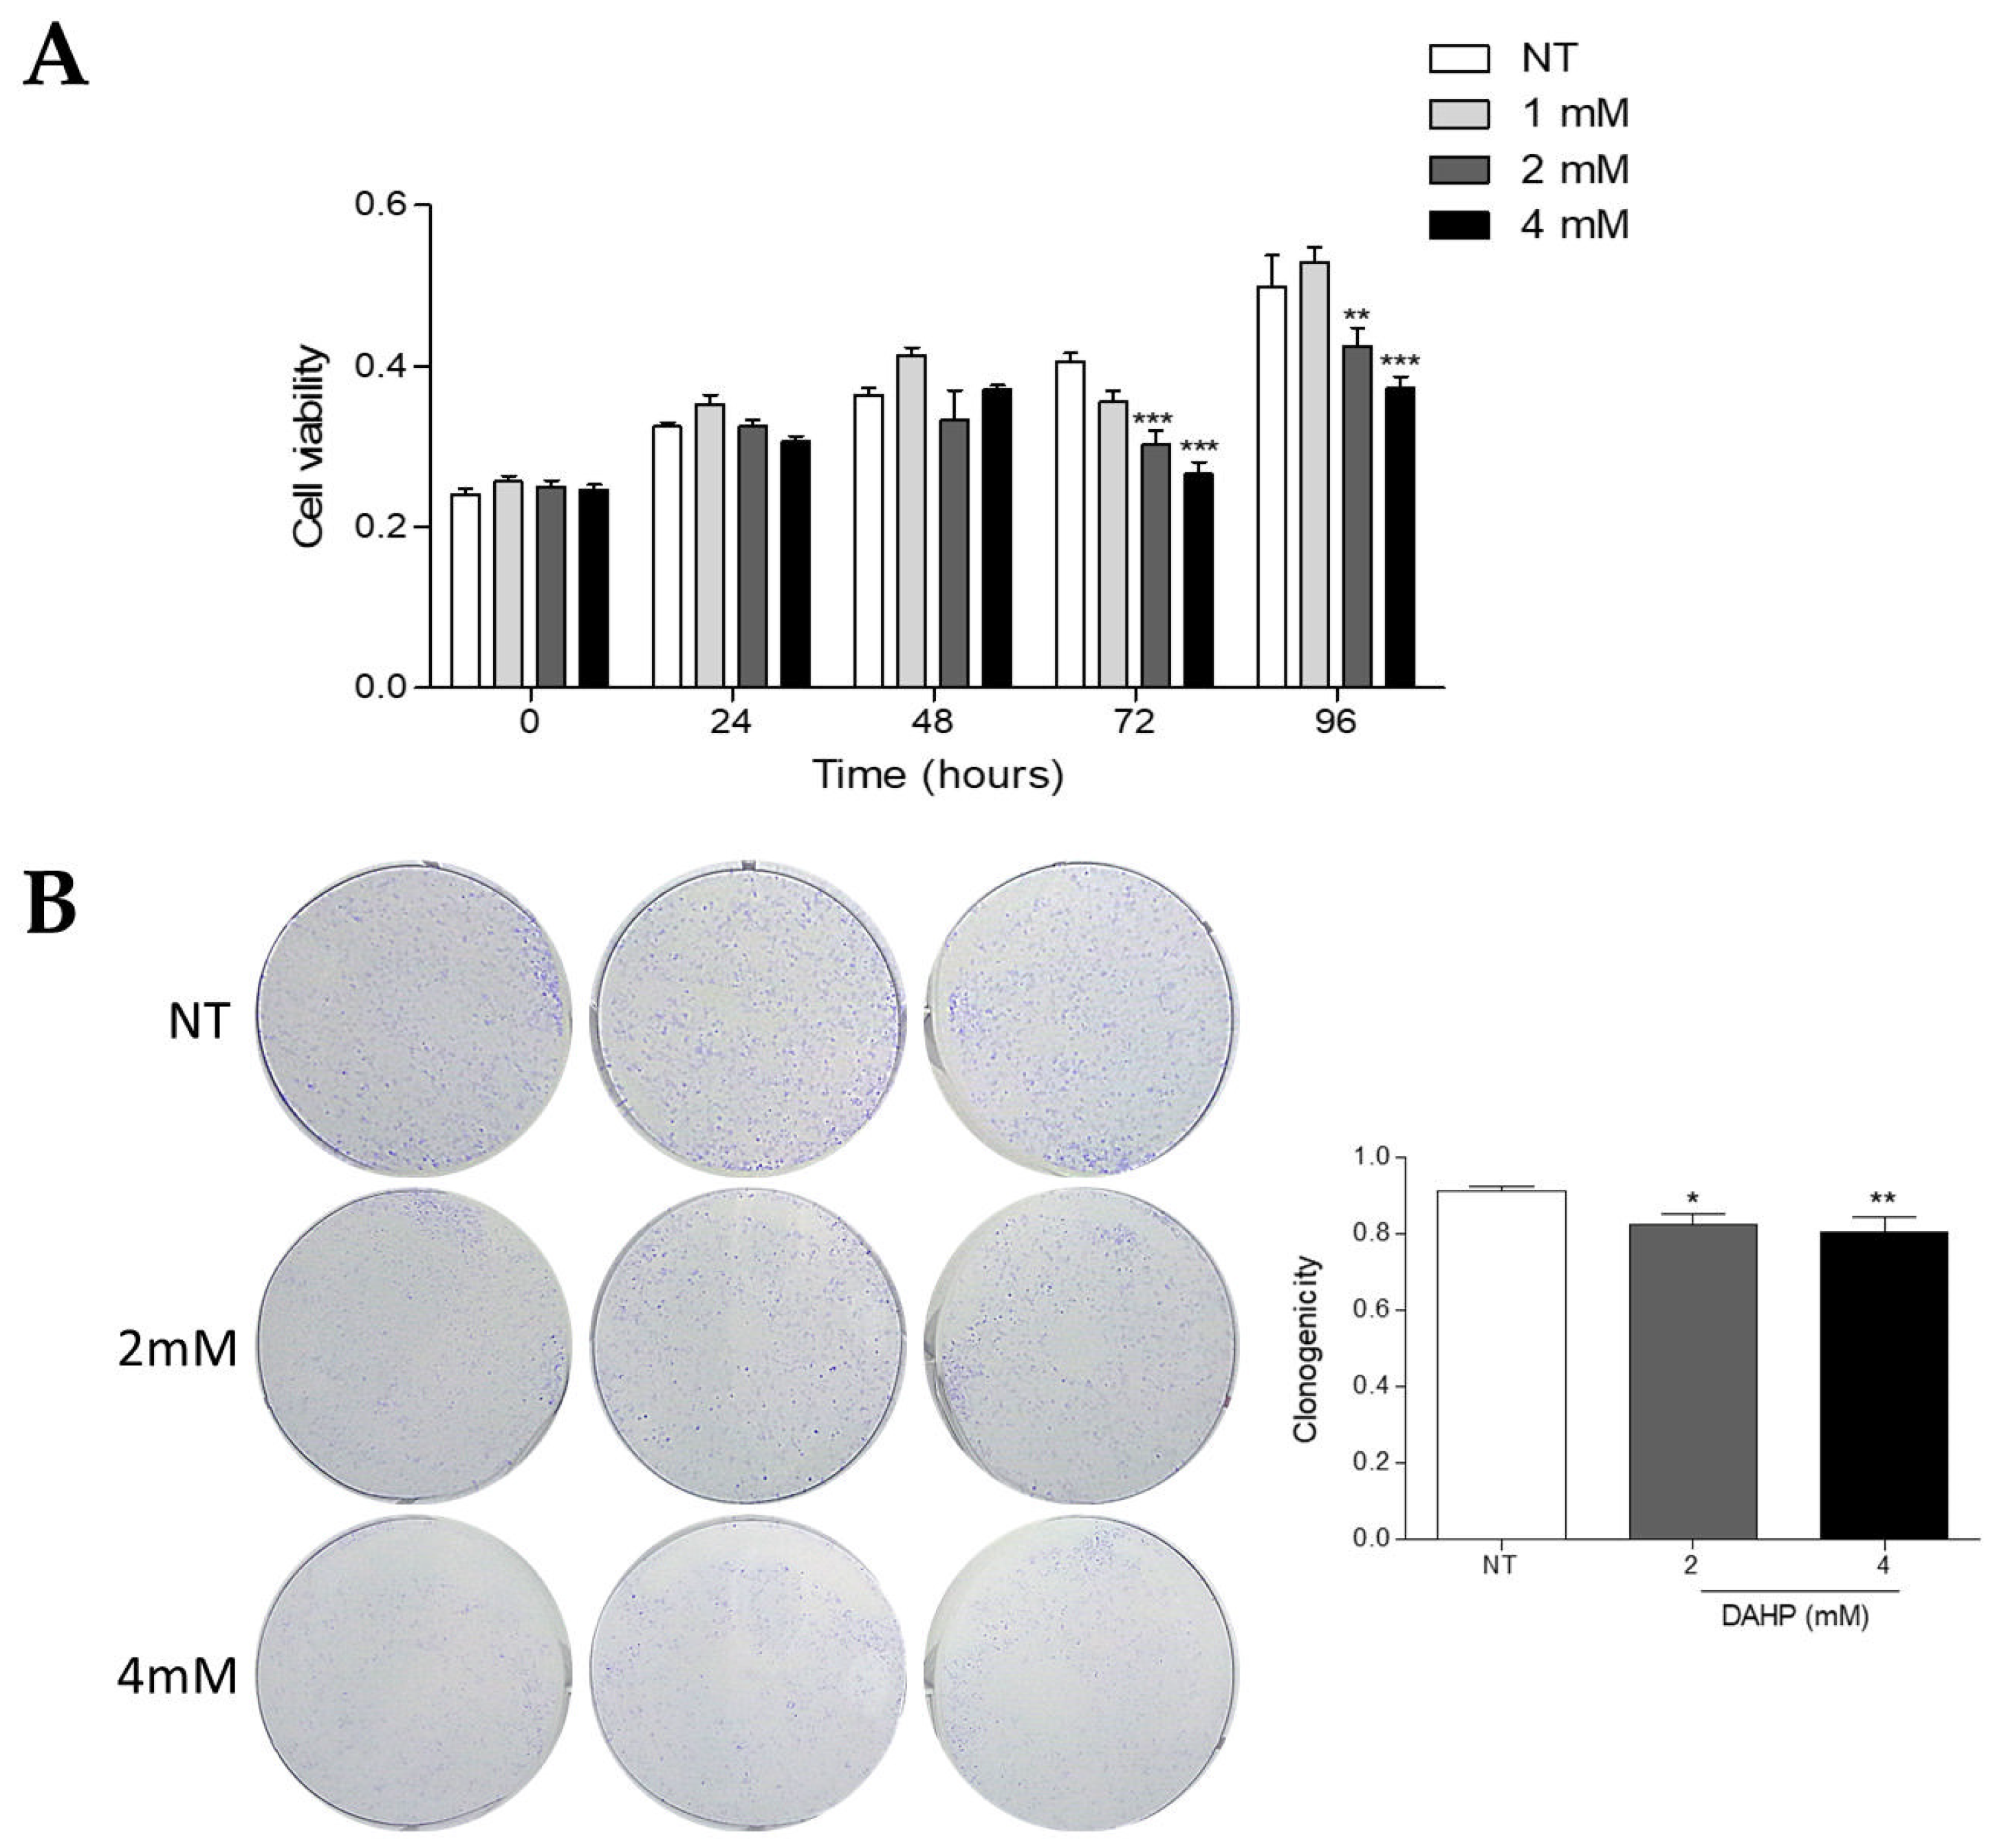
2.8. DAHP Inhibits the Growth of WM983B Metastatic Melanoma Cells
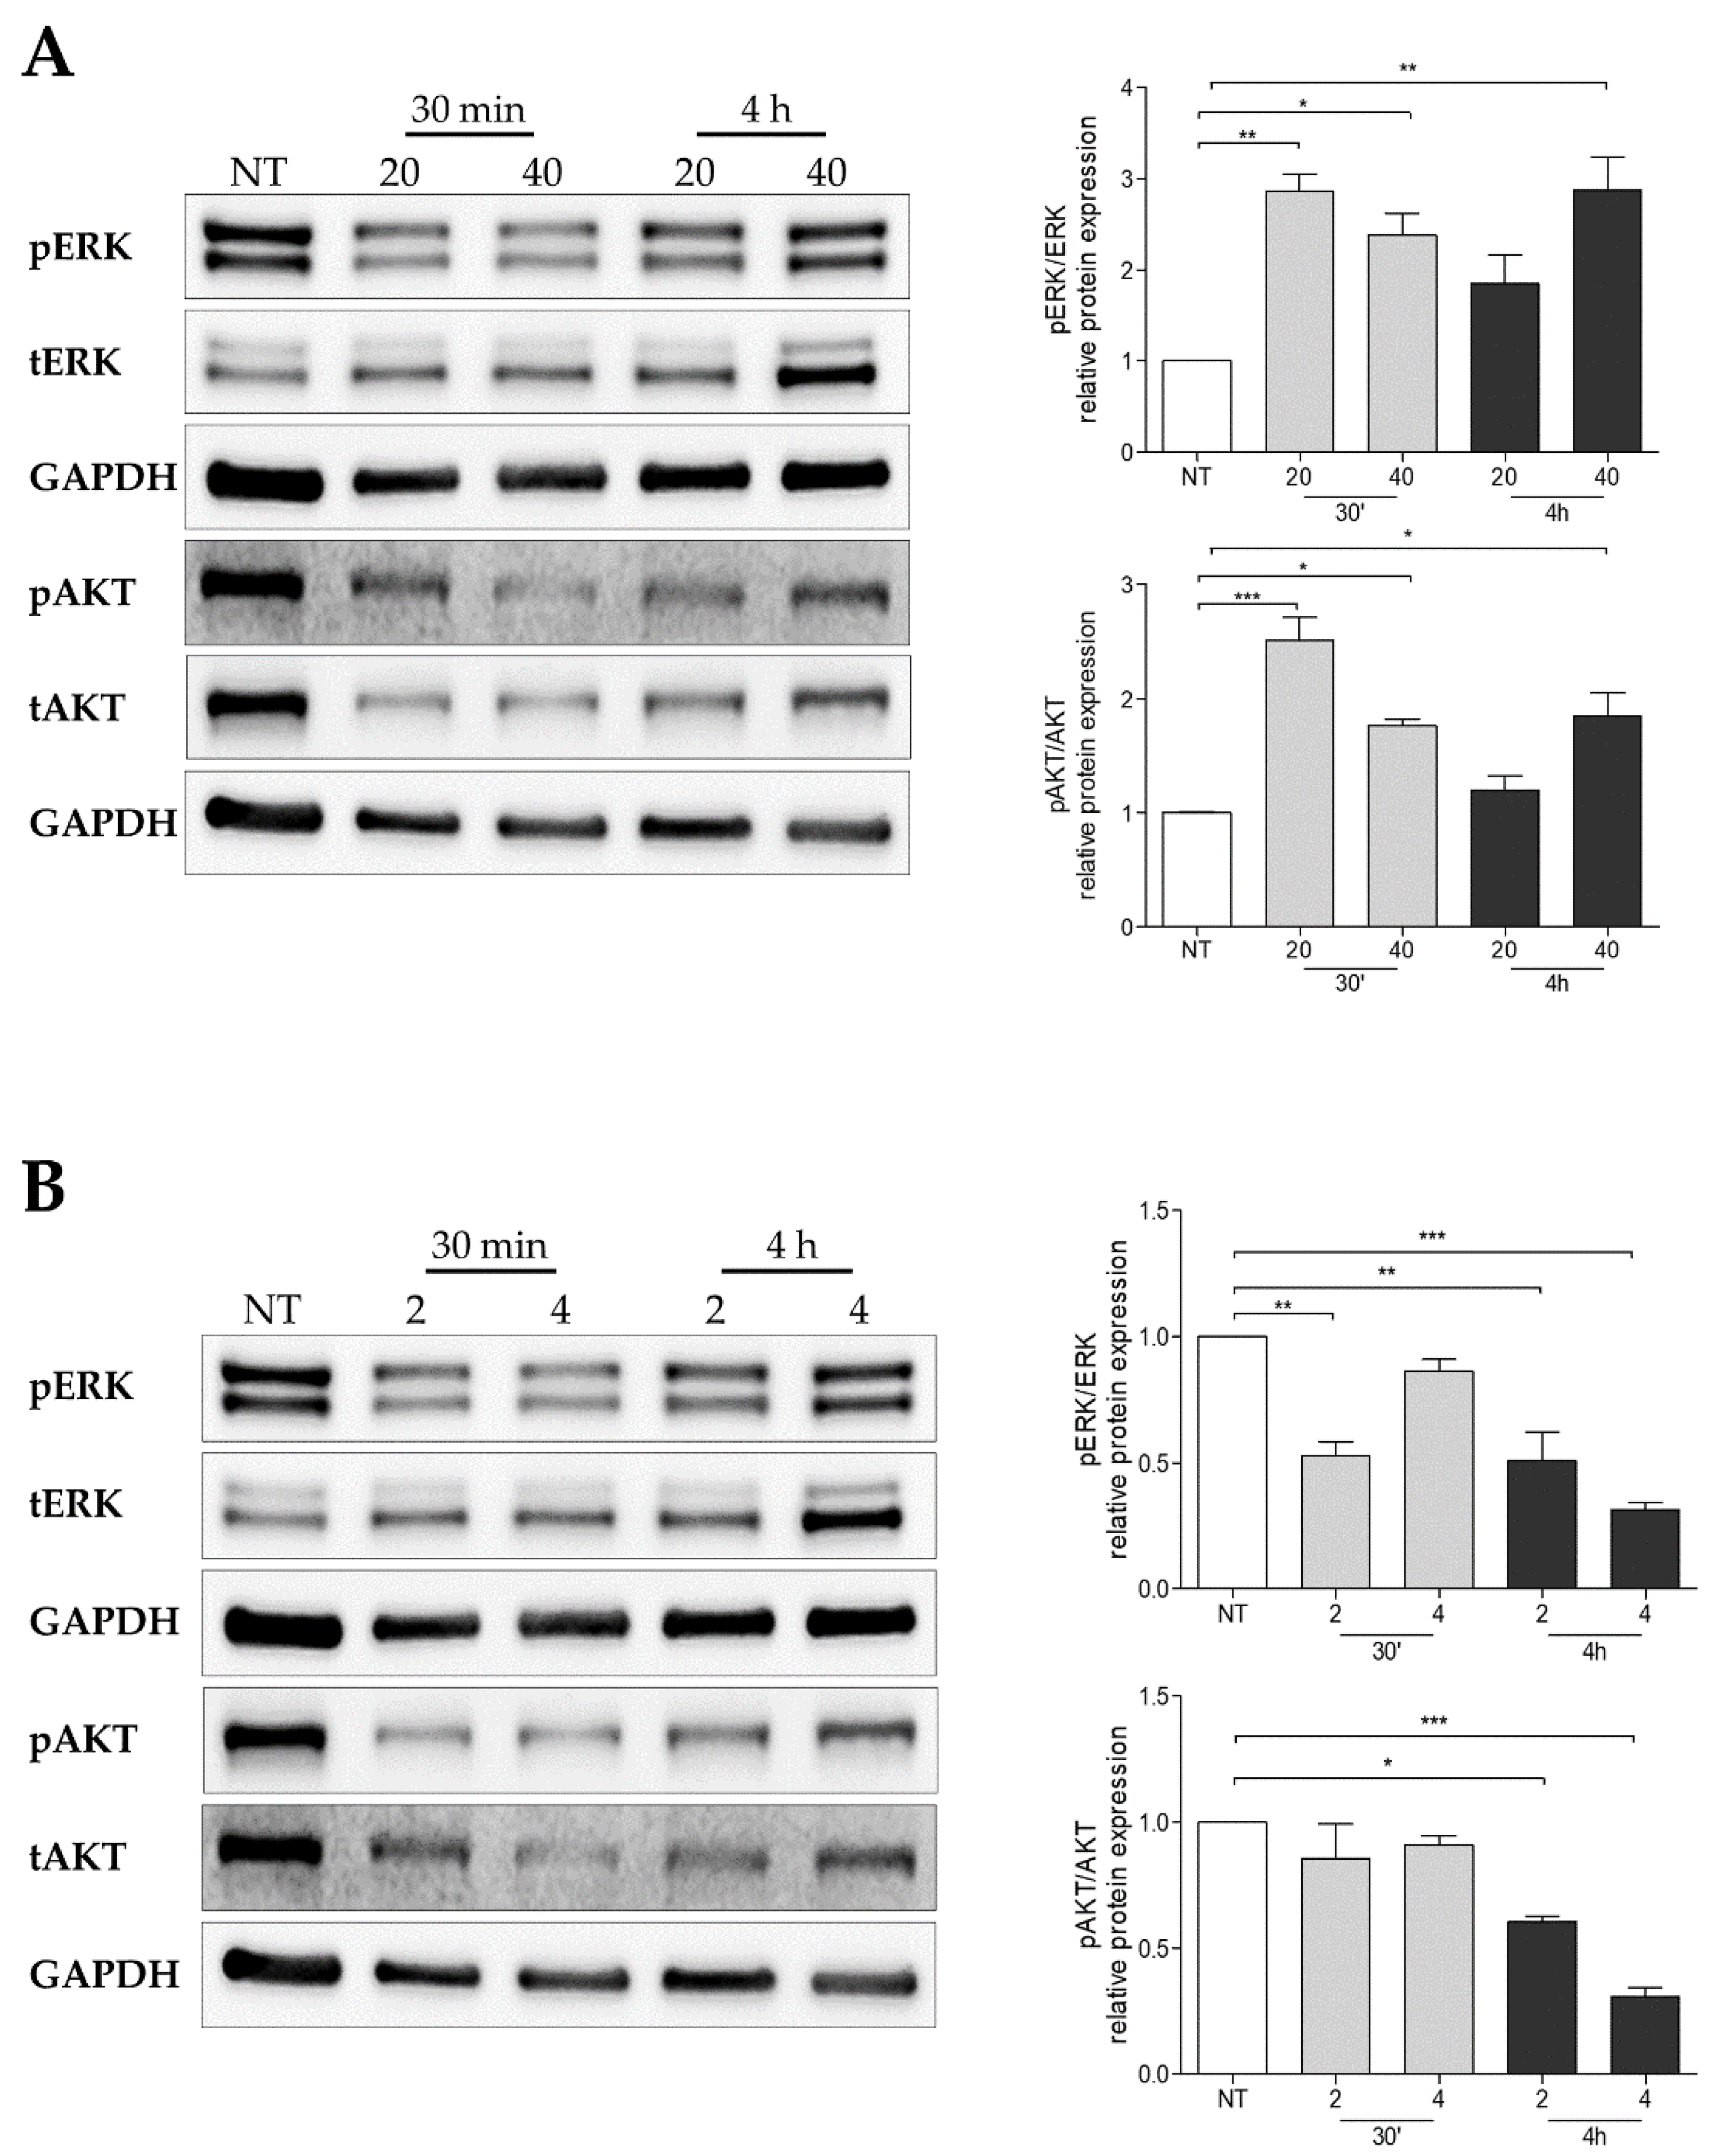
2.9. Pertubance of BH4 Metabolism Impairs Oncogenic Signaling Pathways in Melanoma Cells
3. Discussion
4. Materials and Methods
4.1. Cell Culture
4.2. Nitric Oxide Quantification
4.2.1. DAF-2DA
4.2.2. NO Analyzer
4.3. Reactive Oxygen Species Anion Quantification
4.4. High-Performance Liquid Chromatography Analysis of the Cellular Biopterin Content
4.5. RNAm Analysis
4.6. Western Blot
4.7. MTT Assay
4.8. Clonogenic Assay
4.9. Tumorsphere-Forming Assay
4.10. Statistical Analysis
Supplementary Materials
Author Contributions
Funding
Institutional Review Board Statement
Informed Consent Statement
Data Availability Statement
Conflicts of Interest
Abbreviations
| RGP | radial growth phase |
| VGP | vertical growth phase |
| NOS | nitric oxide synthase |
| NO | nitric oxide |
| ROS | reactive oxygen species |
| BH4 | tetrahydrobiopterin |
| BH2 | dihydrobiopterin |
| GTPCH1 | GTP cyclohydrolase protein |
| GCH1 | murine cyclohydrolase gene |
| PTPS | 6-pyruvoyltetrahydrobiopterin synthase protein |
| SR | sepiapterin reductase protein |
| GFRP | GTP feedback regulator protein |
| GCHFR | human GTP feedback regulator gene |
| DHFR | dihydrofolate reductase |
| DHPR | dihydropteridine reductase |
References
- Lo, J.A.; Fisher, D.E. The Melanoma Revolution: From UV Carcinogenesis to a New Era in Therapeutics. Science 2014, 346, 945–949. [Google Scholar] [CrossRef] [PubMed]
- Rastrelli, M.; Tropea, S.; Rossi, C.R.; Alaibac, M. Melanoma: Epidemiology, Risk Factors, Pathogenesis, Diagnosis and Classification. In Vivo 2014, 28, 1005–1011. [Google Scholar]
- Siegel, R.L.; Miller, K.D.; Fuchs, H.E.; Jemal, A. Cancer Statistics, 2021. CA Cancer J. Clin. 2021, 71, 7–33. [Google Scholar] [CrossRef] [PubMed]
- El Kharbili, M.; Cario, M.; Béchetoille, N.; Pain, C.; Boucheix, C.; Degoul, F.; Masse, I.; Berthier-Vergnes, O. Tspan8 Drives Melanoma Dermal Invasion by Promoting ProMMP-9 Activation and Basement Membrane Proteolysis in a Keratinocyte-Dependent Manner. Cancers 2020, 12, 1297. [Google Scholar] [CrossRef] [PubMed]
- Montor, W.R.; Salas, A.R.O.S.E.; de Melo, F.H.M. Receptor Tyrosine Kinases and Downstream Pathways as Druggable Targets for Cancer Treatment: The Current Arsenal of Inhibitors. Mol. Cancer 2018, 17, 55. [Google Scholar] [CrossRef]
- Luebker, S.A.; Koepsell, S.A. Diverse Mechanisms of BRAF Inhibitor Resistance in Melanoma Identified in Clinical and Preclinical Studies. Front. Oncol. 2019, 9, 268. [Google Scholar] [CrossRef]
- Gershenwald, J.E.; Scolyer, R.A.; Hess, K.R.; Sondak, V.K.; Long, G.V.; Ross, M.I.; Lazar, A.J.; Faries, M.B.; Kirkwood, J.M.; McArthur, G.A.; et al. Melanoma Staging: Evidence-Based Changes in the American Joint Committee on Cancer Eighth Edition Cancer Staging Manual. CA Cancer J. Clin. 2017, 67, 472–492. [Google Scholar] [CrossRef]
- Akbani, R.; Akdemir, K.C.; Aksoy, B.A.; Albert, M.; Ally, A.; Amin, S.B.; Arachchi, H.; Arora, A.; Auman, J.T.; Ayala, B.; et al. Genomic Classification of Cutaneous Melanoma. Cell 2015, 161, 1681–1696. [Google Scholar] [CrossRef]
- Berger, M.F.; Hodis, E.; Heffernan, T.P.; Deribe, Y.L.; Lawrence, M.S.; Protopopov, A.; Ivanova, E.; Watson, I.R.; Nickerson, E.; Ghosh, P.; et al. Melanoma Genome Sequencing Reveals Frequent PREX2 Mutations. Nature 2012, 485, 502–506. [Google Scholar] [CrossRef]
- Krauthammer, M.; Kong, Y.; Ha, B.H.; Evans, P.; Bacchiocchi, A.; McCusker, J.P.; Cheng, E.; Davis, M.J.; Goh, G.; Choi, M.; et al. Exome Sequencing Identifies Recurrent Somatic RAC1 Mutations in Melanoma. Nat. Genet. 2012, 44, 1006–1014. [Google Scholar] [CrossRef]
- Hodis, E.; Watson, I.R.; Kryukov, G.V.; Arold, S.T.; Imielinski, M.; Theurillat, J.P.; Nickerson, E.; Auclair, D.; Li, L.; Place, C.; et al. A Landscape of Driver Mutations in Melanoma. Cell 2012, 150, 251–263. [Google Scholar] [CrossRef] [PubMed]
- Molognoni, F.; De Melo, F.H.M.; Da Silva, C.T.; Jasiulionis, M.G. Ras and Rac1, Frequently Mutated in Melanomas, Are Activated by Superoxide Anion, Modulate Dnmt1 Level and Are Causally Related to Melanocyte Malignant Transformation. PLoS ONE 2013, 8, e81937. [Google Scholar] [CrossRef] [PubMed]
- Bagati, A.; Moparthy, S.; Fink, E.E.; Bianchi-Smiraglia, A.; Yun, D.H.; Kolesnikova, M.; Udartseva, O.O.; Wolff, D.W.; Roll, M.V.; Lipchick, B.C.; et al. KLF9-Dependent ROS Regulate Melanoma Progression in Stage-Specific Manner. Oncogene 2019, 38, 3585–3597. [Google Scholar] [CrossRef] [PubMed]
- Zhou, S.; Sakamoto, K. Pyruvic Acid/Ethyl Pyruvate Inhibits Melanogenesis in B16F10 Melanoma Cells through PI3K/AKT, GSK3β, and ROS-ERK Signaling Pathways. Genes Cells 2019, 24, 60–69. [Google Scholar] [CrossRef]
- Meitzler, J.L.; Makhlouf, H.R.; Antony, S.; Wu, Y.; Butcher, D.; Jiang, G.; Juhasz, A.; Lu, J.; Dahan, I.; Jansen-Dürr, P.; et al. Decoding NADPH Oxidase 4 Expression in Human Tumors. Redox Biol. 2017, 13, 182–195. [Google Scholar] [CrossRef] [PubMed]
- Chong, S.J.F.; Lai, J.X.H.; Qu, J.; Hirpara, J.; Kang, J.; Swaminathan, K.; Loh, T.; Kumar, A.; Vali, S.; Abbasi, T.; et al. A Feedforward Relationship between Active Rac1 and Phosphorylated Bcl-2 Is Critical for Sustaining Bcl-2 Phosphorylation and Promoting Cancer Progression. Cancer Lett. 2019, 457, 151–167. [Google Scholar] [CrossRef]
- Rodrigues, M.F.; Obre, E.; De Melo, F.H.M.; Santos, G.C.; Galina, A.; Jasiulionis, M.G.; Rossignol, R.; Rumjanek, F.D.; Amoê, N.D. Enhanced OXPHOS, Glutaminolysis and β-Oxidation Constitute the Metastatic Phenotype of Melanoma Cells. Biochem. J. 2016, 473, 703–715. [Google Scholar] [CrossRef]
- Campos, A.C.E.; Molognoni, F.; Melo, F.H.M.; Galdieri, L.C.; Carneiro, C.R.W.; D’Almeida, V.; Correa, M.; Jasiulionis, M.G. Oxidative Stress Modulates DNA Methylation during Melanocyte Anchorage Blockade Associated with Malignant Transformation. Neoplasia 2007, 9, 1111. [Google Scholar] [CrossRef]
- Melo, F.H.M.; Molognoni, F.; Morais, A.S.; Toricelli, M.; Mouro, M.G.; Higa, E.M.S.; Lopes, J.D.; Jasiulionis, M.G. Endothelial Nitric Oxide Synthase Uncoupling as a Key Mediator of Melanocyte Malignant Transformation Associated with Sustained Stress Conditions. Free Radic. Biol. Med. 2011, 50, 1263–1273. [Google Scholar] [CrossRef]
- Gonçalves, D.A.; Xisto, R.; Gonçalves, J.D.; da Silva, D.B.; Soares, J.P.M.; Icimoto, M.Y.; Sant’Anna, C.; Gimenez, M.; de Angelis, K.; Llesuy, S.; et al. Imbalance between Nitric Oxide and Superoxide Anion Induced by Uncoupled Nitric Oxide Synthase Contributes to Human Melanoma Development. Int. J. Biochem. Cell Biol. 2019, 115, 105592. [Google Scholar] [CrossRef]
- Werner, E.R.; Blau, N.; Thöny, B. Tetrahydrobiopterin: Biochemistry and Pathophysiology. Biochem. J. 2011, 438, 397–414. [Google Scholar] [CrossRef] [PubMed]
- Bendall, J.K.; Douglas, G.; McNeill, E.; Channon, K.M.; Crabtree, M.J. Tetrahydrobiopterin in Cardiovascular Health and Disease. Antioxid. Redox Signal. 2014, 20, 3040–3077. [Google Scholar] [CrossRef] [PubMed]
- Yuyun, M.F.; Ng, L.L.; Ng, G.A. Endothelial Dysfunction, Endothelial Nitric Oxide Bioavailability, Tetrahydrobiopterin, and 5-Methyltetrahydrofolate in Cardiovascular Disease. Where Are We with Therapy? Microvasc. Res. 2018, 119, 7–12. [Google Scholar] [CrossRef] [PubMed]
- Faria, A.M.; Papadimitriou, A.; Silva, K.C.; De Faria, J.M.L.; De Faria, J.B.L. Uncoupling Endothelial Nitric Oxide Synthase Is Ameliorated by Green Tea in Experimental Diabetes by Re-Establishing Tetrahydrobiopterin Levels. Diabetes 2012, 61, 1838–1847. [Google Scholar] [CrossRef] [PubMed]
- Kim, H.K.; Han, J. Tetrahydrobiopterin in Energy Metabolism and Metabolic Diseases. Pharmacol. Res. 2020, 157, 104827. [Google Scholar] [CrossRef]
- Xu, F.; Sudo, Y.; Sanechika, S.; Yamashita, J.; Shimaguchi, S.; Honda, S.I.; Sumi-Ichinose, C.; Mori-Kojima, M.; Nakata, R.; Furuta, T.; et al. Disturbed Biopterin and Folate Metabolism in the Qdpr-Deficient Mouse. FEBS Lett. 2014, 588, 3924–3931. [Google Scholar] [CrossRef]
- Brennenstuhl, H.; Jung-Klawitter, S.; Assmann, B.; Opladen, T. Inherited Disorders of Neurotransmitters: Classification and Practical Approaches for Diagnosis and Treatment. Neuropediatrics 2019, 50, 2–14. [Google Scholar] [CrossRef]
- Rabender, C.S.; Alam, A.; Sundaresan, G.; Cardnell, R.J.; Yakovlev, V.A.; Mukhopadhyay, N.D.; Graves, P.; Zweit, J.; Mikkelsen, R.B. The Role of Nitric Oxide Synthase Uncoupling in Tumor Progression. Mol. Cancer Res. 2015, 13, 1034–1043. [Google Scholar] [CrossRef]
- Chen, L.; Zeng, X.; Kleibeuker, E.; Buffa, F.; Barberis, A.; Leek, R.D.; Roxanis, I.; Zhang, W.; Worth, A.; Beech, J.S.; et al. Paracrine Effect of GTP Cyclohydrolase and Angiopoietin-1 Interaction in Stromal Fibroblasts on Tumor Tie2 Activation and Breast Cancer Growth. Oncotarget 2016, 7, 9353–9367. [Google Scholar] [CrossRef]
- de Melo, F.H.M.; Gonçalves, D.A.; de Sousa, R.X.; Icimoto, M.Y.; Fernandes, D.d.C.; Laurindo, F.R.M.; Jasiulionis, M.G. Metastatic Melanoma Progression Is Associated with Endothelial Nitric Oxide Synthase Uncoupling Induced by Loss of Enos:Bh4 Stoichiometry. Int. J. Mol. Sci. 2021, 22, 9556. [Google Scholar] [CrossRef]
- Bendall, J.K.; Alp, N.J.; Warrick, N.; Cai, S.; Adlam, D.; Rockett, K.; Yokoyama, M.; Kawashima, S.; Channon, K.M. Stoichiometric Relationships between Endothelial Tetrahydrobiopterin, Endothelial NO Synthese (ENOS) Activity, and ENOS Coupling in Vivo: Insights from Transgenic Mice with Endothelial-Targeted GTP Cyclohydrolase 1 and ENOS Overexpression. Circ. Res. 2005, 97, 864–871. [Google Scholar] [CrossRef] [PubMed]
- Crabtree, M.J.; Tatham, A.L.; Hale, A.B.; Alp, N.J.; Channon, K.M. Critical Role for Tetrahydrobiopterin Recycling by Dihydrofolate Reductase in Regulation of Endothelial Nitric-Oxide Synthase Coupling: Relative Importance of the de Novo Biopterin Synthesis versus Salvage Pathways. J. Biol. Chem. 2009, 284, 28128–28136. [Google Scholar] [CrossRef] [PubMed]
- Pickert, G.; Lim, H.Y.; Weigert, A.; Häussler, A.; Myrczek, T.; Waldner, M.; Labocha, S.; Ferreirós, N.; Geisslinger, G.; Lötsch, J.; et al. Inhibition of GTP Cyclohydrolase Attenuates Tumor Growth by Reducing Angiogenesis and M2-like Polarization of Tumor Associated Macrophages. Int. J. Cancer 2013, 132, 591–604. [Google Scholar] [CrossRef] [PubMed]
- Tran, A.N.; Walker, K.; Harrison, D.G.; Chen, W.; Mobley, J.; Hocevar, L.; Hackney, J.R.; Sedaka, R.S.; Pollock, J.S.; Goldberg, M.S.; et al. Reactive Species Balance via GTP Cyclohydrolase I Regulates Glioblastoma Growth and Tumor Initiating Cell Maintenance. Neuro. Oncol. 2018, 20, 1055–1067. [Google Scholar] [CrossRef]
- Tatham, A.L.; Crabtree, M.J.; Warrick, N.; Cai, S.; Alp, N.J.; Channon, K.M. GTP Cyclohydrolase I Expression, Protein, and Activity Determine Intracellular Tetrahydrobiopterin Levels, Independent of GTP Cyclohydrolase Feedback Regulatory Protein Expression. J. Biol. Chem. 2009, 284, 13660–13668. [Google Scholar] [CrossRef]
- Li, L.; Rezvan, A.; Salerno, J.C.; Husain, A.; Kwon, K.; Jo, H.; Harrison, D.G.; Chen, W. GTP Cyclohydrolase i Phosphorylation and Interaction with GTP Cyclohydrolase Feedback Regulatory Protein Provide Novel Regulation of Endothelial Tetrahydrobiopterin and Nitric Oxide. Circ. Res. 2010, 106, 328–336. [Google Scholar] [CrossRef]
- Chavan, B.; Gillbro, J.M.; Rokos, H.; Schallreuter, K.U. GTP Cyclohydrolase Feedback Regulatory Protein Controls Cofactor 6-Tetrahydrobiopterin Synthesis in the Cytosol and in the Nucleus of Epidermal Keratinocytes and Melanocytes. J. Invest. Dermatol. 2006, 126, 2481–2489. [Google Scholar] [CrossRef]
- Kalivendi, S.; Hatakeyama, K.; Whitsett, J.; Konorev, E.; Kalyanaraman, B.; Vásquez-Vivar, J. Changes in Tetrahydrobiopterin Levels in Endothelial Cells and Adult Cardiomyocytes Induced by LPS and Hydrogen Peroxide—A Role for GFRP? Free Radic. Biol. Med. 2005, 38, 481–491. [Google Scholar] [CrossRef]
- Gangula, P.R.; Challagundla, K.B.; Ravella, K.; Mukhopadhyay, S.; Chinnathambi, V.; Mittal, M.K.; Sekhar, K.R.; Sampath, C. Sepiapterin Alleviates Impaired Gastric NNOS Function in Spontaneous Diabetic Female Rodents through NRF2 MRNA Turnover and MiRNA Biogenesis Pathway. Am. J. Physiol. Gastrointest. Liver Physiol. 2018, 315, G980–G990. [Google Scholar] [CrossRef]
- Zhang, X.; Chen, Y.; Wang, K.; Tang, J.; Chen, Y.; Jin, G.; Liu, X. The Knockdown of the Sepiapterin Reductase Gene Suppresses the Proliferation of Breast Cancer by Inducing ROS-Mediated Apoptosis. Int. J. Clin. Exp. Pathol. 2020, 13, 2228. [Google Scholar]
- Zhang, Z.; Xie, X.; Yao, Q.; Liu, J.; Tian, Y.; Yang, C.; Xiao, L.; Wang, N. PPARδ Agonist Prevents Endothelial Dysfunction via Induction of Dihydrofolate Reductase Gene and Activation of Tetrahydrobiopterin Salvage Pathway. Br. J. Pharmacol. 2019, 176, 2945–2961. [Google Scholar] [CrossRef] [PubMed]
- Alp, N.J.; Channon, K.M. Regulation of Endothelial Nitric Oxide Synthase by Tetrahydrobiopterin in Vascular Disease. Arterioscler. Thromb. Vasc. Biol. 2004, 24, 413–420. [Google Scholar] [CrossRef] [PubMed]
- Zhang, J.; Wang, X.; Vikash, V.; Ye, Q.; Wu, D.; Liu, Y.; Dong, W. ROS and ROS-Mediated Cellular Signaling. Oxid. Med. Cell. Longev. 2016, 2016, 4350965. [Google Scholar] [CrossRef] [PubMed]
- Emanuelli, M.; Sartini, D.; Molinelli, E.; Campagna, R.; Pozzi, V.; Salvolini, E.; Simonetti, O.; Campanati, A.; Offidani, A. The Double-Edged Sword of Oxidative Stress in Skin Damage and Melanoma: From Physiopathology to Therapeutical Approaches. Antioxidants 2022, 11, 612. [Google Scholar] [CrossRef] [PubMed]
- Obrador, E.; Liu-Smith, F.; Dellinger, R.W.; Salvador, R.; Meyskens, F.L.; Estrela, J.M. Oxidative Stress and Antioxidants in the Pathophysiology of Malignant Melanoma. Biol. Chem. 2019, 400, 589–612. [Google Scholar] [CrossRef]
- Sarmiento-Salinas, F.L.; Perez-Gonzalez, A.; Acosta-Casique, A.; Ix-Ballote, A.; Diaz, A.; Treviño, S.; Rosas-Murrieta, N.H.; Millán-Perez-Peña, L.; Maycotte, P. Reactive Oxygen Species: Role in Carcinogenesis, Cancer Cell Signaling and Tumor Progression. Life Sci. 2021, 284, 119942. [Google Scholar] [CrossRef]
- Hayes, J.D.; Dinkova-Kostova, A.T.; Tew, K.D. Oxidative Stress in Cancer. Cancer Cell 2020, 38, 167–197. [Google Scholar] [CrossRef]
- Meierjohann, S. Oxidative Stress in Melanocyte Senescence and Melanoma Transformation. Eur. J. Cell Biol. 2014, 93, 36–41. [Google Scholar] [CrossRef]
- Liu-Smith, F.; Dellinger, R.; Meyskens, F.L. Updates of Reactive Oxygen Species in Melanoma Etiology and Progression. Arch. Biochem. Biophys. 2014, 563, 51–55. [Google Scholar] [CrossRef]
- Gorrini, C.; Harris, I.S.; Mak, T.W. Modulation of Oxidative Stress as an Anticancer Strategy. Nat. Rev. Drug Discov. 2013, 12, 931–947. [Google Scholar] [CrossRef]
- Perillo, B.; Di Donato, M.; Pezone, A.; Di Zazzo, E.; Giovannelli, P.; Galasso, G.; Castoria, G.; Migliaccio, A. ROS in Cancer Therapy: The Bright Side of the Moon. Exp. Mol. Med. 2020, 52, 192–203. [Google Scholar] [CrossRef] [PubMed]
- Yang, H.; Villani, R.M.; Wang, H.; Simpson, M.J.; Roberts, M.S.; Tang, M.; Liang, X. The Role of Cellular Reactive Oxygen Species in Cancer Chemotherapy. J. Exp. Clin. Cancer Res. 2018, 37, 266. [Google Scholar] [CrossRef] [PubMed]
- Galadari, S.; Rahman, A.; Pallichankandy, S.; Thayyullathil, F. Reactive Oxygen Species and Cancer Paradox: To Promote or to Suppress? Free Radic. Biol. Med. 2017, 104, 144–164. [Google Scholar] [CrossRef] [PubMed]
- Calderon-Aparicio, A.; Cornejo, A.; Orue, A.; Rieber, M. Anticancer Response to Disulfiram May Be Enhanced by Co-Treatment with MEK Inhibitor or Oxaliplatin: Modulation by Tetrathiomolybdate, KRAS/BRAF Mutations and c-MYC/P53 Status. Ecancermedicalscience 2019, 13, 890. [Google Scholar] [CrossRef]
- Wang, M.; Shi, G.; Bian, C.; Nisar, M.F.; Guo, Y.; Wu, Y.; Li, W.; Huang, X.; Jiang, X.; Bartsch, J.W.; et al. UVA Irradiation Enhances Brusatol-Mediated Inhibition of Melanoma Growth by Downregulation of the Nrf2-Mediated Antioxidant Response. Oxid. Med. Cell. Longev. 2018, 2018, 9742154. [Google Scholar] [CrossRef]
- Aggarwal, V.; Tuli, H.S.; Varol, A.; Thakral, F.; Yerer, M.B.; Sak, K.; Varol, M.; Jain, A.; Khan, M.A.; Sethi, G. Role of Reactive Oxygen Species in Cancer Progression: Molecular Mechanisms and Recent Advancements. Biomolecules 2019, 9, 735. [Google Scholar] [CrossRef]
- Trachootham, D.; Alexandre, J.; Huang, P. Targeting Cancer Cells by ROS-Mediated Mechanisms: A Radical Therapeutic Approach? Nat. Rev. Drug Discov. 2009, 8, 579–591. [Google Scholar] [CrossRef]
- Burke, A.J.; Sullivan, F.J.; Giles, F.J.; Glynn, S.A. The Yin and Yang of Nitric Oxide in Cancer Progression. Carcinogenesis 2013, 34, 503–512. [Google Scholar] [CrossRef]
- Vanini, F.; Kashfi, K.; Nath, N. The Dual Role of INOS in Cancer. Redox Biol. 2015, 6, 334–343. [Google Scholar] [CrossRef]
- Sun, W.; Bao, J.; Lin, W.; Gao, H.; Zhao, W.; Zhang, Q.; Leung, C.H.; Ma, D.L.; Lu, J.; Chen, X. 2-Methoxy-6-Acetyl-7-Methyljuglone (MAM), a Natural Naphthoquinone, Induces NO-Dependent Apoptosis and Necroptosis by H2O2-Dependent JNK Activation in Cancer Cells. Free Radic. Biol. Med. 2016, 92, 61–77. [Google Scholar] [CrossRef]
- Yarlagadda, K.; Hassani, J.; Foote, I.P.; Markowitz, J. The Role of Nitric Oxide in Melanoma. Biochim. Biophys. Acta Rev. Cancer 2017, 1868, 500. [Google Scholar] [CrossRef] [PubMed]
- Brüne, B.; Schneiderhan, N. Nitric Oxide Evoked P53-Accumulation and Apoptosis. Toxicol. Lett. 2003, 139, 119–123. [Google Scholar] [CrossRef]
- Yang, J.; Wu, L.J.; Tashiro, S.I.; Onodera, S.; Ikejima, T. Nitric Oxide Activated by P38 and NF-ΚB Facilitates Apoptosis and Cell Cycle Arrest under Oxidative Stress in Evodiamine-Treated Human Melanoma A375-S2 Cells. Free. Radic. Res. 2009, 42, 1–11. [Google Scholar] [CrossRef] [PubMed]
- Chen, S.-J.; Lin, P.-W.; Lin, H.-P.; Huang, S.-S.; Lai, F.-J.; Sheu, H.-M.; Hsu, L.-J.; Chang, N.-S.; Chen, S.-J.; Lin, P.-W.; et al. UV Irradiation/Cold Shock-Mediated Apoptosis Is Switched to Bubbling Cell Death at Low Temperatures. Oncotarget 2015, 6, 8007–8018. [Google Scholar] [CrossRef] [PubMed]
- Kim, M.Y. Nitric Oxide Triggers Apoptosis in A375 Human Melanoma Cells Treated with Capsaicin and Resveratrol. Mol. Med. Rep. 2012, 5, 585–591. [Google Scholar] [CrossRef]
- Yajima, I.; Kumasaka, M.Y.; Thang, N.D.; Goto, Y.; Takeda, K.; Yamanoshita, O.; Iida, M.; Ohgami, N.; Tamura, H.; Kawamoto, Y.; et al. RAS/RAF/MEK/ERK and PI3K/PTEN/AKT Signaling in Malignant Melanoma Progression and Therapy. Dermatol. Res. Pract. 2012, 2012, 354191. [Google Scholar] [CrossRef]
- Lee, C.W.; Yen, F.L.; Ko, H.H.; Li, S.Y.; Chiang, Y.C.; Lee, M.H.; Tsai, M.H.; Hsu, L.F. Cudraflavone C Induces Apoptosis of A375.S2 Melanoma Cells through Mitochondrial ROS Production and MAPK Activation. Int. J. Mol. Sci. 2017, 18, 1508. [Google Scholar] [CrossRef]
- Gomez-Sarosi, L.A.; Strasberg-Rieber, M.; Rieber, M. ERK Activation Increases Nitroprusside Induced Apoptosis in Human Melanoma Cells Irrespective of P53 Status: Role of Superoxide Dismutases. Cancer Biol. Ther. 2009, 8, 1173–1182. [Google Scholar] [CrossRef]
- Barzegar-Fallah, A.; Alimoradi, H.; Dunlop, J.L.; Torbati, E.; Baird, S.K. Serotonin Type-3 Receptor Antagonists Selectively Kill Melanoma Cells through Classical Apoptosis, Microtubule Depolymerisation, ERK Activation, and NF-ΚB Downregulation. Cell Biol. Toxicol. 2021; Online ahead of print. [Google Scholar] [CrossRef]
- Tan, B.J.; Chiu, G.N.C. Role of Oxidative Stress, Endoplasmic Reticulum Stress and ERK Activation in Triptolide-Induced Apoptosis. Int. J. Oncol. 2013, 42, 1605–1612. [Google Scholar] [CrossRef]
- Lim, W.; Yang, C.; Bazer, F.W.; Song, G. Chrysophanol Induces Apoptosis of Choriocarcinoma Through Regulation of ROS and the AKT and ERK1/2 Pathways. J. Cell. Physiol. 2017, 232, 331–339. [Google Scholar] [CrossRef]
- Ji, Y.; Dai, Z.; Wu, G.; Wu, Z. 4-Hydroxy-2-Nonenal Induces Apoptosis by Activating ERK1/2 Signaling and Depleting Intracellular Glutathione in Intestinal Epithelial Cells. Sci. Rep. 2016, 6, 32929. [Google Scholar] [CrossRef]
- Guon, T.E.; Chung, H.S. Moringa Oleifera Fruit Induce Apoptosis via Reactive Oxygen Species-Dependent Activation of Mitogen-Activated Protein Kinases in Human Melanoma A2058 Cells. Oncol. Lett. 2017, 14, 1703. [Google Scholar] [CrossRef] [PubMed]
- Shankaran, H.; Chrisler, W.B.; Sontag, R.L.; Weber, T.J. Inhibition of ERK Oscillations by Ionizing Radiation and Reactive Oxygen Species. Mol. Carcinog. 2011, 50, 424–432. [Google Scholar] [CrossRef] [PubMed]
- Jia, L.; Hao, S.L.; Yang, W.X. Nanoparticles Induce Autophagy via MTOR Pathway Inhibition and Reactive Oxygen Species Generation. Nanomedicine 2020, 15, 1419–1435. [Google Scholar] [CrossRef] [PubMed]
- Tangchirakhaphan, S.; Innajak, S.; Nilwarangkoon, S.; Tanjapatkul, N.; Mahabusrakum, W.; Watanapokasin, R. Mechanism of Apoptosis Induction Associated with ERK1/2 Upregulation via Goniothalamin in Melanoma Cells. Exp. Ther. Med. 2018, 15, 3052. [Google Scholar] [CrossRef]
- Pizzimenti, S.; Ribero, S.; Cucci, M.A.; Grattarola, M.; Monge, C.; Dianzani, C.; Barrera, G.; Muzio, G. Oxidative Stress-Related Mechanisms in Melanoma and in the Acquired Resistance to Targeted Therapies. Antioxidants 2021, 10, 1942. [Google Scholar] [CrossRef] [PubMed]
- Corazao-Rozas, P.; Guerreschi, P.; Jendoubi, M.; André, F.; Jonneaux, A.; Scalbert, C.; Garçon, G.; Mallet-Martino, M.; Balayssac, S.; Rocchi, S.; et al. Mitochondrial Oxidative Stress Is the Achille’s Heel of Melanoma Cells Resistant to Braf-Mutant Inhibitor. Oncotarget 2013, 4, 1986–1998. [Google Scholar] [CrossRef]
- Delgado-Goni, T.; Miniotis, M.F.; Wantuch, S.; Parkes, H.G.; Marais, R.; Workman, P.; Leach, M.O.; Beloueche-Babari, M. The BRAF Inhibitor Vemurafenib Activates Mitochondrial Metabolism and Inhibits Hyperpolarized Pyruvate-Lactate Exchange in BRAF-Mutant Human Melanoma Cells. Mol. Cancer Ther. 2016, 15, 2987–2999. [Google Scholar] [CrossRef]
- Yu, L.; Gao, L.X.; Ma, X.Q.; Hu, F.X.; Li, C.M.; Lu, Z. Involvement of Superoxide and Nitric Oxide in BRAFV600E Inhibitor PLX4032-Induced Growth Inhibition of Melanoma Cells. Integr. Biol. 2014, 6, 1211–1217. [Google Scholar] [CrossRef]
- Kaoud, T.S.; Mohassab, A.M.; Hassan, H.A.; Yan, C.; Van Ravenstein, S.X.; Abdelhamid, D.; Dalby, K.N.; Abdel-Aziz, M. NO-Releasing STAT3 Inhibitors Suppress BRAF-Mutant Melanoma Growth. Eur. J. Med. Chem. 2020, 186, 111885. [Google Scholar] [CrossRef]
- Gonçalves, D.A.; Jasiulionis, M.G.; de Melo, F.H.M. The Role of the BH4 Cofactor in Nitric Oxide Synthase Activity and Cancer Progression: Two Sides of the Same Coin. Int. J. Mol. Sci. 2021, 22, 9546. [Google Scholar] [CrossRef] [PubMed]
- Marinos, R.S.; Zhang, W.; Wu, G.; Kelly, K.A.; Meininger, C.J. Tetrahydrobiopterin Levels Regulate Endothelial Cell Proliferation. Am. J. Physiol. Hear. Circ. Physiol. 2001, 281, H482–H489. [Google Scholar] [CrossRef] [PubMed][Green Version]


Publisher’s Note: MDPI stays neutral with regard to jurisdictional claims in published maps and institutional affiliations. |
© 2022 by the authors. Licensee MDPI, Basel, Switzerland. This article is an open access article distributed under the terms and conditions of the Creative Commons Attribution (CC BY) license (https://creativecommons.org/licenses/by/4.0/).
Share and Cite
Soares, J.P.M.; Gonçalves, D.A.; de Sousa, R.X.; Mouro, M.G.; Higa, E.M.S.; Sperandio, L.P.; Vitoriano, C.M.; Rosa, E.B.S.; Santos, F.O.d.; de Queiroz, G.N.; et al. Disruption of Redox Homeostasis by Alterations in Nitric Oxide Synthase Activity and Tetrahydrobiopterin along with Melanoma Progression. Int. J. Mol. Sci. 2022, 23, 5979. https://doi.org/10.3390/ijms23115979
Soares JPM, Gonçalves DA, de Sousa RX, Mouro MG, Higa EMS, Sperandio LP, Vitoriano CM, Rosa EBS, Santos FOd, de Queiroz GN, et al. Disruption of Redox Homeostasis by Alterations in Nitric Oxide Synthase Activity and Tetrahydrobiopterin along with Melanoma Progression. International Journal of Molecular Sciences. 2022; 23(11):5979. https://doi.org/10.3390/ijms23115979
Chicago/Turabian StyleSoares, Jaqueline Pereira Moura, Diego Assis Gonçalves, Ricardo Xisto de Sousa, Margareth Gori Mouro, Elisa M. S. Higa, Letícia Paulino Sperandio, Carolina Moraes Vitoriano, Elisa Bachir Santa Rosa, Fernanda Oliveira dos Santos, Gustavo Nery de Queiroz, and et al. 2022. "Disruption of Redox Homeostasis by Alterations in Nitric Oxide Synthase Activity and Tetrahydrobiopterin along with Melanoma Progression" International Journal of Molecular Sciences 23, no. 11: 5979. https://doi.org/10.3390/ijms23115979
APA StyleSoares, J. P. M., Gonçalves, D. A., de Sousa, R. X., Mouro, M. G., Higa, E. M. S., Sperandio, L. P., Vitoriano, C. M., Rosa, E. B. S., Santos, F. O. d., de Queiroz, G. N., Yamaguchi, R. S. S., Pereira, G., Icimoto, M. Y., & Melo, F. H. M. d. (2022). Disruption of Redox Homeostasis by Alterations in Nitric Oxide Synthase Activity and Tetrahydrobiopterin along with Melanoma Progression. International Journal of Molecular Sciences, 23(11), 5979. https://doi.org/10.3390/ijms23115979