
Comprehensive Flow-Cytometric Quality Assessment of Ram Sperm Intended for Gene Banking Using Standard and Novel Fertility Biomarkers

 , , , , and
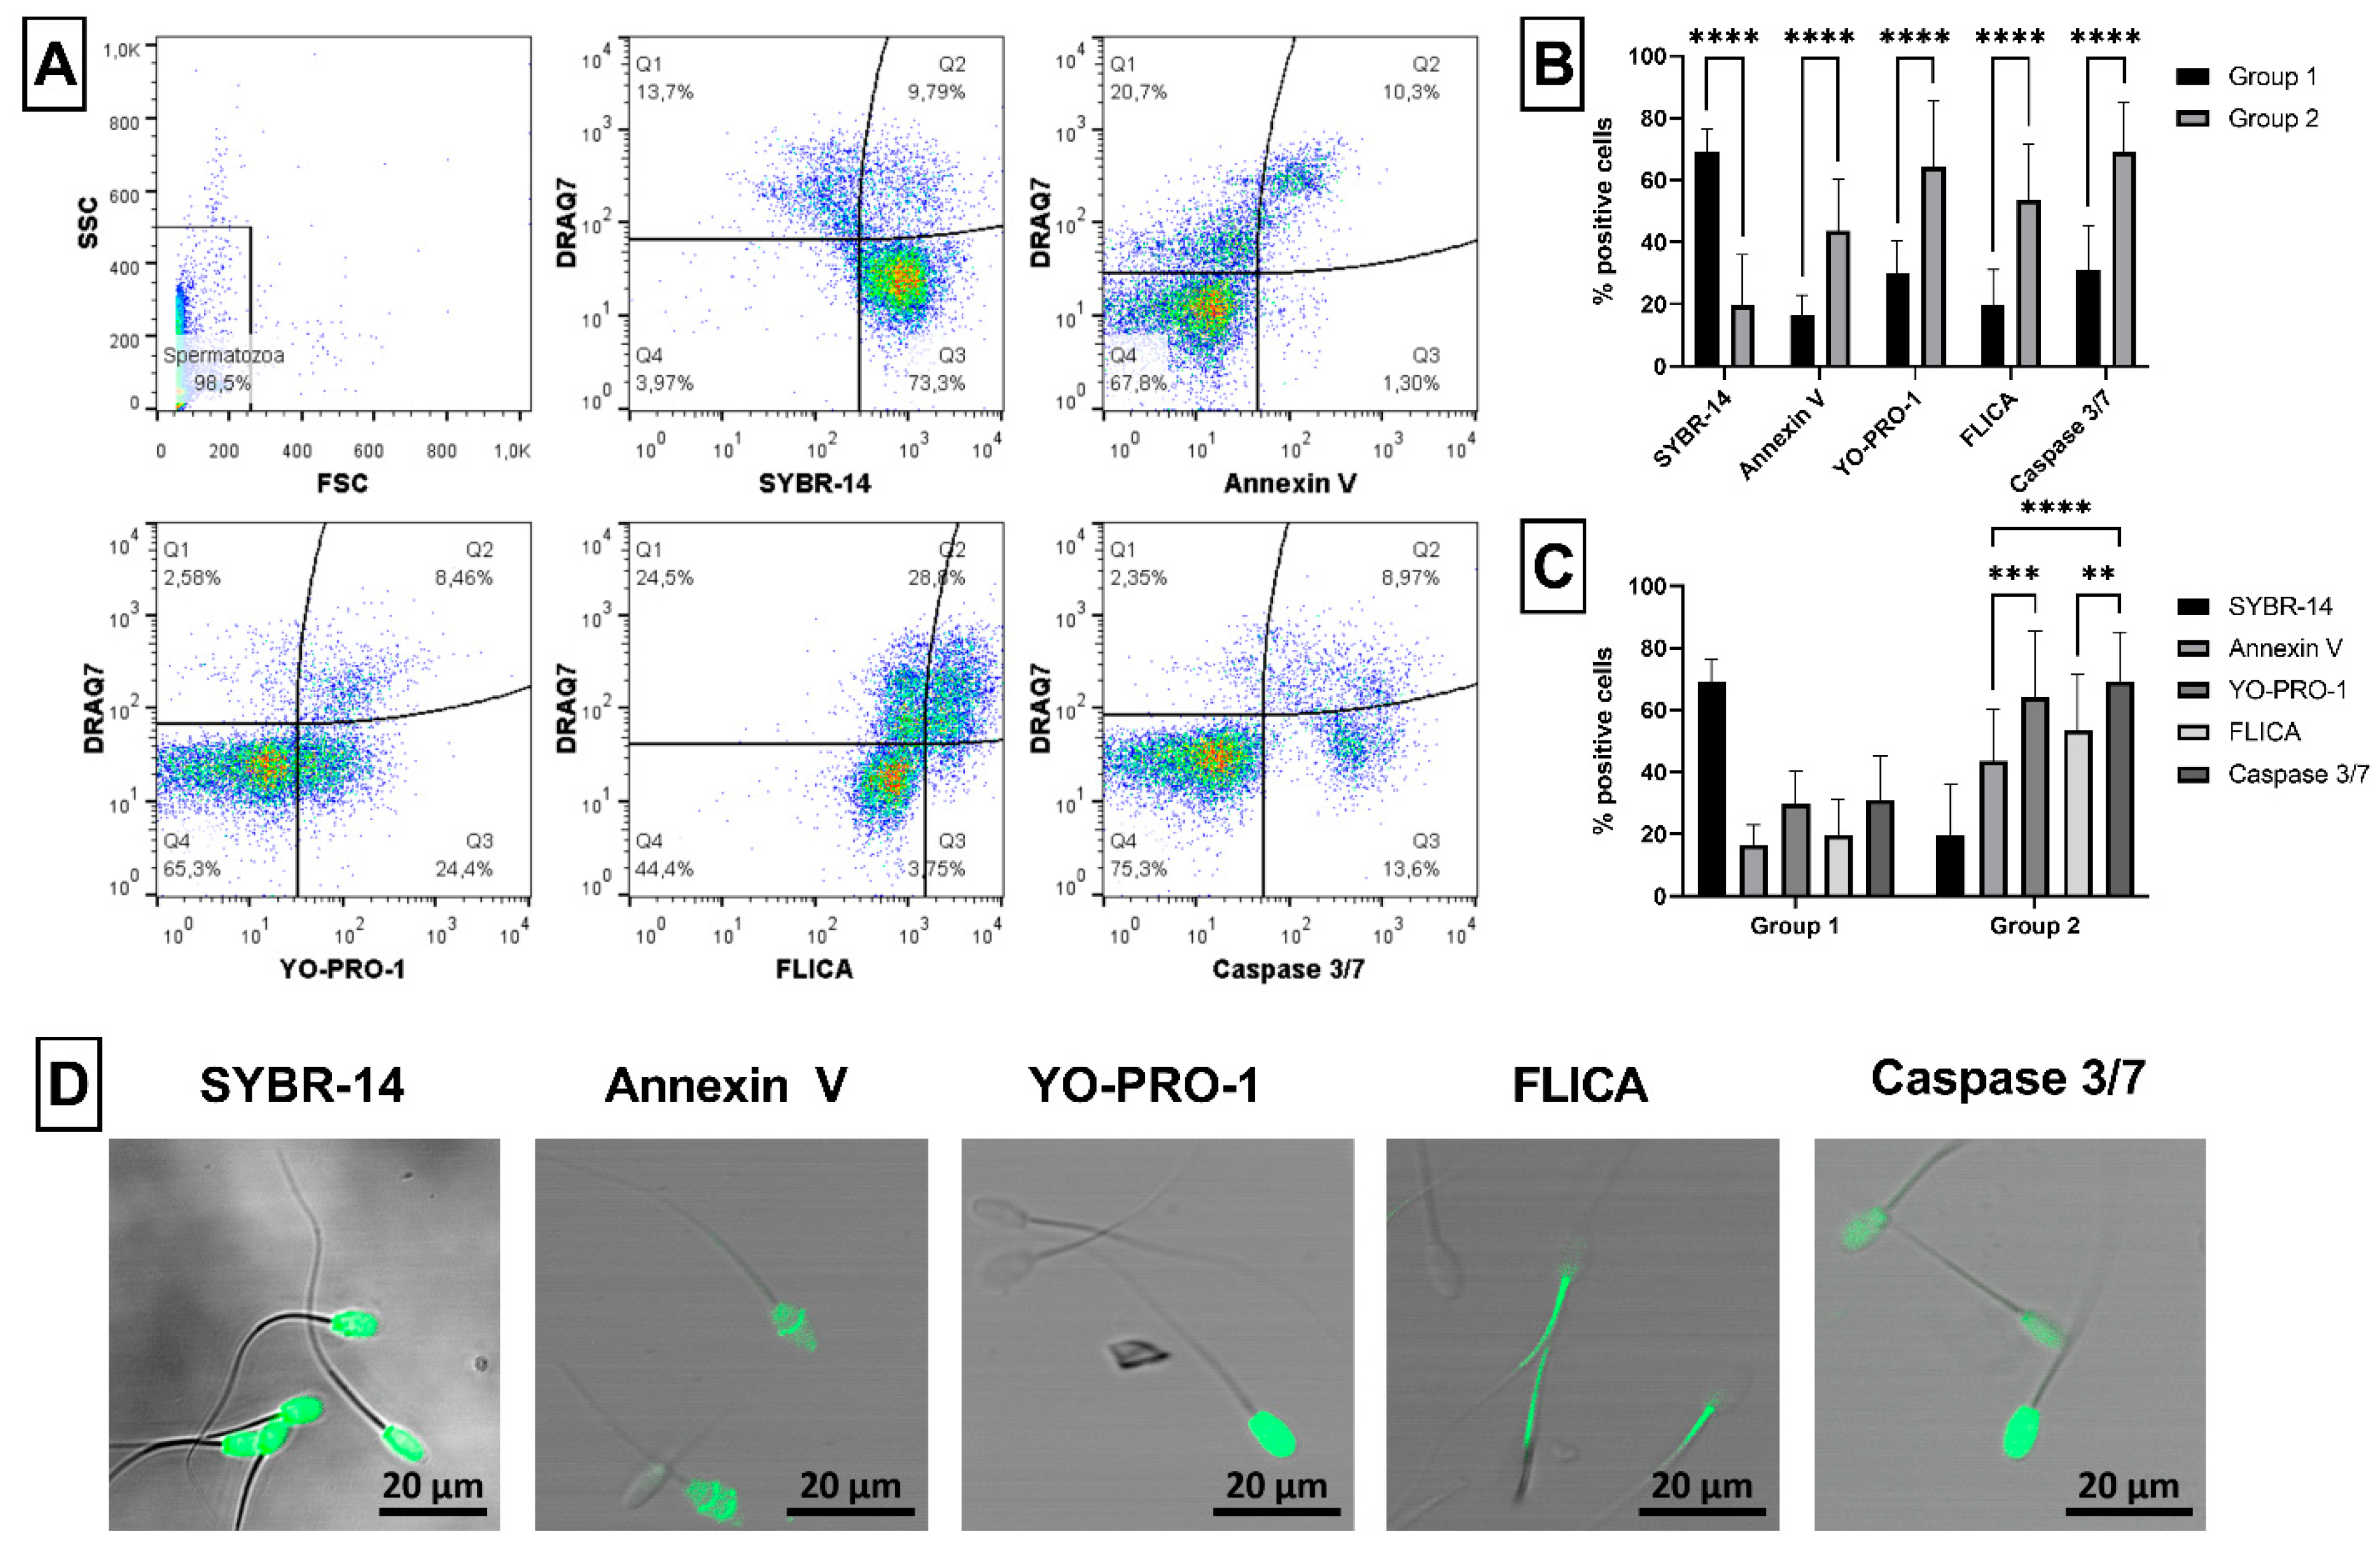
Abstract
1. Introduction
2. Results
2.1. Sperm Viability, Apoptosis and CASA Parameters
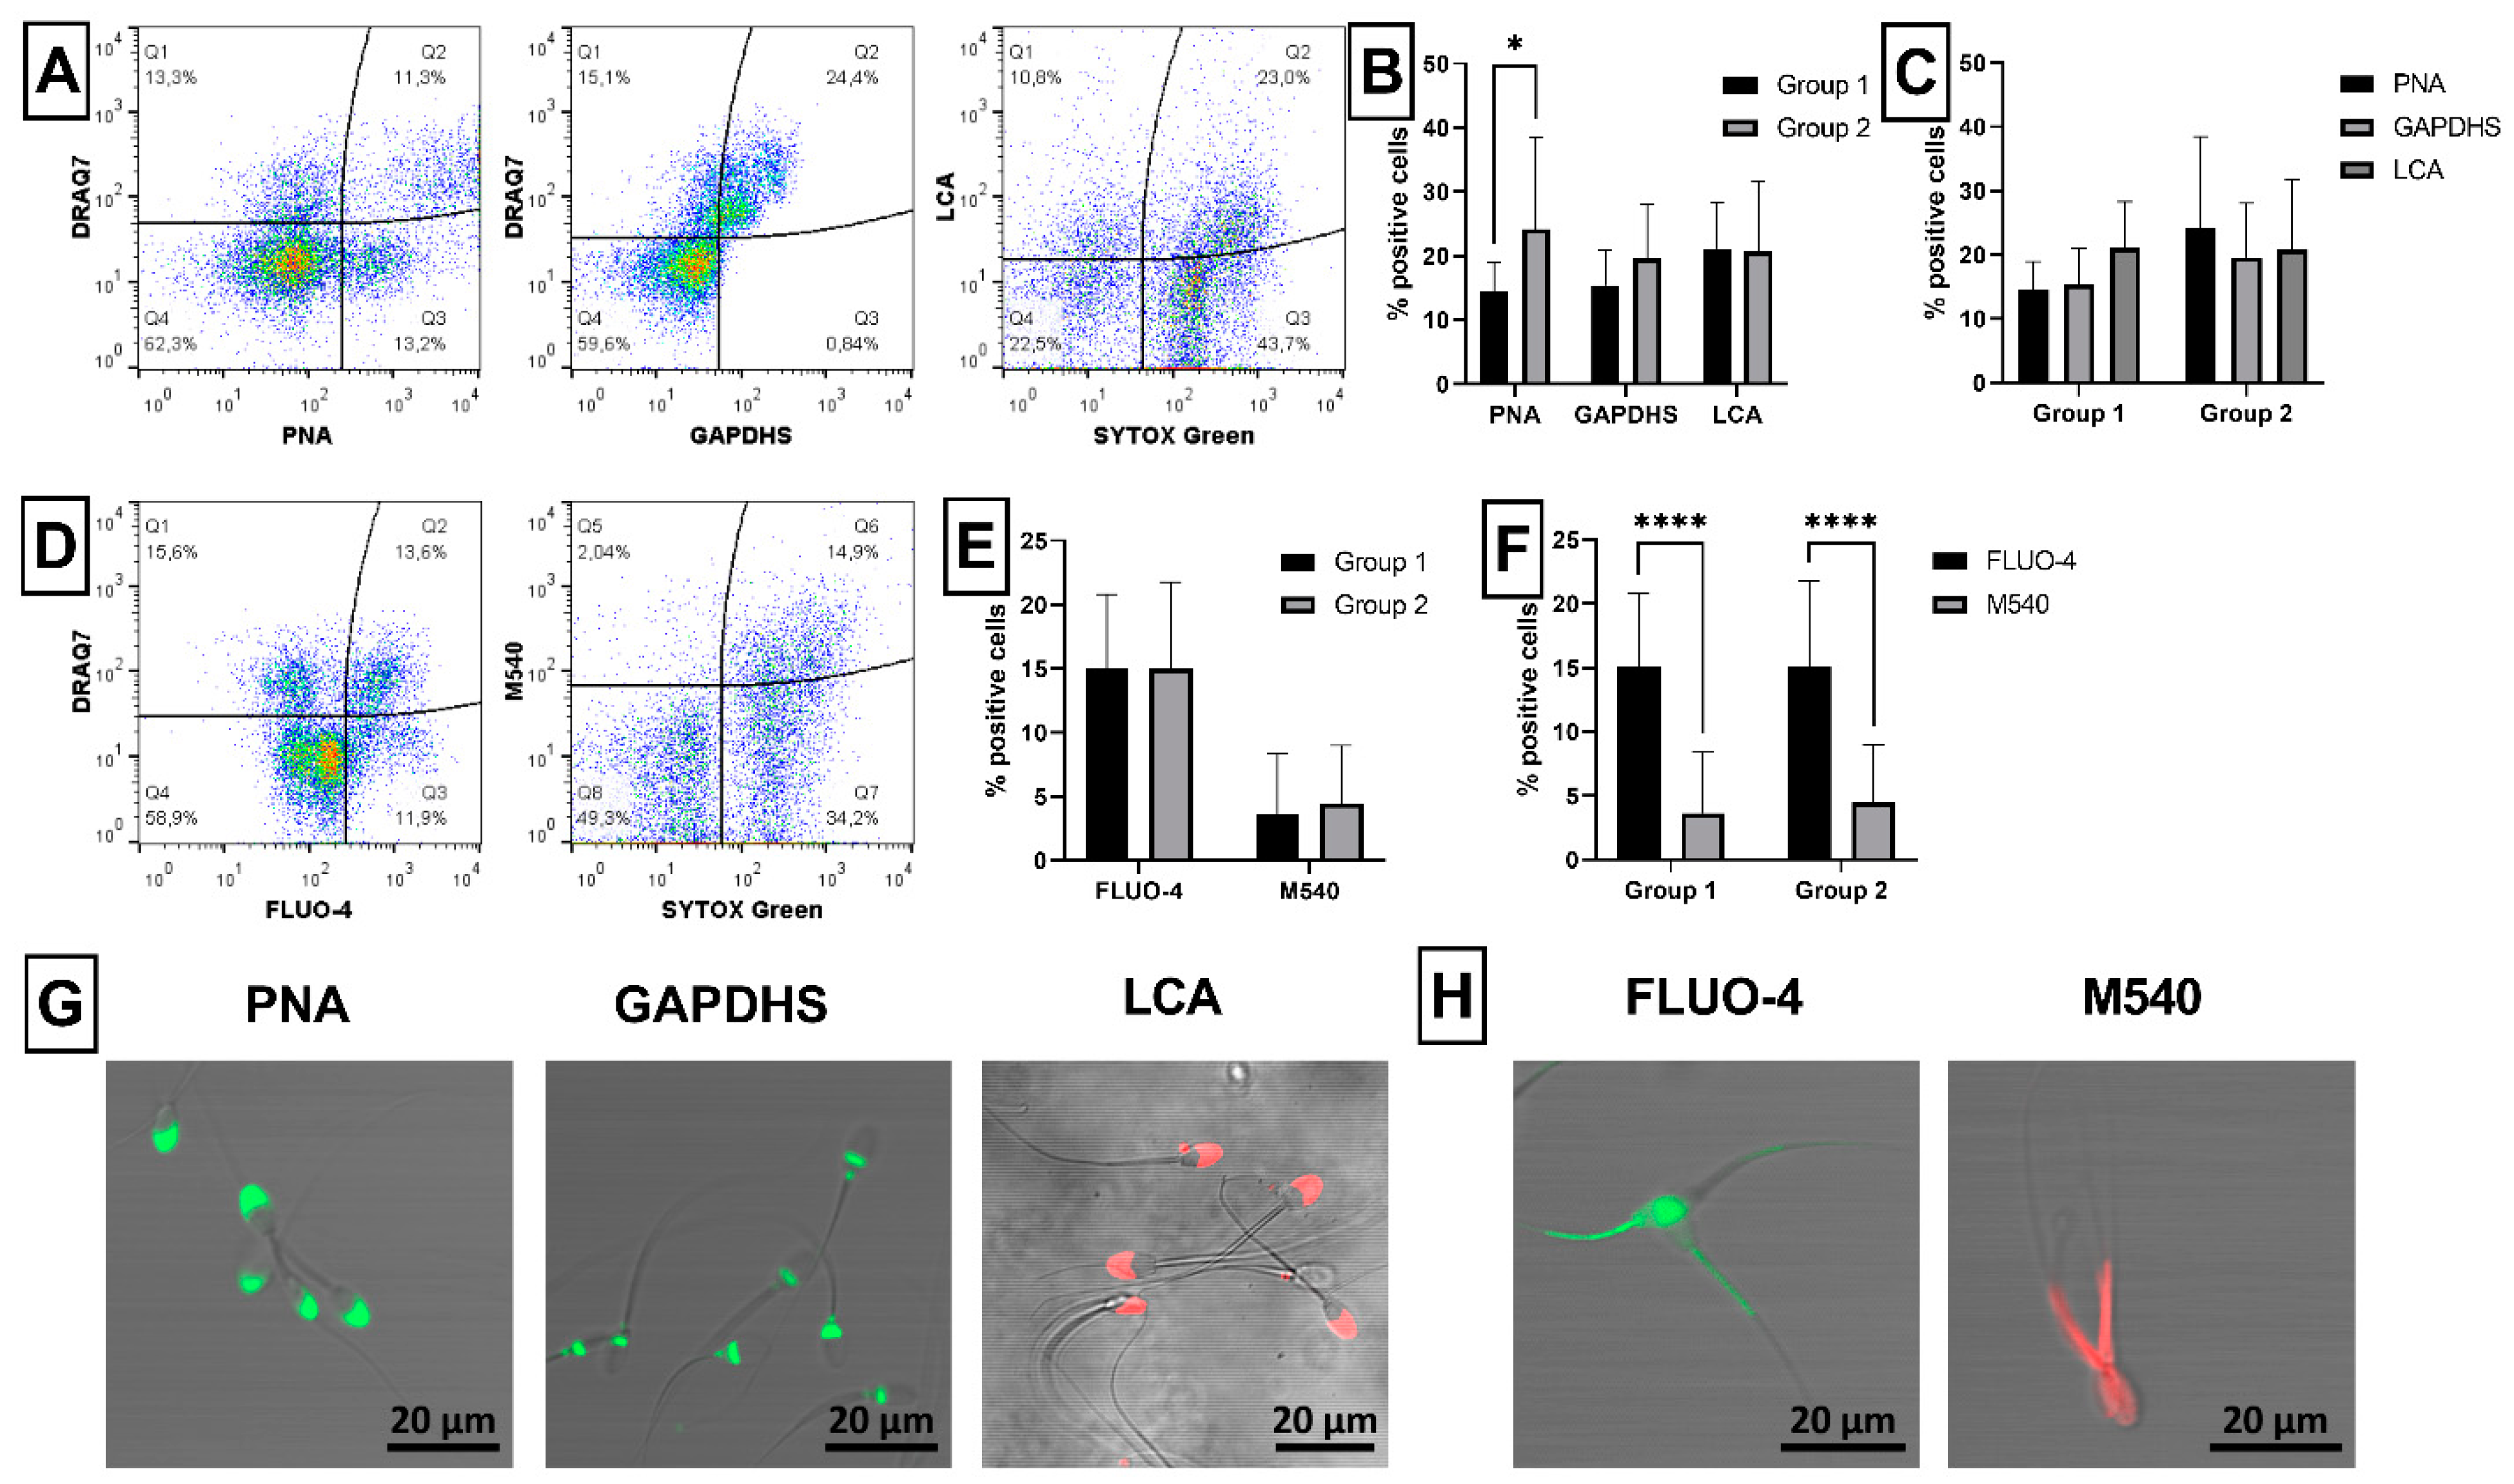
2.2. Sperm Acrosome Integrity and Capacitation Status
2.3. Sperm Mitochondrial Activity
2.4. Sperm ROS Generation
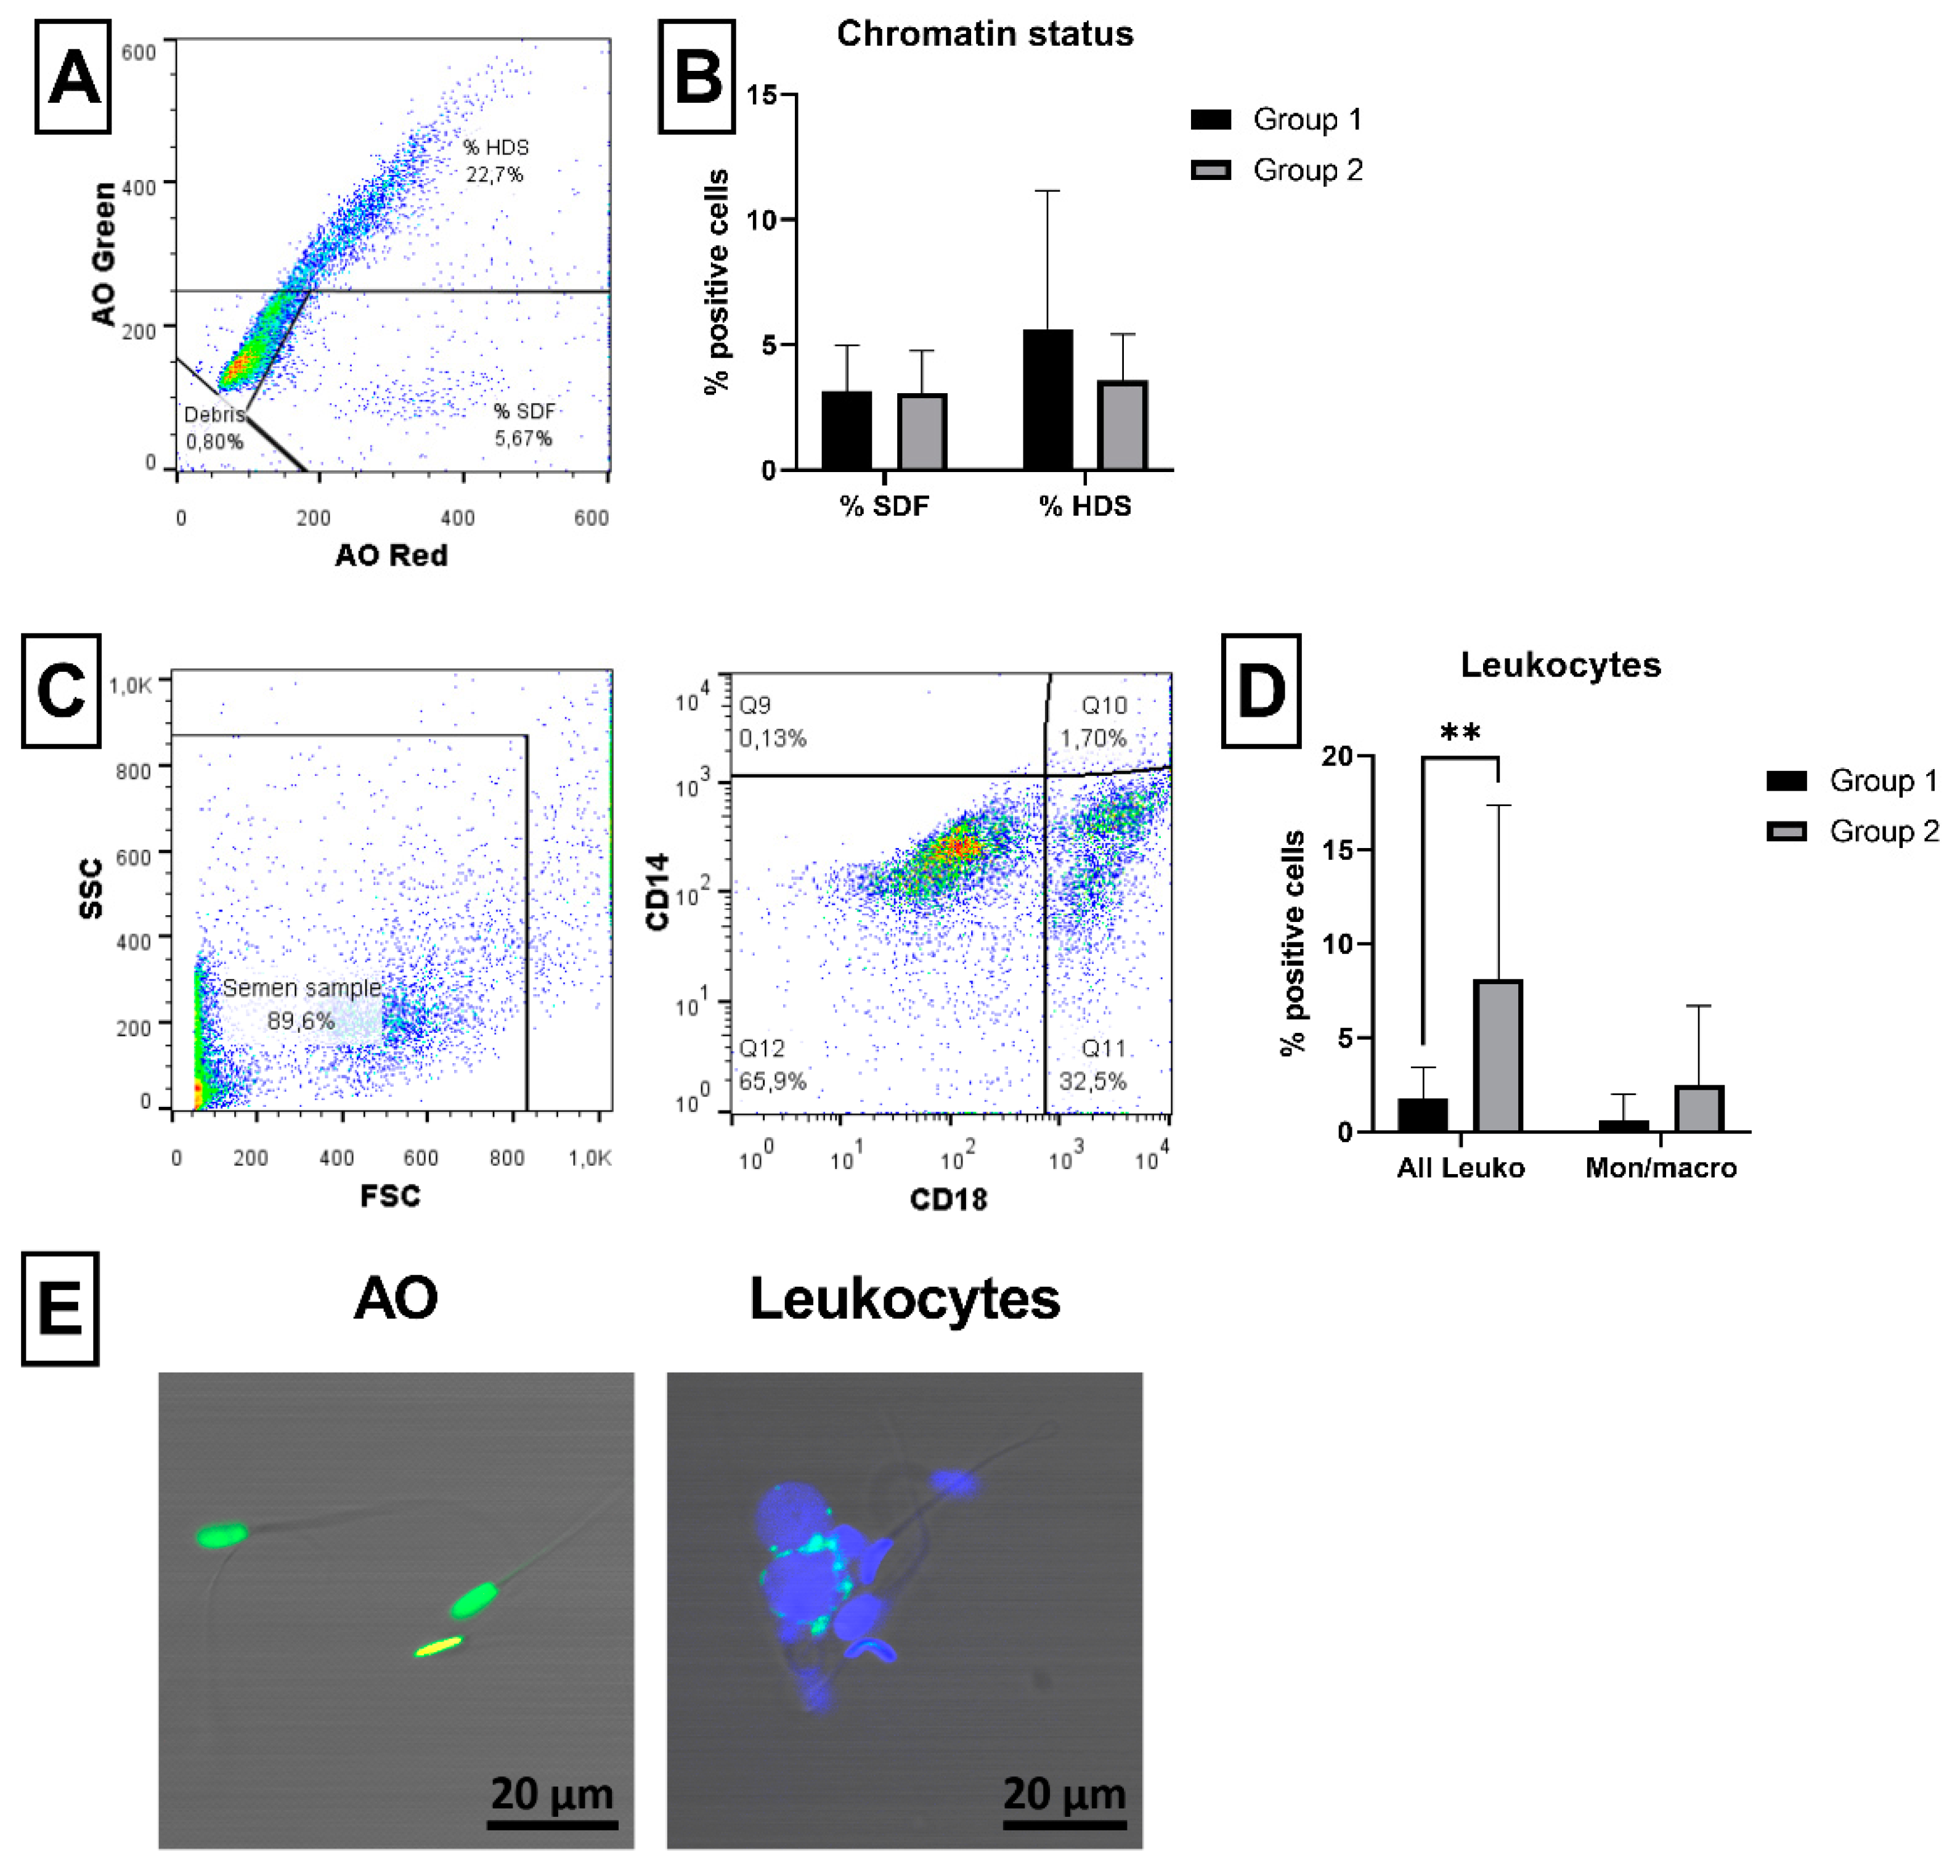
2.5. Sperm Chromatin Status and Leukocyte Detection
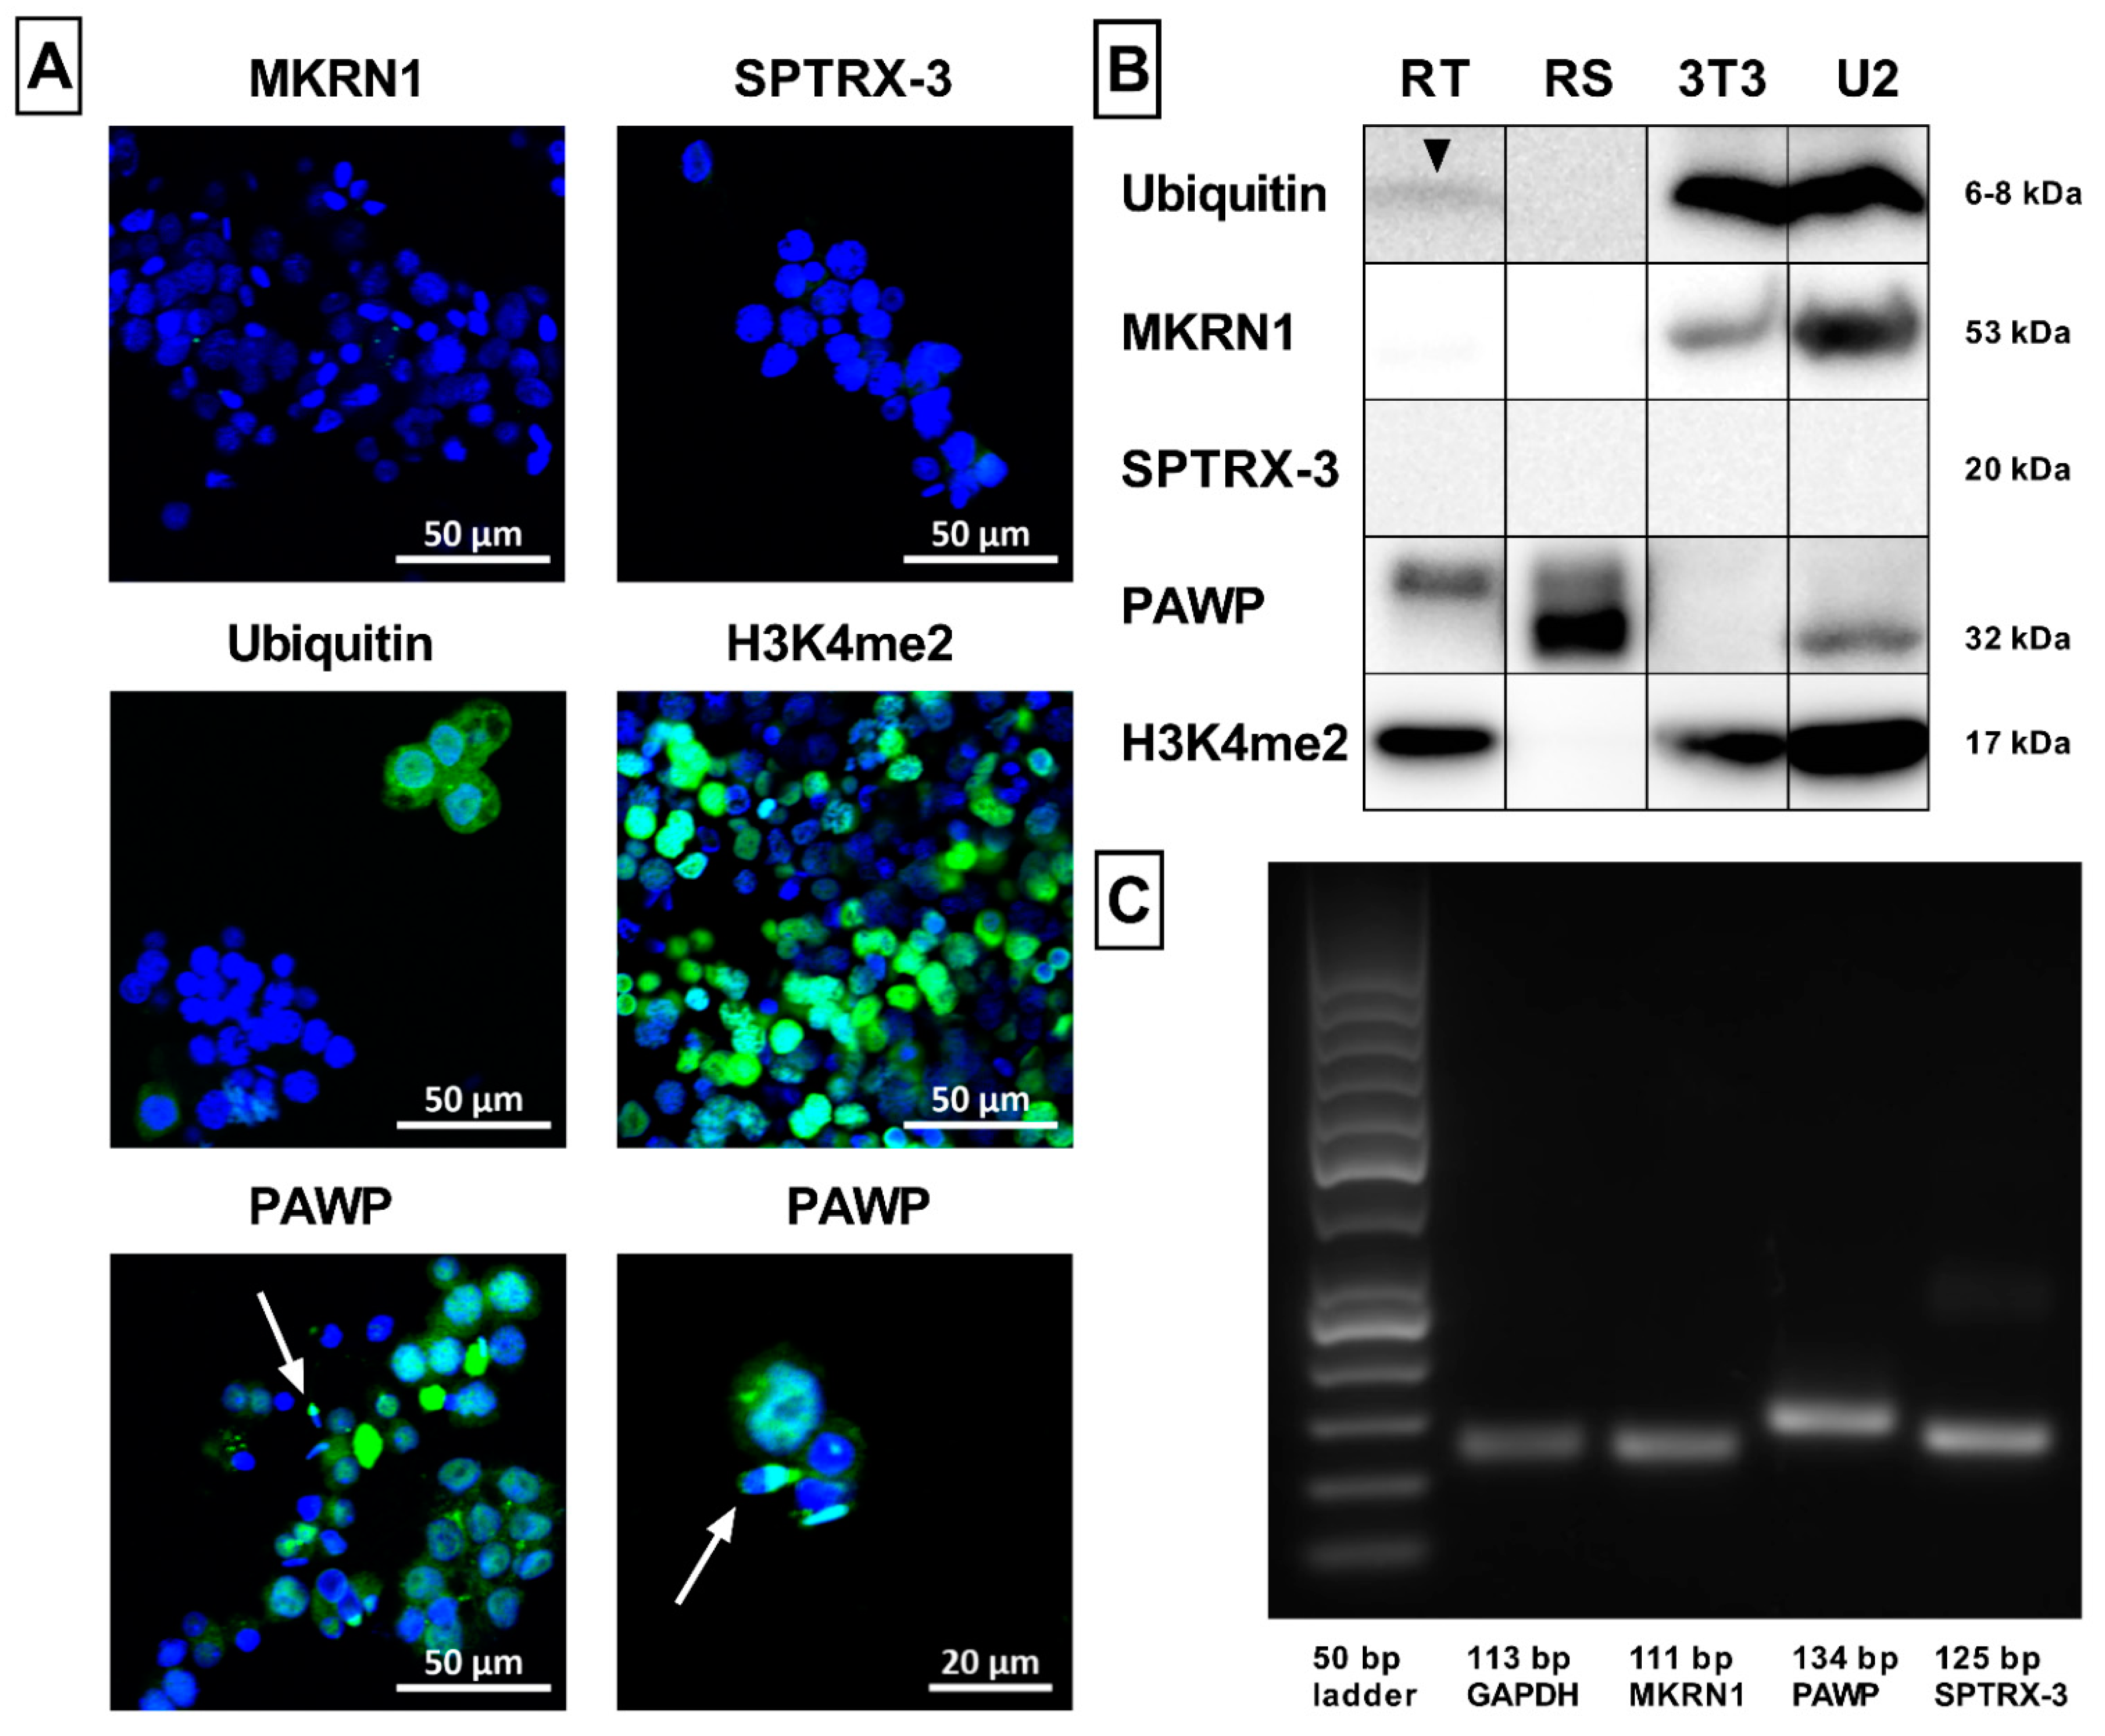
2.6. Sperm Ubiquitination and Formation of Aggresomes
2.7. Novel Sperm Biomarkers Associated with Fertility
3. Discussion
4. Materials and Methods
4.1. Animals and Semen Collection
4.2. Computer-Assisted Semen Analysis (CASA)
4.3. Experimental Design and Flow-Cytometric Analyses
4.3.1. Viability and Apoptosis
4.3.2. Acrosomal Status
4.3.3. Sperm Capacitation Status
4.3.4. Mitochondrial Activity
4.3.5. Generation of Reactive Oxygen Species (ROS)
4.3.6. Chromatin Status
4.3.7. Occurrence of Leukocytes
4.3.8. Ubiquitination and Formation of Aggresomes
4.3.9. Intracellular Fertility Biomarkers
4.4. Confocal Microscopy
4.5. Statistical Analysis
5. Conclusions
Author Contributions
Funding
Institutional Review Board Statement
Informed Consent Statement
Data Availability Statement
Acknowledgments
Conflicts of Interest
Appendix A
Appendix A.1. Confocal Microscopy
Appendix A.2. Western Blot Analysis
Appendix A.3. RT-PCR Analysis

References
- Hamilton, T.R.D.; Mendes, C.M.; de Castro, L.S.; de Assis, P.M.; Siqueira, A.F.P.; Delgado, J.D.; Goissis, M.D.; Muino-Blanco, T.; Cebrian-Perez, J.A.; Nichi, M.; et al. Evaluation of Lasting Effects of Heat Stress on Sperm Profile and Oxidative Status of Ram Semen and Epididymal Sperm. Oxidative Med. Cell. Longev. 2016, 2016, 1687657. [Google Scholar] [CrossRef] [PubMed]
- Mendoza, N.; Casao, A.; Perez-Pe, R.; Cebrian-Perez, J.A.; Muino-Blanco, T. New Insights into the Mechanisms of Ram Sperm Protection by Seminal Plasma Proteins. Biol. Reprod. 2013, 88, 149. [Google Scholar] [CrossRef] [PubMed]
- Baláži, A.; Vašíček, J.; Svoradová, A.; Macháč, M.; Jurčík, R.; Huba, J.; Pavlík, I.; Chrenek, P. Comparison of three different methods for the analysis of ram sperm concentration. Slovak J. Anim. Sci. 2020, 53, 53–58. [Google Scholar]
- Vasicek, J.; Svoradova, A.; Balazi, A.; Jurcik, R.; Machac, M.; Chrenek, P. Ram semen quality can be assessed by flow cytometry several hours after post-fixation. Zygote 2021, 29, 130–137. [Google Scholar] [CrossRef]
- Martinez-Pastor, F.; Mata-Campuzano, M.; Alvarez-Rodriguez, M.; Alvarez, M.; Anel, L.; de Paz, P. Probes and Techniques for Sperm Evaluation by Flow Cytometry. Reprod. Domest. Anim. 2010, 45, 67–78. [Google Scholar] [CrossRef]
- Svoradova, A.; Kuzelova, L.; Vasicek, J.; Olexikova, L.; Balazi, A.; Kulikova, B.; Hrncar, C.; Ostro, A.; Bednarczyk, M.; Chrenek, P. The Assessment of Cryopreservation on the Quality of Endangered Oravka Rooster Spermatozoa using Casa and Cytometry. Cryoletters 2018, 39, 359–365. [Google Scholar]
- Garner, D.L.; Johnson, L.A. Viability assessment of mammalian sperm using SYBR-14 and propidium iodide. Biol. Reprod. 1995, 53, 276–284. [Google Scholar] [CrossRef]
- Perticarari, S.; Ricci, G.; Granzotto, M.; Boscolo, R.; Pozzobon, C.; Guarnieri, S.; Sartore, A.; Presani, G. A new multiparameter flow cytometric method for human semen analysis. Hum. Reprod. 2007, 22, 485–494. [Google Scholar] [CrossRef]
- Akagi, J.; Kordon, M.; Zhao, H.; Matuszek, A.; Dobrucki, J.; Errington, R.; Smith, P.J.; Takeda, K.; Darzynkiewicz, Z.; Wlodkowic, D. Real-time cell viability assays using a new anthracycline derivative DRAQ7 (R). Cytom. Part A 2013, 83, 227–234. [Google Scholar] [CrossRef]
- Pena, F.J.; Saravia, F.; Johannisson, A.; Wallgren, M.; Rodriguez-Martinez, H. Detection of early changes in sperm membrane integrity pre-freezing can estimate post-thaw quality of boar spermatozoa. Anim. Reprod. Sci. 2007, 97, 74–83. [Google Scholar] [CrossRef]
- Pena, F.J.; Saravia, F.; Johannisson, A.; Walgren, M.; Rodriguez-Martinez, H. A new and simple method to evaluate early membrane changes in frozen-thawed boar spermatozoa. Int. J. Androl. 2005, 28, 107–114. [Google Scholar] [CrossRef] [PubMed]
- Grunewald, S.; Sharma, R.; Paasch, U.; Glander, H.J.; Agarwal, A. Impact of Caspase Activation in Human Spermatozoa. Microsc. Res. Tech. 2009, 72, 878–888. [Google Scholar] [CrossRef] [PubMed]
- Tao, J.; Critser, E.S.; Critser, J.K. Evaluation of mouse sperm acrosomal status and viability by flow cytometry. Mol. Reprod. Dev. 1993, 36, 183–194. [Google Scholar] [CrossRef]
- Sutovsky, P.; Kennedy, C.E. Biomarker-based nanotechnology for the improvement of reproductive performance in beef and dairy cattle. Ind. Biotechnol. 2013, 9, 24–30. [Google Scholar] [CrossRef]
- Margaryan, H.; Dorosh, A.; Capkova, J.; Manaskova-Postlerova, P.; Philimonenko, A.; Hozak, P.; Peknicova, J. Characterization and possible function of glyceraldehyde-3-phosphate dehydrogenase-spermatogenic protein GAPDHS in mammalian sperm. Reprod. Biol. Endocrinol. 2015, 13, 15. [Google Scholar] [CrossRef]
- Capkova, J.; Kubatova, A.; Ded, L.; Tepla, O.; Peknicova, J. Evaluation of the expression of sperm proteins in normozoospermic and asthenozoospermic men using monoclonal antibodies. Asian J. Androl. 2016, 18, 108–113. [Google Scholar] [CrossRef]
- Harrison, R.A.P.; Ashworth, P.J.C.; Miller, N.G.A. Bicarbonate/CO2, an effector of capacitation, induces a rapid and reversible change in the lipid architecture of boar sperm plasma membranes. Mol. Reprod. Dev. 1996, 45, 378–391. [Google Scholar] [CrossRef]
- Muratori, M.; Porazzi, I.; Luconi, M.; Marchiani, S.; Forti, G.; Baldi, E. Annexin V binding and merocyanine staining fail to detect human sperm capacitation. J. Androl. 2004, 25, 797–810. [Google Scholar] [CrossRef]
- Piehler, E.; Petrunkina, A.M.; Ekhlasi-Hundrieser, M.; Topfer-Petersen, E. Dynamic quantification of the tyrosine phosphorylation of the sperm surface proteins during capacitation. Cytom. Part A 2006, 69, 1062–1070. [Google Scholar] [CrossRef]
- Chavez, J.C.; De la Vega-Beltran, J.L.; Jose, O.; Torres, P.; Nishigaki, T.; Trevino, C.L.; Darszon, A. Acrosomal alkalization triggers Ca2+ release and acrosome reaction in mammalian spermatozoa. J. Cell. Physiol. 2018, 233, 4735–4747. [Google Scholar] [CrossRef]
- Zou, T.J.; Liu, X.; Ding, S.S.; Xing, J.P. Evaluation of sperm mitochondrial function using rh123/PI dual fluorescent staining in asthenospermia and oligoasthenozoospermia. J. Biomed. Res. 2010, 24, 404–410. [Google Scholar] [CrossRef]
- Garner, D.L.; Thomas, C.A.; Joerg, H.W.; DeJarnette, J.M.; Marshall, C.E. Fluorometric assessments of mitochondrial function and viability in cryopreserved bovine spermatozoa. Biol. Reprod. 1997, 57, 1401–1406. [Google Scholar] [CrossRef] [PubMed]
- Dominguez-Rebolledo, A.E.; Fernandez-Santos, M.R.; Bisbal, A.; Ros-Santaella, J.L.; Ramon, M.; Carmona, M.; Martinez-Pastor, F.; Garde, J.J. Improving the effect of incubation and oxidative stress on thawed spermatozoa from red deer by using different antioxidant treatments. Reprod. Fertil. Dev. 2010, 22, 856–870. [Google Scholar] [CrossRef] [PubMed]
- Zhao, H.T.; Joseph, J.; Fales, H.M.; Sokoloski, E.A.; Levine, R.L.; Vasquez-Vivar, J.; Kalyanaraman, B. Detection and characterization of the product of hydroethidine and intracellular superoxide by HPLC and limitations of fluorescence. Proc. Natl. Acad. Sci. USA 2005, 102, 5727–5732. [Google Scholar] [CrossRef]
- Koppers, A.J.; De Iuliis, G.N.; Finnie, J.M.; McLaughlin, E.A.; Aitken, R.J. Significance of mitochondrial reactive oxygen species in the generation of oxidative stress in spermatozoa. J. Clin. Endocrinol. Metab. 2008, 93, 3199–3207. [Google Scholar] [CrossRef]
- Brouwers, J.; Gadella, B.M. In Situ detection and localization of lipid peroxidation in individual bovine sperm cells. Free Radic. Biol. Med. 2003, 35, 1382–1391. [Google Scholar] [CrossRef]
- Henkel, R. ROS and Semen Quality. In Studies on Men’s Health and Fertility, Oxidative Stress in Applied Basic Research and Clinical Practice; Agarwal, A., Aitken, R., Alvarez, J., Eds.; Humana Press: Totowa, NJ, USA, 2012; pp. 301–323. [Google Scholar]
- Tvrda, E.; Kacaniova, M.; Balazi, A.; Vasicek, J.; Vozaf, J.; Jurcik, R.; Duracka, M.; Ziarovska, J.; Kovac, J.; Chrenek, P. The Impact of Bacteriocenoses on Sperm Vitality, Immunological and Oxidative Characteristics of Ram Ejaculates: Does the Breed Play a Role? Animals 2022, 12, 54. [Google Scholar] [CrossRef]
- Ricci, G.; Presani, G.; Guaschino, S.; Simeone, R.; Perticarari, S. Leukocyte detection in human semen using flow cytometry. Hum. Reprod. 2000, 15, 1329–1337. [Google Scholar] [CrossRef]
- Evenson, D.; Jost, L. Sperm chromatin structure assay is useful for fertility assessment. Methods Cell Sci. Off. J. Soc. Vitr. Biol. 2000, 22, 169–189. [Google Scholar] [CrossRef]
- Waterhouse, K.E.; Haugan, T.; Kommisrud, E.; Tverdal, A.; Flatberg, G.; Farstad, W.; Evenson, D.P.; De Angelis, P.M. Sperm DNA damage is related to field fertility of semen from young Norwegian Red bulls. Reprod. Fertil. Dev. 2006, 18, 781–788. [Google Scholar] [CrossRef]
- Sutovsky, P.; Turner, R.M.; Hameed, S.; Sutovsky, M. Differential ubiquitination of stallion sperm proteins: Possible implications for infertility and reproductive seasonality. Biol. Reprod. 2003, 68, 688–698. [Google Scholar] [CrossRef]
- Sutovsky, P. Ubiquitin-dependent proteolysis in mammalian spermatogenesis, fertilization, and sperm quality control: Killing three birds with one stone. Microsc. Res. Tech. 2003, 61, 88–102. [Google Scholar] [CrossRef] [PubMed]
- Sutovsky, P.; Neuber, E.; Schatten, G. Ubiquitin-dependent sperm quality control mechanism recognizes spermatozoa with DNA defects as revealed by dual ubiquitin-TUNEL assay. Mol. Reprod. Dev. 2002, 61, 406–413. [Google Scholar] [CrossRef]
- Sutovsky, P. New Approaches to Boar Semen Evaluation, Processing and Improvement. Reprod. Domest. Anim. 2015, 50, 11–19. [Google Scholar] [CrossRef] [PubMed]
- Yoshida, N.; Yano, Y.; Yoshiki, A.; Ueno, M.; Deguchi, N.; Hirotsune, S. Identification of a new target molecule for a cascade therapy of polycystic kidney. Hum. Cell 2003, 16, 65–72. [Google Scholar] [CrossRef] [PubMed]
- Buckman, C.; Ozanon, C.; Qiu, J.; Sutovsky, M.; Carafa, J.A.; Rawe, V.Y.; Manandhar, G.; Miranda-Vizuete, A.; Sutovsky, P. Semen Levels of Spermatid-Specific Thioredoxin-3 Correlate with Pregnancy Rates in ART Couples. PLoS ONE 2013, 8, e61000. [Google Scholar] [CrossRef]
- Sutovsky, P.; Aarabi, M.; Miranda-Vizuete, A.; Oko, R. Negative biomarker based male fertility evaluation: Sperm phenotypes associated with molecular-level anomalies. Asian J. Androl. 2015, 17, 554–560. [Google Scholar] [CrossRef]
- Stiavnicka, M.; Garcia-Alvarez, O.; Ulcova-Gallova, Z.; Sutovsky, P.; Abril-Parreno, L.; Dolejsova, M.; Rimnacova, H.; Moravec, J.; Hosek, P.; Losan, P.; et al. H3K4me2 accompanies chromatin immaturity in human spermatozoa: An epigenetic marker for sperm quality assessment. Syst. Biol. Reprod. Med. 2020, 66, 3–11. [Google Scholar] [CrossRef]
- Flowers, W.L. Management of Reproduction. In Progress in Pig Science; Wiseman, J., Varley, M., Chadwick, J., Eds.; Nottingham University Press: Nottingham, UK, 1998; pp. 383–405. [Google Scholar]
- Duracka, M.; Kovacik, A.; Kacaniova, M.; Lukac, N.; Tvrda, E. Bacteria may deteriorate progressive motility of bovine spermatozoa and biochemical parameters of seminal plasma. J. Microbiol. Biotechnol. Food Sci. 2020, 9, 844–847. [Google Scholar] [CrossRef]
- Makarevich, A.V.; Spalekova, E.; Olexikova, L.; Lukac, N.; Kubovicova, E.; Hegedusova, Z. Functional characteristics of ram cooling-stored spermatozoa under the influence of epidermal growth factor. Gen. Physiol. Biophys. 2011, 30, S36–S43. [Google Scholar] [CrossRef]
- Makarevich, A.V.; Spalekova, E.; Olexikova, L.; Kubovicova, E.; Hegedusova, Z. Effect of insulin-like growth factor I on functional parameters of ram cooled-stored spermatozoa. Zygote 2014, 22, 305–313. [Google Scholar] [CrossRef] [PubMed]
- Gaitskell-Phillips, G.; Martin-Cano, F.E.; Ortiz-Rodriguez, J.M.; Silva-Rodriguez, A.; Da Silva-Alvarez, E.; Gil, M.C.; Ortega-Ferrusola, C.; Pena, F.J. The seminal plasma proteins Peptidyl arginine deaminase 2, rRNA adenine N (6)-methyltransferase and KIAA0825 are linked to better motility post thaw in stallions. Theriogenology 2022, 177, 94–102. [Google Scholar] [CrossRef] [PubMed]
- Svoradová, A.; Macháč, M.; Baláži, A.; Vašíček, J.; Jurčík, R.; Huba, J.; Chrenek, P. Semen quality assessment of improved Wallachian sheep breed: A preliminary study. Slovak J. Anim. Sci. 2020, 53, 92–95. [Google Scholar]
- De Iuliis, G.N.; Wingate, J.K.; Koppers, A.J.; McLaughlin, E.A.; Aitken, R.J. Definitive evidence for the nonmitochondrial production of superoxide anion by human spermatozoa. J. Clin. Endocrinol. Metab. 2006, 91, 1968–1975. [Google Scholar] [CrossRef]
- Svoradová, A.; Baláži, A.; Vašíček, J.; Hrnčár, C.; Chrenek, P. Quality evaluation of fresh gander semen of Slovak white goose by casa and flow cytometry. Slovak J. Anim. Sci. 2019, 52, 90–94. [Google Scholar]
- Varum, S.; Bento, C.; Sousa, A.P.M.; Gomes-Santos, C.S.S.; Henriques, P.; Almeida-Santos, T.; Teodosio, C.; Paiva, A.; Ramalho-Santos, J. Characterization of human sperm populations using conventional parameters, surface ubiquitination, and apoptotic markers. Fertil. Steril. 2007, 87, 572–583. [Google Scholar] [CrossRef][Green Version]
- Peris-Frau, P.; Alvarez-Rodriguez, M.; Martin-Maestro, A.; Iniesta-Cuerda, M.; Sanchez-Ajofrin, I.; Medina-Chavez, D.A.; Garde, J.J.; Villar, M.; Rodriguez-Martinez, H.; Soler, A.J. Unravelling how in vitro capacitation alters ram sperm chromatin before and after cryopreservation. Andrology 2021, 9, 414–425. [Google Scholar] [CrossRef]
- Ledesma, A.; Fernandez-Alegre, E.; Cano, A.; Hozbor, F.; Martinez-Pastor, F.; Cesari, A. Seminal plasma proteins interacting with sperm surface revert capacitation indicators in frozen-thawed ram sperm. Anim. Reprod. Sci. 2016, 173, 35–41. [Google Scholar] [CrossRef]
- Neila-Montero, M.; Riesco, M.F.; Alvarez, M.; Montes-Garrido, R.; Boixo, J.C.; de Paz, P.; Anel-Lopez, L.; Anel, L. Centrifugal force assessment in ram sperm: Identifying species-specific impact. Acta Vet. Scand. 2021, 63, 42. [Google Scholar] [CrossRef]
- Riesco, M.F.; Alvarez, M.; Anel-Lopez, L.; Neila-Montero, M.; Palacin-Martinez, C.; Montes-Garrido, R.; Boixo, J.C.; de Paz, P.; Anel, L. Multiparametric Study of Antioxidant Effect on Ram Sperm Cryopreservation-From Field Trials to Research Bench. Animals 2021, 11, 283. [Google Scholar] [CrossRef]
- Lee, M.C.; Damjanov, I. Lectin binding-sites on human-sperm and spermatogenic cells. Anat. Rec. 1985, 212, 282–287. [Google Scholar] [CrossRef] [PubMed]
- Fabrega, A.; Puigmule, M.; Dacheux, J.L.; Bonet, S.; Pinart, E. Glycocalyx characterisation and glycoprotein expression of Sus domesticus epididymal sperm surface samples. Reprod. Fertil. Dev. 2012, 24, 619–630. [Google Scholar] [CrossRef] [PubMed]
- Wu, S.C.; Yang, H.T.; Liu, M. Biochemical identification and characterisation of changes associated with capacitation of mannosylated glycoproteins in murine sperm. Andrologia 2012, 44, 747–755. [Google Scholar] [CrossRef] [PubMed]
- Gimeno-Martos, S.; Miguel-Jimenez, S.; Casao, A.; Cebrian-Perez, J.A.; Muino-Blanco, T.; Perez-Pe, R. Underlying molecular mechanism in the modulation of the ram sperm acrosome reaction by progesterone and 17 beta-estradiol. Anim. Reprod. Sci. 2020, 221, 106567. [Google Scholar] [CrossRef]
- Miguel-Jimenez, S.; Pina-Beltran, B.; Gimeno-Martos, S.; Carvajal-Serna, M.; Casao, A.; Perez-Pe, R. NADPH Oxidase 5 and Melatonin: Involvement in Ram Sperm Capacitation. Front. Cell Dev. Biol. 2021, 9, 655794. [Google Scholar] [CrossRef]
- de Lamirande, E.; Lamothe, G. Reactive oxygen-induced reactive oxygen formation during human sperm capacitation. Free Radic. Biol. Med. 2009, 46, 502–510. [Google Scholar] [CrossRef]
- Dutta, S.; Majzoub, A.; Agarwal, A. Oxidative stress and sperm function: A systematic review on evaluation and management. Arab. J. Urol. 2019, 17, 87–97. [Google Scholar] [CrossRef]
- Zielonka, J.; Kalyanaraman, B. Hydroethidine- and MitoSOX-derived red fluorescence is not a reliable indicator of intracellular superoxide formation: Another inconvenient truth. Free Radic. Biol. Med. 2010, 48, 983–1001. [Google Scholar] [CrossRef]
- Dikalov, S.I.; Harrison, D.G. Methods for Detection of Mitochondrial and Cellular Reactive Oxygen Species. Antioxid. Redox Signal. 2014, 20, 372–382. [Google Scholar] [CrossRef]
- Nazarewicz, R.R.; Bikineyeva, A.; Dikalov, S.I. Rapid and Specific Measurements of Superoxide Using Fluorescence Spectroscopy. J. Biomol. Screen. 2013, 18, 498–503. [Google Scholar] [CrossRef]
- Zaja, I.Z.; Berta, V.; Valpotic, H.; Samardzija, M.; Milinkovic-Tur, S.; Vilic, M.; Suran, J.; Hlede, J.P.; Duricic, D.; Spoljaric, B.; et al. The influence of exogenous melatonin on antioxidative status in seminal plasma and spermatozoa in French Alpine bucks during the nonbreeding season. Domest. Anim. Endocrinol. 2020, 71, 106400. [Google Scholar] [CrossRef] [PubMed]
- Tvarozkova, K.; Vasicek, J.; Uhrincat, M.; Macuhova, L.; Hleba, L.; Tancin, V. The presence of pathogens in milk of ewes in relation to the somatic cell count and subpopulations of leukocytes. Czech J. Anim. Sci. 2021, 66, 315–322. [Google Scholar] [CrossRef]
- Alvarez, J.G.; Sharma, R.K.; Ollero, M.; Saleh, R.A.; Lopez, M.C.; Thomas, A.J.; Evenson, D.P.; Agarwal, A. Increased DNA damage in sperm from leukocylospermic semen samples as determined by the sperm chromatin structure assay. Fertil. Steril. 2002, 78, 319–329. [Google Scholar] [CrossRef]
- Garcia-Macias, V.; Martinez-Pastor, F.; Alvarez, M.; Garde, J.J.; Anel, E.; Anel, L.; de Paz, P. Assessment of chromatin status (SCSA (R)) in epididymal and ejaculated sperm in Iberian red deer, ram and domestic dog. Theriogenology 2006, 66, 1921–1930. [Google Scholar] [CrossRef] [PubMed]
- Garcia-Macias, V.; Martinez-Pastor, F.; Alvarez, M.; Borragan, S.; Chamorro, C.A.; Soler, A.J.; Anel, L.; De Paz, P. Seasonal changes in sperm chromatin condensation in ram (Ovis aries), Iberian red deer (Cervus elaphus hispanicus), and brown bear (Ursus arctos). J. Androl. 2006, 27, 837–846. [Google Scholar] [CrossRef] [PubMed]
- Odhiambo, J.F.; Sutovsky, M.; DeJarnette, J.M.; Marshall, C.; Sutovsky, P. Adaptation of ubiquitin-PNA based sperm quality assay for semen evaluation by a conventional flow cytometer and a dedicated platform for flow cytometric semen analysis. Theriogenology 2011, 76, 1168–1176. [Google Scholar] [CrossRef]
- Purdy, P.H. Ubiquitination and its influence in boar sperm physiology and cryopreservation. Theriogenology 2008, 70, 818–826. [Google Scholar] [CrossRef]
- Sutovsky, P.; Moreno, R.; Ramalho-Santos, J.; Dominko, T.; Winston, W.E.; Schatten, G. A putative, ubiquitin-dependent mechanism for the recognition and elimination of defective spermatozoa in the mammalian epididymis. J. Cell Sci. 2001, 114, 1665–1675. [Google Scholar] [CrossRef]
- Lanconi, R.; Celeghini, E.C.C.; Gonella-Diaza, A.M.; De Giuli, V.; de Carvalho, C.P.T.; Zoca, G.B.; Garcia-Oliveros, L.N.; Batissaco, L.; Oliveira, L.Z.; de Arruda, R.P. Relationship between sperm ubiquitination and equine semen freezability. Reprod. Domest. Anim. 2022, 57, 465–472. [Google Scholar] [CrossRef]
- Kennedy, C.E.; Krieger, K.B.; Sutovsky, M.; Xu, W.; Vargovic, P.; Didion, B.A.; Ellersieck, M.R.; Hennessy, M.E.; Verstegen, J.; Oko, R.; et al. Protein Expression Pattern of PAWP in Bull Spermatozoa Is Associated with SpermQuality and Fertility Following Artificial Insemination. Mol. Reprod. Dev. 2014, 81, 436–449. [Google Scholar] [CrossRef]
- Kerns, K.; Jankovitz, J.; Robinson, J.; Minton, A.; Kuster, C.; Sutovsky, P. Relationship between the Length of Sperm Tail Mitochondrial Sheath and Fertility Traits in Boars Used for Artificial Insemination. Antioxidants 2020, 9, 1033. [Google Scholar] [CrossRef] [PubMed]
- Lindsey, L.L.; Platt, R.N.; Phillips, C.D.; Ray, D.A.; Bradley, R.D. Differential Expression in Testis and Liver Transcriptomes from Four Species of Peromyscus (Rodentia: Cricetidae). Genome Biol. Evol. 2020, 12, 3698–3709. [Google Scholar] [CrossRef] [PubMed]
- Sutovsky, P. Pig Overview. In Encyclopedia of Reproduction, 2nd ed.; Skinner, M.K., Ed.; Academic Press: Cambridge, MA, USA, 2018; Volume 1, pp. 501–507. [Google Scholar]
- Bauer, M.; Baláži, A.; Olexiková, L.; Vašíček, J.; Chrenek, P. Comparison of the semen swim-up and somatic cell lysis procedures for ram sperm RNA extraction. Slovak J. Anim. Sci. 2021, 54, 107–112. [Google Scholar]
- Aarabi, M.; Balakier, H.; Bashar, S.; Moskovtsev, S.I.; Sutovsky, P.; Librach, C.L.; Oko, R. Sperm content of postacrosomal WW binding protein is related to fertilization outcomes in patients undergoing assisted reproductive technology. Fertil. Steril. 2014, 102, 440–447. [Google Scholar] [CrossRef] [PubMed]
- Wu, A.T.H.; Sutovsky, P.; Manandhar, G.; Xu, W.; Katayama, M.; Day, B.N.; Park, K.W.; Yi, Y.J.; Xi, Y.W.; Prather, R.S.; et al. PAWP, a sperm-specific WW domain-binding protein, promotes meiotic resumption and pronuclear development during fertilization. J. Biol. Chem. 2007, 282, 12164–12175. [Google Scholar] [CrossRef] [PubMed]
- Tavalaee, M.; Razavi, S.; Nasr-Esfahani, M.H. Influence of sperm chromatin anomalies on assisted reproductive technology outcome. Fertil. Steril. 2009, 91, 1119–1126. [Google Scholar] [CrossRef]
- Tunc, O.; Tremellen, K. Oxidative DNA damage impairs global sperm DNA methylation in infertile men. J. Assist. Reprod. Genet. 2009, 26, 537–544. [Google Scholar] [CrossRef]
- Bahreinian, M.; Tavalaee, M.; Abbasi, H.; Kiani-Esfahani, A.; Shiravi, A.H.; Nasr-Esfahani, M.H. DNA hypomethylation predisposes sperm to DNA damage in individuals with varicocele. Syst. Biol. Reprod. Med. 2015, 61, 179–186. [Google Scholar] [CrossRef]
- Vozaf, J.; Makarevich, A.V.; Balazi, A.; Vasicek, J.; Svoradova, A.; Olexikova, L.; Chrenek, P. Cryopreservation of ram semen: Manual versus programmable freezing and different lengths of equilibration. Anim. Sci. J. 2021, 92, e13670. [Google Scholar] [CrossRef]
- Elweza, A.E.; Sharshar, A.M.; Elbaz, H.T. Doppler and B-mode ultrasonographic monitoring of accessory sex glands and testes in Barki rams during the breeding season. Vet. Stanica 2021, 52, 173–183. [Google Scholar] [CrossRef]
- Mahfouz, R.Z.; du Plessis, S.S.; Aziz, N.; Sharma, R.; Sabanegh, E.; Agarwal, A. Sperm viability, apoptosis, and intracellular reactive oxygen species levels in human spermatozoa before and after induction of oxidative stress. Fertil. Steril. 2010, 93, 814–821. [Google Scholar] [CrossRef] [PubMed]
- Bolanos, J.M.G.; da Silva, C.M.B.; Munoz, P.M.; Rodriguez, A.M.; Davila, M.P.; Rodriguez-Martinez, H.; Aparicio, I.M.; Tapia, J.A.; Ferrusola, C.O.; Pena, F.J. Phosphorylated AKT preserves stallion sperm viability and motility by inhibiting caspases 3 and 7. Reproduction 2014, 148, 221–235. [Google Scholar] [CrossRef] [PubMed]
- Nagy, S.; Jansen, J.; Topper, E.K.; Gadella, B.M. A triple-stain flow cytometric method to assess plasma- and acrosome-membrane integrity of cryopreserved bovine sperm immediately after thawing in presence of egg-yolk particles. Biol. Reprod. 2003, 68, 1828–1835. [Google Scholar] [CrossRef] [PubMed]


Publisher’s Note: MDPI stays neutral with regard to jurisdictional claims in published maps and institutional affiliations. |
© 2022 by the authors. Licensee MDPI, Basel, Switzerland. This article is an open access article distributed under the terms and conditions of the Creative Commons Attribution (CC BY) license (https://creativecommons.org/licenses/by/4.0/).
Share and Cite
Vašíček, J.; Baláži, A.; Svoradová, A.; Vozaf, J.; Dujíčková, L.; Makarevich, A.V.; Bauer, M.; Chrenek, P. Comprehensive Flow-Cytometric Quality Assessment of Ram Sperm Intended for Gene Banking Using Standard and Novel Fertility Biomarkers. Int. J. Mol. Sci. 2022, 23, 5920. https://doi.org/10.3390/ijms23115920
Vašíček J, Baláži A, Svoradová A, Vozaf J, Dujíčková L, Makarevich AV, Bauer M, Chrenek P. Comprehensive Flow-Cytometric Quality Assessment of Ram Sperm Intended for Gene Banking Using Standard and Novel Fertility Biomarkers. International Journal of Molecular Sciences. 2022; 23(11):5920. https://doi.org/10.3390/ijms23115920
Chicago/Turabian StyleVašíček, Jaromír, Andrej Baláži, Andrea Svoradová, Jakub Vozaf, Linda Dujíčková, Alexander V. Makarevich, Miroslav Bauer, and Peter Chrenek. 2022. "Comprehensive Flow-Cytometric Quality Assessment of Ram Sperm Intended for Gene Banking Using Standard and Novel Fertility Biomarkers" International Journal of Molecular Sciences 23, no. 11: 5920. https://doi.org/10.3390/ijms23115920
APA StyleVašíček, J., Baláži, A., Svoradová, A., Vozaf, J., Dujíčková, L., Makarevich, A. V., Bauer, M., & Chrenek, P. (2022). Comprehensive Flow-Cytometric Quality Assessment of Ram Sperm Intended for Gene Banking Using Standard and Novel Fertility Biomarkers. International Journal of Molecular Sciences, 23(11), 5920. https://doi.org/10.3390/ijms23115920