
miR-205-5p Downregulation and ZEB1 Upregulation Characterize the Disseminated Tumor Cells in Patients with Invasive Ductal Breast Cancer


 , , , , ,
Abstract
:1. Introduction
2. Results
2.1. miRNA and mRNA Expressions vs. Controls
2.2. miRNA and mRNA Expressions in Different Types of Samples
2.3. Association between miRNA and mRNA Expression and Clinico-Pathological Parameters
3. Discussion
4. Materials and Methods
4.1. Patients
4.2. CD45 Depletion of Peripheral Blood and CTC Detection
4.3. miRNA and mRNA Isolation and Real-Time PCR
4.4. Immunohistochemical Analyses of E-Cadherin
4.5. Statistical Analysis
Supplementary Materials
Author Contributions
Funding
Institutional Review Board Statement
Informed Consent Statement
Acknowledgments
Conflicts of Interest
Abbreviations
| BC | Breast cancer |
| C-blood | CD45-depleted blood fraction from healthy women |
| C-breast | Non-neoplastic breast tissue |
| CD45-DB | CD45-depleted blood |
| CDH1 | Cadherin 1 |
| CI | Confidence interval |
| CTC | Circulating tumor cells |
| EMT | Epithelial-to-mesenchymal transition |
| ER | Estrogen receptor |
| FC | Fold change |
| FFPE | Formalin-fixed paraffin-embedded tissue |
| HER2 | Human epidermal growth factor receptor 2 |
| LN | Lymph node |
| LNM | Lymph node metastasis |
| LVI | Lymphovascular invasion |
| mRNA | Messenger RNA |
| miRNA | microRNA |
| MTS | Distant metastasis |
| OR | Odds ratio |
| PR | Progesterone receptor |
| r | Correlation coefficient |
| RT-PCR | Real time- Polymerase chain reaction |
| SNAI1 | Snail Family Transcriptional Repressor 1 |
| SNAI2 | Snail Family Transcriptional Repressor 2 |
| TNBC | Triple-negative breast cancer |
| TNM | Tumor Node Metastasis staging |
| TU-C | Tumor centrum |
| TU-IF | Tumor invasive front |
| TWIST1 | Twist Family BHLH Transcription Factor 1 |
| ZEB1 | Zinc Finger E-Box Binding Homeobox 1 |
| ZEB2 | Zinc Finger E-Box Binding Homeobox 2 |
References
- Bray, F.; Ferlay, J.; Soerjomataram, I.; Siegel, R.L.; Torre, L.A.; Jemal, A. Global cancer statistics 2018: GLOBOCAN estimates of incidence and mortality worldwide for 36 cancers in 185 countries. CA Cancer J. Clin. 2018, 68, 394–424. [Google Scholar] [CrossRef] [PubMed] [Green Version]
- Wu, Q.; Li, J.; Zhu, S.; Wu, J.; Chen, C.; Liu, Q.; Wei, W.; Zhang, Y.; Sun, S. Breast cancer subtypes predict the preferential site of distant metastases: A SEER based study. Oncotarget 2017, 8, 27990–27996. [Google Scholar] [CrossRef] [PubMed] [Green Version]
- Cummings, M.C.; Simpson, P.T.; Reid, L.E.; Jayanthan, J.; Skerman, J.; Song, S.; McCart Reed, A.E.; Kutasovic, J.R.; Morey, A.L.; Marquart, L.; et al. Metastatic progression of breast cancer: Insights from 50 years of autopsies. J. Pathol. 2014, 232, 23–31. [Google Scholar] [CrossRef] [PubMed] [Green Version]
- Barinoff, J.; Hils, R.; Bender, A.; Groß, J.; Kurz, C.; Tauchert, S.; Mann, E.; Schwidde, I.; Ipsen, B.; Sawitzki, K.; et al. Clinicopathological diferences between breast cancer in patients with primary metastatic disease and those without: A multicentre study. Eur. J. Cancer 2013, 49, 305–311. [Google Scholar] [CrossRef] [PubMed]
- Eng, L.G.; Dawood, S.; Sopik, V.; Haaland, B.; Tan, P.S.; Bhoo-Pathy, N.; Warner, E.; Iqbal, J.; Narod, S.A.; Dent, R. Ten-year survival in women with primary stage IV breast cancer. Breast Cancer Res. Treat. 2016, 160, 145–152. [Google Scholar] [CrossRef] [PubMed]
- Paduch, R. The role of lymphangiogenesis and angiogenesis in tumor metastasis. Cell Oncol. 2016, 39, 397–410. [Google Scholar] [CrossRef] [PubMed] [Green Version]
- Sleeman, J.P.; Nazarenko, I.; Thiele, W. Do all roads lead to Rome? Routes to metastasis development. Int. J. Cancer 2011, 128, 2511–2526. [Google Scholar] [CrossRef]
- Wong, S.Y.; Hynes, R.O. Lymphatic or hematogenous dissemination: How does a metastatic tumor cell decide? Cell Cycle 2006, 5, 812–817. [Google Scholar] [CrossRef] [PubMed] [Green Version]
- Witte, M.H.; Dellinger, M.T.; McDonald, D.M.; Nathanson, S.D.; Boccardo, F.M.; Campisi, C.C.; Sleeman, J.P.; Gershenwald, J.E. Lymphangiogenesis and hemangiogenesis: Potential targets for therapy. J. Surg. Oncol. 2011, 103, 489–500. [Google Scholar] [CrossRef] [PubMed] [Green Version]
- Nathanson, S.D.; Kwon, D.; Kapke, A.; Alford, S.H.; Chitale, D. The role of lymph node metastasis in the systemic dissemination of breast cancer. Ann. Surg. Oncol. 2009, 16, 3396–3405. [Google Scholar] [CrossRef] [Green Version]
- Nathanson, S.D.; Krag, D.; Kuerer, H.M.; Newman, L.A.; Brown, M.; Kerjaschki, D.; Pereira, E.R.; Padera, T.P. Breast cancer metastasis through the lympho-vascular system. Clin. Exp. Metastasis 2018, 35, 443–454. [Google Scholar] [CrossRef] [PubMed]
- Cristofanilli, M.; Budd, G.T.; Ellis, M.J.; Stopeck, A.; Matera, J.; Miller, M.C.; Reuben, J.M.; Doyle, G.V.; Allard, W.J.; Terstappen, L.W.M.M.; et al. Circulating tumor cells, disease progression, and survival in metastatic breast cancer. N. Engl. J. Med. 2004, 351, 781–791. [Google Scholar] [CrossRef] [PubMed] [Green Version]
- Giuliano, M.; Giordano, A.; Jackson, S.; De Giorgi, U.; Mego, M.; Cohen, E.N.; Gao, H.; Anfossi, S.; Handy, B.C.; Ueno, N.T.; et al. Circulating tumor cells as early predictors of metastatic spread in breast cancer patients with limited metastatic dissemination. Breast Cancer Res. 2014, 16, 440. [Google Scholar] [CrossRef] [PubMed] [Green Version]
- Bidard, F.-C.; Proudhon, C.; Pierga, J.-Y. Circulating tumor cells in breast cancer. Mol. Oncol. 2016, 10, 418–430. [Google Scholar] [CrossRef] [PubMed] [Green Version]
- Balic, M.; Lin, H.; Williams, A.; Datar, R.H.; Cote, R.J. Progress in circulating tumor cell capture and analysis: Implications for cancer management. Expert Rev. Mol. Diagn. 2012, 12, 303–312. [Google Scholar] [CrossRef] [Green Version]
- Krebs, M.G.; Metcalf, R.L.; Carter, L.; Brady, G.; Blackhall, F.H.; Dive, C. Molecular analysis of circulating tumour cells-biology and biomarkers. Nat. Rev. Clin. Oncol. 2014, 11, 129–144. [Google Scholar] [CrossRef] [PubMed]
- Kallergi, G.; Papadaki, M.A.; Politaki, E.; Mavroudis, D.; Georgoulias, V.; Agelaki, S. Epithelial to mesenchymal transition markers expressed in circulating tumour cells of early and metastatic breast cancer patients. Breast Cancer Res. 2011, 13, R59. [Google Scholar] [CrossRef] [Green Version]
- Mego, M.; Mani, S.A.; Lee, B.N.; Li, C.; Evans, K.W.; Cohen, E.N.; Gao, H.; Jackson, S.A.; Giordano, A.; Hortobagyi, G.N.; et al. Expression of epithelial-mesenchymal transition-inducing transcription factors in primary breast cancer: The effect of neoadjuvant therapy. Int. J. Cancer 2012, 130, 808–816. [Google Scholar] [CrossRef]
- Lustberg, M.B.; Balasubramanian, P.; Miller, B.; Garcia-Villa, A.; Deighan, C.; Wu, Y.; Carothers, S.; Berger, M.; Ramaswamy, B.; Macrae, E.R.; et al. Heterogeneous atypical cell populations are present in blood of metastatic breast cancer patients. Breast Cancer Res. 2014, 16, R23. [Google Scholar] [CrossRef] [PubMed] [Green Version]
- Bulfoni, M.; Gerratana, L.; Del Ben, F.; Marzinotto, S.; Sorrentino, M.; Turetta, M.; Scoles, G.; Toffoletto, B.; Isola, M.; Beltrami, C.A.; et al. In patients with metastatic breast cancer the identification of circulating tumor cells in epithelial-to-mesenchymal transition is associated with a poor prognosis. Breast Cancer Res. 2016, 18, 30. [Google Scholar] [CrossRef] [PubMed] [Green Version]
- Kalluri, R.; Weinberg, R.A. The basics of epithelial-mesenchymal transition. J. Clin. Investig. 2009, 119, 1420–1428. [Google Scholar] [CrossRef] [PubMed] [Green Version]
- Pang, M.F.; Georgoudaki, A.M.; Lambut, L.; Johansson, J.; Tabor, V.; Hagikura, K.; Jin, Y.; Jansson, M.; Alexander, J.S.; Nelson, C.M.; et al. TGF-1-induced EMT promotes targeted migration of breast cancer cells through the lymphatic system by the activation of CCR7/CCL21-mediated chemotaxis. Oncogene 2016, 35, 748–760. [Google Scholar] [CrossRef]
- Moyret-Lalle, C.; Ruiz, E.; Puisieux, A. Epithelial-mesenchymal transition transcription factors and miRNAs: “Plastic surgeons” of breast cancer. World J. Clin. Oncol. 2014, 5, 311–322. [Google Scholar] [CrossRef]
- Nickel, A.; Stadler, S.C. Role of epigenetic mechanisms in epithelial-to-mesenchymal transition of breast cancer cells. Transl. Res. 2015, 165, 126–142. [Google Scholar] [CrossRef]
- Berx, G.; Van Roy, F. The E-cadherin/catenin complex: An important gatekeeper in breast cancer tumorigenesis and malignant progression. Breast Cancer Res. 2001, 3, 289–293. [Google Scholar] [CrossRef]
- Petridis, C.; Shinomiya, I.; Kohut, K.; Gorman, P.; Caneppele, M.; Shah, V.; Troy, M.; Pinder, S.E.; Hanby, A.; Tomlinson, I.; et al. Germline CDH1 mutations in bilateral lobular carcinoma in situ. Br. J. Cancer 2014, 110, 1053–1057. [Google Scholar] [CrossRef] [PubMed] [Green Version]
- Caldeira, J.R.F.; Prando, E.C.; Quevedo, F.C.; Neto, F.A.M.; Rainho, C.A.; Rogatto, S.R. CDH1 promoter hypermethylation and E-cadherin protein expression in infiltrating breast cancer. BMC Cancer 2006, 6, 48. [Google Scholar] [CrossRef] [Green Version]
- Sebova, K.; Zmetakova, I.; Bella, V.; Kajo, K.; Stankovicova, I.; Kajabova, V.; Krivulcik, T.; Lasabova, Z.; Tomka, M.; Galbavy, S.; et al. RASSF1A and CDH1 hypermethylation as potential epimarkers in breast cancer. Cancer Biomark. 2012, 10, 13–26. [Google Scholar] [CrossRef]
- Fridrichova, I.; Zmetakova, I. MicroRNAs Contribute to Breast Cancer Invasiveness. Cells 2019, 8, 1361. [Google Scholar] [CrossRef] [PubMed] [Green Version]
- Ma, F.; Li, W.; Liu, C.; Li, W.; Yu, H.; Lei, B.; Ren, Y.; Li, Z.; Pang, D.; Qian, C. MiR-23a promotes TGF-β-1-induced EMT and tumor metastasis in breast cancer cells by directly targeting CDH1 and activating Wnt/β-catenin signaling. Oncotarget 2017, 8, 69538–69550. [Google Scholar] [CrossRef] [Green Version]
- Zhou, X.; Marian, C.; Makambi, K.H.; Kosti, O.; Kallakury, B.V.; Loffredo, C.A.; Zheng, Y.-L. MicroRNA-9 as potential biomarker for breast cancer local recurrence and tumor estrogen receptor status. PLoS ONE 2012, 7, e39011. [Google Scholar] [CrossRef]
- Lambertini, E.; Lolli, A.; Vezzali, F.; Penolazzi, L.; Gambari, R.; Piva, R. Correlation between Slug transcription factor and miR-221 in MDA-MB-231 breast cancer cells. BMC Cancer 2012, 12, 445. [Google Scholar] [CrossRef] [Green Version]
- Pan, Y.; Li, J.; Zhang, Y.; Wang, N.; Liang, H.; Liu, Y.; Zhang, C.Y.; Zen, K.; Gu, H. Slug-upregulated miR-221 promotes breast cancer progression through suppressing E-cadherin expression. Sci. Rep. 2016, 6, 25798. [Google Scholar] [CrossRef] [PubMed] [Green Version]
- Niu, X.-Y.; Zhang, Z.-Q.; Ma, P.-L. MiRNA-221-5p promotes breast cancer progression by regulating E-cadherin expression. Eur. Rev. Med. Pharm. Sci. 2019, 23, 6983–6990. [Google Scholar] [CrossRef]
- Stinson, S.; Lackner, M.R.; Adai, A.T.; Yu, N.; Kim, H.J.; O’Brien, C.; Spoerke, J.; Jhunjhunwala, S.; Boyd, Z.; Januario, T.; et al. TRPS1 targeting by miR-221/222 promotes the epithelial-to-mesenchymal transition in breast cancer. Sci. Signal. 2011, 4, ra41. [Google Scholar] [CrossRef]
- Castilla, M.Á.; Díaz-Martín, J.; Sarrió, D.; Romero-Pérez, L.; López-García, M.Á.; Vieites, B.; Biscuola, M.; Ramiro-Fuentes, S.; Isacke, C.M.; Palacios, J. MicroRNA-200 family modulation in distinct breast cancer phenotypes. PLoS ONE 2012, 7, e47709. [Google Scholar] [CrossRef] [PubMed] [Green Version]
- Hurteau, G.J.; Carlson, J.A.; Spivack, S.D.; Brock, G.J. Overexpression of the microRNA hsa-miR-200c leads to reduced expression of transcription factor 8 and increased expression of E-cadherin. Cancer Res. 2007, 67, 7972–7976. [Google Scholar] [CrossRef] [Green Version]
- Sundararajan, V.; Gengenbacher, N.; Stemmler, M.P.; Kleemann, J.A.; Brabletz, T.; Brabletz, S. The ZEB1/miR-200c feedback loop regulates invasion via actin interacting proteins MYLK and TKS5. Oncotarget 2015, 6, 27083–27096. [Google Scholar] [CrossRef] [Green Version]
- Chen, H.; Li, Z.; Zhang, L.; Zhang, L.; Zhang, Y.; Wang, Y.; Xu, M.; Zhong, Q. MicroRNA-200c inhibits the metastasis of triple-negative breast cancer by targeting ZEB2, an epithelial-mesenchymal transition regulator. Ann. Clin. Lab. Sci. 2020, 50, 519–527. [Google Scholar] [PubMed]
- Lee, J.-Y.; Park, M.K.; Park, J.-H.; Lee, H.J.; Shin, D.H.; Kang, Y.; Lee, C.H.; Kong, G. Loss of the polycomb protein Mel-18 enhances the epithelial-mesenchymal transition by ZEB1 and ZEB2 expression through the downregulation of miR-205 in breast cancer. Oncogene 2014, 33, 1325–1335. [Google Scholar] [CrossRef] [PubMed] [Green Version]
- Sun, E.-H.; Zhou, Q.; Liu, K.-S.; Wei, W.; Wang, C.-M.; Liu, X.-F.; Lu, C.; Ma, D.-Y. Screening miRNAs related to different subtypes of breast cancer with miRNAs microarray. Eur. Rev. Med. Pharm. Sci. 2014, 18, 2783–2788. [Google Scholar]
- Moes, M.; Le Béchec, A.; Crespo, I.; Laurini, C.; Halavatyi, A.; Vetter, G.; Del Sol, A.; Friederich, E. A novel network integrating a miRNA-203/SNAI1 feedback loop which regulates epithelial to mesenchymal transition. PLoS ONE 2012, 7, e35440. [Google Scholar] [CrossRef] [Green Version]
- Zhang, Z.; Zhang, B.; Li, W.; Fu, L.; Fu, L.; Zhu, Z.; Dong, J.-T. Epigenetic silencing of miR-203 upregulates SNAI2 and contributes to the invasiveness of malignant breast cancer cells. Genes Cancer 2011, 2, 782–791. [Google Scholar] [CrossRef]
- Ji, H.; Sang, M.; Liu, F.; Ai, N.; Geng, C. miR-124 regulates EMT based on ZEB2 target to inhibit invasion and metastasis in triple-negative breast cancer. Pathol. Res. Pr. 2019, 215, 697–704. [Google Scholar] [CrossRef] [PubMed]
- Liang, Y.-J.; Wang, Q.-Y.; Zhou, C.-X.; Yin, Q.-Q.; He, M.; Yu, X.-T.; Cao, D.-X.; Chen, G.-Q.; He, J.-R.; Zhao, Q. MiR-124 targets Slug to regulate epithelial-mesenchymal transition and metastasis of breast cancer. Carcinogenesis 2013, 34, 713–722. [Google Scholar] [CrossRef]
- Li, L.-Z.; Zhang, C.Z.; Liu, L.-L.; Yi, C.; Lu, S.-X.; Zhou, X.; Zhang, Z.-J.; Peng, Y.-H.; Yang, Y.-Z.; Yun, J.-P. miR-720 inhibits tumor invasion and migration in breast cancer by targeting TWIST1. Carcinogenesis 2014, 35, 469–478. [Google Scholar] [CrossRef] [PubMed] [Green Version]
- Jeschke, U.; Mylonas, I.; Kuhn, C.; Shabani, N.; Kunert-Keil, C.; Schindlbeck, C.; Gerber, B.; Friese, K. Expression of E-cadherin in human ductal breast cancer carcinoma in situ, invasive carcinomas, their lymph node metastases, their distant metastases, carcinomas with recurrence and in recurrence. Anticancer Res. 2007, 27, 1969–19674. [Google Scholar] [PubMed]
- Borcherding, N.; Cole, K.; Kluz, P.; Jorgensen, M.; Kolb, R.; Bellizzi, A.; Zhang, W. Re-evaluating E-cadherin and β-catenin: A pan-cancer proteomic approach with an emphasis on breast cancer. Am. J. Pathol. 2018, 188, 1910–1920. [Google Scholar] [CrossRef]
- Padmanaban, V.; Krol, I.; Suhail, Y.; Szczerba, B.M.; Aceto, N.; Bader, J.S.; Ewald, A.J. E-cadherin is required for metastasis in multiple models of breast cancer. Nature 2019, 573, 439–444. [Google Scholar] [CrossRef] [PubMed]
- Prasad, C.P.; Mirza, S.; Sharma, G.; Prashad, R.; DattaGupta, S.; Rath, G.; Ralhan, R. Epigenetic alterations of CDH1 and APC genes: Relationship with activation of Wnt/beta-catenin pathway in invasive ductal carcinoma of breast. Life Sci. 2008, 83, 318–325. [Google Scholar] [CrossRef]
- Cai, K.-T.; Feng, C.-X.; Zhao, J.-C.; He, R.-Q.; Ma, J.; Zhong, J.-C. Upregulated miR-203a-3p and its potential molecular mechanism in breast cancer: A study based on bioinformatics analyses and a comprehensive meta-analysis. Mol. Med. Rep. 2018, 18, 4994–5008. [Google Scholar] [CrossRef] [PubMed] [Green Version]
- Gomes, B.C.; Martins, M.; Lopes, P.; Morujão, I.; Oliveira, M.; Araújo, A.; Rueff, J.; Rodrigues, A.S. Prognostic value of microRNA-203a expression in breast cancer. Oncol. Rep. 2016, 36, 1748–1756. [Google Scholar] [CrossRef] [PubMed]
- Wu, H.-T.; Zhong, H.-T.; Li, G.-W.; Shen, J.-X.; Ye, Q.-Q.; Zhang, M.-L.; Liu, J. Oncogenic functions of the EMT-related transcription factor ZEB1 in breast cancer. J. Transl. Med. 2020, 18, 51. [Google Scholar] [CrossRef]
- Lehmann, W.; Mossmann, D.; Kleemann, J.; Mock, K.; Meisinger, C.; Brummer, T.; Herr, R.; Brabletz, S.; Stemmler, M.P.; Brabletz, T. ZEB1 turns into a transcriptional activator by interacting with YAP1 in aggressive cancer types. Nat. Commun. 2016, 7, 10498. [Google Scholar] [CrossRef] [PubMed]
- Zhang, Y.; Xu, L.; Li, A.; Han, X. The roles of ZEB1 in tumorigenic progression and epigenetic modifications. Biomed. Pharm. 2019, 110, 400–408. [Google Scholar] [CrossRef] [PubMed]
- Scherbakov, A.M.; Andreeva, O.E.; Shatskaya, V.A.; Krasil’nikov, M.A. The relationships between snail1 and estrogen receptor signaling in breast cancer cells. J. Cell Biochem. 2012, 113, 2147–2155. [Google Scholar] [CrossRef]
- Fu, J.; Zhang, L.; He, T.; Xiao, X.; Liu, X.; Wang, L.; Yang, L.; Yang, M.; Zhang, T.; Chen, R.; et al. TWIST represses estrogen receptor-alpha expression by recruiting the NuRD protein complex in breast cancer cells. Int. J. Biol. Sci. 2012, 8, 522–532. [Google Scholar] [CrossRef] [PubMed]
- Cochrane, D.R.; Cittelly, D.M.; Howe, E.N.; Spoelstra, N.S.; McKinsey, E.L.; LaPara, K.; Elias, A.; Yee, D.; Richer, J.K. MicroRNAs link estrogen receptor alpha status and Dicer levels in breast cancer. Horm. Cancer 2010, 1, 306–319. [Google Scholar] [CrossRef] [PubMed] [Green Version]
- Sakurai, M.; Masuda, M.; Miki, Y.; Hirakawa, H.; Suzuki, T.; Sasano, H. Correlation of miRNA expression profiling in surgical pathology materials, with Ki-67, HER2, ER and PR in breast cancer patients. Int. J. Biol. Markers 2015, 30, e190–e199. [Google Scholar] [CrossRef]
- van Nes, J.G.H.; de Kruijf, E.M.; Putter, H.; Faratian, D.; Munro, A.; Campbell, F.; Smit, V.T.H.B.M.; Liefers, G.-J.; Kuppen, P.J.K.; van de Velde, C.J.H.; et al. Co-expression of SNAIL and TWIST determines prognosis in estrogen receptor-positive early breast cancer patients. Breast Cancer Res. Treat. 2012, 133, 49–59. [Google Scholar] [CrossRef] [PubMed]
- Lv, X.-B.; Jiao, Y.; Qing, Y.; Hu, H.; Cui, X.; Lin, T.; Song, E.; Yu, F. miR-124 suppresses multiple steps of breast cancer metastasis by targeting a cohort of pro-metastatic genes in vitro. Chin. J. Cancer 2011, 30, 821–830. [Google Scholar] [CrossRef] [PubMed] [Green Version]
- Cai, W.-L.; Huang, W.-D.; Li, B.; Chen, T.-R.; Li, Z.-X.; Zhao, C.-L.; Li, H.-Y.; Wu, Y.-M.; Yan, W.-J.; Xiao, J.-R. microRNA-124 inhibits bone metastasis of breast cancer by repressing Interleukin-11. Mol. Cancer 2018, 17, 9. [Google Scholar] [CrossRef] [Green Version]
- Morel, A.P.; Ginestier, C.; Pommier, R.M.; Cabaud, O.; Ruiz, E.; Wicinski, J.; Devouassoux-Shisheboran, M.; Combaret, V.; Finetti, P.; Chassot, C.; et al. A stemness-related ZEB1-MSRB3 axis governs cellular pliancy and breast cancer genome stability. Nat. Med. 2017, 23, 568–578. [Google Scholar] [CrossRef]
- Plantamura, I.; Cataldo, A.; Cosentino, G.; Iorio, M.V. miR-205 in breast cancer: State of the art. Int. J. Mol. Sci. 2020, 22, 27. [Google Scholar] [CrossRef] [PubMed]
- Xiao, Y.; Humphries, B.; Yang, C.; Wang, Z. MiR-205 dysregulations in breast cancer: The complexity and opportunities. Noncoding RNA 2019, 5, 53. [Google Scholar] [CrossRef] [PubMed] [Green Version]
- Xiao, Y.; Li, Y.; Tao, H.; Humphries, B.; Li, A.; Jiang, Y.; Yang, C.; Luo, R.; Wang, Z. Integrin α5 down-regulation by miR-205 suppresses triple negative breast cancer stemness and metastasis by inhibiting the Src/Vav2/Rac1 pathway. Cancer Lett. 2018, 433, 199–290. [Google Scholar] [CrossRef] [PubMed]
- Chao, C.-H.; Chang, C.-C.; Wu, M.-J.; Ko, H.-W.; Wang, D.; Hung, M.-C.; Yang, J.-Y.; Chang, C.-J. MicroRNA-205 signaling regulates mammary stem cell fate and tumorigenesis. J. Clin. Investig. 2014, 124, 3093–3106. [Google Scholar] [CrossRef] [PubMed] [Green Version]
- Hu, Y.; Qiu, Y.; Yague, E.; Ji, W.; Liu, J.; Zhang, J. miRNA-205 targets VEGFA and FGF2 and regulates resistance to chemotherapeutics in breast cancer. Cell Death Dis. 2016, 7, e2291. [Google Scholar] [CrossRef] [Green Version]
- Smirnov, D.A.; Zweitzig, D.R.; Foulk, B.W.; Miller, M.C.; Doyle, G.V.; Pienta, K.J.; Meropol, N.J.; Weiner, L.M.; Cohen, S.J.; Moreno, J.G.; et al. Global gene expression profiling of circulating tumor cells. Cancer Res. 2005, 65, 4993–4997. [Google Scholar] [CrossRef] [PubMed] [Green Version]
- Lang, J.E.; Scott, J.H.; Wolf, D.M.; Novak, P.; Punj, V.; Magbanua, M.J.; Zhu, W.; Mineyev, N.; Haqq, C.M.; Crothers, J.R.; et al. Expression profiling of circulating tumor cells in metastatic breast cancer. Breast Cancer Res. Treat. 2015, 149, 121–131. [Google Scholar] [CrossRef] [PubMed] [Green Version]
- Onstenk, W.; Sieuwerts, A.M.; Weekhout, M.; Mostert, B.; Reijm, E.A.; van Deurzen, C.H.M.; Bolt-de Vries, J.B.; Peeters, D.J.; Hamberg, P.; Seynaeve, C.; et al. Gene expression profiles of circulating tumor cells versus primary tumors in metastatic breast cancer. Cancer Lett. 2015, 362, 36–44. [Google Scholar] [CrossRef] [PubMed]
- Pereira-Veiga, T.; Martínez-Fernández, M.; Abuin, C.; Piñeiro, R.; Cebey, V.; Cueva, J.; Palacios, P.; Blanco, C.; Muinelo-Romay, L.; Abalo, A.; et al. CTCs expression profiling for advanced breast cancer monitoring. Cancers 2019, 11, 1941. [Google Scholar] [CrossRef] [PubMed] [Green Version]
- Cierna, Z.; Mego, M.; Janega, P.; Karaba, M.; Minarik, G.; Benca, J.; Sedlácková, T.; Cingelova, S.; Gronesova, P.; Manasova, D.; et al. Matrix metalloproteinase 1 and circulating tumor cells in early breast cancer. BMC Cancer 2014, 14, 472. [Google Scholar] [CrossRef] [PubMed] [Green Version]
- Kalinkova, L.; Zmetakova, I.; Smolkova, B.; Minarik, G.; Sedlackova, T.; Horvathova Kajabova, V.; Cierna, Z.; Mego, M.; Fridrichova, I. Decreased methylation in the SNAI2 and ADAM23 genes associated with de-differentiation and haematogenous dissemination in breast cancers. BMC Cancer 2018, 18, 875. [Google Scholar] [CrossRef] [PubMed]


| miRNAs/Genes | TU-C vs. C-Breast | TU-IF vs. C-Breast | LNM vs. C-Breast | ||||||
|---|---|---|---|---|---|---|---|---|---|
| FC | p-Value | 95% CI | FC | p-Value | 95% CI | FC | p-Value | 95% CI | |
| miR-9-5p | 7.915 | 0.042 | 0.012–41.946 | 0.838 | 0.790 | 0.004–263.197 | 0.551 | 0.422 | 0.004–180.863 |
| miR-124-3p | 1.789 | 0.553 | 0.001–4.238 | 1.632 | 0.557 | 0.002–1.277 | 0.649 | 0.634 | 0.002–624.915 |
| miR-200c-3p | 1.686 | 0.382 | 0.054–45.865 | 2.137 | 0.092 | 0.215–59.281 | 1.821 | 0.271 | 0.156–48.471 |
| miR-203a-3p | 2.356 | 0.042 | 0.077–79.574 | 1.556 | 0.294 | 0.042–38.469 | 1.287 | 0.593 | 0.039–29.094 |
| miR-205-5p | 0.512 | 0.251 | 0.009–36.730 | 0.350 | 0.054 | 0.002–10.925 | 0.210 | 0.012 | 0.002–8.057 |
| miR-221-3p | 1.335 | 0.423 | 0.081–17.503 | 1.365 | 0.290 | 0.168–13.709 | 1.096 | 0.802 | 0.091–19.943 |
| miR-720 | 1.152 | 0.735 | 0.050–33.593 | 1.398 | 0.245 | 0.130–15.221 | 1.033 | 0.939 | 0.042–22.785 |
| CDH1 | 0.123 | 0.002 | 0.004–2.366 | 0.108 | 0.001 | 0.004–2.015 | 0.630 | 0.754 | 0.005–461.981 |
| TWIST1 | 0.449 | 0.765 | 0.000–19.953 | 0.320 | 0.097 | 0.000–29.212 | 2.866 | 0.717 | 0.000–84,067.528 |
| SNAI1 | 0.711 | 0.586 | 0.027–23.260 | 0.706 | 0.658 | 0.020–55.154 | 1.460 | 0.740 | 0.024–246.709 |
| SNAI2 | 0.161 | 0.021 | 0.003–13.083 | 0.102 | 0.002 | 0.001–9.663 | 0.302 | 0.168 | 0.001–140.598 |
| ZEB1 | 0.482 | 0.117 | 0.032–9.616 | 0.474 | 0.052 | 0.064–6.320 | 22.08 | 0.043 | 0.083–522,995.072 |
| ZEB2 | 0.125 | <0.001 | 0.002–3.578 | 0.086 | <0.001 | 0.001–3.209 | 0.122 | 0.003 | 0.001–13.175 |
| CTC- vs. C-Blood | CTC+ vs. C-Blood | CTC+ vs. CTC- | |||||||
| FC | p-Value | 95% CI | FC | p-Value | 95% CI | FC | p-Value | 95% CI | |
| miR-9-5p | 0.428 | 0.366 | 0.001–157.642 | 0.374 | 0.223 | 0.002–39.997 | 0.873 | 0.880 | 0.004–373.287 |
| miR-124-3p | 9.766 | 0.036 | 0.007–15,744.196 | 5.914 | 0.150 | 0.007–12,237.005 | 0.606 | 0.696 | 0.000–6364.879 |
| miR-200c-3p | 0.398 | 0.171 | 0.005–43.795 | 0.299 | 0.052 | 0.008–10.359 | 0.751 | 0.645 | 0.012–25.075 |
| miR-203a-3p | 1.176 | 0.643 | 0.000–745.653 | 0.148 | 0.089 | 0.000–16.253 | 0.125 | 0.064 | 0.000–174.337 |
| miR-205-5p | 10.792 | 0.082 | 0.004–167,893.014 | 0.443 | 0.370 | 0.002–138.141 | 0.041 | 0.010 | 0.000–69.820 |
| miR-221-3p | 0.771 | 0.634 | 0.023–36.002 | 0.289 | 0.017 | 0.016–6.790 | 0.374 | 0.077 | 0.005–14.906 |
| miR-720 | 0.667 | 0.451 | 0.020–37.507 | 0.534 | 0.339 | 0.004–18.729 | 0.801 | 0.712 | 0.006–25.216 |
| CDH1 | 1.031 | 0.918 | 0.071–29.950 | 0.948 | 0.912 | 0.132–17.345 | 0.919 | 0.782 | 0.024–7.315 |
| TWIST1 | 0.518 | 0.362 | 0.006–18.831 | 0.685 | 0.606 | 0.010–25.111 | 1.321 | 0.543 | 0.052–21.295 |
| SNAI1 | 0.456 | 0.136 | 0.016–6.304 | 0.424 | 0.125 | 0.013–7.586 | 0.931 | 0.658 | 0.072–9.000 |
| ZEB1 | 0.683 | 0.206 | 0.032–12.101 | 1.121 | 0.751 | 0.029–23.244 | 1.641 | 0.410 | 0.085–19.595 |
| ZEB2 | 0.451 | 0.066 | 0.022–6.546 | 0.395 | 0.037 | 0.024–2.350 | 0.876 | 0.824 | 0.135–3.364 |
| TU-IF vs. TU C | LNM vs. TU C | LNM vs. TU IF | |||||||
| FC | p-Value | 95% CI | FC | p-Value | 95% CI | FC | p-Value | 95% CI | |
| miR-9-5p | 0.106 | 0.001 | 0.000–48.840 | 0.070 | <0.001 | 0.000–28.042 | 0.658 | 0.437 | 0.005–113.159 |
| miR-124-3p | 0.912 | 0.898 | 0.000–1595.729 | 0.363 | 0.215 | 0.000–775.000 | 0.398 | 0.201 | 0.001–451.409 |
| miR-200c-3p | 1.267 | 0.531 | 0.089–30.484 | 1.080 | 0.892 | 0.069–25.098 | 0.852 | 0.556 | 0.064–9.123 |
| miR-203a-3p | 0.661 | 0.199 | 0.016–16.564 | 0.546 | 0.103 | 0.01 -11.711 | 0.827 | 0.614 | 0.018–32.217 |
| miR-205-5p | 0.684 | 0.612 | 0.003–68.594 | 0.409 | 0.100 | 0.002–48.151 | 0.598 | 0.318 | 0.005–112.073 |
| miR-221-3p | 1.022 | 0.934 | 0.079–19.973 | 0.821 | 0.540 | 0.043–18.746 | 0.803 | 0.452 | 0.054–13.541 |
| miR-720 | 1.213 | 0.481 | 0.040–22.891 | 0.897 | 0.766 | 0.015–29.349 | 0.739 | 0.325 | 0.021–11.792 |
| CDH1 | 0.882 | 0.662 | 0.048–16.349 | 5.135 | 0.048 | 0.081–4310.936 | 5.819 | 0.034 | 0.087–4172.813 |
| TWIST1 | 0.712 | 0.148 | 0.025–31.480 | 6.378 | 0.158 | 0.017–88,008.904 | 8.96 | 0.102 | 0.019–132,814.422 |
| SNAI1 | 0.994 | 0.986 | 0.043–54.895 | 2.055 | 0.208 | 0.052–259.574 | 2.067 | 0.224 | 0.019–316.497 |
| SNAI2 | 0.635 | 0.198 | 0.005–16.977 | 1.875 | 0.258 | 0.022–238.470 | 2.955 | 0.070 | 0.025–644.682 |
| ZEB1 | 0.982 | 0.947 | 0.111–15.056 | 45.794 | 0.015 | 0.139–1,074,172.923 | 46.615 | 0.014 | 0.225–1,274,282.570 |
| ZEB2 | 0.69 | 0.191 | 0.029–8.390 | 0.979 | 0.962 | 0.027–58.004 | 1.419 | 0.415 | 0.034–76.961 |
| Sample | miRNA | Gene | Correlation Coefficient (r) | p-Value |
|---|---|---|---|---|
| C-breast | miR-124-3p | SNAI1 | 0.964 | 0.036 |
| TU-C | miR-203a-3p | CDH1 | 0.409 | 0.031 |
| ZEB1 | 0.479 | 0.018 | ||
| ZEB2 | 0.406 | 0.036 | ||
| miR-205-5p | SNAI1 | 0.383 | 0.048 | |
| miR-221-3p | TWIST1 | −0.470 | 0.015 | |
| TU-IF | miR-200c-3p | SNAI1 | 0.387 | 0.046 |
| miR-720 | TWIST1 | 0.417 | 0.034 | |
| SNAI1 | 0.527 | 0.005 | ||
| SNAI2 | 0.383 | 0.040 | ||
| LNM | miR-9 | SNAI1 | −0.607 | 0.013 |
| miR-221-3p | TWIST1 | 0.726 | 0.011 | |
| ZEB1 | 0.581 | 0.048 | ||
| C-blood | miR-9 | ZEB1 | 0.610 | 0.046 |
| ZEB2 | 0.627 | 0.039 | ||
| miR-200c-3p | ZEB1 | 0.616 | 0.043 | |
| ZEB2 | 0.682 | 0.021 | ||
| miR-203a-3p | TWIST1 | 0.967 | 0.007 | |
| SNAI1 | 0.797 | 0.032 | ||
| ZEB1 | 0.800 | 0.010 | ||
| ZEB2 | 0.900 | 0.001 | ||
| miR-221-3p | TWIST1 | 0.885 | 0.019 | |
| SNAI1 | 0.784 | 0.021 | ||
| ZEB1 | 0.785 | 0.004 | ||
| ZEB2 | 0.936 | <0.000 | ||
| miR-720 | TWIST1 | 0.869 | 0.025 | |
| ZEB1 | 0.743 | 0.009 | ||
| ZEB2 | 0.736 | 0.010 | ||
| CTC- | miR-124-3p | TWIST1 | −0.883 | 0.020 |
| miR-221-3p | ZEB2 | −0.543 | 0.024 | |
| CTC+ | miR-9 | SNAI1 | −0.835 | 0.001 |
| ZEB1 | −0.853 | 0.001 | ||
| miR-205-5p | SNAI1 | −0.653 | 0.021 | |
| ZEB1 | −0.588 | 0.044 | ||
| miR-221-3p | ZEB1 | −0.610 | 0.035 | |
| miR-720 | SNAI1 | −0.616 | 0.033 | |
| ZEB1 | −0.623 | 0.031 |
| Sample | Clinical Characteristics | miRNAs/Genes | FC | p-Value | 95% CI |
|---|---|---|---|---|---|
| TU-C | MTS+ vs. MTS- | miR-124-3p | 0.075 | 0.049 | 0.000–35.995 |
| HER2+ vs. HER2- | miR-200c-3p | 0.440 | 0.018 | 0.030–12.772 | |
| TNM III and IV vs. TNM I and II | miR-203a-3p | 0.316 | 0.008 | 0.009–4.922 | |
| ER+ vs. ER- | SNAI1 | 0.465 | 0.007 | 0.049–7.093 | |
| ZEB2 | 0.486 | 0.017 | 0.113–5.252 | ||
| PR+ vs. PR- | CDH1 | 0.366 | 0.025 | 0.028–3.448 | |
| SNAI1 | 0.336 | 0.008 | 0.049–6.071 | ||
| TU-IF | ≤20 mm vs. >20 mm | ZEB2 | 0.343 | 0.011 | 0.024–4.821 |
| LNM+ vs. LNM- | SNAI2 | 0.326 | 0.023 | 0.002–9.962 | |
| ZEB1 | 0.497 | 0.035 | 0.079–4.408 | ||
| MTS+ vs. MTS- | SNAI2 | 0.432 | 0.041 | 0.034–94.834 | |
| ZEB2 | 0.344 | 0.030 | 0.006–7.949 | ||
| TNM III and IV vs. TNM I and II | SNAI2 | 0.246 | 0.007 | 0.002–4.248 | |
| ZEB1 | 0.438 | 0.007 | 0.059–2.126 | ||
| LVI+ vs. LVI- | SNAI2 | 0.294 | 0.015 | 0.002–6.602 | |
| ZEB1 | 0.482 | 0.034 | 0.079–3.844 | ||
| ZEB2 | 0.350 | 0.026 | 0.024–3.722 | ||
| ER+ vs. ER- | miR-200c-3p | 3.795 | 0.048 | 0.684–24.343 | |
| TWIST1 | 0.420 | 0.049 | 0.011–15.353 | ||
| LNM | MTS + vs. MTS- | ZEB1 | 824.73 | 0.018 | 0.283–1,584,361.881 |
| TNM III and IV vs. TNM I and II | SNAI1 | 5.959 | 0.025 | 0.227–432.565 | |
| ER+ vs. ER- | miR-124-3p | 6.819 | 0.018 | 0.091–887.828 | |
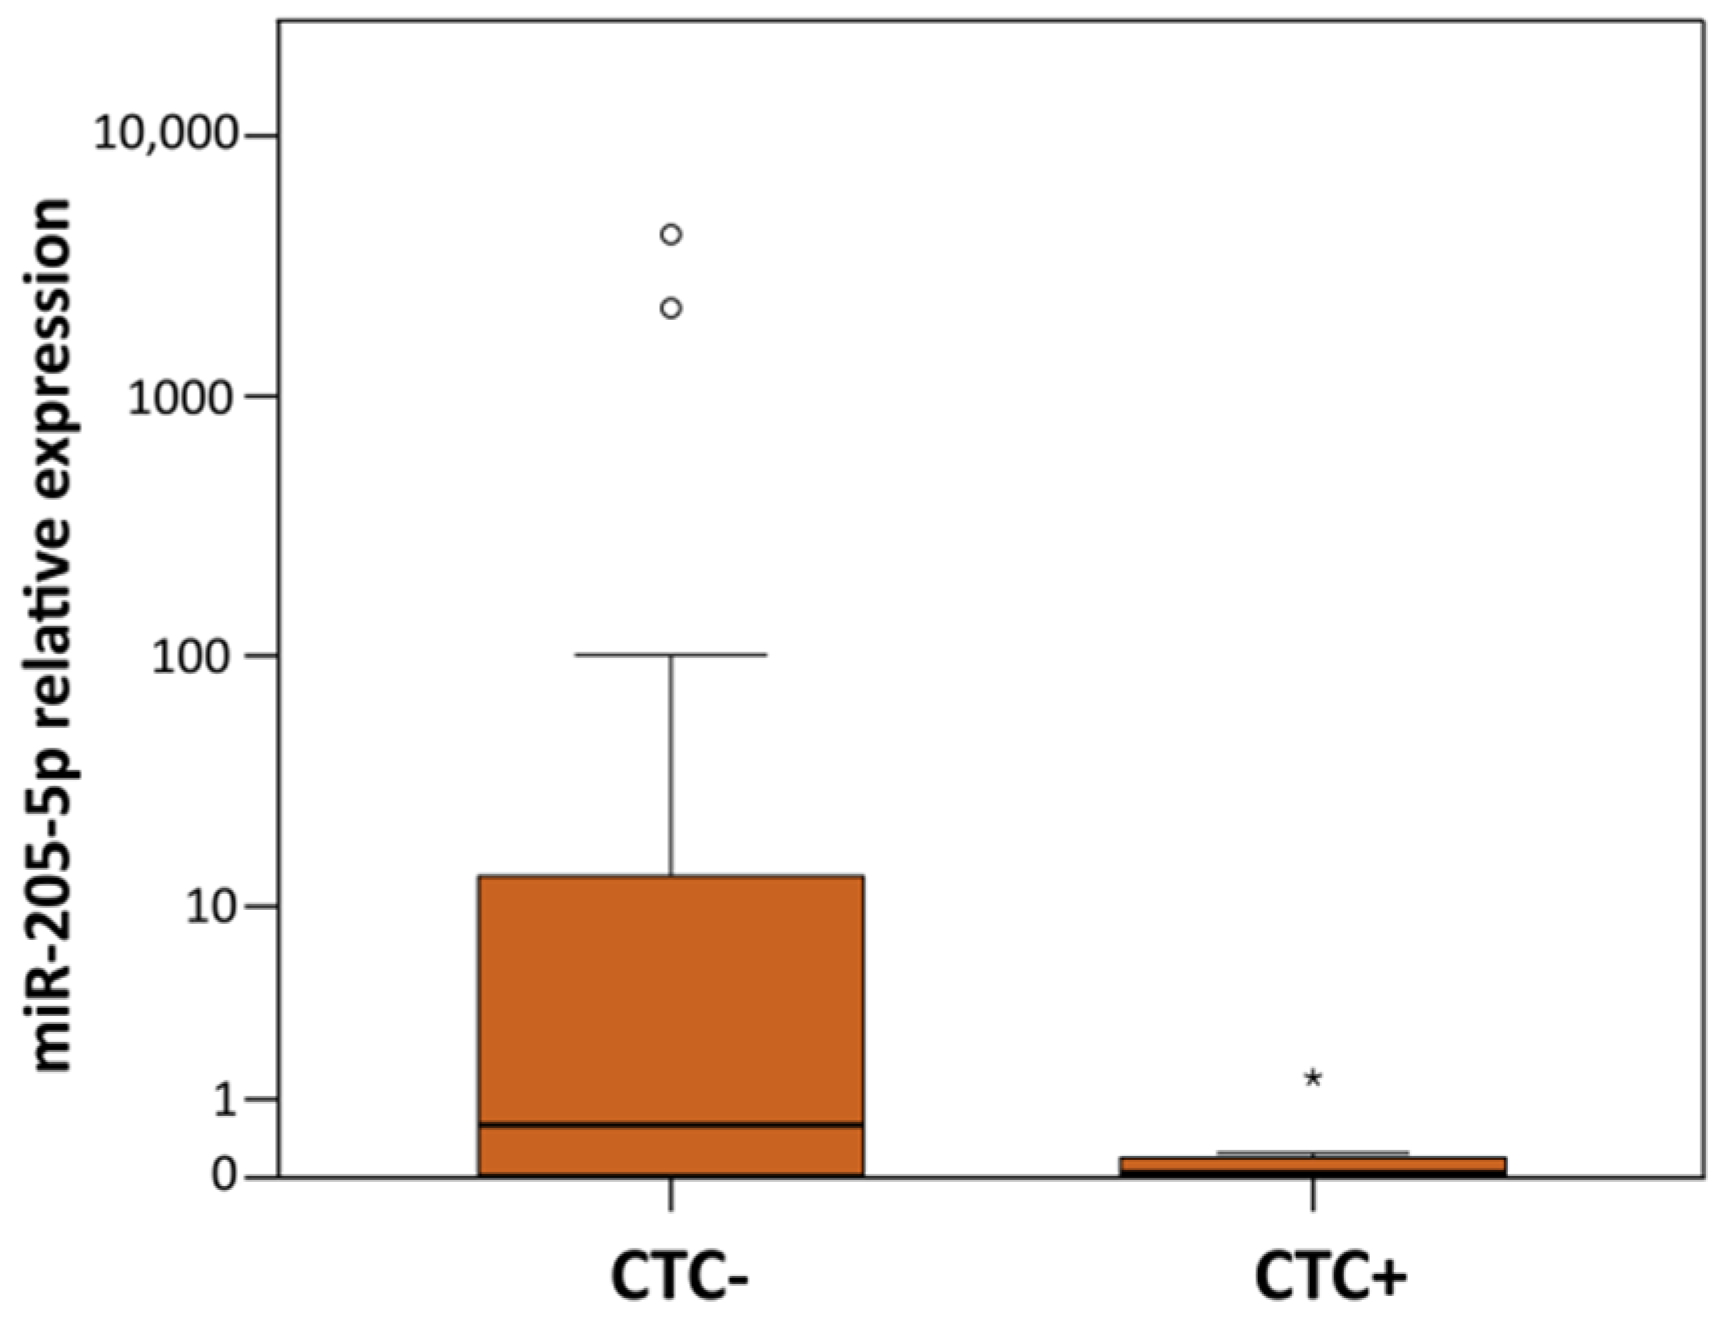
| CD45-DB | CTC+ vs. CTC- | miR-205-5p | 0.041 | 0.010 | 0.000–69.820 |
| LNM+ vs. LNM- | miR-205-5p | 22.961 | 0.035 | 0.012–400,412.929 | |
| TNM III and IV vs. TNM I and II | miR-205-5p | 39.056 | 0.006 | 0.039–692,990.143 | |
| HER2+ vs. HER2- | miR-9 | 10.321 | 0.027 | 0.088–1098.021 | |
| SNAI1 | 0.439 | 0.041 | 0.061–9.288 | ||
| Grade 3 vs. Grade 1 and 2 | CDH1 | 1.468 | 0.033 | 0.151–11.647 |
| Risk Factor | Variables | p-Value | OR | 95% CI |
|---|---|---|---|---|
| CTCs presence | Age High grade (G3) miR-205-5p * | 0.061 0.075 0.028 | 0.893 46.197 4.326 | 0.792–1.005 0.683–3124.868 1.170–15.995 |
| Tumor size > 20 mm | 0.047 | 96.081 | 1.066–8661.849 | |
| HER2 positivity § Constant | 0.036 0.126 | 2153.786 0.000 | 1.628–2,849,343.631 |
| Variables | n | % | |
|---|---|---|---|
| All | 31 | 100.0 | |
| Age | ≤50 | 3 | 9.68 |
| >50 | 28 | 90.32 | |
| Histological grade | 1 and 2 | 14 | 45.16 |
| 3 | 17 | 54.84 | |
| Tumor size (mm) | ≤20 | 12 | 38.71 |
| >20 | 19 | 61.29 | |
| LNM status a | 0 | 9 | 29.03 |
| ≥1 | 22 | 70.97 | |
| MTS status | Negative | 24 | 77.42 |
| Positive | 7 | 22.58 | |
| TNM stage | I. and II. | 13 | 41.94 |
| III. and IV. | 18 | 58.06 | |
| CTC occurrence b | Negative | 18 | 58.06 |
| Positive | 13 | 41.94 | |
| LVI | Negative | 7 | 22.58 |
| Positive | 24 | 77.42 | |
| ER status c | Negative | 5 | 16.13 |
| Positive | 26 | 83.87 | |
| PR status c | Negative | 11 | 35.48 |
| Positive | 20 | 64.52 | |
| HER2 status d | Negative | 23 | 74.19 |
| Positive | 8 | 25.81 | |
| Ki-67 proliferative index e | Low | 4 | 12.90 |
| High | 27 | 87.10 | |
| E-cadherin expression f | High | 22 | 70.97 |
| Low | 9 | 29.03 | |
Publisher’s Note: MDPI stays neutral with regard to jurisdictional claims in published maps and institutional affiliations. |
© 2021 by the authors. Licensee MDPI, Basel, Switzerland. This article is an open access article distributed under the terms and conditions of the Creative Commons Attribution (CC BY) license (https://creativecommons.org/licenses/by/4.0/).
Share and Cite
Kalinkova, L.; Nikolaieva, N.; Smolkova, B.; Ciernikova, S.; Kajo, K.; Bella, V.; Kajabova, V.H.; Kosnacova, H.; Minarik, G.; Fridrichova, I. miR-205-5p Downregulation and ZEB1 Upregulation Characterize the Disseminated Tumor Cells in Patients with Invasive Ductal Breast Cancer. Int. J. Mol. Sci. 2022, 23, 103. https://doi.org/10.3390/ijms23010103
Kalinkova L, Nikolaieva N, Smolkova B, Ciernikova S, Kajo K, Bella V, Kajabova VH, Kosnacova H, Minarik G, Fridrichova I. miR-205-5p Downregulation and ZEB1 Upregulation Characterize the Disseminated Tumor Cells in Patients with Invasive Ductal Breast Cancer. International Journal of Molecular Sciences. 2022; 23(1):103. https://doi.org/10.3390/ijms23010103
Chicago/Turabian StyleKalinkova, Lenka, Nataliia Nikolaieva, Bozena Smolkova, Sona Ciernikova, Karol Kajo, Vladimir Bella, Viera Horvathova Kajabova, Helena Kosnacova, Gabriel Minarik, and Ivana Fridrichova. 2022. "miR-205-5p Downregulation and ZEB1 Upregulation Characterize the Disseminated Tumor Cells in Patients with Invasive Ductal Breast Cancer" International Journal of Molecular Sciences 23, no. 1: 103. https://doi.org/10.3390/ijms23010103
APA StyleKalinkova, L., Nikolaieva, N., Smolkova, B., Ciernikova, S., Kajo, K., Bella, V., Kajabova, V. H., Kosnacova, H., Minarik, G., & Fridrichova, I. (2022). miR-205-5p Downregulation and ZEB1 Upregulation Characterize the Disseminated Tumor Cells in Patients with Invasive Ductal Breast Cancer. International Journal of Molecular Sciences, 23(1), 103. https://doi.org/10.3390/ijms23010103