
Hemistepsin a Induces Apoptosis of Hepatocellular Carcinoma Cells by Downregulating STAT3

 , ,
, ,  and
and 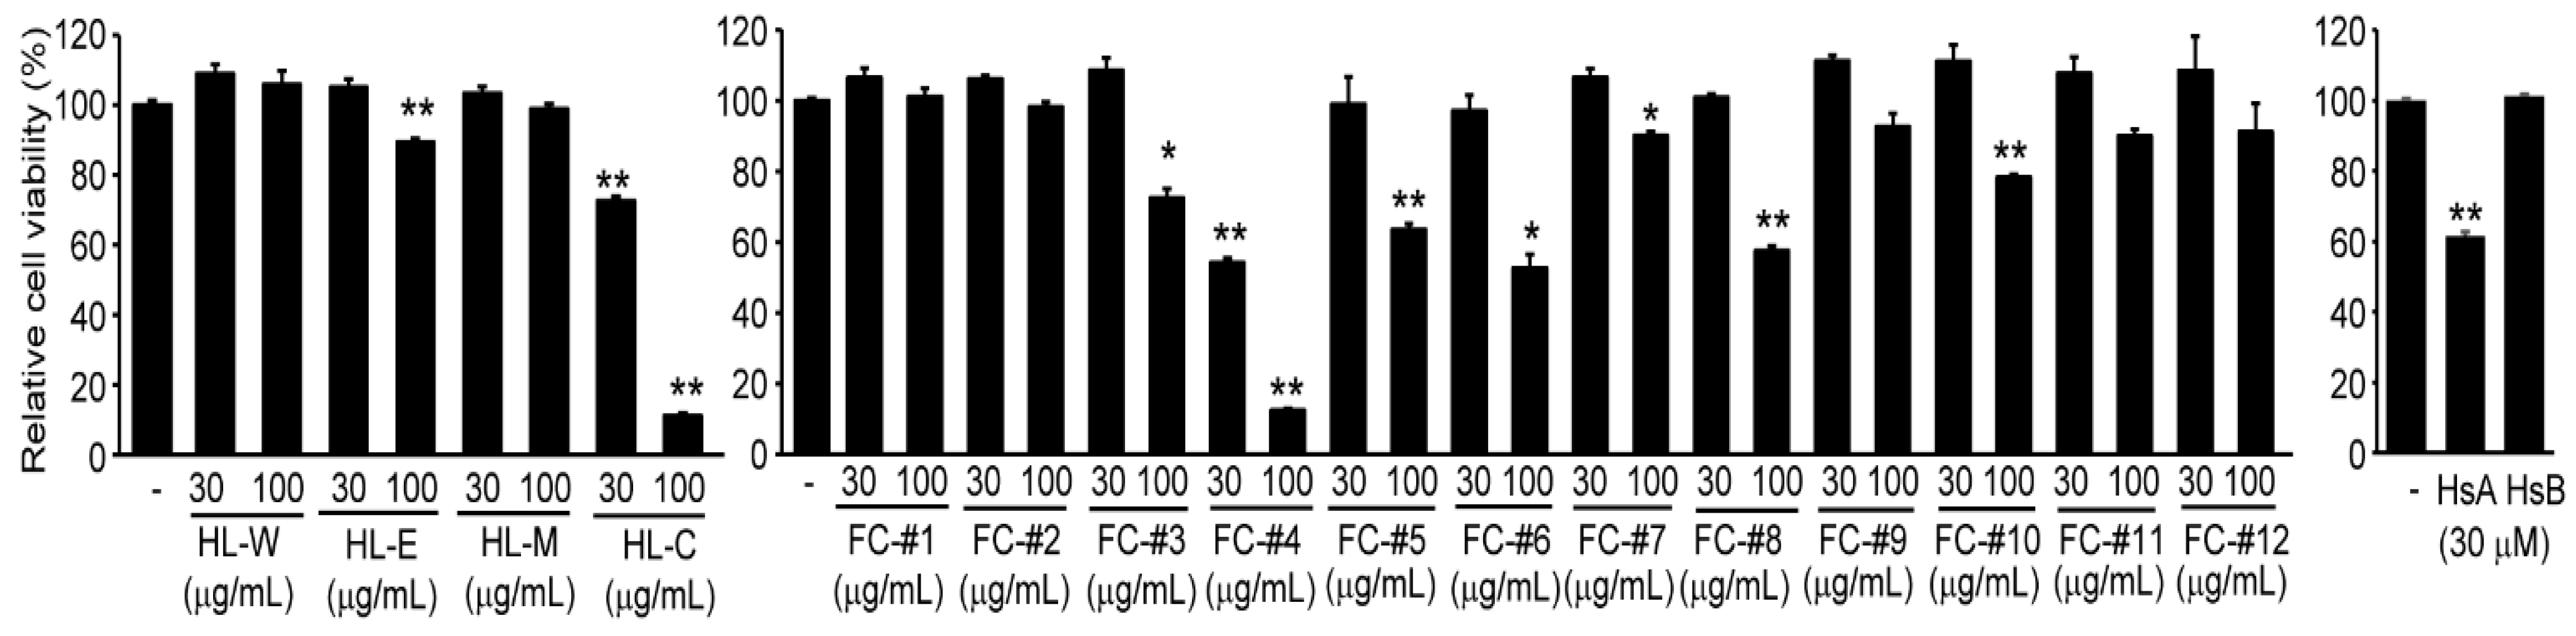
Abstract
1. Introduction
2. Results
2.1. HsA in H. lyrata Is a Representative Cytotoxic Compound against HCC Cells
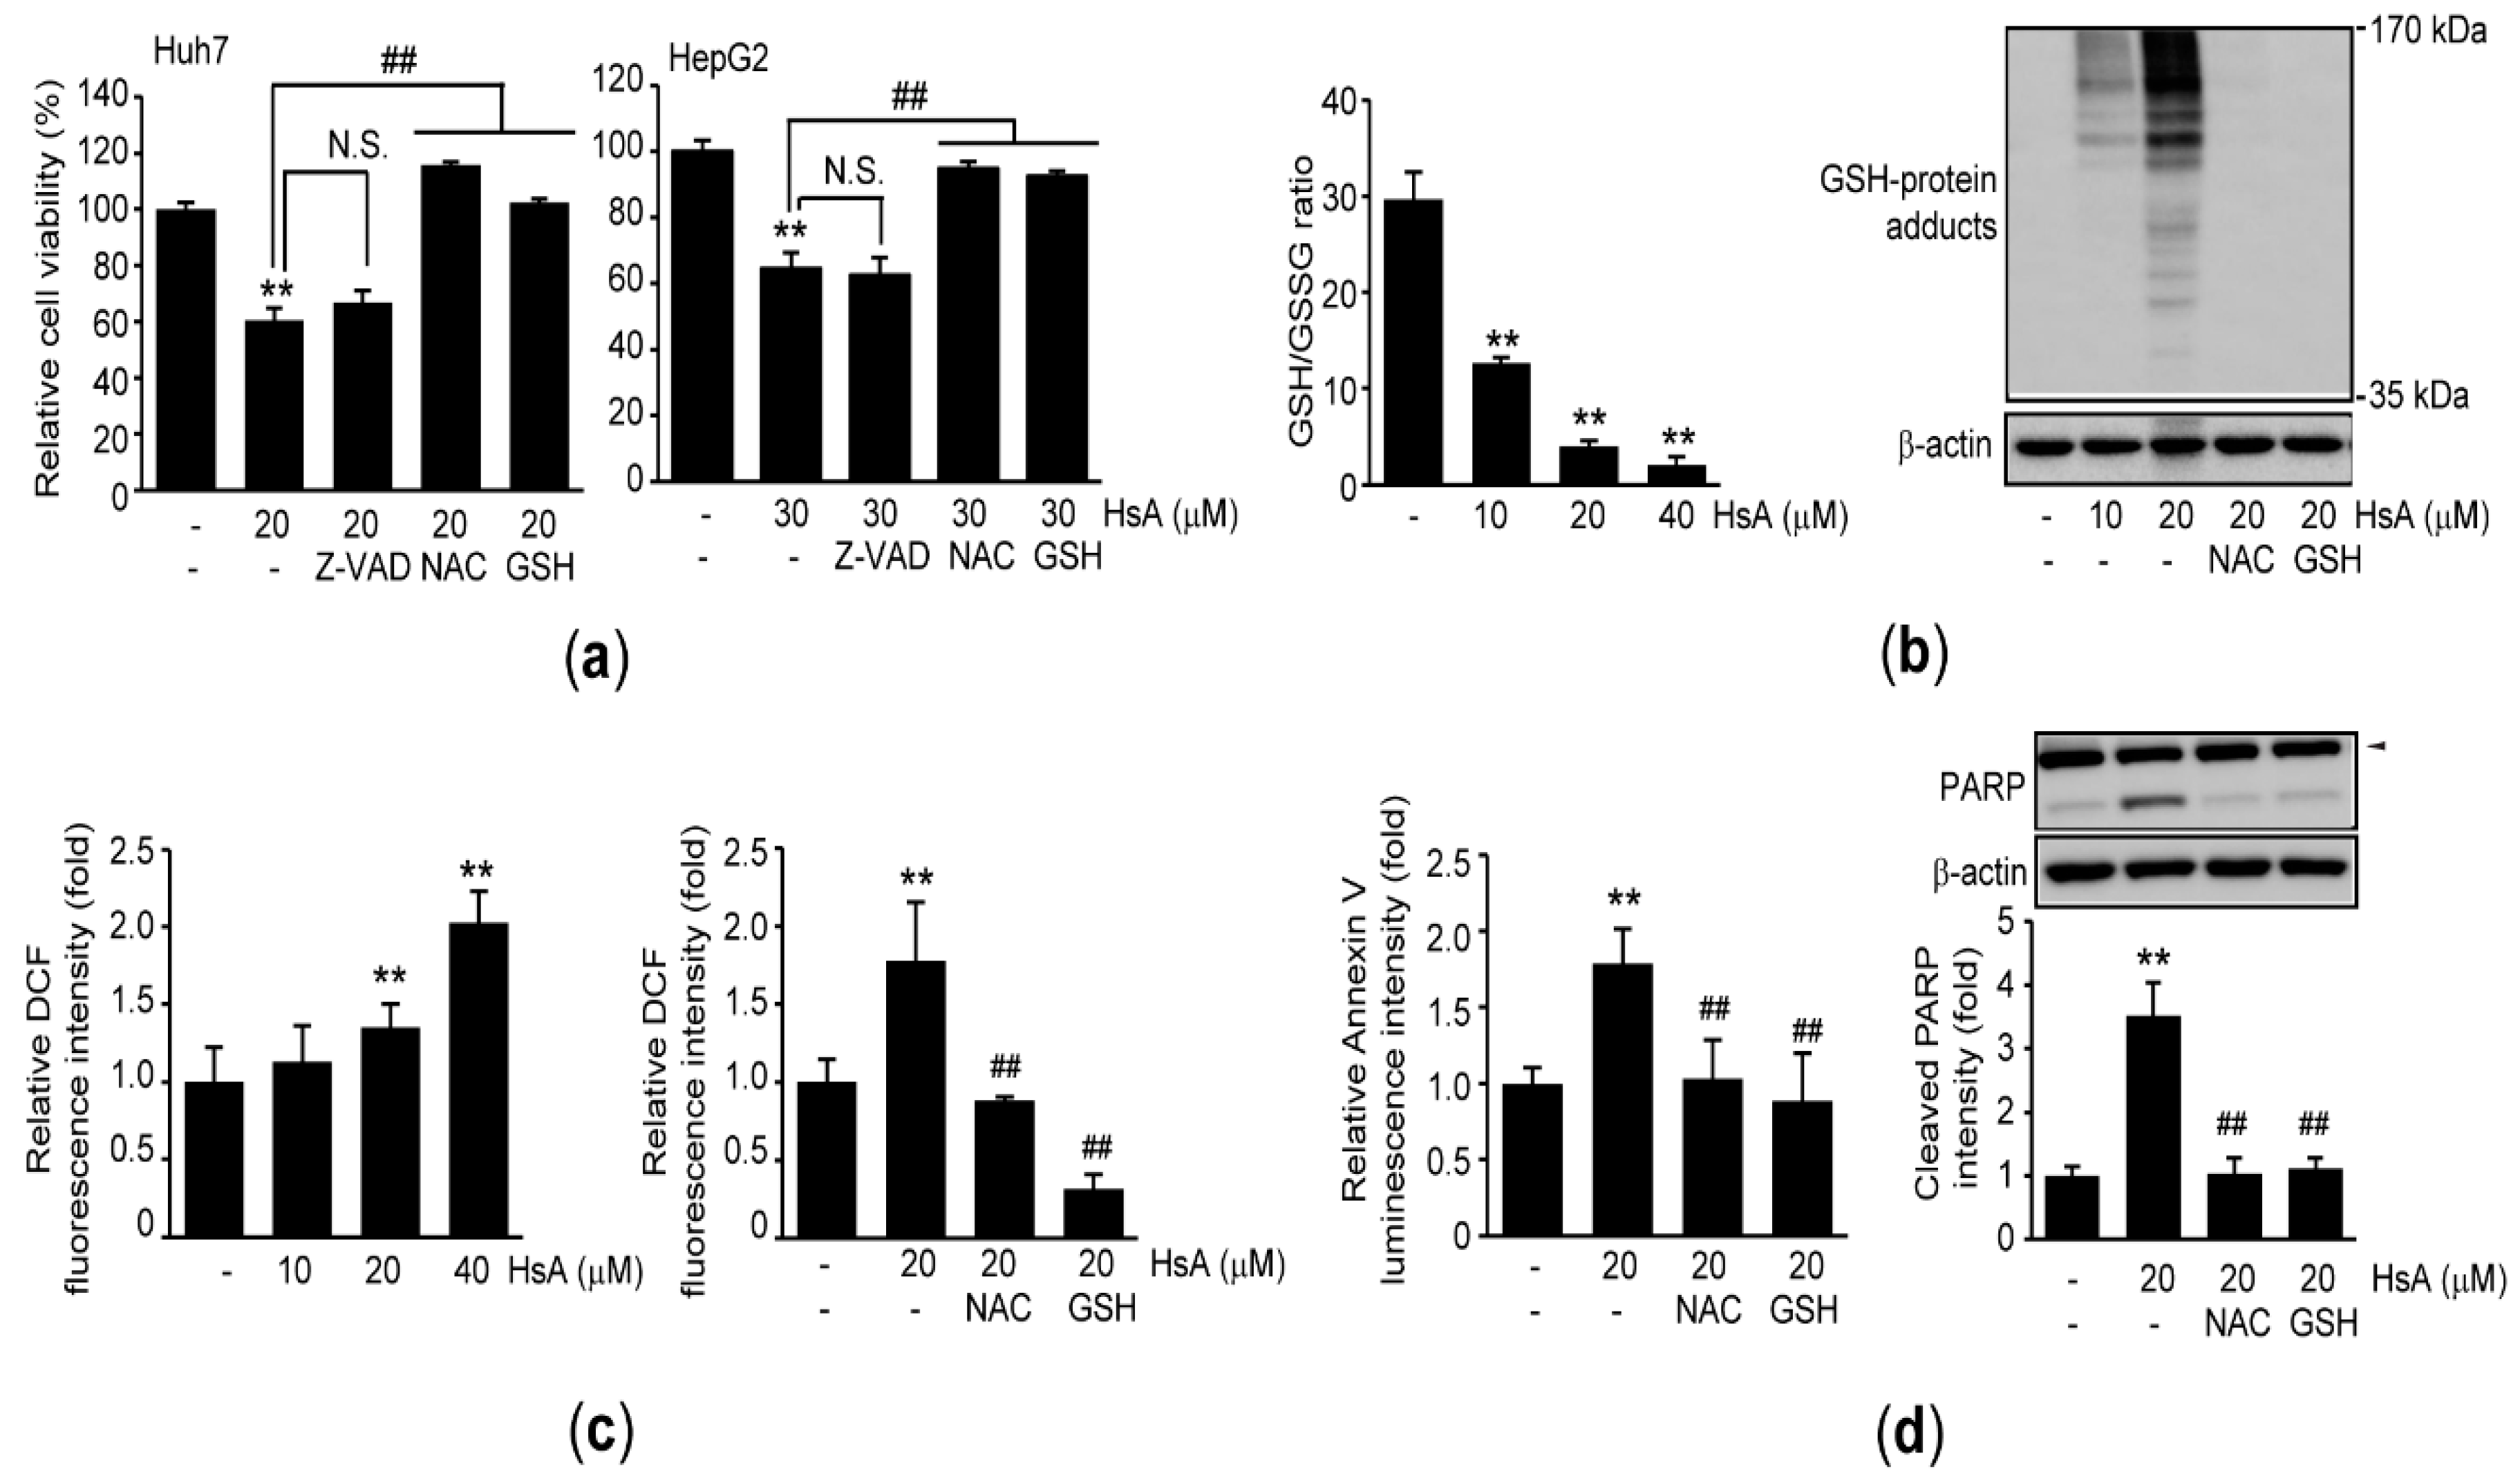
2.2. HsA Activates Apoptosis of HCC Cells
2.3. Oxidative Stress Triggers HsA-Induced Apoptosis in HCC Cells
2.4. HsA Inhibits STAT3 in HCC Cells
2.5. HsA Sensitizes Sorafenib-Mediated Cytotoxicity in HCC Cells
3. Discussion
4. Materials and Methods
4.1. Reagents
4.2. Cell Culture and Drug Treatment
4.3. MTT Assay
4.4. Measurement of Cell Population in Sub-G1 Phase
4.5. Apoptosis Assay
4.6. Protein Extraction, Immunoprecipitation, and Immunoblot Analysis
4.7. Measurement of Glutathione
4.8. Measurement of Cellular ROS
4.9. Plasmids and Reporter Gene Assay
4.10. Generation of Recombinant Cells Expressing CA-STAT3
4.11. Statistical Analysis
5. Conclusions
Supplementary Materials
Author Contributions
Funding
Data Availability Statement
Acknowledgments
Conflicts of Interest
References
- Torre, L.A.; Bray, F.; Siegel, R.L.; Ferlay, J.; Lortet-Tieulent, J.; Jemal, A. Global cancer statistics, 2012. CA Cancer J. Clin. 2015, 65, 87–108. [Google Scholar] [CrossRef] [PubMed]
- National Cancer Information Center. Available online: https://www.cancer.go.kr (accessed on 30 March 2021).
- Villanueva, A.; Hernandez-Gea, V.; Llovet, J.M. Medical therapies for hepatocellular carcinoma: A critical view of the evidence. Nat. Rev. Gastroenterol. Hepatol. 2013, 10, 34–42. [Google Scholar] [CrossRef]
- Llovet, J.M.; Ricci, S.; Mazzaferro, V.; Hilgard, P.; Gane, E.; Blanc, J.F.; de Oliveira, A.C.; Santoro, A.; Raoul, J.L.; Forner, A.; et al. Sorafenib in advanced hepatocellular carcinoma. N. Engl. J. Med. 2008, 359, 378–390. [Google Scholar] [CrossRef]
- Zhu, Y.J.; Zheng, B.; Wang, H.Y.; Chen, L. New knowledge of the mechanisms of sorafenib resistance in liver cancer. Acta Pharmacol. Sin. 2017, 38, 614–622. [Google Scholar] [CrossRef]
- Lee, C.; Cheung, S.T. STAT3: An Emerging Therapeutic Target for Hepatocellular Carcinoma. Cancers 2019, 11, 1646. [Google Scholar] [CrossRef]
- He, G.; Yu, G.Y.; Temkin, V.; Ogata, H.; Kuntzen, C.; Sakurai, T.; Sieghart, W.; Peck-Radosavljevic, M.; Leffert, H.L.; Karin, M. Hepatocyte IKKbeta/NF-kappaB inhibits tumor promotion and progression by preventing oxidative stress-driven STAT3 activation. Cancer Cell 2010, 17, 286–297. [Google Scholar] [CrossRef]
- Bharadwaj, U.; Kasembeli, M.M.; Robinson, P.; Tweardy, D.J. Targeting Janus kinases and signal transducer and activator of transcription 3 to treat inflammation, fibrosis, and cancer: Rationale, progress, and caution. Pharmacol. Rev. 2020, 72, 486–526. [Google Scholar] [CrossRef]
- Ki, S.H.; Park, O.; Zheng, M.; Morales-Ibanez, O.; Kolls, J.K.; Bataller, R.; Gao, B. Interleukin-22 treatment ameliorates alcoholic liver injury in a murine model of chronic-binge ethanol feeding: Role of signal transducer and activator of transcription 3. Hepatology 2010, 52, 1291–1300. [Google Scholar] [CrossRef] [PubMed]
- Kroy, D.C.; Beraza, N.; Tschaharganeh, D.F.; Sander, L.E.; Erschfeld, S.; Giebeler, A.; Liedtke, C.; Wasmuth, H.E.; Trautwein, C.; Streetz, K.L. Lack of interleukin-6/glycoprotein 130/signal transducers and activators of transcription-3 signaling in hepatocytes predisposes to liver steatosis and injury in mice. Hepatology 2010, 51, 463–473. [Google Scholar] [CrossRef]
- Cheng, J.T.; Deng, Y.N.; Yi, H.M.; Wang, G.Y.; Fu, B.S.; Chen, W.J.; Liu, W.; Tai, Y.; Peng, Y.W.; Zhang, Q. Hepatic carcinoma-associated fibroblasts induce IDO-producing regulatory dendritic cells through IL-6-mediated STAT3 activation. Oncogenesis 2016, 5, e198. [Google Scholar] [CrossRef] [PubMed]
- Sun, X.; Sui, Q.; Zhang, C.; Tian, Z.; Zhang, J. Targeting blockage of STAT3 in hepatocellular carcinoma cells augments NK cell functions via reverse hepatocellular carcinoma-induced immune suppression. Mol. Cancer Ther. 2013, 12, 2885–2896. [Google Scholar] [CrossRef] [PubMed]
- Saraswati, S.; Alhaider, A.; Abdelgadir, A.M.; Tanwer, P.; Korashy, H.M. Phloretin attenuates STAT-3 activity and overcomes sorafenib resistance targeting SHP-1-mediated inhibition of STAT3 and Akt/VEGFR2 pathway in hepatocellular carcinoma. Cell Commun. Signal. 2019, 17, 127. [Google Scholar] [CrossRef] [PubMed]
- Zulkifli, A.A.; Tan, F.H.; Putoczki, T.L.; Stylli, S.S.; Luwor, R.B. STAT3 signaling mediates tumour resistance to EGFR targeted therapeutics. Mol. Cell. Endocrinol. 2017, 451, 15–23. [Google Scholar] [CrossRef]
- Liang, C.; Xu, Y.; Ge, H.; Li, G.; Wu, J. Clinicopathological significance and prognostic role of p-STAT3 in patients with hepatocellular carcinoma. OncoTargets Ther. 2018, 11, 1203–1214. [Google Scholar] [CrossRef]
- Calvisi, D.F.; Ladu, S.; Gorden, A.; Farina, M.; Conner, E.A.; Lee, J.S.; Factor, V.M.; Thorgeirsson, S.S. Ubiquitous activation of Ras and Jak/Stat pathways in human HCC. Gastroenterology 2006, 130, 1117–1128. [Google Scholar] [CrossRef] [PubMed]
- Butturini, E.; Carcereri de Prati, A.; Boriero, D.; Mariotto, S. Natural sesquiterpene lactones enhance chemosensitivity of tumor cells through redox regulation of STAT3 signaling. Oxid. Med. Cell. Longev. 2019, 2019, 4568964. [Google Scholar] [CrossRef] [PubMed]
- Babaei, G.; Aliarab, A.; Abroon, S.; Rasmi, Y.; Aziz, S.G. Application of sesquiterpene lactone: A new promising way for cancer therapy based on anticancer activity. Biomed. Pharmacother. 2018, 106, 239–246. [Google Scholar] [CrossRef]
- Jung, B.S.; Shin, M.K. Encyclopedia of Illustrated Korean Natural Drugs, 1st ed.; Yeong Lim Sa: Seoul, Korea, 1990; pp. 1053–1054. [Google Scholar]
- Kim, J.K.; Cho, I.J.; Kim, E.O.; Lee, D.G.; Jung, D.H.; Ki, S.H.; Ku, S.K.; Kim, S.C. Hemistepsin A inhibits T0901317-induced lipogenesis in the liver. BMB Rep. 2021, 54, 106–111. [Google Scholar] [CrossRef]
- Kim, J.K.; Han, N.R.; Park, S.M.; Jegal, K.H.; Jung, J.Y.; Jung, E.H.; Kim, E.O.; Kim, D.; Jung, D.H.; Lee, J.R.; et al. Hemistepsin A alleviates liver fibrosis by inducing apoptosis of activated hepatic stellate cells via inhibition of nuclear factor-κB and Akt. Food Chem. Toxicol. 2020, 135, 111044. [Google Scholar] [CrossRef] [PubMed]
- Kim, J.K.; Cho, I.J.; Kim, E.O.; Jung, D.H.; Ku, S.K.; Kim, S.C. The effects of Hemistepta lyrata Bunge (Bunge) fractionated extract on liver X receptor α-dependent lipogenic genes in hepatocyte-derived cells. Herb. Formula Sci. 2020, 28, 255–269. [Google Scholar] [CrossRef]
- Kim, J.K.; Lee, J.E.; Jung, E.H.; Jung, J.Y.; Jung, D.H.; Ku, S.K.; Cho, I.J.; Kim, S.C. Hemistepsin A ameliorates acute inflammation in macrophages via inhibition of nuclear factor-κB and activation of nuclear factor erythroid 2-related factor 2. Food Chem. Toxicol. 2018, 111, 176–188. [Google Scholar] [CrossRef] [PubMed]
- Baek, S.Y.; Hwang, U.W.; Suk, H.Y.; Kim, Y.W. Hemistepsin A inhibits cell proliferation and induces G0/G1-phase arrest, cellular senescence and apoptosis via the AMPK and p53/p21 signals in human hepatocellular carcinoma. Biomolecules 2020, 10, 713. [Google Scholar] [CrossRef] [PubMed]
- Jin, L.; Kim, E.Y.; Chung, T.W.; Han, C.W.; Park, S.Y.; Han, J.H.; Bae, S.J.; Lee, J.R.; Kim, Y.W.; Jang, S.B.; et al. Hemistepsin A suppresses colorectal cancer growth through inhibiting pyruvate dehydrogenase kinase activity. Sci. Rep. 2020, 10, 21940. [Google Scholar] [CrossRef] [PubMed]
- Jang, D.S.; Yang, M.S.; Ha, T.J.; Park, K.H. Hemistepsins with cytotoxic activity from Hemisteptia lyrata. Planta Med. 1999, 65, 765–766. [Google Scholar] [CrossRef] [PubMed]
- Park, C.; Lee, H.; Noh, J.S.; Jin, C.Y.; Kim, G.Y.; Hyun, J.W.; Leem, S.H.; Choi, Y.H. Hemistepsin A protects human keratinocytes against hydrogen peroxide-induced oxidative stress through activation of the Nrf2/HO-1 signaling pathway. Arch. Biochem. Biophys. 2020, 691, 108512. [Google Scholar] [CrossRef] [PubMed]
- Redza-Dutordoir, M.; Averill-Bates, D.A. Activation of apoptosis signalling pathways by reactive oxygen species. Biochim. Biophys. Acta 2016, 1863, 2977–2992. [Google Scholar] [CrossRef]
- Sun, S.L.; Li, X.; Su, N.; Chen, S.; Gao, X.; Zhang, G.; Piao, H. Vacquinol-1 induces apoptosis in hepatocellular carcinoma cell. Mol. Med. Rep. 2018, 18, 557–563. [Google Scholar] [CrossRef] [PubMed]
- Ma, L.; Peng, L.; Fang, S.; He, B.; Liu, Z. Celastrol downregulates E2F1 to induce growth inhibitory effects in hepatocellular carcinoma HepG2 cells. Oncol. Rep. 2017, 38, 2951–2958. [Google Scholar] [CrossRef] [PubMed]
- Tait, S.W.; Green, D.R. Caspase-independent cell death: Leaving the set without the final cut. Oncogene 2008, 27, 6452–6461. [Google Scholar] [CrossRef]
- Chaitanya, G.V.; Steven, A.J.; Babu, P.P. PARP-1 cleavage fragments: Signatures of cell-death proteases in neurodegeneration. Cell Commun. Signal. 2010, 8, 31. [Google Scholar] [CrossRef]
- Traverso, N.; Ricciarelli, R.; Nitti, M.; Marengo, B.; Furfaro, A.L.; Pronzato, M.A.; Marinari, U.M.; Domenicotti, C. Role of glutathione in cancer progression and chemoresistance. Oxid. Med. Cell. Longev. 2013, 2013, 972913. [Google Scholar] [CrossRef]
- Chadwick, M.; Trewin, H.; Gawthrop, F.; Wagstaff, C. Sesquiterpenoids lactones: Benefits to plants and people. Int. J. Mol. Sci. 2013, 14, 12780–12805. [Google Scholar] [CrossRef] [PubMed]
- Becker, S.; Groner, B.; Müller, C.W. Three-dimensional structure of the Stat3beta homodimer bound to DNA. Nature 1998, 394, 145–151. [Google Scholar] [CrossRef] [PubMed]
- Kamizono, S.; Hanada, T.; Yasukawa, H.; Minoguchi, S.; Kato, R.; Minoguchi, M.; Hattori, K.; Hatakeyama, S.; Yada, M.; Morita, S.; et al. The SOCS box of SOCS-1 accelerates ubiquitin-dependent proteolysis of TEL-JAK2. J. Biol. Chem. 2001, 276, 12530–12538. [Google Scholar] [CrossRef]
- Yamamoto, T.; Sekine, Y.; Kashima, K.; Kubota, A.; Sato, N.; Aoki, N.; Matsuda, T. The nuclear isoform of protein-tyrosine phosphatase TC-PTP regulates interleukin-6-mediated signaling pathway through STAT3 dephosphorylation. Biochem. Biophys. Res. Commun. 2002, 297, 811–817. [Google Scholar] [CrossRef]
- David, M.; Chen, H.E.; Goelz, S.; Larner, A.C.; Neel, B.G. Differential regulation of the alpha/beta interferon-stimulated Jak/Stat pathway by the SH2 domain-containing tyrosine phosphatase SHPTP1. Mol. Cell. Biol. 1995, 15, 7050–7058. [Google Scholar] [CrossRef] [PubMed]
- Maryam, A.; Mehmood, T.; Zhang, H.; Li, Y.; Khan, M.; Ma, T. Alantolactone induces apoptosis, promotes STAT3 glutathionylation and enhances chemosensitivity of A549 lung adenocarcinoma cells to doxorubicin via oxidative stress. Sci. Rep. 2017, 7, 6242. [Google Scholar] [CrossRef] [PubMed]
- Butturini, E.; Carcereri de Prati, A.; Chiavegato, G.; Rigo, A.; Cavalieri, E.; Darra, E.; Mariotto, S. Mild oxidative stress induces S-glutathionylation of STAT3 and enhances chemosensitivity of tumoural cells to chemotherapeutic drugs. Free Radic. Biol. Med. 2013, 65, 1322–1330. [Google Scholar] [CrossRef] [PubMed]
- Butturini, E.; Cavalieri, E.; de Prati, A.C.; Darra, E.; Rigo, A.; Shoji, K.; Murayama, N.; Yamazaki, H.; Watanabe, Y.; Suzuki, H.; et al. Two naturally occurring terpenes, dehydrocostuslactone and costunolide, decrease intracellular GSH content and inhibit STAT3 activation. PLoS ONE 2011, 6, e20174. [Google Scholar] [CrossRef] [PubMed]
- Xie, Y.; Kole, S.; Precht, P.; Pazin, M.J.; Bernier, M. S-glutathionylation impairs signal transducer and activator of transcription 3 activation and signaling. Endocrinology 2009, 150, 1122–1131. [Google Scholar] [CrossRef] [PubMed]
- Butturini, E.; Darra, E.; Chiavegato, G.; Cellini, B.; Cozzolino, F.; Monti, M.; Pucci, P.; Dell’Orco, D.; Mariotto, S. S-Glutathionylation at Cys328 and Cys542 impairs STAT3 phosphorylation. ACS Chem. Biol. 2014, 9, 1885–1893. [Google Scholar] [CrossRef]
- Horie, Y.; Suzuki, A.; Kataoka, E.; Sasaki, T.; Hamada, K.; Sasaki, J.; Mizuno, K.; Hasegawa, G.; Kishimoto, H.; Iizuka, M.; et al. Hepatocyte-specific Pten deficiency results in steatohepatitis and hepatocellular carcinomas. J. Clin. Invest. 2004, 113, 1774–1783. [Google Scholar] [CrossRef] [PubMed]
- Luedde, T.; Schwabe, R.F. NF-κB in the liver–linking injury, fibrosis and hepatocellular carcinoma. Nat. Rev. Gastroenterol. Hepatol. 2011, 8, 108–118. [Google Scholar] [CrossRef] [PubMed]
- Ye, L.; Mayerle, J.; Ziesch, A.; Reiter, F.P.; Gerbes, A.L.; De Toni, E.N. The PI3K inhibitor copanlisib synergizes with sorafenib to induce cell death in hepatocellular carcinoma. Cell Death Discov. 2019, 5, 86. [Google Scholar] [CrossRef]
- Lo, J.; Lau, E.Y.; Ching, R.H.; Cheng, B.Y.; Ma, M.K.; Ng, I.O.; Lee, T.K. Nuclear factor kappa B-mediated CD47 up-regulation promotes sorafenib resistance and its blockade synergizes the effect of sorafenib in hepatocellular carcinoma in mice. Hepatology 2015, 62, 534–545. [Google Scholar] [CrossRef] [PubMed]
- Bromberg, J.F.; Wrzeszczynska, M.H.; Devgan, G.; Zhao, Y.; Pestell, R.G.; Albanese, C.; Darnell, J.E., Jr. Stat3 as an oncogene. Cell 1999, 98, 295–303. [Google Scholar] [CrossRef]


Publisher’s Note: MDPI stays neutral with regard to jurisdictional claims in published maps and institutional affiliations. |
© 2021 by the authors. Licensee MDPI, Basel, Switzerland. This article is an open access article distributed under the terms and conditions of the Creative Commons Attribution (CC BY) license (https://creativecommons.org/licenses/by/4.0/).
Share and Cite
Cho, I.J.; Kim, J.K.; Kim, E.O.; Park, S.M.; Kim, S.C.; Ki, S.H.; Ku, S.K. Hemistepsin a Induces Apoptosis of Hepatocellular Carcinoma Cells by Downregulating STAT3. Int. J. Mol. Sci. 2021, 22, 4743. https://doi.org/10.3390/ijms22094743
Cho IJ, Kim JK, Kim EO, Park SM, Kim SC, Ki SH, Ku SK. Hemistepsin a Induces Apoptosis of Hepatocellular Carcinoma Cells by Downregulating STAT3. International Journal of Molecular Sciences. 2021; 22(9):4743. https://doi.org/10.3390/ijms22094743
Chicago/Turabian StyleCho, Il Je, Jae Kwang Kim, Eun Ok Kim, Sang Mi Park, Sang Chan Kim, Sung Hwan Ki, and Sae Kwang Ku. 2021. "Hemistepsin a Induces Apoptosis of Hepatocellular Carcinoma Cells by Downregulating STAT3" International Journal of Molecular Sciences 22, no. 9: 4743. https://doi.org/10.3390/ijms22094743
APA StyleCho, I. J., Kim, J. K., Kim, E. O., Park, S. M., Kim, S. C., Ki, S. H., & Ku, S. K. (2021). Hemistepsin a Induces Apoptosis of Hepatocellular Carcinoma Cells by Downregulating STAT3. International Journal of Molecular Sciences, 22(9), 4743. https://doi.org/10.3390/ijms22094743