
The HSV-1 Transcription Factor ICP4 Confers Liquid-Like Properties to Viral Replication Compartments

 ,
,  , , and
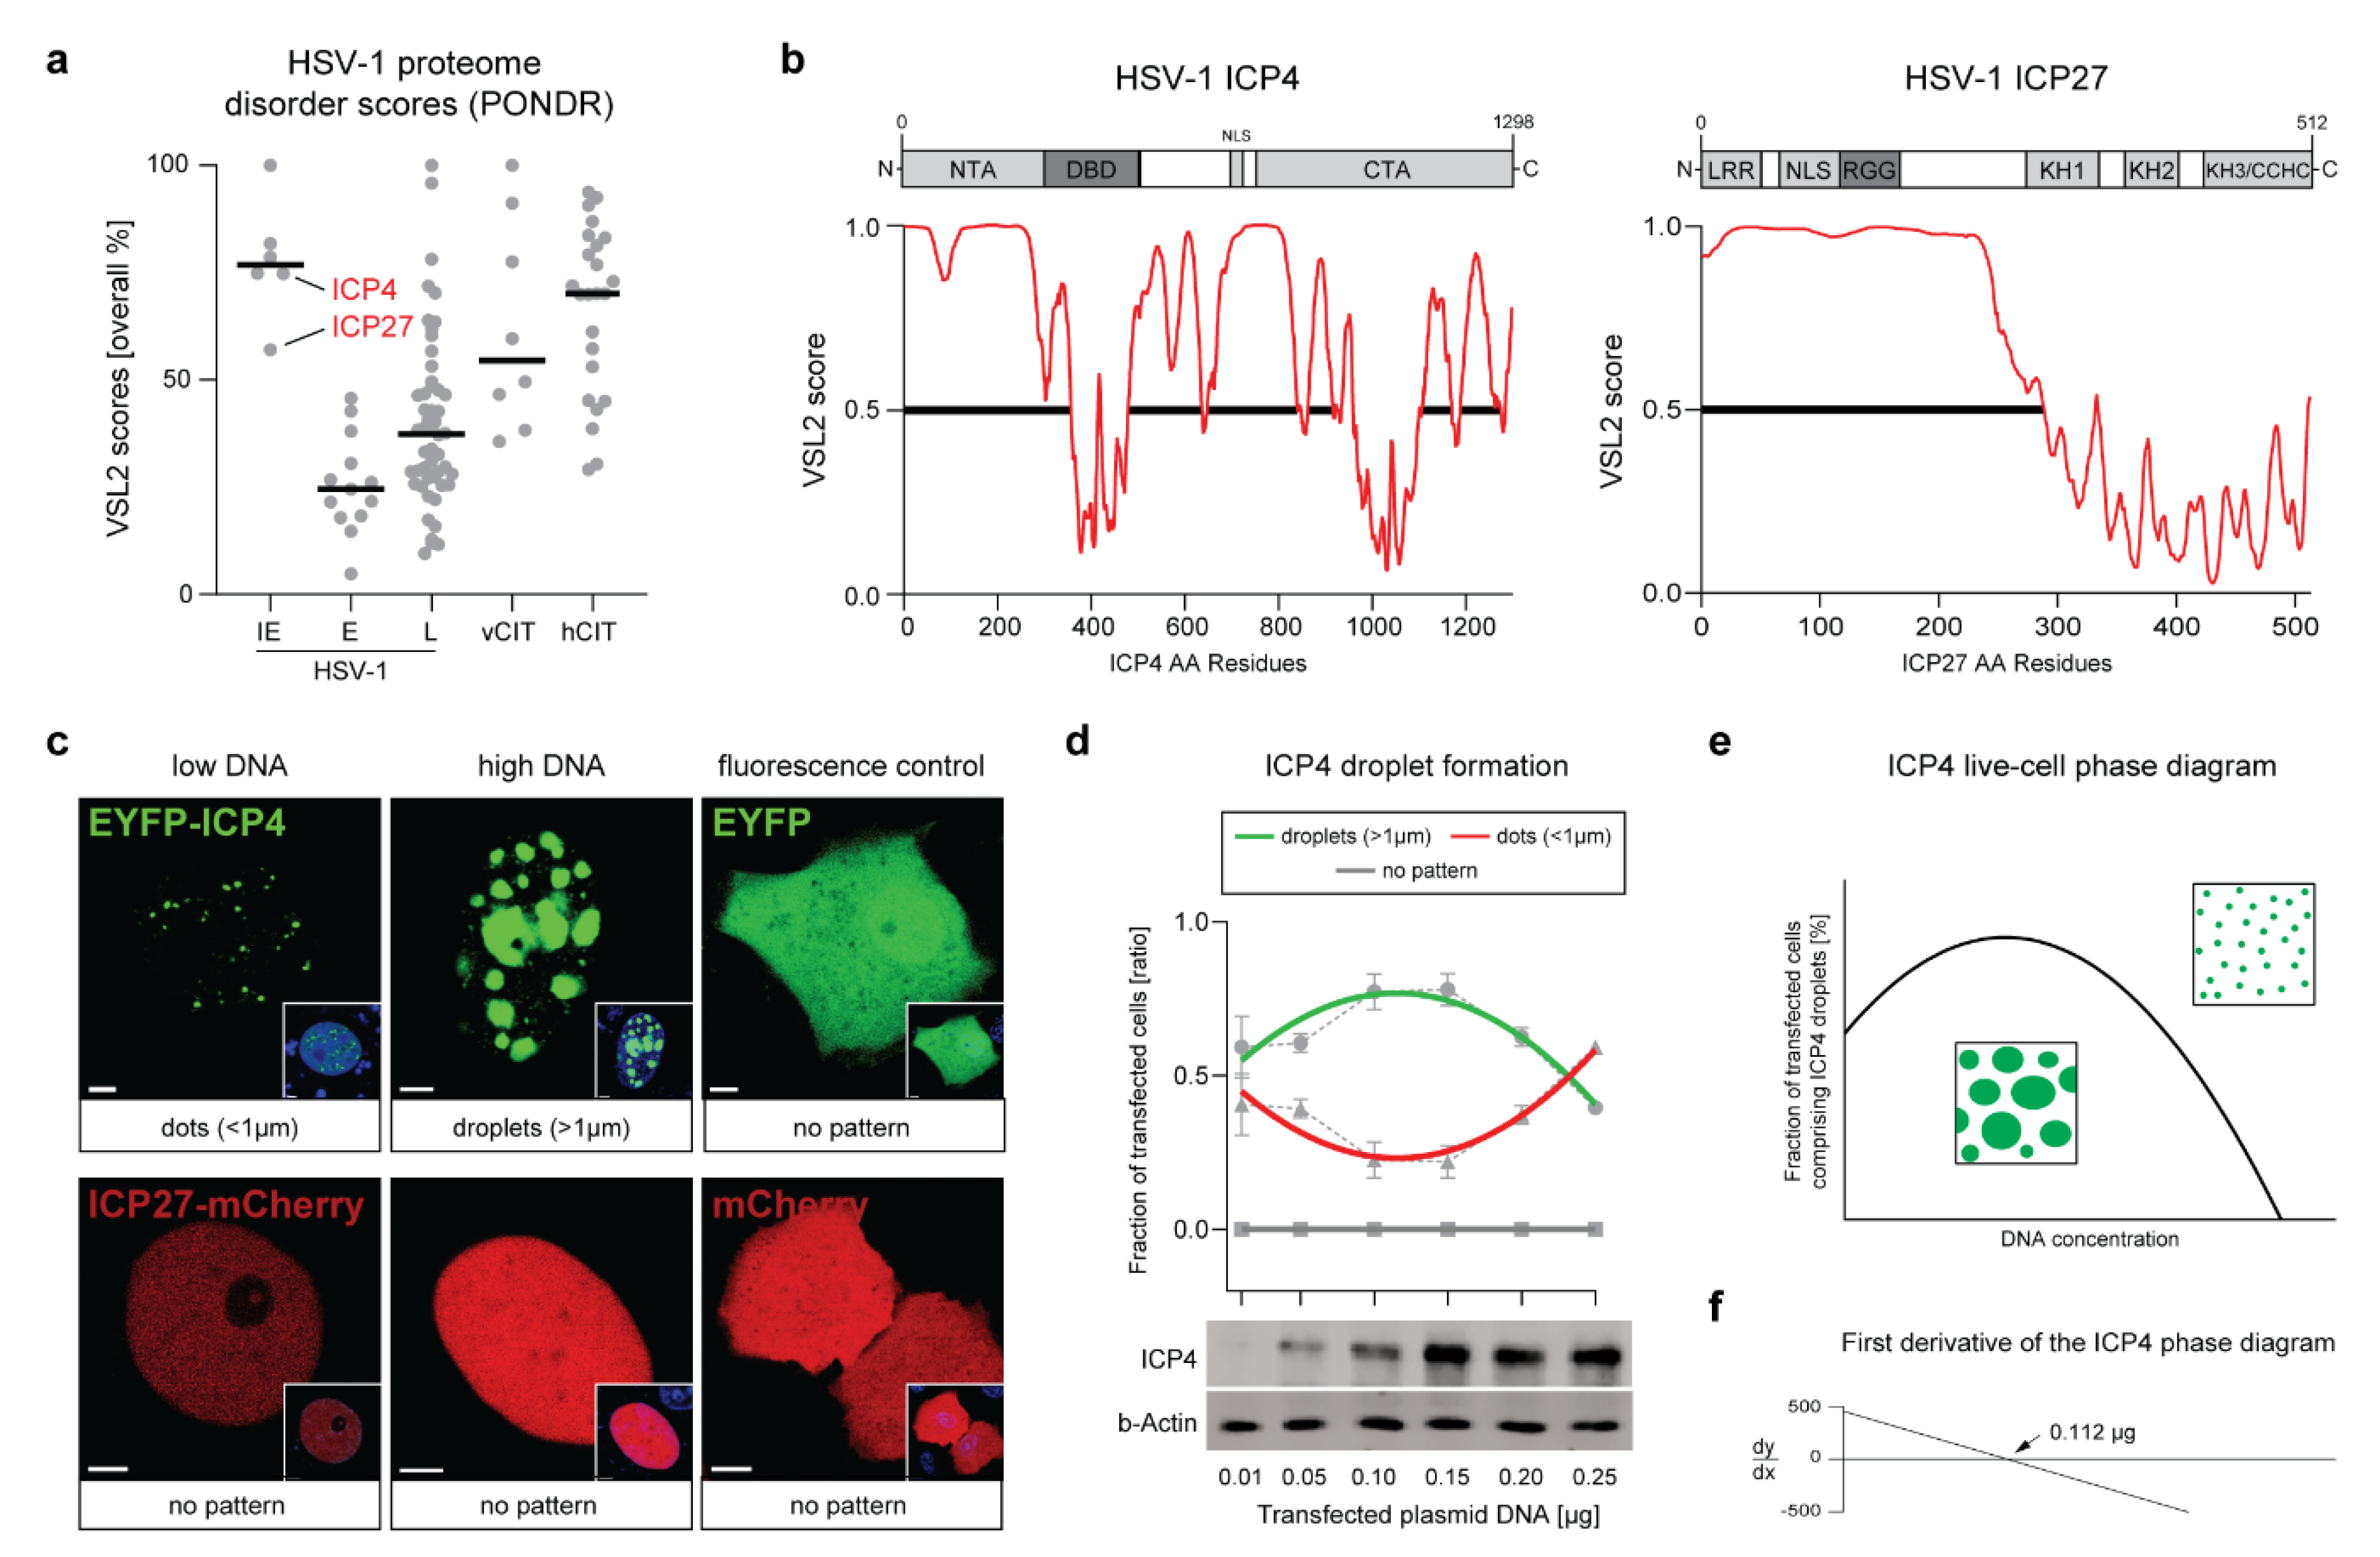
Abstract
1. Introduction
2. Results
2.1. The HSV-1 Transcription Factor ICP4 Is a Viral IDP That Drives the Formation of Nuclear Condensates
2.2. ICP4 Condensates Have Liquid-Like Properties
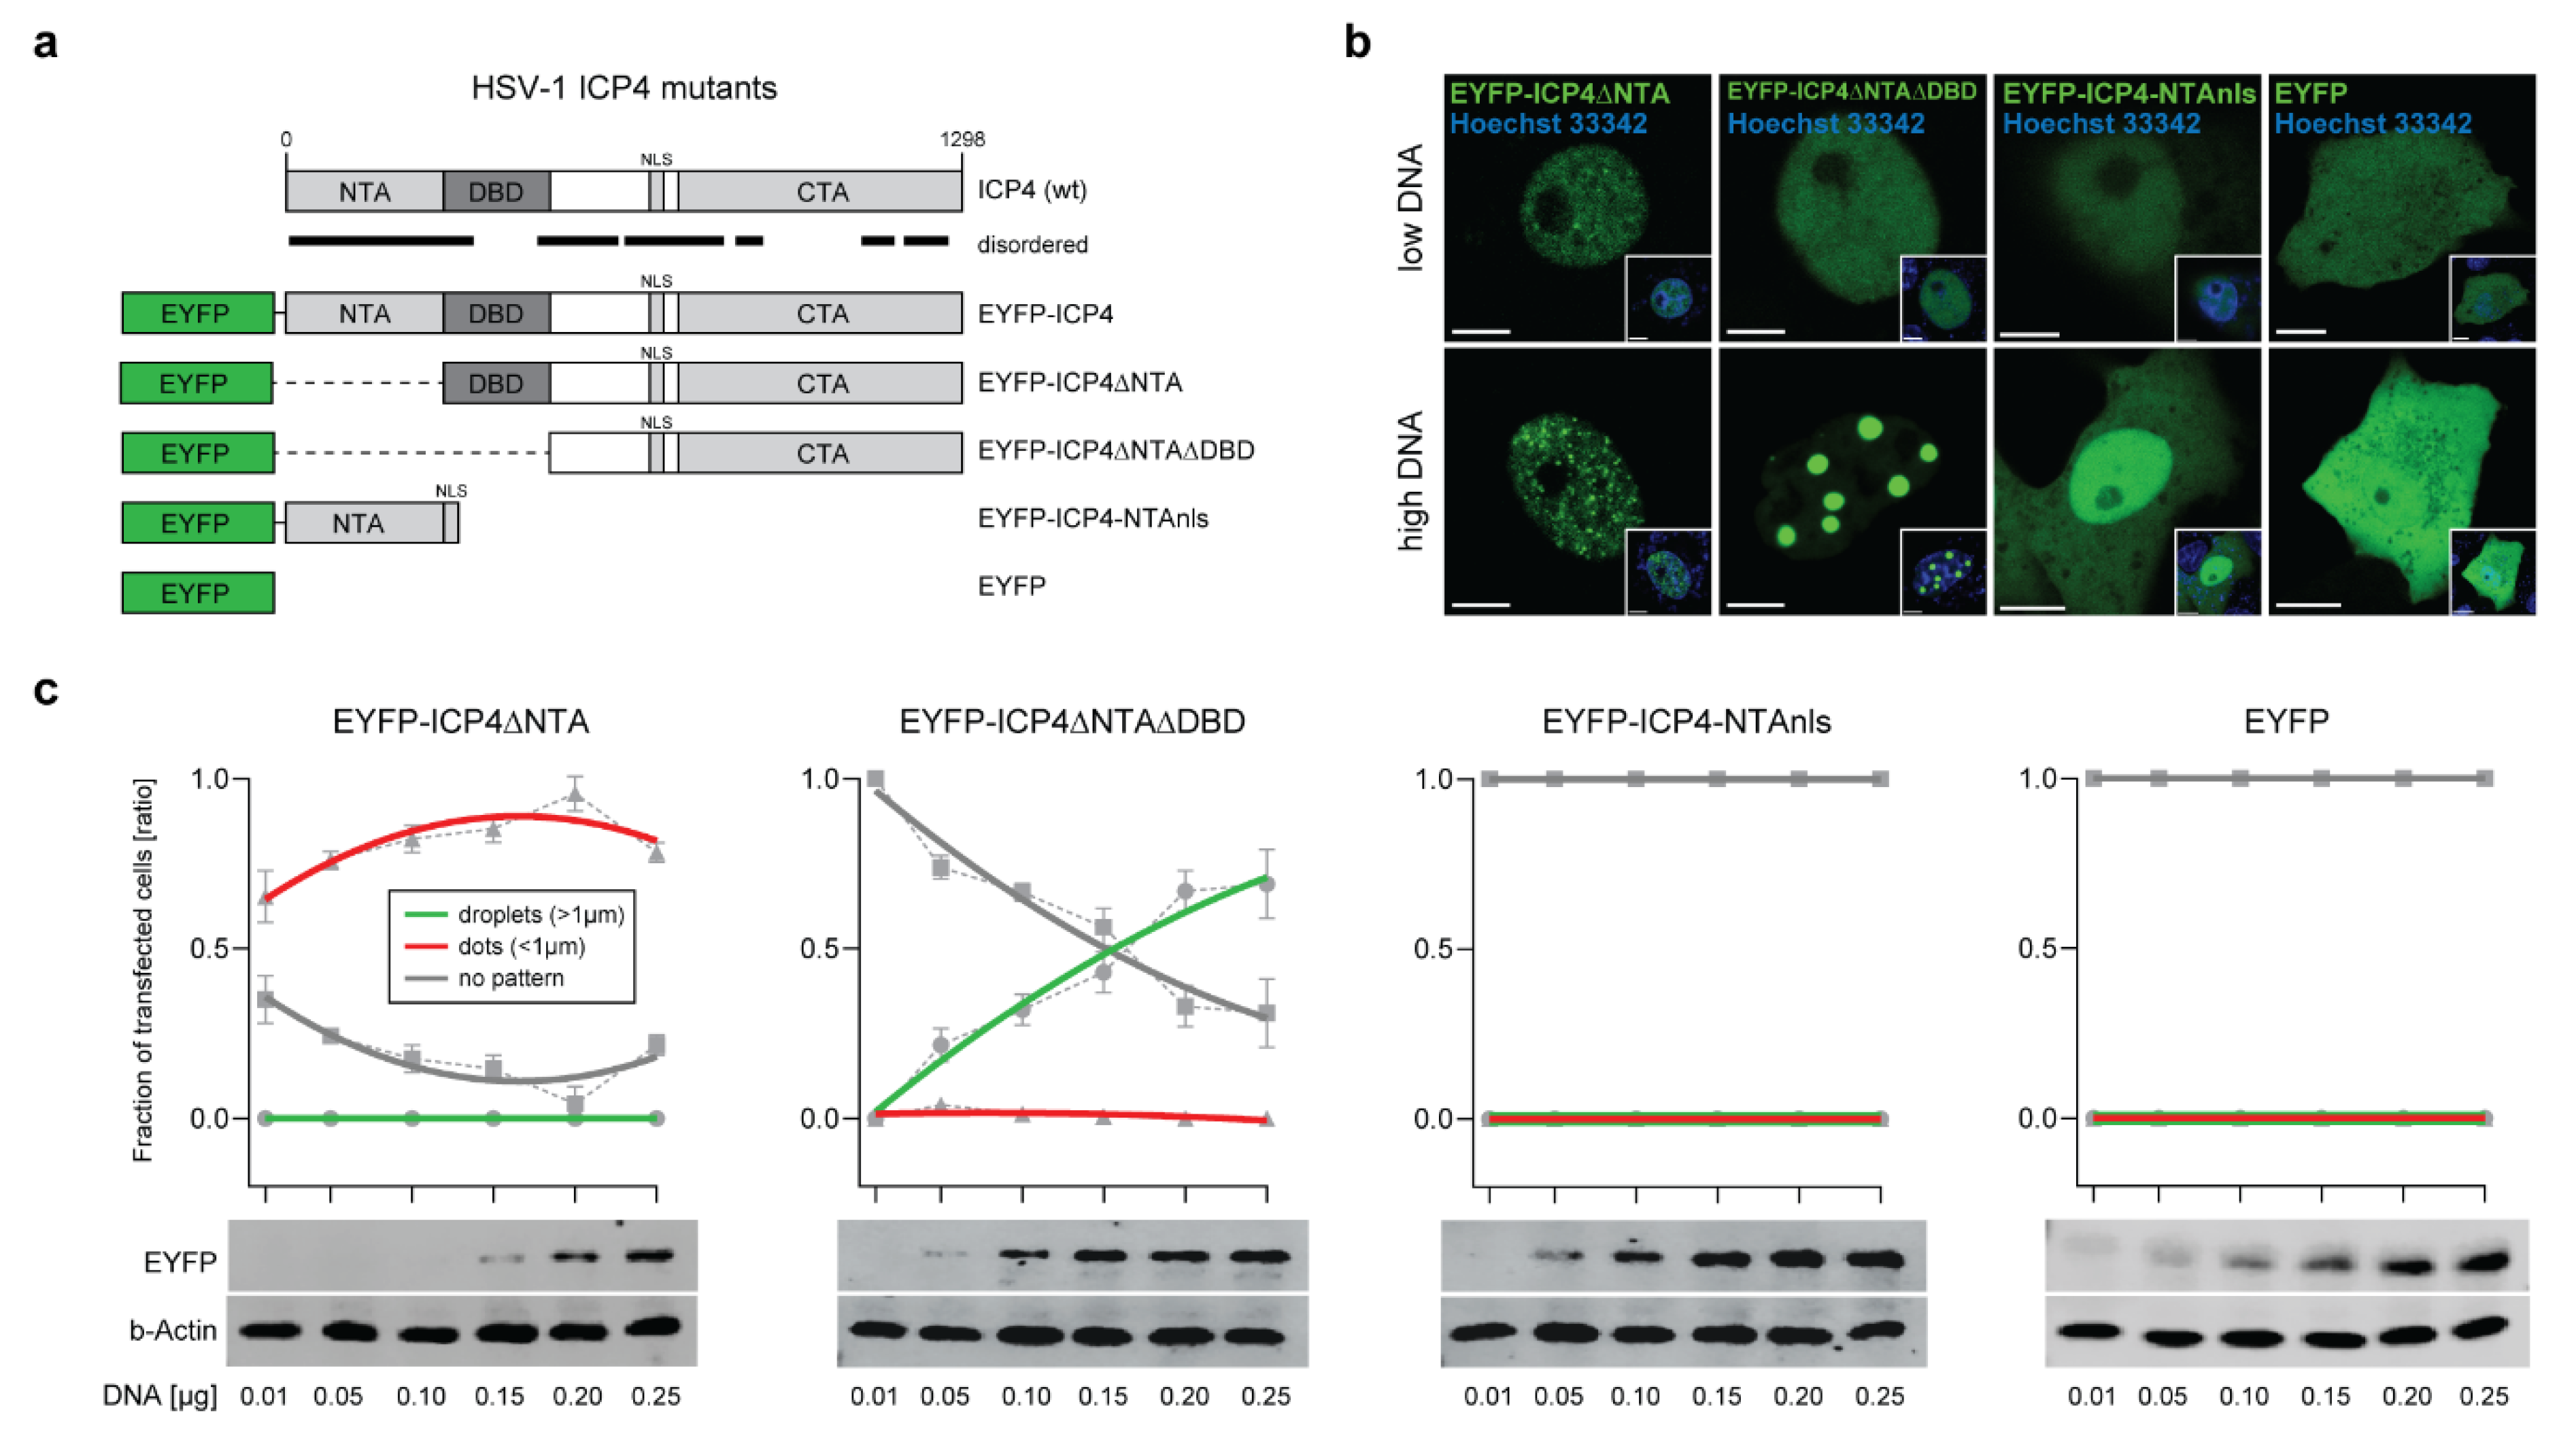
2.3. The ICP4 NTA and DBD Control the Protein Phase Behavior
2.4. ICP4 Retains Its Liquid-Like Properties in HSV-1 VRCs
3. Discussion
4. Materials and Methods
4.1. Cells and Viruses
4.2. Plasmid and Amplicon Constructs
4.3. 3D Live-Cell Imaging
4.4. ICP4 Live-Cell Phase Diagrams
4.5. 1,6-Hexanediol Treatment
4.6. FRAP Experiments
4.7. ATP Depletion
4.8. Western Blot Analysis
4.9. Prediction Algorithms
4.10. Statistical Analysis
Supplementary Materials
Author Contributions
Funding
Institutional Review Board Statement
Informed Consent Statement
Data Availability Statement
Acknowledgments
Conflicts of Interest
References
- Schmid, M.; Speiseder, T.; Dobner, T.; Gonzalez, R.A. DNA virus replication compartments. J. Virol. 2014, 88, 1404–1420. [Google Scholar] [CrossRef]
- Charman, M.; Weitzman, M.D. Replication Compartments of DNA Viruses in the Nucleus: Location, Location, Location. Viruses 2020, 12, 151. [Google Scholar] [CrossRef]
- Hidalgo, P.; Gonzalez, R.A. Formation of adenovirus DNA replication compartments. FEBS Lett. 2019, 593, 3518–3530. [Google Scholar] [CrossRef] [PubMed]
- Wang, I.H.; Suomalainen, M.; Andriasyan, V.; Kilcher, S.; Mercer, J.; Neef, A.; Luedtke, N.W.; Greber, U.F. Tracking viral genomes in host cells at single-molecule resolution. Cell Host Microbe 2013, 14, 468–480. [Google Scholar] [CrossRef] [PubMed]
- de Castro, I.F.; Volonte, L.; Risco, C. Virus factories: Biogenesis and structural design. Cell. Microbiol. 2013, 15, 24–34. [Google Scholar] [CrossRef] [PubMed]
- Heinrich, B.S.; Maliga, Z.; Stein, D.A.; Hyman, A.A.; Whelan, S.P.J. Phase Transitions Drive the Formation of Vesicular Stomatitis Virus Replication Compartments. mBio 2018, 9, e02290-17. [Google Scholar] [CrossRef] [PubMed]
- Nikolic, J.; Le Bars, R.; Lama, Z.; Scrima, N.; Lagaudriere-Gesbert, C.; Gaudin, Y.; Blondel, D. Negri bodies are viral factories with properties of liquid organelles. Nat. Commun. 2017, 8, 58. [Google Scholar] [CrossRef] [PubMed]
- Mitrea, D.M.; Kriwacki, R.W. Phase separation in biology; functional organization of a higher order. Cell Commun. Signal. 2016, 14, 1–20. [Google Scholar] [CrossRef]
- van der Lee, R.; Buljan, M.; Lang, B.; Weatheritt, R.J.; Daughdrill, G.W.; Dunker, A.K.; Fuxreiter, M.; Gough, J.; Gsponer, J.; Jones, D.T.; et al. Classification of intrinsically disordered regions and proteins. Chem. Rev. 2014, 114, 6589–6631. [Google Scholar] [CrossRef] [PubMed]
- Kato, M.; Han, T.W.; Xie, S.; Shi, K.; Du, X.; Wu, L.C.; Mirzaei, H.; Goldsmith, E.J.; Longgood, J.; Pei, J.; et al. Cell-free formation of RNA granules: Low complexity sequence domains form dynamic fibers within hydrogels. Cell 2012, 149, 753–767. [Google Scholar] [CrossRef]
- Kobiler, O.; Weitzman, M.D. Herpes simplex virus replication compartments: From naked release to recombining together. PLoS Pathog. 2019, 15, e1007714. [Google Scholar] [CrossRef] [PubMed]
- Chang, L.; Godinez, W.J.; Kim, I.H.; Tektonidis, M.; de Lanerolle, P.; Eils, R.; Rohr, K.; Knipe, D.M. Herpesviral replication compartments move and coalesce at nuclear speckles to enhance export of viral late mRNA. Proc. Natl. Acad. Sci. USA 2011, 108, E136–E144. [Google Scholar] [CrossRef] [PubMed]
- McSwiggen, D.T.; Hansen, A.S.; Teves, S.S.; Marie-Nelly, H.; Hao, Y.; Heckert, A.B.; Umemoto, K.K.; Dugast-Darzacq, C.; Tjian, R.; Darzacq, X. Evidence for DNA-mediated nuclear compartmentalization distinct from phase separation. eLife 2019, 8, 8. [Google Scholar] [CrossRef] [PubMed]
- Taylor, T.J.; McNamee, E.E.; Day, C.; Knipe, D.M. Herpes simplex virus replication compartments can form by coalescence of smaller compartments. Virology 2003, 309, 232–247. [Google Scholar] [CrossRef]
- Tomer, E.; Cohen, E.M.; Drayman, N.; Afriat, A.; Weitzman, M.D.; Zaritsky, A.; Kobiler, O. Coalescing replication compartments provide the opportunity for recombination between coinfecting herpesviruses. FASEB J. 2019, 33, 9388–9403. [Google Scholar] [CrossRef] [PubMed]
- Corbin-Lickfett, K.A.; Chen, I.H.; Cocco, M.J.; Sandri-Goldin, R.M. The HSV-1 ICP27 RGG box specifically binds flexible, GC-rich sequences but not G-quartet structures. Nucleic Acids Res. 2009, 37, 7290–7301. [Google Scholar] [CrossRef]
- Hernandez, F.P.; Sandri-Goldin, R.M. Herpes simplex virus 1 regulatory protein ICP27 undergoes a head-to-tail intramolecular interaction. J. Virol. 2010, 84, 4124–4135. [Google Scholar] [CrossRef]
- Everett, R.D.; Sourvinos, G.; Leiper, C.; Clements, J.B.; Orr, A. Formation of nuclear foci of the herpes simplex virus type 1 regulatory protein ICP4 at early times of infection: Localization, dynamics, recruitment of ICP27, and evidence for the de novo induction of ND10-like complexes. J. Virol. 2004, 78, 1903–1917. [Google Scholar] [CrossRef]
- Honess, R.W.; Roizman, B. Regulation of herpesvirus macromolecular synthesis: Sequential transition of polypeptide synthesis requires functional viral polypeptides. Proc. Natl. Acad. Sci. USA 1975, 72, 1276–1280. [Google Scholar] [CrossRef]
- Everett, R.D.; Sourvinos, G.; Orr, A. Recruitment of herpes simplex virus type 1 transcriptional regulatory protein ICP4 into foci juxtaposed to ND10 in live, infected cells. J. Virol. 2003, 77, 3680–3689. [Google Scholar] [CrossRef]
- Panagiotidis, C.A.; Lium, E.K.; Silverstein, S.J. Physical and functional interactions between herpes simplex virus immediate-early proteins ICP4 and ICP27. J. Virol. 1997, 71, 1547–1557. [Google Scholar] [CrossRef]
- Yakimovich, A.; Gumpert, H.; Burckhardt, C.J.; Lutschg, V.A.; Jurgeit, A.; Sbalzarini, I.F.; Greber, U.F. Cell-free transmission of human adenovirus by passive mass transfer in cell culture simulated in a computer model. J. Virol. 2012, 86, 10123–10137. [Google Scholar] [CrossRef] [PubMed]
- Kroschwald, S.; Maharana, S.; Simon, A. Hexanediol: A chemical probe to investigate the material properties of membrane-less compartments. Matters 2017, 3, 10. [Google Scholar] [CrossRef]
- Brangwynne, C.P.; Mitchison, T.J.; Hyman, A.A. Active liquid-like behavior of nucleoli determines their size and shape in Xenopus laevis oocytes. Proc. Natl. Acad. Sci. USA 2011, 108, 4334–4339. [Google Scholar] [CrossRef]
- Patel, A.; Malinovska, L.; Saha, S.; Wang, J.; Alberti, S.; Krishnan, Y.; Hyman, A.A. ATP as a biological hydrotrope. Science 2017, 356, 753–756. [Google Scholar] [CrossRef]
- Wagner, L.M.; Lester, J.T.; Sivrich, F.L.; DeLuca, N.A. The N terminus and C terminus of herpes simplex virus 1 ICP4 cooperate to activate viral gene expression. J. Virol. 2012, 86, 6862–6874. [Google Scholar] [CrossRef] [PubMed][Green Version]
- Tunnicliffe, R.B.; Lockhart-Cairns, M.P.; Levy, C.; Mould, A.P.; Jowitt, T.A.; Sito, H.; Baldock, C.; Sandri-Goldin, R.M.; Golovanov, A.P. The herpes viral transcription factor ICP4 forms a novel DNA recognition complex. Nucleic Acids Res. 2017, 45, 8064–8078. [Google Scholar] [CrossRef] [PubMed]
- Larson, A.G.; Elnatan, D.; Keenen, M.M.; Trnka, M.J.; Johnston, J.B.; Burlingame, A.L.; Agard, D.A.; Redding, S.; Narlikar, G.J. Liquid droplet formation by HP1alpha suggests a role for phase separation in heterochromatin. Nature 2017, 547, 236–240. [Google Scholar] [CrossRef] [PubMed]
- Strom, A.R.; Emelyanov, A.V.; Mir, M.; Fyodorov, D.V.; Darzacq, X.; Karpen, G.H. Phase separation drives heterochromatin domain formation. Nature 2017, 547, 241–245. [Google Scholar] [CrossRef] [PubMed]
- Glauser, D.L.; Strasser, R.; Laimbacher, A.S.; Saydam, O.; Clement, N.; Linden, R.M.; Ackermann, M.; Fraefel, C. Live covisualization of competing adeno-associated virus and herpes simplex virus type 1 DNA replication: Molecular mechanisms of interaction. J. Virol. 2007, 81, 4732–4743. [Google Scholar] [CrossRef]
- Seyffert, M.; Glauser, D.L.; Schraner, E.M.; de Oliveira, A.P.; Mansilla-Soto, J.; Vogt, B.; Buning, H.; Linden, R.M.; Ackermann, M.; Fraefel, C. Novel Mutant AAV2 Rep Proteins Support AAV2 Replication without Blocking HSV-1 Helpervirus Replication. PLoS ONE 2017, 12, e0170908. [Google Scholar] [CrossRef] [PubMed]
- Sourvinos, G.; Everett, R.D. Visualization of parental HSV-1 genomes and replication compartments in association with ND10 in live infected cells. EMBO J. 2002, 21, 4989–4997. [Google Scholar] [CrossRef]
- Brangwynne, C.P.; Eckmann, C.R.; Courson, D.S.; Rybarska, A.; Hoege, C.; Gharakhani, J.; Julicher, F.; Hyman, A.A. Germline P granules are liquid droplets that localize by controlled dissolution/condensation. Science 2009, 324, 1729–1732. [Google Scholar] [CrossRef]
- Banani, S.F.; Lee, H.O.; Hyman, A.A.; Rosen, M.K. Biomolecular condensates: Organizers of cellular biochemistry. Nat. Rev. Mol. Cell Biol. 2017, 18, 285–298. [Google Scholar] [CrossRef] [PubMed]
- Hyman, A.A.; Simons, K. Cell biology. Beyond oil and water--phase transitions in cells. Science 2012, 337, 1047–1049. [Google Scholar] [CrossRef] [PubMed]
- Hyman, A.A.; Weber, C.A.; Julicher, F. Liquid-liquid phase separation in biology. Annu. Rev. Cell Dev. Biol. 2014, 30, 39–58. [Google Scholar] [CrossRef]
- Boija, A.; Klein, I.A.; Sabari, B.R.; Dall’Agnese, A.; Coffey, E.L.; Zamudio, A.V.; Li, C.H.; Shrinivas, K.; Manteiga, J.C.; Hannett, N.M.; et al. Transcription Factors Activate Genes through the Phase-Separation Capacity of Their Activation Domains. Cell 2018, 175, 1842–1855.e1816. [Google Scholar] [CrossRef]
- Guo, Y.E.; Manteiga, J.C.; Henninger, J.E.; Sabari, B.R.; Dall’Agnese, A.; Hannett, N.M.; Spille, J.H.; Afeyan, L.K.; Zamudio, A.V.; Shrinivas, K.; et al. Pol II phosphorylation regulates a switch between transcriptional and splicing condensates. Nature 2019, 572, 543–548. [Google Scholar] [CrossRef]
- Kilic, S.; Lezaja, A.; Gatti, M.; Bianco, E.; Michelena, J.; Imhof, R.; Altmeyer, M. Phase separation of 53BP1 determines liquid-like behavior of DNA repair compartments. EMBO J. 2019, 38, e101379. [Google Scholar] [CrossRef]
- Oshidari, R.; Huang, R.; Medghalchi, M.; Tse, E.Y.W.; Ashgriz, N.; Lee, H.O.; Wyatt, H.; Mekhail, K. DNA repair by Rad52 liquid droplets. Nat. Commun. 2020, 11, 695. [Google Scholar] [CrossRef]
- Sabari, B.R.; Dall’Agnese, A.; Boija, A.; Klein, I.A.; Coffey, E.L.; Shrinivas, K.; Abraham, B.J.; Hannett, N.M.; Zamudio, A.V.; Manteiga, J.C.; et al. Coactivator condensation at super-enhancers links phase separation and gene control. Science 2018, 361, eaar3958. [Google Scholar] [CrossRef]
- Zamudio, A.V.; Dall’Agnese, A.; Henninger, J.E.; Manteiga, J.C.; Afeyan, L.K.; Hannett, N.M.; Coffey, E.L.; Li, C.H.; Oksuz, O.; Sabari, B.R.; et al. Mediator Condensates Localize Signaling Factors to Key Cell Identity Genes. Mol. Cell 2019, 76, 753–766.e756. [Google Scholar] [CrossRef]
- Metrick, C.M.; Koenigsberg, A.L.; Heldwein, E.E. Conserved Outer Tegument Component UL11 from Herpes Simplex Virus 1 Is an Intrinsically Disordered, RNA-Binding Protein. mBio 2020, 11. [Google Scholar] [CrossRef]
- Weber, S.C. Evidence for and against Liquid-Liquid Phase Separation in the Nucleus. Noncoding RNA 2019, 5, 50. [Google Scholar] [CrossRef]
- Galganski, L.; Urbanek, M.O.; Krzyzosiak, W.J. Nuclear speckles: Molecular organization, biological function and role in disease. Nucleic Acids Res. 2017, 45, 10350–10368. [Google Scholar] [CrossRef] [PubMed]
- Dremel, S.E.; DeLuca, N.A. Herpes simplex viral nucleoprotein creates a competitive transcriptional environment facilitating robust viral transcription and host shut off. Elife 2019, 8, 8. [Google Scholar] [CrossRef] [PubMed]
- Glauser, D.L.; Seyffert, M.; Strasser, R.; Franchini, M.; Laimbacher, A.S.; Dresch, C.; de Oliveira, A.P.; Vogel, R.; Buning, H.; Salvetti, A.; et al. Inhibition of Herpes Simplex Virus Type 1 Replication by Adeno-Associated Virus Rep Proteins Depends on Their Combined DNA-Binding and ATPase/Helicase Activities. J. Virol. 2010, 84, 3808–3824. [Google Scholar] [CrossRef] [PubMed]
- Seyffert, M.; Glauser, D.L.; Tobler, K.; Georgiev, O.; Vogel, R.; Vogt, B.; Agúndez, L.; Linden, M.; Büning, H.; Ackermann, M.; et al. Adeno-Associated Virus Type 2 Rep68 Can Bind to Consensus Rep-Binding Sites on the Herpes Simplex Virus 1 Genome. J. Virol. 2015, 89, 11150–11158. [Google Scholar] [CrossRef] [PubMed][Green Version]
- Saeki, Y.; Fraefel, C.; Ichikawa, T.; Breakefield, X.O.; Chiocca, E.A. Improved Helper Virus-Free Packaging System for HSV Amplicon Vectors Using an ICP27-Deleted, Oversized HSV-1 DNA in a Bacterial Artificial Chromosome. Mol. Ther. 2001, 3, 591–601. [Google Scholar] [CrossRef]
- Eichwald, C.; Arnoldi, F.; Laimbacher, A.S.; Schraner, E.M.; Fraefel, C.; Wild, P.; Burrone, O.R.; Ackermann, M. Rotavirus Viroplasm Fusion and Perinuclear Localization Are Dynamic Processes Requiring Stabilized Microtubules. PLoS ONE 2012, 7, e47947. [Google Scholar] [CrossRef]
- Fraefel, C.; Bittermann, A.G.; Bueler, H.; Heid, I.; Bachi, T.; Ackermann, M. Spatial and temporal organization of adeno-associated virus DNA replication in live cells. J. Virol. 2004, 78, 389–398. [Google Scholar] [CrossRef][Green Version]
- Glauser, D.L.; Saydam, O.; Balsiger, N.A.; Heid, I.; Linden, R.M.; Ackermann, M.; Fraefel, C. Four-Dimensional Visualization of the Simultaneous Activity of Alternative Adeno-Associated Virus Replication Origins. J. Virol. 2005, 79, 12218–12230. [Google Scholar] [CrossRef][Green Version]
- Carpenter, A.E.; Jones, T.R.; Lamprecht, M.R.; Clarke, C.; Kang, I.H.; Friman, O.; Guertin, D.A.; Chang, J.H.; Lindquist, R.A.; Moffat, J.; et al. CellProfiler: Image analysis software for identifying and quantifying cell phenotypes. Genome Biol. 2006, 7, R100. [Google Scholar] [CrossRef]
- Koulouras, G.; Panagopoulos, A.; Rapsomaniki, M.A.; Giakoumakis, N.N.; Taraviras, S.; Lygerou, Z. EasyFRAP-web: A web-based tool for the analysis of fluorescence recovery after photobleaching data. Nucleic Acids Res. 2018, 46, W467–W472. [Google Scholar] [CrossRef]
- Schindelin, J.; Arganda-Carreras, I.; Frise, E.; Kaynig, V.; Longair, M.; Pietzsch, T.; Preibisch, S.; Rueden, C.; Saalfeld, S.; Schmid, B.; et al. Fiji: An open-source platform for biological-image analysis. Nat. Methods 2012, 9, 676–682. [Google Scholar] [CrossRef] [PubMed]
- Holehouse, A.S.; Das, R.K.; Ahad, J.N.; Richardson, M.O.; Pappu, R.V. CIDER: Resources to Analyze Sequence-Ensemble Relationships of Intrinsically Disordered Proteins. Biophys. J. 2017, 112, 16–21. [Google Scholar] [CrossRef] [PubMed]
- Vernon, R.M.; Chong, P.A.; Tsang, B.; Kim, T.H.; Bah, A.; Farber, P.; Lin, H.; Forman-Kay, J.D. Pi-Pi contacts are an overlooked protein feature relevant to phase separation. eLife 2018, 7, e31486. [Google Scholar] [CrossRef] [PubMed]


Publisher’s Note: MDPI stays neutral with regard to jurisdictional claims in published maps and institutional affiliations. |
© 2021 by the authors. Licensee MDPI, Basel, Switzerland. This article is an open access article distributed under the terms and conditions of the Creative Commons Attribution (CC BY) license (https://creativecommons.org/licenses/by/4.0/).
Share and Cite
Seyffert, M.; Georgi, F.; Tobler, K.; Bourqui, L.; Anfossi, M.; Michaelsen, K.; Vogt, B.; Greber, U.F.; Fraefel, C. The HSV-1 Transcription Factor ICP4 Confers Liquid-Like Properties to Viral Replication Compartments. Int. J. Mol. Sci. 2021, 22, 4447. https://doi.org/10.3390/ijms22094447
Seyffert M, Georgi F, Tobler K, Bourqui L, Anfossi M, Michaelsen K, Vogt B, Greber UF, Fraefel C. The HSV-1 Transcription Factor ICP4 Confers Liquid-Like Properties to Viral Replication Compartments. International Journal of Molecular Sciences. 2021; 22(9):4447. https://doi.org/10.3390/ijms22094447
Chicago/Turabian StyleSeyffert, Michael, Fanny Georgi, Kurt Tobler, Laurent Bourqui, Michela Anfossi, Kevin Michaelsen, Bernd Vogt, Urs F. Greber, and Cornel Fraefel. 2021. "The HSV-1 Transcription Factor ICP4 Confers Liquid-Like Properties to Viral Replication Compartments" International Journal of Molecular Sciences 22, no. 9: 4447. https://doi.org/10.3390/ijms22094447
APA StyleSeyffert, M., Georgi, F., Tobler, K., Bourqui, L., Anfossi, M., Michaelsen, K., Vogt, B., Greber, U. F., & Fraefel, C. (2021). The HSV-1 Transcription Factor ICP4 Confers Liquid-Like Properties to Viral Replication Compartments. International Journal of Molecular Sciences, 22(9), 4447. https://doi.org/10.3390/ijms22094447