Article

Quantitative Proteomics Reveals the Dynamic Regulation of the Tomato Proteome in Response to Phytophthora infestans

1
Agricultural Biotechnology Research Center, Academia Sinica, Taipei 11529, Taiwan
2
Molecular and Biological Agricultural Sciences Program, Taiwan International Graduate Program, Academia Sinica, Taipei 11529, Taiwan
3
Graduate Institute of Biotechnology, National Chung Hsing University, Taichung 402, Taiwan
*
Author to whom correspondence should be addressed.
Contributed equally to this work.
Int. J. Mol. Sci. 2021, 22(8), 4174; https://doi.org/10.3390/ijms22084174
Submission received: 7 March 2021 / Revised: 14 April 2021 / Accepted: 14 April 2021 / Published: 17 April 2021
(This article belongs to the Special Issue Plant Proteomic Research 4.0)

Abstract

:
Late blight (LB) disease is a major threat to potato and tomato production. It is caused by the hemibiotrophic pathogen, Phytophthora infestans. P. infestans can destroy all of the major organs in plants of susceptible crops and result in a total loss of productivity. At the early pathogenesis stage, this hemibiotrophic oomycete pathogen causes an asymptomatic biotrophic infection in hosts, which then progresses to a necrotrophic phase at the later infection stage. In this study, to examine how the tomato proteome is regulated by P. infestans at different stages of pathogenesis, a data-independent acquisition (DIA) proteomics approach was used to trace the dynamics of the protein regulation. A comprehensive picture of the regulation of tomato proteins functioning in the immunity, signaling, defense, and metabolism pathways at different stages of P. infestans infection is revealed. Among the regulated proteins, several involved in mediating plant defense responses were found to be differentially regulated at the transcriptional or translational levels across different pathogenesis phases. This study increases understanding of the pathogenesis of P. infestans in tomato and also identifies key transcriptional and translational events possibly targeted by the pathogen during different phases of its life cycle, thus providing novel insights for developing a new strategy towards better control of LB disease in tomato.

1. Introduction

Late blight (LB), caused by the oomycete Phytophthora infestans, is one of the most notorious plant diseases to afflict solanaceous plants [1]. LB is difficult to control and causes severe losses of up to 100% in the production of potato and tomato crops [2]. LB was the major factor contributing to severe crop loss in Ireland in early 1840, causing the Great Famine and resulting in the population of the area falling by 20–25%. Until now, this disease remains one of the biggest threats to tomato and potato production. In the United States, LB has caused up to 7% yield losses in tomato crops and approximately 3.5% yield losses in potato crops over the last two decades [2]. The worldwide economic losses due to LB and the cost of controlling this disease are estimated to exceed $5 billion in tomato crops [3] and about $7 billion in potato crops [2] annually.
P. infestans destroys all the leaves, roots, tubers, and fruit of susceptible plants [4]. After infection of susceptible hosts by this pathogen, local lesions pervade the whole plant within a few days, eventually causing the death of the plant. The sporangia produced on an infected plant organ can be effectively dispersed by wind or by splashes from raindrops [5]. P. infestans exhibits a two-phase life cycle; it is initially hemibiotrophic, showing an asymptomatic biotrophic phase of infection. This is followed by a necrotrophic phase that is characterized by the degradation of the host tissue [6]. During the biotrophic stage, P. infestans forms appressoria, primary and secondary hyphae and a specialized structure called haustoria within living plant cells and obtains nutrients without killing the plant [7]. In this stage of pathogenesis, P. infestans suppresses the plant immune system and the programmed cell death (PCD) responses that limit biotrophic infection. At the necrotrophic stage, the pathogen hyphae ramify throughout the plant and toxins from the pathogen are injected into the host cells causing necrosis of the infected tissue [8].
To gain a comprehensive insight into the dynamic plant molecular mechanisms that respond to the hemibiotrophic infection of P. infestans, several time-course quantitative transcriptomics studies have been performed on tomato or potato infected by this pathogen [9,10,11]. In potato, massive transcriptional reprogramming was observed at the end of the early biotrophic infection stage but the pathogenesis-related (PR) and hypersensitive response (HR) genes were mainly upregulated at the later necrotrophic stage [9]. Using microarray analysis, genes encoding transcription factors and components of signaling pathways were shown to be upregulated by P. infestans in a resistant tomato cultivar, but suppressed in a susceptible one [10]. Due to the accuracy of the microarray technique, five genes considered to be involved in plant resistance in the microarray-based transcriptomics study were validated by real-time quantitative reverse transcription polymerase chain reaction (qRT-PCR) analysis: endochitinase 3 precursor, glyceraldehyde 3-phosphate dehydrogenase B, probable GST, carbonic anhydrase, and basic glucanase. More recently, a more accurate transcriptomics analysis using the next-generation sequencing technique was performed to observe the transcriptomic change in tomato from the well-defined biotrophic to the necrotrophic pathogenesis stages of P. infestans infection [11].
Furthermore, proteomics was used to investigate the pathogenic regulation dynamics of the plant proteome by this pathogen. The interaction of potatoes and P. infestans was examined by quantifying the changes in the potato proteome after infection, both in a temporal manner and between the resistant and susceptible cultivars [12,13,14]. These studies provided further direct evidence about the production of key proteins that can directly interact with this pathogen and proceed with the metabolic reaction for the defense metabolites or energy homeostasis. However, to date, there has been no comprehensive study reporting the dynamics of the tomato proteome in response to P. infestans. In a previous proteomic study that used two-dimensional electrophoresis (2-DE) and matrix-assisted laser desorption/ionization time-of-flight/time-of-flight (MALDI-TOF/TOF) for protein identification, only 56 proteins were identified in the proteome of resistant and susceptible tomato cultivars in response to P. infestans infection [15].
In this study, a data-independent acquisition (DIA) proteomics approach was applied to reveal the dynamics of the proteome change in tomato from the early (biotrophic phase) to the late stage (necrotrophic phase) of P. infestans infection. By establishing a DIA spectra library from two-dimensional-liquid chromatography with tandem mass spectrometry (LC-MS/MS) analysis operated in the data-dependent acquisition (DDA) mode, more proteins were identified compared to the use of a spectral library established by single-dimensional LC-MS/MS. This approach enabled the profiling of the tomato proteome in a high-throughput manner, and can potentially be used to facilitate the analysis of the dynamics of different pathogenic responses in plants.

2. Results and Discussion

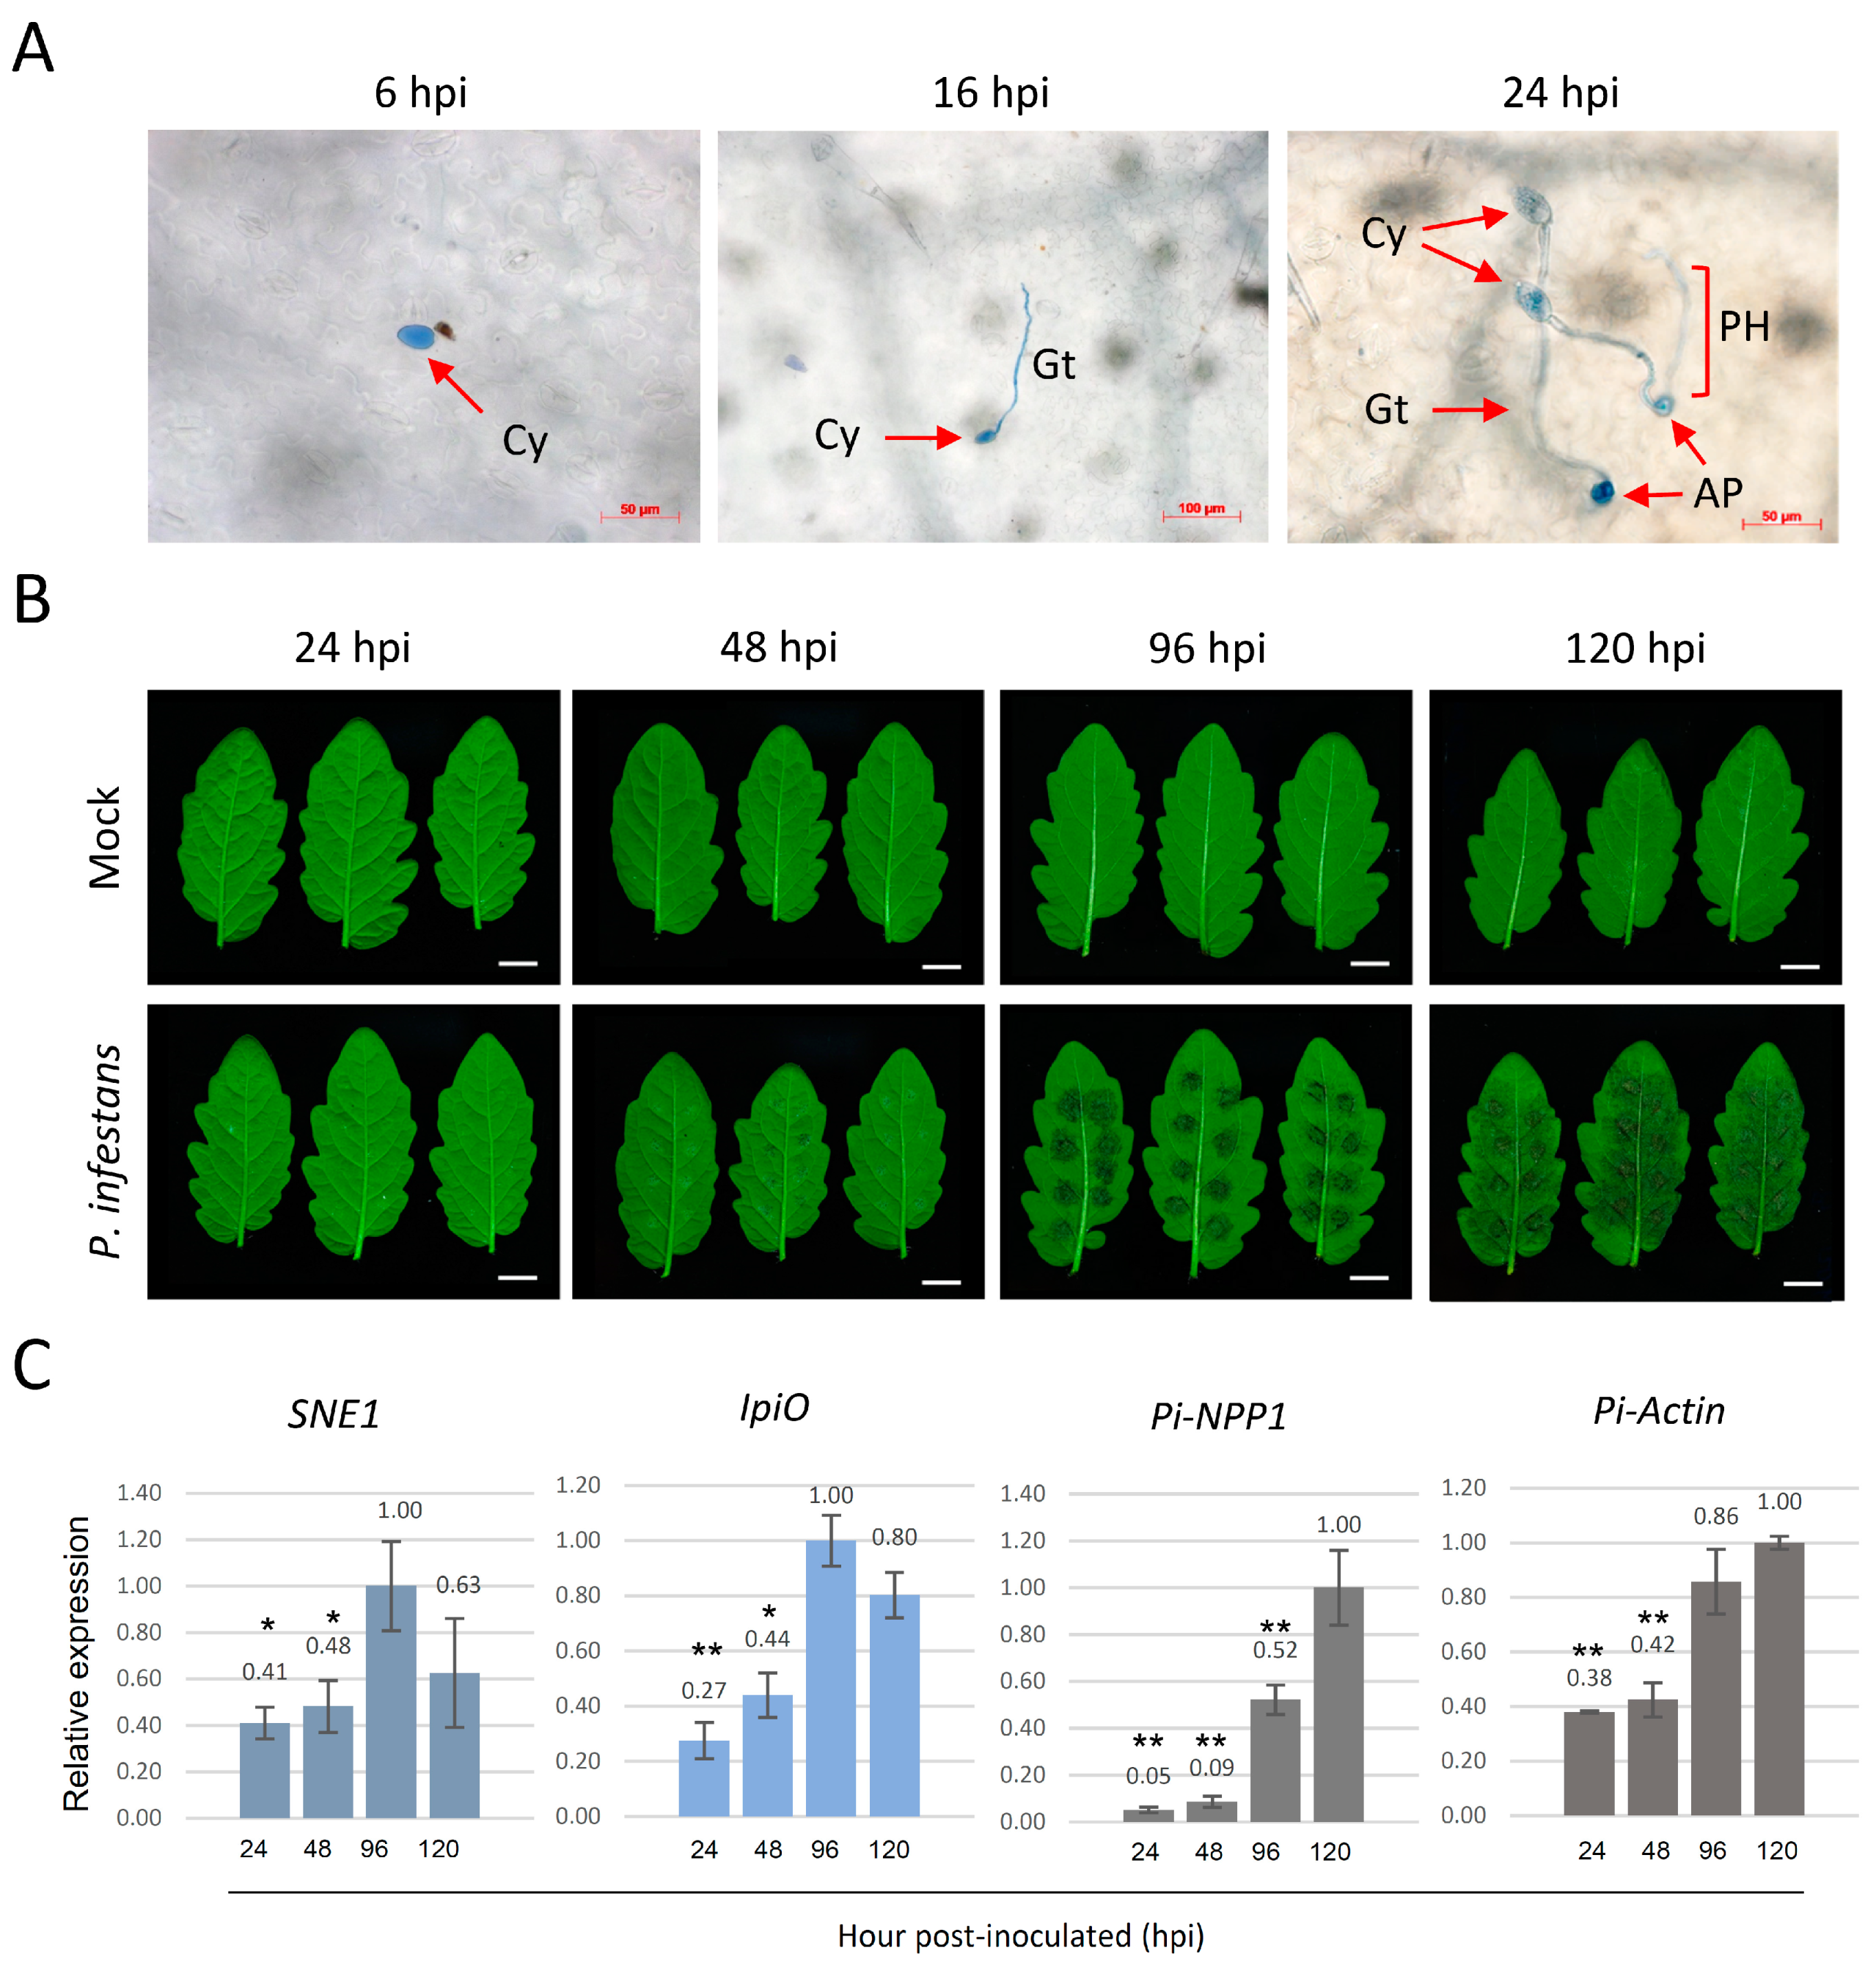
2.1. P. infestans Pathogenesis Assessment in Tomato Leaves

A time-series phenotypic assessment of the leaf from a susceptible tomato (Solanum lycopersicum) cultivar (CL5915) challenged with P. infestans was subjected to microscopic and macroscopic examination (Figure 1A,B). Leaflets detached from 35-d-old tomato plants were inoculated with droplets of P. infestans sporangia suspension and collected at 6, 16, 24, 48, 96, and 120-h post-inoculation (hpi). Three biological replicates were used at each time point in the phenotypic assessment. Because there was no obvious disease phenotype at the early time points, the pathogen development on leaflets at 6, 16, and 24 hpi were stained with trypan blue. After the staining, the growth phenotype of the pathogen was recorded by picking thirty P. infestans spores randomly. Microscopy showed that 20% (6/30) sporangia started to germinate and 80% (24/30) sporangia remained at the cyst stage at 6 hpi (Figure 1A). At 16 hpi, about 90% of the resting cysts of P. infestans germinated and developed geminating tubes, and only ~3% (1/30) of the sporangia remained as cysts. The appressorium structures were first observed at 16 hpi and accounted for only ~7% (2/30) of the total cysts. At 24 hpi, appressoria appeared in ~73% (22/30) of the observed cysts, and primary hyphae could be observed extending through the host tissue. No disease symptoms on the leaf were observed macroscopically at 24 hpi and only little inconspicuous black spots were discovered at 48 hpi (Figure 1B). Water-soaked lesions were not obvious until 96 hpi and the average area of the lesions observed at this time point was 0.71 ± 0.12 cm2. At 120 hpi, the lesion area had covered over 80% of the leaf surfaces and aerial mycelium were visually observable surrounding the center of the droplets, indicating a well-established necrotrophic phase.
To better assess the pathogenesis phase at the molecular level, the expressions of P. infestans genes that mark different pathogenesis stages were analyzed by reverse transcription-polymerase chain reaction (RT-PCR) in the leaflets at 24, 48, 96, and 120 hpi (Figure 1C and Figure S1). Two P. infestans RXLR effector genes SNE1 and IpiO (also named Avr-blb1) were used as marker genes for infection at the biotrophic stage. SNE1 has been reported to be specifically expressed at the transcriptional level during the biotrophic stage in infected tomato [16], and IpiO has been detected in the early stage of infection, but not in sporangia or old mycelia [17]. Another gene PiNPP1.1 which encodes a cell death-inducing protein and thus marks the necrotrophic stage of infection [18] was used in this study. The expression of SEN1 and IpiO was detected from the early stage of infection (24 hpi) and continually accumulated during the biotrophic phase until 96 hpi. The expression of both biotrophic markers decreased at 120 hpi, suggesting that the pathogen transited from biotrophy to necrotrophy at 96 hpi. In contrast, PiNPP1.1 expression was detected at low abundance until 96 hpi and was mainly expressed at the later stages of the interaction. The expression of P. infestans actin was used to evaluate pathogen growth. Expression of this gene was continuously increased from 24 hpi to 120 hpi. Taken together, P. infestans exhibited a biotrophic invasion in tomato cv. CL5915 at 24 hpi by initiating the penetration. The time points 48 and 96 hpi represented the transition phase (the change from biotrophic to necrotrophic growth), and the necrotrophic phase, respectively.

2.2. Proteomics Analysis and Quantification Using the DIA Approach

To study the plant pathogenesis responses at the protein level across the early biotrophic to transition and later necrotrophic phases, tomato leaflets at 24, 48, and 96 hpi with P. infestans were subjected to proteomic analysis using data-independent acquisition (DIA). A DIA spectral library containing 11,563 proteins and 65,763 peptide transition groups from tomato and P. infestans was constructed by the analysis of the pooled tryptic peptide samples with or without fractionation by high-pH reversed-phase liquid chromatography (RPLC) using LC-MS/MS operated in data-dependent acquisition (DDA) mode. A total of 7324 proteins, 6631 tomato proteins, 678 P. infestans proteins (with at least 1 unique peptide), and 15 protein groups shared by tomato and P. infestans were identified in the DIA proteomics analysis of the time-series experiments. About 67% of tomato proteins were identified in samples collected at all time points (Supplemental Tables S1 and S2) and ~4–11% of the proteins were exclusively identified at a single time point (Figure 2A). To identify the tomato proteins regulated by this pathogen, the abundance of each protein in the plants inoculated with the pathogen was compared to the abundance in the mock-treated plants at the same time point. An average fold change of protein abundance in the pathogen and mock-treated plants from three biological replicates of ≥1.5 or ≤0.67 with significance (p < 0.05) was considered as up- or downregulated by P. infestans, respectively (Figure 2B). In all, 3165, 3345 and 2973 tomato proteins were quantified at 24, 48, and 96 hpi, respectively. In the quantitative analysis, 8, 21, and 270 tomato proteins were determined to be upregulated at 24, 48 and 96 hpi, respectively. In addition, 4, 13, and 110 tomato proteins were found to be downregulated at 24, 48 and 96 hpi, respectively. No protein was found to have differential up- or downregulation at all the time points and only ~4% of upregulated and ~2% of downregulated proteins were identified at both 48 and 96 hpi. The data, therefore, showed that the tomato proteome was barely changed during the biotrophic stage of infection at 24 hpi; in contrast, only certain proteins were quantified as regulated at the transition stage at 48 hpi; and more than 10% of the quantified proteins were regulated at the late necrotrophic stage at 96 hpi.

2.3. Functional Classification of the Proteins Regulated by P. infestans

To understand the implications of the differentially regulated proteins in this study, the quantified proteins were subjected to functional categorization analysis using Gene Ontology (GO). In this analysis, we used The Arabidopsis Information Resource (TAIR) database combined with Protein Basic Local Alignment Search Tool (BLASTP) to identify the protein functions that showed a significant change in the P. infestans-treated and mock-treated samples. The upregulated and downregulated proteins were classified into 15 and 10 enriched categories, respectively (Figure 3). At 24 hpi, the enriched functional categories for the upregulated proteins were “single-organism metabolic process” and “single-organism cellular process”; the downregulated proteins were “response to other organism”, “response to external stimulus”, “response to biotic stimulus”, and “response to abiotic stimulus”. At 48 hpi, the enriched functional categories for the upregulated proteins were “developmental process involved in reproduction”, “response to other organism”, “response to external stimulus” and “response to biotic stimulus” but there were no enriched categories for the downregulated proteins. At 96 hpi, the enriched functional categories for the upregulated proteins were “catabolic process”, “immune response”, “interspecies interaction between organisms”, “macromolecule localization”, “multi-multicellular organism process”, “protein folding”, “response to abiotic stimulus”, “response to biotic stimulus”, “response to chemical”, “response to external stimulus”, “response to other organism”, “response to stress”, “single-organism cellular process” and “single-organism metabolic process”, and the enriched functional categories for the downregulated proteins were “biosynthetic process”, “cellular component biogenesis”, “cellular metabolic process”, “methylation”, “nitrogen compound metabolic process” and “single-organism metabolic process”.
The upregulated proteins that are pathogen resistance-associated fall into enriched function categories like “immune response”, “interspecies interaction between organisms”, “response to biotic and abiotic stimulus”, “response to external stimulus”, “response to other organism”, and “response to stress”, suggesting that these functions in the plant were positively regulated during the tomato-P. infestans interaction. Conversely, proteins related to the metabolic pathways or cellular biosynthesis processes were mostly downregulated, suggesting that metabolic flux may be altered by the attack of this pathogen.

2.4. Changes Associated with Direct Defense

Tomato proteins involved in different pathogen-prohibiting functions were found to be regulated by P. infestans (Table 1 and Table S1). Three tomato beta-glucosidases (Solyc01g008620, Solyc10g079860, and a protein group of Solyc01g059965 and Solyc01g060020) for hydrolyzing the major constitutes (1→3)-β-d-glucans, (1→6)-β-d-glucans and cellulose of the oomycete cell wall [19] were observed to be regulated by P. infestans. Among these beta-glucosidases, the expression of one of the protein groups (Solyc01g059965 and Solyc01g060020) that encodes a putative beta-1,3-endoglucanase sequence was downregulated with a fold change of 0.62 at 24 hpi, but upregulated with a fold change of 3.67 at 96 hpi. Two other quantified beta-glucosidases Solyc01g008620 and Solyc10g079860 did not have a significant change in abundance at 24 hpi, but were increased by 5.91 and 16.62-fold, respectively, at 96 hpi. Four proteins with chitinase activity (Solyc10g055800, Solyc04g072000, Solyc10g055810, Solyc02g082920) for hydrolyzing the chitin of the fungal cell wall were all found to be upregulated only at 96 hpi with a fold change from 3.52 to 7.90. PR-5 protein (Solyc08g080670), which can bind to the mannose phosphate groups of the fungal cell walls and exhibit a broad spectrum in fungal resistance [20], was downregulated with a fold change of 0.32 at 24 hpi but was not regulated at later time points. The PR-5 family proteins (also called thaumatin-like proteins) which include the closely related proteins permatin, osmotin and zeamatin, may cause fungal hyphae leak and rupture likely via disrupting the fungal membrane permeabilization [21] and overexpressing PR-5 causes enhanced resistance against necrotrophic fungus in multiple plant species [22]. In addition, several proteins that may have roles in defense but for which direct studies to examine their biological functions are lacking were also found to be regulated. One PR-10 family protein named norcoclaurine synthase (NCS; Solyc07g005370) was identified to have a fold change of 0.59 at 96 hpi. This protein belongs to the Bet v 1 family which have RNase activity [23,24] and cysteine protease inhibition activities [25], and participate in anti-bacterial, anti-fungal, anti-viral, and anti-nematode activity. However, three other PR-10 family proteins with accession numbers Solyc09g090990, Solyc09g091000, and Solyc09g090980 showed a 6.26, 10.98, and 22.30-fold increase at 96 hpi, respectively. Two of them Solyc09g090990 and Solyc09g090980 were also, respectively, 5.45 and 2.31-fold upregulated at 48 hpi. PR-4 (Solyc01g09724) and PR-4b (Solyc01g097280) proteins which are bifunctional enzymes with both RNase and DNase activity and involved in regulating HR [26] were also shown to be increased at 96 hpi by 2.14 to 3.0-fold.
Of the defense proteins identified to be regulated by P. infestans, the beta-glucosidases and PR-5 protein involved in the disruption and blocking of the pathogen cell wall were repressed at the early stage of the pathogenesis. This repression may facilitate the early development of the pathogen, and establish successful penetration into plant cells at the biotrophic phase. In the P. infestans-resistant potato cultivar, endo-1,3-beta-glucosidase was upregulated as early as 6 hpi but not in the susceptible potato cultivar [13]. Furthermore, the previously claimed resistant potato cultivar became susceptible to another P. infestans isolate that caused severe lesion areas after inoculation had upregulated endo-1,3-beta-glucosidase at a later time point [14]. Therefore, the early induction of these hydrolytic enzymes in the resistance cultivar could be the key to plant resistance to this pathogen. In our study, tomato beta-glucosidases were not regulated by P. infestans at the early time point, which may be related to the plant susceptibility for this pathogen. However, at the later time point after P. infestans-inoculation, tomato proteins related to the disruption of the glucans were highly expressed. This may reflect enhanced plant resistance by the degradation of the hyphal cell wall of the oomycete, which not only renders it susceptible to cell lysis but also releases beta-1,3-glucans which serve as elicitors [27] to initiate a wide range of localized and systemic defense responses. Moreover, the proteins involved in regulating HR were induced at 96 hpi; this response may contribute to the triggering of rapid cell death in the local region surrounding the infection area to prevent the spread of the pathogen.

2.5. Changes Associated with Immune Regulation

Several tomato proteins involved in regulating immune responses were identified to have an abundance change in response to the pathogenesis of P. infestans (Table 2 and Table S1). Three PR-1 family proteins (Solyc00g174340, Solyc09g007010, and Solyc01g106620) were upregulated at 96 hpi with fold-changes from 4.91 to 7.47. The protein encoded by the gene Solyc00g174340, named pathogenesis-related protein 1b (PR-1b), is the precursor of the peptide hormone, cysteine-rich secretory protein, antigen 5 and PR-1 (CAP)-derived peptide 1 (CAPE1). PR-1b was upregulated at 48 and 96 hpi with a fold change of 1.51 and 7.47, respectively. CAPE1 derived from PR-1b has been demonstrated to activate tomato antiherbivore and antipathogen responses via jasmonic acid (JA) and salicylic acid (SA)-regulated responses [28]. The production of CAPE1 has been suggested to balance excessive JA production and facilitate the biosynthesis of SA in plants [29]. On the other hand, the sterol-binding activity of tobacco PR-1b contributes to the depletion of the lipids required for oomycete Phytophthora brassicae to inhibit the growth of this pathogen [30]. Several proteins involved in the effector-triggered immunity (ETI)-triggered programmed cell death (PCD) were all upregulated at 96 hpi, including phytophthora-inhibited protease 1 (PIP1; Solyc02g077040) with a 3.0-fold change, hypersensitive-induced response protein (HIR; Solyc06g071050) with 1.61-fold change and response to desiccation 21a (RD21a; Solyc04g078540) with 1.66-fold change. PIP1 is a tomato apoplastic cysteine protease that triggers cell death and fungal resistance [31]. The enzyme activity of PIP1 has been shown to be inhibited by an effector EPIC2B produced from P. infestans [32]. The function of HIR protein is associated with HR and cell death, positively contributing to the inhibition of hemibiotrophs [33,34]. HIR proteins have been shown to help the recognition of the Pseudomonas syringae effector AvrRpt2 by interacting with the R protein Pseudomonas syringae 2 (RPS2) via increasing the local concentration of RPS2 at plasma membrane microdomains [34]. RD21a contributes to the resistance to necrotrophic fungi in Arabidopsis and functions as a PCD-promoting protease which is released from the ER body or vacuoles to the cytoplasm [35]. This protein has also been shown to control stomata closure and its degradation by ubiquitin E3 ligase SINAT4 was recently found to be triggered by the bacterial type III effector AvrRxo1 [36].
Among all the quantified proteins, carbonic anhydrase (CA; Solyc02g067750) which is essential for various biological processes including stomatal aperture, respiration, pH regulation, and CO2 homeostasis in plants [37] was upregulated with the greatest fold change at 96 hpi (~320-fold change). This protein is involved in attenuating flg22-triggered immunity [38], and functions in the Pto:avrPto mediated-HR in plant-P. synrigae interaction [39]. The gene expression of CA was more suppressed in the compatible interaction than the incompatible interaction between P. infestans and potato (Solanum tuberosum) [40]. Silencing this plastic CA gene results in higher susceptibility to P. infestans in tobacco (Nicotiana benthamiana) than the wild type [40].
Being a more general immune regulator, enhanced disease susceptibility 1 (EDS1; Solyc06g071280) was 1.91-fold upregulated at 96 hpi. EDS1 functions as a SA regulator and key ETI mediator for several toll-interleukin-1 receptor (TIR) NB-LRR resistance proteins against virulent pathogens in different plant species [41,42,43,44,45]. This protein enhances the SA-dependent defense response against the oomycete Phytophthora parasitica [44,46]. It has been proposed that EDS1 and SA signaling pathways are operated in parallel in defense responses. The EDS1-phytoalexin deficient4 (PAD4) signaling is distinct from the known SA-compensatory route involving MAPK signaling and can regulate both SA-dependent and SA-independent gene expression sectors [47]. In contrast to proteins initiating the ETI-triggered PCD, Kunitz-type protease inhibitor (KTI; Solyc03g098730) which antagonizes the pathogen-associated PCD [48] was 1.91-fold upregulated at 96 hpi of P. infestans. The expression of KTI is induced by SA and some PCD-eliciting toxins from necrotrophic fungi [48] and knocking out the KTI gene causes more H2O2 accumulation in plants [49].
In summary, P. infestans regulates the PR-1 protein family for JA and SA immune signaling and defense responses at 48 and 96 hpi. After 96 h of pathogen inoculation, CA protein, which functions to suppress the PTI responses and the activation HR development, was highly induced. In the meantime, the induction of EDS1 for more general deference responses may further counteract the immune suppression of pathogen effectors. At 96 hpi, we also observed upregulated proteins that are involved in the activation of PCD by ETI. In addition, the KTI protein, which may be involved in the suppression of the H2O2 accumulation, was also induced at a late time point, suggesting a fine-tuning mechanism in this pathogenesis stage to control the H2O2 mediated HR and PCD responses.

2.6. Changes Associated with the Regulation of Phytohormones

Several proteins involved in the biosynthetic or signaling pathways of different phytohormones, including SA, ethylene (ET), and abscisic acid (ABA), were identified in our study (Table 3). Three lipoxygenases involved in JA biosynthesis were regulated in various ways at different post-inoculation time points. Tomato lipoxygenase D (LoxD; Solyc03g122340) was downregulated with a fold change of 0.65 at 24 hpi but not significantly regulated at either 48 or 96 hpi. LoxD was one of the first proteins to be identified from the JA biosynthetic pathway, and mediates defense against fungal and bacterial pathogens [50,51]. In contrast, the other two lipoxygenase proteins (Solyc01g099160 and Solyc08g029000) were upregulated with a 3.7 to 4.19-fold increase at 48 hpi or a 13.97-fold increase at 96 hpi, respectively. In addition to the proteins involved in JA biosynthesis, topless 3 (TPL3; Solyc01g100050), a transcriptional corepressor of the JA responsive genes [52], was upregulated by 1.76-fold at 96 hpi. It has been speculated that TPL protein is involved in multiple pathways and interacts with numerous transcriptional repressors [53]. Notably, the repression of JA responses by TPL3 is dependent on its interaction with another repressor, Novel Interactor of JAZ (NINJA). TPL3 and NINJA are recruited together by the jasmonate ZIM domain (JAZ) protein to inhibit the expression of the early JA-responsive genes [52]. The transcriptional regulation by TPL and family members has been shown to be a crucial part of the immune signaling for defense against both biotrophic oomycetes and necrotrophic fungus [54]. 1-aminocyclopropane-1-carboxylate (ACC) oxidase (ACO1; Solyc07g049530), functioning as the rate-limiting enzyme of the ET biosynthesis, was upregulated by P. infestans at 48 and 96 hpi with 1.84 and 4.88-fold increases, respectively. CobN/magnesium chelatase (CHLH/ABAR; Solyc04g015750) was upregulated in abundance by 1.55-fold at 24 hpi, but downregulated with a fold change of 0.42 at 96 hpi. CHLH/ABAR is involved in the plastid-to-nucleus retrograde signaling for chlorophyll development, and stomatal response to ABA, interacting with a group of WRKY transcription factors such as WRKY40 thus attenuating their negative regulation on ABA-responsive genes [55,56,57].
Taken together, repression of the biosynthetic pathway of JA and enhancement of the ABA signaling pathway were observed at 24 hpi with P. infestans. The repression of JA production may facilitate the activation of SA-related responses to defeat the biotrophic infection of P. infestans. This JA repression may facilitate P. infestans transition from biotroph to necrotroph. The enhanced ABA signaling may benefit P. infestans infection at the early time point as ABA induces disease susceptibility to various biotrophic or necrotrophic pathogens in a wide range of plant species [58]. P. infestans also suppressed the JA responsive genes at the later time point of 96 hpi, while plants may increase the level of JA and ET from 48 hpi to 96 hpi as well as downregulate ABA signaling at 96 hpi. Since the activation of JA and ET production is involved in the enhanced plant resistance against necrotrophic pathogens [6]; these results suggest that plants try to trigger the pathogen resistance from the biotrophic to necrotrophic pathogenesis stage via adjusting the signaling and/or biosynthesis of JA, ET, and ABA.

2.7. Changes Associated with Reactive Oxygen Species and Oxidation–Reduction Reactions

In this study, we found that 25 proteins involved with reactive oxygen species (ROS) or redox function were differentially regulated in response to P. infestans pathogenesis (Table 4 and Table S1). The NADPH/respiratory burst oxidase protein D (RbohD) homolog, whitefly-induced p91-phox (GP91phox, Solyc03g117980) protein was upregulated at 48 and 96 hpi by 1.70 and 5.08-fold, respectively. The plant NADPH oxidase RbohD is a primary player responsible for the ROS burst after the pathogen-associated molecular pattern (PAMP) perception and thus regulates the HR in and around the infection site [59]. Twelve enzymes working as ROS scavengers were up- or downregulated in this study, including 9 proteins with peroxidase (POX) enzyme activities (Solyc08g069040, Solyc04g073990, Solyc01g006300, Solyc10g076240, Solyc04g071900, Solyc02g079500, Solyc02g092580, Solyc04g071890, and Solyc03g006700). Among them, only one POX (Solyc08g069040) had downregulation at 48 hpi with a fold change of 0.56 while the rest were upregulated at 96 hpi with a fold change from 1.61 to 13.28. The other ROS scavenger enzymes regulated at 96 hpi were catalase (CAT; Solyc04g082460) with a fold-change of 0.56, superoxide dismutase 1 (CSD1; Solyc01g067740) with a 2.16-fold increase, and glutathione peroxidase-like encoding 1 (GPX-1; Solyc08g080940) with a 1.94-fold increase. In addition, another protein in the antioxidant redoxin family, thioredoxin (TRX; Solyc04g081970), was downregulated with a fold change of 0.47 at 96 hpi. Thioredoxin reductase (TRXR; Solyc02g082250) for catalyzing the reduction of TRX was upregulated by 1.52-fold. Another protein predicted to be involved in TRX regulation, CBS domain-containing protein-like (CDCP-like; Solyc01g107860) was 2.10-fold upregulated at 96 hpi. Seven proteins participating in the regulation of the homeostasis of the antioxidant glutathione (GSH) showed different patterns of regulation across the pathogen growth stages. Among them, four glutathione S-transferases (GST) or GST-like proteins (Solyc06g009020, Solyc08g080900, Solyc10g084400, and Solyc09g011590) for conjugation of the reduced form of GST to the xenobiotic substrate were increased at 96 hpi by 1.58 to 7.42-fold while two GSTs (Solyc06g083770 and Solyc02g081430) were downregulated with a fold change of 0.41 and 0.58, respectively. On the other hand, gamma-glutamylcyclotransferase (GGCG; Solyc11g012910) which is responsible for the degradation of GSH in the cytosol [60] was downregulated with a fold change of 0.68 and 0.33 at 24 hpi and 96 hpi, respectively.
In summary, of all the proteins involved in the ROS/redox homeostasis regulation, the majority of the increase in ROS burst likely occurs from 48 to 96 hpi. P. infestans-inoculated tomato plants also showed upregulated antioxidants and ROS scavenger enzymes at 96 hpi. The enhancement of GST proteins may be correlated with the detoxification of the effectors produced by the pathogen and the suppression of the GSH catabolic proteins may help increase the antioxidant and GST capabilities in the cytosol. During the necrotrophic pathogenesis stage, the specifically downregulated CAT, POX, or TRX could be host targets manipulated by the pathogen to favor its own growth.

2.8. Differentially Regulated Proteins Involved in Carbohydrate and Energy Metabolism

Proteins that are involved in carbohydrate and energy metabolism were significantly upregulated at 96 hpi (Table 5 and Table S1). Proteins participating in the glycolysis pathways, including ATP-dependent 6-phosphofructokinase (PFK; Solyc07g045160), glyceraldehyde-3-phosphate dehydrogenase (GAPDH; Solyc10g005510), and pyruvate dehydrogenase (PDH; Solyc03g097680) were all significantly upregulated at 96 hpi by 2.07 to 2.38 fold. In contrast, enolase (ENO1; Solyc03g114500) was increased earlier, at 24 hpi, with a fold change of 1.52. This enzyme catalyzes the generation of the immediate precursor of pyruvate in the glycolytic pathway and a branch point to the shikimic acid pathway. Three proteins that are involved in the pentose phosphate pathway (PPP) for producing NAPDH, transaldolase (TAL; Solyc11g033288), ribose 5-phosphate isomerase A (Rpi; Solyc05g008370), and 6-phosphogluconate dehydrogenase (6PGD; Solyc04g005160) were upregulated at 96 hpi by 1.59 to 3.70-fold. Proteins participating in fatty acid/lipid metabolism, acyl-CoA dehydrogenase (ACAD; Solyc10g076600) and enoyl-CoA hydratases (ECH; Solyc01g059830 and Solyc12g094450), were upregulated at 96 hpi with fold changes between 1.68 and 4.24. Seven proteins that function in the TCA cycle, pyruvate dehydrogenase complex (PDC; Solyc11g007720), malic enzyme (ME; Solyc08g066360), citrate synthase (CSY; Solyc01g073740), aconitases (ACO; Solyc07g052350 and Solyc12g005860), isocitrate dehydrogenase (IDH; Solyc01g005560), oxoglutarate dehydrogenase complexes (ODC; Solyc07g064800 and Solyc12g005080), succinyl-CoA ligases (SCoAL; Solyc06g083790 and Solyc01g007910) and fumarase (FUM; Solyc09g075450), were all upregulated at 96 hpi with a fold change ranging from 1.52 to 2.00. In contrast, all the proteins involved in carbon fixation and photosynthesis progress (Table 6 and Table S1), such as chlorophyll a-b binding protein (LHCB; Solyc06g063370), cytochrome b6-f complex iron-sulfur subunit (Solyc12g005630), photosystem I (PSI) P700 chlorophyll a apoprotein (Solyc06g009940), PSI reaction center subunit III (Solyc02g069450), PSI reaction center subunit N (Solyc08g013670), PSII 22 kDa protein (Solyc06g060340) and sedoheptulose-1,7-bisphosphatase (SBPase; Solyc05g052600), were downregulated at 96 hpi with fold changes between 0.54 and 0.66.
The upregulation of PFK, GAPDH, ENO1, and PDH for glycolysis together with ACAD and ECH in the fatty acid and lipid metabolisms may enhance the synthesis of acetyl-CoA for feeding the TCA cycle. TAL, Rpi, and 6PGD that function in the PPP were enhanced, and thus were likely to produce more NADPH and ribose 5-phosphate (R5P) for the alternative progress of glycolysis. The proteins involved in the TCA cycle to generate more NADH and FADH2 were also significantly upregulated. The increase of NAPDH by these pathways may be related to the enhancement of the oxidative phosphorylation pathway in order to generate more energy. These results suggest that plants may attempt to generate more ATP by the glycolysis/TCA/PPP and oxidative pathways during the pathogenesis process. The carbohydrate metabolites produced from the glycolysis and fatty acid biosynthetic pathways may also be used as the signals for the activation of defense responses [61]. In contrast, proteins participating in photosynthesis and energy storage were downregulated in this process, suggesting a switch in the primary metabolisms wherein carbon is obtained from the sink tissue, rather than the source.

2.9. Changes Associated with Secondary Metabolites

Three of the proteins involved in the secondary metabolite biosynthesis pathway were upregulated at 96 hpi (Table 7 and Table S1). Two proteins involved in the phenylpropanoid biosynthetic pathway, cinnamate 4-hydroxylase (C4H; Solyc06g150137) and 4-coumarate:CoA ligase (4CL; Solyc03g117870) were increased by 2.62- and 4.90-fold at 96 hpi, respectively. In addition, 5-enolpyruvylshikimate-3-phosphate synthase (ESPS; Solyc01g091190), which is involved in the synthesis of phenylalanine starting the phenylpropanoid pathway, was increased by 2.24-fold at 96 hpi.
We further observed that P. infestans induced the proteins responsible for the synthesis of the upstream and intermediate metabolites of the phenylpropanoid pathway during the necrotrophic pathogenesis stage. These upregulated proteins may enhance the level of phenylpropanoids in plants to fight against pathogens [62]. Furthermore, lignin, suberin, or flavonoids which are derived from this pathway also contribute to the basal immunity response of the plant [63].

2.10. Novel P. infestans-Regulated Tomato Reponses Revealed by Time-Lapse Proteomics Studies

To date, only a limited number of studies have focused on the tomato proteome in response to P. infestans. A previous proteomics study discovered a total of 56 tomato proteins regulated by P. infestans infection, of which 39 and 17 were found in the resistant and susceptible tomato genotype, respectively [15]. In the resistant tomato genotype, six proteins associated with immune and defense mechanisms were observed with enhanced abundance after pathogen inoculation, which is comprised of three peroxiredoxins, one PR protein, carboxypeptidase, and predicted R protein. Two proteinase inhibitors and a glucosidase were observed to have suppressed abundance in the resistant tomato genotype. In the susceptible genotype, among the stress and defense-related proteins, one enzyme participating in the urea cycle and metabolism of amino groups was suppressed whereas one ROS scavenger enzyme and one glucosidase were both enhanced at the protein level after infection. Compared to the previous proteomics study, we identified 25-fold more tomato proteins regulated by this pathogen; thus most of the P. infestans-regulated mechanisms were first identified and dynamically quantified at the protein level. To the best of our knowledge, this study provides the most comprehensive proteome information available to date, revealing the dynamics of tomato proteome regulation at the defined key stages of P. infestans infection. With regard to the dynamics of tomato defense responses, we discovered that PR-5 protein was downregulated at the biotrophic stage, and multiple chitinases were induced to conduct the defense activity by degrading the pathogen cell wall in the necrotrophic stage. In addition, tomato proteins for direct antipathogen activity, biosynthesis and signaling of immune regulatory hormones, ETI responses, and biosynthesis of the secondary metabolites were also exclusively determined to be regulated by P. infestans infection in this study.
Although the response to P. infestans has been previously analyzed in tomato in well-defined stages of pathogenesis using a RNA-Seq-based transcriptomics approach [11], this study lacks a mock-treated sample as a control at each time point; this may lead to identifying non-pathogenetic responses. In addition, the regulation at the protein level also requires investigation to further clarify the roles of these gene candidates. With the mock-treated sample as the control at each time point, many of the P. infestans-responsive genes identified in the previous RNA-Seq analysis were statistically proved to be regulated at the protein level in this study. However, it is well-known that gene expression is not always proportional to protein expression, and accordingly we discovered there were some proteins differentially regulated by P. infestans infection that were reported differently in the previous transcriptomic study. Among them, nine proteins identified in this study were either not identified (C4H), not significantly expressed (TPL3), or showed opposite regulation patterns at the transcript level (PR-5, RD21a, EDS1, HIR, PIP1, CHLH/ABAR, and ENO1). These proteins have molecular functions in direct antifungal activity (PR-5), cysteine protease (RD21a and PIP1), R protein helper inducing HR (HIR), SA/ETI-mediator required for basal and NB-LRR protein-induced resistance (EDS1), JA/ET signaling (TPL3), ABA signaling (CHLH/ABAR), glycolysis (ENO1), and the phenylpropanoid biosynthetic pathway (C4H). For these selected proteins, their gene expressions were analyzed by qRT-PCR in the same biological samples used in this proteomics study (Figure 4).
Among those nine proteins, three proteins, RD21a, HIR, and C4H showed positively correlated regulations between the transcript and protein levels. Four proteins, PR-5, EDS1, PIP1, and ENO1 showed similar trends of direction in gene and protein regulation. In the case of PIP1, differential expression at the protein level was observed at a later time point (96 hpi) than the transcript level (24 and 48 hpi). There could be more variation in the expression of these four genes; thus the changes of transcript levels during the pathogen infection did not reject the null hypothesis in the significant test. The higher variation in transcript regulation than protein regulation might also explain the non-correlation of results in our proteome analysis and the previous RNA-Seq analysis. As the previous transcriptomic analysis only used one biological replicate, the actual changes in the transcript levels after pathogen infection may not be accurately presented. The non-correlation of the results of the transcriptome and proteome analysis could be due to the biosynthesis activity and stability of RNA and protein under differential regulation [64]. We found that two proteins TPL3 and CHLH/ABAR showed opposite directions of transcriptional and translational/post-translational regulation after pathogen infection. This opposite regulation trend could result from multiple factors beyond the transcript concentration, which influence the establishment of the protein expression level. These factors could include the modulation of translation rate by mechanisms like regulator elements/miRNA and constraints of machinery/resources for protein biosynthesis, the modulation of protein half-life by the ubiquitin-proteasome or autophagy pathway, the temporal delay in protein synthesis, and the protein export resulting in spatial changes of proteins [65].
When examining how these proteins and their gene levels were regulated in the three pathogenesis phases, we found that although PR-5 protein was downregulated at 24 hpi, its gene expression level was not significantly changed. In addition, at this early stage, although ENO1 and CHLH/ABAR protein levels were increased, their coding genes appear to be non-differentially expressed. On the other hand, the protein levels of neither PIP1 nor TPL3 were regulated although the transcript levels of PIP1 and TPL3 were enhanced and suppressed at 24 hpi, respectively. Later at 48 hpi, the transcript levels of PIP1 gene showed upregulation, TPL3 and CHLH/ABAR genes showed downregulation whereas none of their protein levels was significantly altered from the mock-treated group. At 96 hpi, EDS1 and TPL3 were both upregulated, and CHLH/ABAR protein was downregulated but neither of their gene expressions was differentially regulated. On the other hand, RD21a, HIR, C4H, and PIPI1 were regulated at both the transcript and protein levels at 96 hpi.
Since TPL3 functions as the transcription corepressor of JA-responsive genes, the reduction of TPL3 protein level may lead to the activation of JA signaling, which may suppress the production of SA-mediated immune responses. In this study, the suppression of TPL3 gene expression may be part of the infection strategy of P. infestans, which deactivates the SA-mediated immunity to establish a biotrophic interaction with the host plant at the early infection stage. However, the suppressed TPL3 transcript did not result in suppression of the protein level, possibly due to the translational activity or protein stability being enhanced to compensate for the repression of TPL3 gene. This may facilitate plants to activate the SA signaling to fight against the biotrophic pathogen. In addition, PR-5 protein, which could directly sabotage the pathogen cell wall assembly, may be suppressed by P. infestans specifically at the protein level but not at the transcript level. Also, the increased PIP1 gene expression did not result in significant protein abundance change in the biotrophic phase. The PIP protease activity has been reported to be a target of P. infestans effectors; therefore, this inhibition may cause PIP1 protein to become more unstable, thus generating a lower induction fold at the level of PIP1 protein in comparison with its transcript. Another possible defense strategy may include CHLH/ABAR protein for its role of controlling stomatal closure [66] and relieving the expression of ABA-responsive genes [57], hence the increased CHLH/ABAR protein in the biotrophic phase may represent an early PTI response. On the other hand, since ENO1 is a glycolytic enzyme, the upregulated ENO1 protein could be interpreted as one of the plant early responses to gain more energy or as a pathogen strategy to obtain more carbohydrate nutrients during the biotrophic phase. This translational/post-translational but not transcriptional regulation of ENO1 indicates an urgent response to facilitate the glycolysis pathway.
In the transition phase, the suppressed TPL3 transcript and enhanced PIP1 transcript without significant changes in protein levels suggest the continuous action of the pathogen in repressing these immune regulators from the early biotrophic phase. In the meantime, the plant may still try to enhance its immune responses by activating the transcriptional or translational regulation of these genes. In addition to controlling stomatal closure, CHLH/ABAR also influences ABA sensitivity [66,67,68,69,70] and contributes to chloroplast development [71]. Therefore, the suppressed expression of the CHLH/ABAR gene without the protein abundance being regulated in the transition phase suggests P. infestans may have started to hijack the ABA signaling pathway and disrupt plant growth to prepare itself to initiate necrosis, as well as inhibit stomatal closure, for the next pathogenesis stage.
Although the gene expression of TPL3 was repressed from the early to the late pathogenesis stages, TPL3 protein was significantly upregulated in the necrotrophic phase. This regulation of TPL3 protein level was able to suppress the JA-responsive genes, which is favorable for P. infestans to facilitate the necrotrophic lifestyle. The downregulated CHLH/ABAR protein level but not the transcript level in the necrotrophic phase may reflect a delay effect from the transcriptional regulation in the transition phase. In view of the function of CHLH/ABAR as mentioned above, in the necrotrophic phase, this filamentous pathogen may downregulate CHLH/ABAR protein level to inhibit the stomatal closure to help the new sporangiophore emerge from the stomata and produce sporangia which are spread by wind or water to infect new plants [72]. As PIP1 and RD21a are both proteases for triggering PCD, their upregulated transcription and protein levels in the necrotrophic phase may have different causes: (1) a delay in protein translation production, as there is a time delay from transcriptional induction to protein level increase following an induced state change; (2) the plant eliminating the suppression from pathogen effectors which target these defense proteins starting in the early infection stage; (3) the pathogen acting to induce necrosis by secreting various cell-death inducing effector proteins to thrive on dead host tissues [73]. As both EDS1 and HIR contribute to the R protein (especially NB-LRR)-induced immunity, the upregulated EDS1 and HIR proteins in response to the necrotrophic phase of P. infestans suggests a plant action to increase the local concentration of NB-LRR proteins, and possibly other R proteins to enhance the detection sensitivity of pathogen effectors.

3. Materials and Methods

3.1. Plant Material, Growth Conditions and P. infestans Inoculation

Tomato seeds (Solanum lycopersicum cv CL5915, originally provided by AVRDC—The World Vegetable Center, Tainan, Taiwan) were planted in soil and grown in a growth chamber for 5 weeks under a 12 h/12 h light-dark cycle, with 50%/70% (light/dark) humidity, 25 °C/20 °C (light/dark) temperature and a light source providing photosynthetic photon flux density (PPFD) of 100 µmole/m2∙s. Fully expanded leaflets with similar size from the 3rd or 4th pair of true leaves were collected for the following experiment. Three leaflets from three individual plants were pooled as one biological replicate at each time point for the pathogenicity assays. P. infestans strain was sub-cultured every two weeks and grown on fresh Rye A agar plates [74] in the forever dark incubator at 20 °C for 2–3 weeks before collecting sporangia. By using a cell spreader, sporangia were washed in sterilized distilled water, and after counting under the optical microscope at a magnification of 200X, the concentration was adjusted to 2.0 × 10⁴ sporangia per ml for inoculations. One leaflet from each pair was separately placed in the mock- or pathogen-inoculated group and placed on the distilled water-saturated tissue paper in square Petri dishes before inoculation. The abaxial surface of a tomato leaf was inoculated with 8 droplets of 20 µL sporangial suspension. The mock-treated groups had the same treatment except that the sporangial suspension was replaced with distilled water. After treatment, the dishes containing the leaflets were sealed with Parafilm and incubated in the dark at 20 °C. Samples were collected at 6, 16, and 24 hpi for microscope observation, 24, 48, and 96 hpi for RNA and protein extraction and 24, 48, 96, and 120 hpi for disease phenotype observation.

3.2. Observation of P. infestans Growth by Trypan Blue Staining and Microscope

To visualize the P. infestans infection at the early time points, leaves at 6, 16 or 24 hpi were transferred to a beaker and immersed in trypan blue solution (10 g phenol, 10 mL glycerol, 10 mL lactic acid, 10 mL water and 10 mg of trypan blue) diluted with 2-fold of ethanol [75]. The beaker was then heated in boiled water until the staining solution boiled for about 2 min and the leaves turned color to light blue. After being placed at room temperature for about 8 h for complete dyeing, the leaves were destained by replacing the staining buffer with chloral hydrate solution (5 g of chloral hydrate dissolved into 2 mL of distilled water) and shaken at a slow speed of 30 rpm for 24 h [76]. Lastly, the leaf samples were observed under a Zeiss AxioImager Z1 high-performance research microscope (Carl Zeiss AG, Werk Göttingen, Germany) with differential interference contrast optics.

3.3. RNA Extraction and Marker Gene Expression Analysis of P. infestans-Inoculated Tomato Leaf

Total RNA was extracted from each sample by using the Total RNA Mini Kit Plant (Geneaid, New Taipei City, Taiwan), according to the manufacturer’s protocol. RNA was quantified by using Nanodrop ND-1000 (NanoDrop Technologies/Thermo Scientific, Wilmington, DE, USA), and 4 µg of total RNA was employed for cDNA synthesis in a 20-μL volume by using SuperScript™ III Reverse Transcriptase (Thermo Scientific, Bellefonte, PA, USA), following to the manufacturer’s protocol. PCR was carried out with 20 ng of the cDNA in a 20-μL volume containing 2 μM of each specific primer (Supplemental Table S3) and 2X SuperRed PCR Master Mix (Biotools, New Taipei City, Taiwan), following the manufacturer’s protocol.
For RT-PCR analysis, the PCR condition consisted of one cycle of 95 °C for 5 min, followed by 35 cycles of a three-step loop (94 °C for 1 min, 55 °C for 1 min and 72 °C for 1 min) and a final step of 72 °C for 5 min. After gel electrophoresis, the relative intensities of the product bands were assessed using ImageJ software [77]. The relative intensities of gel bands were calculated by the band with the maximal intensity as the value of 1.
The qRT-PCR was used to validate the expression of specific tomato genes. Three biological replicates were used for qRT-PCR analysis, which was performed using SYBR Green reagent (Sigma-Aldrich) and ABI 7500 Fast Real Time PCR system (ThermoFisher Scientific, Inc.). The PCR cycling steps were 50 °C for 2 min and 94 °C for 10 min for the initial steps followed by 95 °C for 15 s and 60 °C for 1 min for 40 cycles. The gene expressions across different samples were normalized with the internal control Ubi3. The primers used are listed in Supplemental Table S4. The melting curve was used to verify the specificity of the PCR product.

3.4. Sample Preparation for Proteome Analysis

Three biological replicates of mock-treated (24, 48, 96 hpt) and P. infestans inoculated (24, 48, 96 hpi) leaves were prepared for the proteomics experiments. For each sample, leaves were ground into powder in a chilled pestle and mortar with liquid N2 then 0.2 g of the powder was collected. The protein extraction protocol was modified from previous studies [78,79,80]. The sample was then homogenized with 0.9 mL of ice-cold pH 8.0 homogenization buffer (0.5 M Tris-HCl, pH 7.5; 0.7 M sucrose; 0.1 M KCl; 50 mM EDTA; 1% polyvinylpolypyrrolidone (PVPP); 5 mM dithiothreitol, 1 mM phenylmethylsulfonyl fluoride and 1× Roche protease inhibitor cocktail) by vortexing for at least 3 min or until completely homogenized. The sample was further incubated in the buffer by Intelli Mixer RM-2L (ELMI Ltd., Riga, Latvia) in the cold room for 30 min. The homogenate was filtered through two layers of Mira cloth. After collecting the supernatant of the filtrate by centrifugation at 16,000× g for 10 min under 4 °C, an equal volume of phenol (pH 7.8–8.0, Tris-buffered) was added to the supernatant and homogenized by Intelli Mixer RM-2L for 30 min at 4 °C. The upper phenol phase was collected after the solution was centrifuged at 16,000× g for 20 min then the back-extraction was performed one more time using an equal volume of phenol. Proteins were precipitated from the final collected phenol phase by mixing with a 5-fold volume of cold 0.1 M ammonium acetate/methanol and incubating at −20 °C overnight. The precipitated proteins were washed once with 0.1 M ammonium acetate/methanol and twice with 80% acetone/10 mM DTT. The air-dried protein pellet was then solubilized in 8 M urea with 50 mM ammonium bicarbonate (ABC) and 5 mM tris (2-carboxyethyl) phosphine hydrochloride (TCEP). The extracted total protein concentration of each sample was measured by the Bradford assay and checked by SDS-PAGE.
For each sample, 100 μg of the solubilized tomato total protein was reduced, alkylated and proteolyzed with lysyl endopeptidase and trypsin following the steps previously described [81]. The digested sample was then desalted using the 100-mg tC18 SepPak cartridge (Waters Corporation, Milford, MA, USA). After being quantified using the Peirce BCA assay kit (Thermo Fisher Scientific, Waltham, MA, USA), the tryptic peptides from the individual sample were dissolved by deionized water containing 2% acetonitrile and 0.1% (v/v) formic acid to a concentration of 500 ng/μL. The pooled peptide sample of the mock and P. infestans-inoculated samples at each time point (as QC sample) was analyzed by LC-MS/MS with the DDA mode in order to construct the DIA spectral library. For the purpose of retention time calibration, the iRT-standard peptides (Biognosys, Schlieren, Switzerland) were mixed with the pooled sample or each individual sample with a ratio of 1:10 by volume.

3.5. Liquid Chromatography-Mass Spectrometry Analysis

The nanoLC−MS/MS was equipped with a self-packed tunnel-frit [82] analytical column (ID 75 μm × 50 cm length) packed with ReproSil-Pur 120A C18-AQ 1.9 μm (Dr. Maisch GmbH, Germany) at 40 °C on a nanoACQUITY UPLC System (Waters Corporation, Milford, MA, USA) connected to a Q Exactive HF Hybrid Quadrupole-Orbitrap mass spectrometer (Thermo Scientific, Bellefonte, PA, USA). The peptides were separated by a 135-min gradient using the mobile phases, including Solvent A (0.1% (v/v) formic acid) and Solvent B (acetonitrile with 0.1% formic acid). With a flow rate of 250 nl/min, the gradient started with a 40 min equilibration maintained at 2% of B and set as the following segments: 2% to 8% of B in 8 min, 8% to 25% of B in 90 min, then 25% to 48% of B in 5 min, 48% to 80% of B in another 5 min followed by 80% of B wash 10 min and the last equilibrium to 2% B in the last 15 min.
The instrumentation and parameters for DDA and DIA analysis followed previous studies using the Q Exactive HF Hybrid Quadrupole-Orbitrap mass spectrometer [83,84]. Two micrograms of the pooled and individual tryptic peptide samples were analyzed by DDA and DIA mode, respectively. For DDA analysis, the MS instrument was operated in the positive ion mode and two different DDA methods at the MS2 level. In the first DDA method, full-MS was acquired with high resolution (R = 60,000 at m/z 200 at an automatic gain control target of 3.0 × 10⁶) and broadband mass spectra (m/z 350–1650 Da) with a maximum IT of 15 ms, and MS/MS events (R = 15,000 at an automatic gain control target of 1.0 × 10⁵) with a dd-MS² IT of 45 ms when a precursor ion charge was 2+, 3+, 4+ and 5+ and minimum AGC target as 4.5 × 10³, isolation window was set to 1.2 Th, was detected. The 20 most abundant peptide molecular ions, dynamically determined from the MS1 scan, were selected for MS/MS using stepped normalized collision energies (NCE) as 26.5%, 28%, and 29.5%, with the MS/MS settings of dynamic exclusion as 25 s, peptide matched as preferred, isotopes excluded and apex triggered. The other DDA method was using gas-phase separation with the m/z range of 350–510, 500–710, 700–1060 and 1040-1650 Th and fixed NCE as 28%; the rest of settings were the same as the first DDA method.
For DIA analysis, MS/MS proteome profiling was analyzed by the same LC−MS/MS system. The instrument was operated in the positive ion mode and configured to collect high resolution (R = 120,000 at m/z 200 at an automatic gain control target of 3.0 × 10⁶) broadband mass spectra (m/z 350–1650 Da) with a maximum IT of 60 ms, and MS/MS events (R = 30,000 at an automatic gain control target of 3.0 × 10⁶) with an auto MS² IT, isolation window was set to 52.0 m/z, fixed first mass was set to 200 m/z. The 25 segments were selected for MS/MS using a higher energy collisional dissociation (HCD) energy of 28%. The acquisition window covered a mass range from 350 to 1650 m/z through 25 consecutive isolation windows. In each set of DDA or DIA data, the iRT calibration was required with a minimum R2 of 0.9 by a manual check. During the DIA LC-MS/MS runs across the sequence of the instrument in the study, the coefficient of variation (CV) of iRT peptide retention time was monitored to be less than 3% and the CV of iRT peptide peak intensity to be less than 20% in the QC samples run in-between the DIA analysis of each sample.

3.6. MS Data Analysis

With all the DDA data, Mascot (ver. 2.3, http://www.matrixscience.com/, accessed on 10 April 2021) and X!Tandem (ver. 2013.06.15.1) [85] were used to do a protein database search against a combined database of Solanum lycopersicum proteome (ver. 4.1 accessed 16 July 2020; downloaded from the website ftp://ftp.solgenomics.net/tomato_genome/annotation/ITAG4.1_release; 34688 entries; the reverse sequences generated as the decoy database), P. infestans proteome (released in April 2020; accessed 17 August 2020; downloaded from the NCBI website ftp://ftp.ncbi.nlm.nih.gov/genomes/genbank/protozoa/Phytophthora_infestans/latest_assembly_versions/GCA_012295175.1_ASM1229517v1, accessed on 10 April 2021; 20172 entries; the reverse sequences generated as the decoy database), sequences of PR-1b protein (Solyc00g174340) which is missing from the ITAG 4.1 database, the iRT standard peptides and BSA (SwissProt Accession: P02769). Search parameters were set as follows: MS tolerance, 10 ppm; precursor monoisotopic mass isotope (M + 1), included; the number of trypsin missed cleavage, 2; fragment mass tolerance, 0.1 Da; enzyme, trypsin/P; fixed modifications, carbamidomethyl cysteine (+57.021 Da); variable modifications, oxidized methionine (+15.995 Da) and acetyl protein N-terminus (+42.016 Da). Next, the search identifications from different search engines and different repeats were combined and statistically scored using PeptideProphet [86] and iProphet [87] within the Trans-Proteomic Pipeline (TPP, ver. 5.2) [88]. MAYU [89] was used to select an iProphet cutoff of 0.913764, resulting in a protein FDR of 1%. SpectraST [90] was used in library generation mode with HCD settings. In the constructed spectral library, there were a total of 65,763 transitions, 53,085 peptides and 11,563 proteins. OpenMS (ver. 2.5) [91] was utilized for decoyed spectral library construction with the workflow adapted from the previously published research [92]. To be included in the final spectral library, product ions were required to contain a minimum of seven amino acids in peptide length and only the best six product ions were selected for each peptide.
The DIA data were analyzed using OpenSWATH (ver. 2.4.0) [93] software against the constructed spectral libraries to identify and quantify peptides and proteins. The retention time alignment used the information of iRT transitions (RT tolerance was set as 7 min for DIA data). In addition to the chromatogram alignment, the spike-in iRT peptide standards were also used for the quality control of the DDA and DIA analyses. Parameters used for feature alignment were set as follows: peptide false-discovery rate (FDR), 0.05; protein FDR, 0.01; alignment method, Local MST; re-alignment method, lowest; retention time (RT) difference, 30 s; alignment score, 0.05. The ratios of protein quantitation between the P. infestans-inoculated and mock-treated samples in each replicate were normalized by the most-likely ration normalization principle as previously applied in a DIA study [94]. The mass spectrometry proteomics data have been deposited to the ProteomeXchange Consortium via the PRIDE [95] partner repository with the dataset identifier PXD022266.

3.7. Quantitation Data Analysis

Peptide quantity was exported from the analysis result from OpenSWATH using the measurement by the sum of six best precursors and the peptide ratio was calculated by the peptide quantity of the P. infestans-inoculated and mock sample. The protein quantity ratio was calculated by the weighted geometric mean of the unique and/or shared peptide ratios using the peptide quantity as the weighting factor. The criteria for selecting unique and shared peptides for protein or protein group quantification were as follows: (1) if a protein is identified with unique and shared peptides, only the unique peptides will be used; (2) if more than 2 proteins are grouped based on shared identified peptides, both unique and shared peptides will be used as this protein group quantity and any protein without unique peptide identified in this group will be listed in the subset; and (3) if more than 2 proteins are grouped but no unique peptide is identified, then all the shared peptides will be used as this protein group quantity. As the mock and pathogen inoculated detached leaves were collected from paired leaflets of the same plant and samples of three individual plants were pooled in each condition, the initial abundances of proteins (if without treatment) for all conditions at the same growth stage were considered as identical. Thus, a paired Student’s t-test (one sample, null hypothesis, no change, mean μ = 0) was performed to uncover differential expression between control and P. infestans-inoculated sample for the same growth stage of plants. The t-test was performed based on the protein log2 ratios of the P. infestans- and mock-inoculated sample from three biological replicates. Proteins with a log2 fold-change of higher than 0.58 or lower than -0.58 and a p-value of less than 0.05 were considered as significant up- or downregulated proteins. The candidate proteins were searched against the Arabidopsis thaliana genome assembly TAIR10 from The Arabidopsis Information Resource (TAIR) database (http://arabidopsis.org) using Protein Basic Local Alignment Search Tool (BLASTP) with E-value < 1.0 × 10⁻⁵ (https://blast.ncbi.nlm.nih.gov/Blast.cgi; ver. 2.7.1, accessed on 18 December 2018) first, and these Arabidopsis homologs were then submitted to the web-based platform of the Database for Annotation, Visualization and Integrated Discovery (DAVID; http://david.abcc.ncifcrf.gov, v6.8, accessed on 10 April 2021) for Gene Ontology (GO) enrichment and function analysis.

4. Conclusions

In this study, we investigated the dynamics of the tomato proteome regulation under P. infestans biotrophic, biotrophic-necrotrophic transition, and necrotrophic infection stages using a DIA-based quantitative proteomics approach. By constructing a tomato peptide spectral library containing over 11,000 tomato proteins using 2D-LC-MS/MS, a total of 6631 tomato proteins were identified by DIA analysis. At the stage of biotrophic infection, tomato proteins involved in glycolysis, fatty acid/lipid biosynthesis, and ABA signaling were shown to be upregulated whereas proteins involved in direct defense, redox homeostasis, and JA signaling were repressed. The regulated mechanisms may help the pathogen to establish a compatible interaction with the host and obtain more nutrients from the plant cells. From the biotrophic to transition pathogenesis, proteins involved in JA/ET biosynthesis, JA/SA immune signaling, regulation of HR, and defense function were upregulated, whereas proteins involved in ROS production were suppressed. This implies that the immune responses were activated at this stage, but the ROS production may be controlled. When proceeding to the stage of necrotrophic infection, the plant proteome was dramatically affected with regard to most of the resistance-related proteins, including the ones with direct defense functions, immune regulators mediating HR and PCD, and the biosynthetic enzymes of defensive secondary metabolites, which were all upregulated. At this stage, photosynthesis and protein synthesis machinery were ubiquitously downregulated, whereas energy-generation metabolisms were increased, suggesting plants may transfer to the production of energy and regulation as a trade-off between the growth and defense response. Throughout these different pathogenesis stages, the regulation of the defensive phytohormones, including SA, JA, ET, and ABA, possibly caused a synergistic or antagonist effect, and the regulation of the ROS/redox homeostasis appeared to be dynamic during the pathogenesis progression. Several proteins with differentially regulated protein levels across different pathogenesis phases were selected to examine their gene expression levels. Among them, we found that several candidates like PR-5, ENO1, TPL3, PIP1, and CHLH/ABAR could be key targets of P. infestans to suppress the host defense/immunity via the transcriptional or translational/post-translational regulation during different infection stage.
It is worth noting that in the early infection stage, it may be essential for P. infestans to regulate the protein levels of TPL3, PR-5, and PIP1 to establish a compatible interaction. While in the later infection stages, the regulation of translation and protein stability of TPL3 may be crucial for the pathogen to establish its necrotrophic lifestyle. Hence, this study provides comprehensive information about the regulation in tomato proteome under different pathogenesis stages of P. infestans. The translational or post-translational regulation mechanisms of these proteins may also inform the development of a better strategy to control late blight disease in this crop.

Supplementary Materials

Supplementary materials can be found at https://www.mdpi.com/article/10.3390/ijms22084174/s1. Supplemental Figure S1, the expression profile of the marker genes used to clarify P. infestans pathogenesis stage. Supplemental Table S1, list of quantified tomato protein with a significant change in abundance at 24, 48, or 96 hpi of P. infestans compared to mock. Supplemental Table S2, full list of quantified proteins and peptides in three biological replicates of the infected (24, 48 and 96 hpi) and mock (24, 48 and 96 hpt) experiments. Supplemental Table S3, list of primer sequences for RT-PCR analysis of the P. infestans marker genes. Supplemental Table S4, list of primer sequences for qRT-PCR analysis of the selected tomato genes.

Author Contributions

Conceptualization, K.-T.F. and Y.-R.C.; Data curation, W.-H.C.; Funding acquisition, Y.-R.C.; Methodology, K.-T.F., Y.H., C.-H.C. and C.-F.Y.; Project administration, Y.-R.C.; Resources, Y.-R.C.; Software, W.-H.C.; Supervision, Y.-R.C.; Visualization, K.-T.F. and Y.H.; Writing—original draft, K.-T.F., Y.H. and Y.-R.C.; Writing—review & editing, K.-T.F., Y.H. and Y.-R.C. All authors have read and agreed to the published version of the manuscript.

Funding

This work was funded by Academia Sinica, Taiwan (Project ID CDA-105-L03) and the Ministry of Science and Technology, Taiwan (Project ID MOST 107-2113-M-001-006).

Institutional Review Board Statement

Not applicable.

Informed Consent Statement

Not applicable.

Data Availability Statement

The mass spectrometry proteomics data have been deposited to the ProteomeXchange Consortium via the PRIDE partner repository (http://proteomecentral.proteomexchange.org, accessed on 30 October 2020) with the dataset identifier PXD022266.

Acknowledgments

Ruey-Fen Liou at National Taiwan University provided the Phytophthora infestans strain and the culturing protocol. The mass spectrometry analysis was supported by the Academia Sinica Metabolomics Core Facility at the Agricultural Biotechnology Research Center of Academia Sinica, funded by Academia Sinica Core Facility and Innovative Instrument Project (AS-CFII-108-108). Miranda Loney at the Agricultural Biotechnology Research Center English Editing Core, Academia Sinica, provided editorial assistance.

Conflicts of Interest

The authors declare no conflict of interest. The funders had no role in the design of the study; in the collection, analyses or interpretation of data; in the writing of the manuscript or in the decision to publish the results.

Abbreviations

ABAabscisic acid
DIAdata-independent acquisition
DDAdata-dependent acquisition
ETethylene
ETIeffector-triggered immunity
ETSeffector-triggered susceptibility
HRhypersensitive response
JAjasmonic acid
LBlate blight
PAMPpathogen-associated molecular pattern
PCDprogrammed cell death
PTIPAMP-triggered immunity
ROSReactive-oxidative species
SAsalicylic acid

References

  1. Schoina, C.; Govers, F. The Oomycete Phytophthora Infestans, the Irish Potato Famine Pathogen. In Principles of Plant-Microbe Interactions; Springer: Cham, Switzerland, 2015; pp. 371–378. [Google Scholar]
  2. Nowicki, M.; Fooled, M.R.; Nowakowska, M.; Kozik, E.U. Potato and Tomato Late Blight Caused by Phytophthora Infestans: An Overview of Pathology and Resistance Breeding. Plant Dis. 2012, 96, 4–17. [Google Scholar] [CrossRef] [PubMed] [Green Version]
  3. Elsayed, A.Y.; da Silva, D.J.H.; Carneiro, P.C.S.; Mizubuti, E.S.G. The Inheritance of Late Blight Resistance Derived from Solanum Habrochaites. Crop. Breed. Appl. Biot. 2012, 12, 199–205. [Google Scholar] [CrossRef] [Green Version]
  4. Kamoun, S.; Smart, C.D. Late Blight of Potato and Tomato in the Genomics Era. Plant Dis. 2005, 89, 692–699. [Google Scholar] [CrossRef] [PubMed]
  5. Hausbeck, M.K.; Lamour, K.H. Phytophthora Capsici on Vegetable Crops: Research Progress and Management Challenges. Plant Dis. 2004, 88, 1292–1303. [Google Scholar] [CrossRef] [Green Version]
  6. Glazebrook, J. Contrasting Mechanisms of Defense against Biotrophic and Necrotrophic Pathogens. Annu. Rev. Phytopathol. 2005, 43, 205–227. [Google Scholar] [CrossRef]
  7. Panstruga, R.; Dodds, P.N. Terrific Protein Traffic: The Mystery of Effector Protein Delivery by Filamentous Plant Pathogens. Science 2009, 324, 748–750. [Google Scholar] [CrossRef] [Green Version]
  8. Koeck, M.; Hardham, A.R.; Dodds, P.N. The Role of Effectors of Biotrophic and Hemibiotrophic Fungi in Infection. Cellular Microbiol. 2011, 13, 1849–1857. [Google Scholar] [CrossRef] [Green Version]
  9. Wang, B.L.; Liu, J.; Tian, Z.D.; Song, B.T.; Xie, C.H. Monitoring the Expression Patterns of Potato Genes Associated with Quantitative Resistance to Late Blight During Phytophthora Infestans Infection Using Cdna Microarrays. Plant Sci. 2005, 169, 1155–1167. [Google Scholar] [CrossRef]
  10. Cai, G.; Restrepo, S.; Myers, K.; Zuluaga, P.; Danies, G.; Smart, C.; Fry, W. Gene Profiling in Partially Resistant and Susceptible near-Isogenic Tomatoes in Response to Late Blight in the Field. Mol. Plant Pathol. 2013, 14, 171–184. [Google Scholar] [CrossRef]
  11. Zuluaga, A.P.; Vega-Arreguin, J.C.; Fei, Z.; Matas, A.J.; Patev, S.; Fry, W.E.; Rose, J.K. Analysis of the Tomato Leaf Transcriptome During Successive Hemibiotrophic Stages of a Compatible Interaction with the Oomycete Pathogen Phytophthora Infestans. Mol. Plant Pathol. 2016, 17, 42–54. [Google Scholar] [CrossRef]
  12. Larsen, M.K.; Jorgensen, M.M.; Bennike, T.B.; Stensballe, A. Time-Course Investigation of Phytophthora Infestans Infection of Potato Leaf from Three Cultivars by Quantitative Proteomics. Data Brief. 2016, 6, 238–248. [Google Scholar] [CrossRef] [PubMed] [Green Version]
  13. Ali, A.; Alexandersson, E.; Sandin, M.; Resjo, S.; Lenman, M.; Hedley, P.; Levander, F.; Andreasson, E. Quantitative Proteomics and Transcriptomics of Potato in Response to Phytophthora Infestans in Compatible and Incompatible Interactions. BMC Genom. 2014, 15, 497. [Google Scholar] [CrossRef] [Green Version]
  14. Xiao, C.; Gao, J.; Zhang, Y.; Wang, Z.; Zhang, D.; Chen, Q.; Ye, X.; Xu, Y.; Yang, G.; Yan, L.; et al. Quantitative Proteomics of Potato Leaves Infected with Phytophthora Infestans Provides Insights into Coordinated and Altered Protein Expression During Early and Late Disease Stages. Int. J. Mol. Sci. 2019, 20, 136. [Google Scholar] [CrossRef] [Green Version]
  15. Laurindo, B.; Laurindo, R.; Fontes, P.; Vital, C.; Delazari, F.; Baracat-Pereira, M.; da Silva, D. Comparative Proteomics Reveals Set of Oxidative Stress and Thaumatin-Like Proteins Associated with Resistance to Late Blight of Tomato. Am. J. Plant Sci. 2018, 9, 789–816. [Google Scholar] [CrossRef] [Green Version]
  16. Kelley, B.S.; Lee, S.J.; Damasceno, C.M.; Chakravarthy, S.; Kim, B.D.; Martin, G.B.; Rose, J.K. A Secreted Effector Protein (Sne1) from Phytophthora Infestans Is a Broadly Acting Suppressor of Programmed Cell Death. Plant J. 2010, 62, 357–366. [Google Scholar] [CrossRef] [PubMed]
  17. van West, P.; de Jong, A.J.; Judelson, H.S.; Emons, A.M.C.; Govers, F. The Ipio Gene of Phytophthora Infestans Is Highly Expressed in Invading Hyphae During Infection. Fungal Genet. Biol. 1998, 23, 126–138. [Google Scholar] [CrossRef]
  18. Kanneganti, T.-D.; Huitema, E.; Cakir, C.; Kamoun, S. Synergistic Interactions of the Plant Cell Death Pathways Induced by Phytophthora Infestans Nep1-Like Protein Pinpp1. 1 and Inf1 Elicitin. Mol. Plant-Microbe Interact. 2006, 19, 854–863. [Google Scholar] [CrossRef] [PubMed] [Green Version]
  19. Bartnicki-Garcia, S. Cell Wall Chemistry, Morphogenesis, and Taxonomy of Fungi. Annu. Rev. Microbiol. 1968, 22, 87–108. [Google Scholar] [CrossRef]
  20. Salzman, R.A.; Koiwa, H.; Ibeas, J.I.; Pardo, J.M.; Hasegawa, P.M.; Bressan, R.A. Inorganic Cations Mediate Plant Pr5 Protein Antifungal Activity through Fungal Mnn1- and Mnn4-Regulated Cell Surface Glycans. Mol. Plant Microbe Interact. 2004, 17, 780–788. [Google Scholar] [CrossRef] [Green Version]
  21. Batalia, M.A.; Monzingo, A.F.; Ernst, S.; Roberts, W.; Robertus, J.D. The Crystal Structure of the Antifungal Protein Zeamatin, a Member of the Thaumatin-Like, PR-5 Protein Family. Nat. Struct. Biol. 1996, 3, 19–23. [Google Scholar] [CrossRef]
  22. Ali, S.; Ganai, B.A.; Kamili, A.N.; Bhat, A.A.; Mir, Z.A.; Bhat, J.A.; Tyagi, A.; Islam, S.T.; Mushtaq, M.; Yadav, P.; et al. Pathogenesis-Related Proteins and Peptides as Promising Tools for Engineering Plants with Multiple Stress Tolerance. Microbiol. Res. 2018, 212, 29–37. [Google Scholar] [CrossRef]
  23. Bantignies, B.; Seguin, J.; Muzac, I.; Dedaldechamp, F.; Gulick, P.; Ibrahim, R. Direct Evidence for Ribonucleolytic Activity of a PR-10-Like Protein from White Lupin Roots. Plant Mol. Biol. 2000, 42, 871–881. [Google Scholar] [CrossRef] [PubMed]
  24. Zhou, X.J.; Lu, S.; Xu, Y.H.; Wang, J.W.; Chen, X.Y. A Cotton Cdna (Gapr-10) Encoding a Pathogenesis-Related 10 Protein with in Vitro Ribonuclease Activity. Plant Sci. 2002, 162, 629–636. [Google Scholar] [CrossRef]
  25. Andrade, L.B.; Oliveira, A.S.; Ribeiro, J.K.; Kiyota, S.; Vasconcelos, I.M.; de Oliveira, J.T.; de Sales, M.P. Effects of a Novel Pathogenesis-Related Class 10 (PR-10) Protein from Crotalaria Pallida Roots with Papain Inhibitory Activity against Root-Knot Nematode Meloidogyne Incognita. J. Agric. Food Chem. 2010, 58, 4145–4152. [Google Scholar] [CrossRef]
  26. Guevara-Morato, M.A.; de Lacoba, M.G.; Garcia-Luque, I.; Serra, M.T. Characterization of a Pathogenesis-Related Protein 4 (PR-4) Induced in Capsicum Chinense L3 Plants with Dual Rnase and Dnase Activities. J. Exp. Bot. 2010, 61, 3259–3271. [Google Scholar] [CrossRef] [Green Version]
  27. Klarzynski, O.; Plesse, B.; Joubert, J.M.; Yvin, J.C.; Kopp, M.; Kloareg, B.; Fritig, B. Linear Beta-1,3 Glucans Are Elicitors of Defense Responses in Tobacco. Plant Physiol. 2000, 124, 1027–1038. [Google Scholar] [CrossRef] [Green Version]
  28. Chen, Y.L.; Lee, C.Y.; Cheng, K.T.; Chang, W.H.; Huang, R.N.; Nam, H.G.; Chen, Y.R. Quantitative Peptidomics Study Reveals That a Wound-Induced Peptide from PR-1 Regulates Immune Signaling in Tomato. Plant Cell 2014, 26, 4135–4148. [Google Scholar] [CrossRef] [PubMed] [Green Version]
  29. Chen, Y.L.; Fan, K.T.; Hung, S.C.; Chen, Y.R. The Role of Peptides Cleaved from Protein Precursors in Eliciting Plant Stress Reactions. New Phytol. 2020, 225, 2267–2282. [Google Scholar] [CrossRef] [PubMed]
  30. Gamir, J.; Darwiche, R.; Van’t Hof, P.; Choudhary, V.; Stumpe, M.; Schneiter, R.; Mauch, F. The Sterol-Binding Activity of Pathogenesis-Related Protein 1 Reveals the Mode of Action of an Antimicrobial Protein. Plant J. 2017, 89, 502–509. [Google Scholar] [CrossRef] [PubMed] [Green Version]
  31. Kruger, J.; Thomas, C.M.; Golstein, C.; Dixon, M.S.; Smoker, M.; Tang, S.K.; Mulder, L.; Jones, J.D.G. A Tomato Cysteine Protease Required for Cf-2-Dependent Disease Resistance and Suppression of Autonecrosis. Science 2002, 296, 744–747. [Google Scholar] [CrossRef] [Green Version]
  32. Tian, M.; Win, J.; Song, J.; van der Hoorn, R.; van der Knaap, E.; Kamoun, S. A Phytophthora Infestans Cystatin-Like Protein Targets a Novel Tomato Papain-Like Apoplastic Protease. Plant Physiol. 2007, 143, 364–377. [Google Scholar] [CrossRef] [PubMed] [Green Version]
  33. Zhou, L.; Cheung, M.-Y.; Li, M.-W.; Fu, Y.; Sun, Z.; Sun, S.-M.; Lam, H.-M. Rice Hypersensitive Induced Reaction Protein 1 (Oshir1) Associates with Plasma Membrane and Triggers Hypersensitive Cell Death. BMC Plant Biol. 2010, 10, 290. [Google Scholar] [CrossRef] [PubMed] [Green Version]
  34. Qi, Y.; Tsuda, K.; Nguyen le, V.; Wang, X.; Lin, J.; Murphy, A.S.; Glazebrook, J.; Thordal-Christensen, H.; Katagiri, F. Physical Association of Arabidopsis Hypersensitive Induced Reaction Proteins (Hirs) with the Immune Receptor Rps2. J. Biol. Chem. 2011, 286, 31297–31307. [Google Scholar] [CrossRef] [PubMed] [Green Version]
  35. Lampl, N.; Alkan, N.; Davydov, O.; Fluhr, R. Set-Point Control of Rd21 Protease Activity by Atserpin1 Controls Cell Death in Arabidopsis. Plant J. 2013, 74, 498–510. [Google Scholar] [CrossRef]
  36. Liu, Y.; Wang, K.; Cheng, Q.; Kong, D.; Zhang, X.; Wang, Z.; Wang, Q.; Xie, Q.; Yan, J.; Chu, J.; et al. Cysteine Protease Rd21a Regulated by E3 Ligase Sinat4 Is Required for Drought-Induced Resistance to Pseudomonas syringae in Arabidopsis. J. Exp. Bot. 2020, 71, 5562–5576. [Google Scholar] [CrossRef]
  37. DiMario, R.J.; Clayton, H.; Mukherjee, A.; Ludwig, M.; Moroney, J.V. Plant Carbonic Anhydrases: Structures, Locations, Evolution, and Physiological Roles. Mol. Plant 2017, 10, 30–46. [Google Scholar] [CrossRef] [Green Version]
  38. Zhou, Y.; Vroegop-Vos, I.A.; Van Dijken, A.J.H.; Van der Does, D.; Zipfel, C.; Pieterse, C.M.J.; Van Wees, S.C.M. Carbonic Anhydrases Ca1 and Ca4 Function in Atmospheric Co2-Modulated Disease Resistance. Planta 2020, 251, 75. [Google Scholar] [CrossRef] [Green Version]
  39. Slaymaker, D.H.; Navarre, D.A.; Clark, D.; del Pozo, O.; Martin, G.B.; Klessig, D.F. The Tobacco Salicylic Acid-Binding Protein 3 (Sabp3) Is the Chloroplast Carbonic Anhydrase, Which Exhibits Antioxidant Activity and Plays a Role in the Hypersensitive Defense Response. Proc. Natl. Acad. Sci. USA 2002, 99, 11640–11645. [Google Scholar] [CrossRef] [Green Version]
  40. Restrepo, S.; Myers, K.L.; del Pozo, O.; Martin, G.B.; Hart, A.L.; Buell, C.R.; Fry, W.E.; Smart, C.D. Gene Profiling of a Compatible Interaction between Phytophthora Infestans and Solanum Tuberosum Suggests a Role for Carbonic Anhydrase. Mol. Plant-Microbe Interact. 2005, 18, 913–922. [Google Scholar] [CrossRef] [Green Version]
  41. Wirthmueller, L.; Zhang, Y.; Jones, J.D.; Parker, J.E. Nuclear Accumulation of the Arabidopsis Immune Receptor Rps4 Is Necessary for Triggering Eds1-Dependent Defense. Curr. Biol. 2007, 17, 2023–2029. [Google Scholar] [CrossRef] [Green Version]
  42. Liu, Y.; Schiff, M.; Marathe, R.; Dinesh-Kumar, S.P. Tobacco Rar1, Eds1 and NPR1/Nim1 Like Genes Are Required for N-Mediated Resistance to Tobacco Mosaic Virus. Plant J. 2002, 30, 415–429. [Google Scholar] [CrossRef]
  43. Hu, G.S.; deHart, A.K.A.; Li, Y.S.; Ustach, C.; Handley, V.; Navarre, R.; Hwang, C.F.; Aegerter, B.J.; Williamson, V.M.; Baker, B. Eds1 in Tomato Is Required for Resistance Mediated by Tir-Class R Genes and the Receptor-Like R Gene Ve. Plant J. 2005, 42, 376–391. [Google Scholar] [CrossRef] [PubMed]
  44. Parker, J.E.; Holub, E.B.; Frost, L.N.; Falk, A.; Gunn, N.D.; Daniels, M.J. Characterization of Eds1, a Mutation in Arabidopsis Suppressing Resistance to Peronospora Parasitica Specified by Several Different Rpp Genes. Plant Cell 1996, 8, 2033–2046. [Google Scholar] [PubMed] [Green Version]
  45. Heidrich, K.; Wirthmueller, L.; Tasset, C.; Pouzet, C.; Deslandes, L.; Parker, J.E. Arabidopsis Eds1 Connects Pathogen Effector Recognition to Cell Compartment-Specific Immune Responses. Science 2011, 334, 1401–1404. [Google Scholar] [CrossRef]
  46. Glazebrook, J.; Rogers, E.E.; Ausubel, F.M. Isolation of Arabidopsis Mutants with Enhanced Disease Susceptibility by Direct Screening. Genetics 1996, 143, 973–982. [Google Scholar] [CrossRef]
  47. Cui, H.; Gobbato, E.; Kracher, B.; Qiu, J.; Bautor, J.; Parker, J.E. A Core Function of Eds1 with Pad4 Is to Protect the Salicylic Acid Defense Sector in Arabidopsis Immunity. New Phytol. 2017, 213, 1802–1817. [Google Scholar] [CrossRef] [PubMed] [Green Version]
  48. Li, J.; Brader, G.; Palva, E.T. Kunitz Trypsin Inhibitor: An Antagonist of Cell Death Triggered by Phytopathogens and Fumonisin B1 in Arabidopsis. Mol. Plant 2008, 1, 482–495. [Google Scholar] [CrossRef] [Green Version]
  49. Arnaiz, A.; Talavera-Mateo, L.; Gonzalez-Melendi, P.; Martinez, M.; Diaz, I.; Santamaria, M.E. Arabidopsis Kunitz Trypsin Inhibitors in Defense against Spider Mites. Front. Plant Sci. 2018, 9, 986. [Google Scholar] [CrossRef] [Green Version]
  50. Heitz, T.; Bergey, D.R.; Ryan, C.A. A Gene Encoding a Chloroplast-Targeted Lipoxygenase in Tomato Leaves Is Transiently Induced by Wounding, Systemin, and Methyl Jasmonate. Plant Physiol. 1997, 114, 1085–1093. [Google Scholar] [CrossRef] [PubMed] [Green Version]
  51. Zhao, Y.; Thilmony, R.; Bender, C.L.; Schaller, A.; He, S.Y.; Howe, G.A. Virulence Systems of Pseudomonas syringae pv. Tomato Promote Bacterial Speck Disease in Tomato by Targeting the Jasmonate Signaling Pathway. Plant J. 2003, 36, 485–499. [Google Scholar] [CrossRef]
  52. Pauwels, L.; Barbero, G.F.; Geerinck, J.; Tilleman, S.; Grunewald, W.; Perez, A.C.; Chico, J.M.; Vanden Bossche, R.; Sewell, J.; Gil, E.; et al. Ninja Connects the Co-Repressor Topless to Jasmonate Signalling. Nature 2010, 464, 788–U169. [Google Scholar] [CrossRef] [Green Version]
  53. Causier, B.; Ashworth, M.; Guo, W.; Davies, B. The Topless Interactome: A Framework for Gene Repression in Arabidopsis. Plant Physiol. 2012, 158, 423–438. [Google Scholar] [CrossRef] [Green Version]
  54. Harvey, S.; Kumari, P.; Lapin, D.; Griebel, T.; Hickman, R.; Guo, W.; Zhang, R.; Parker, J.E.; Beynon, J.; Denby, K. Downy Mildew Effector Harxl21 Interacts with the Transcriptional Repressor Topless to Promote Pathogen Susceptibility. bioRxiv 2020, 16, e1008835. [Google Scholar] [CrossRef]
  55. Mochizuki, N.; Brusslan, J.A.; Larkin, R.; Nagatani, A.; Chory, J. Arabidopsis Genomes Uncoupled 5 (Gun5) Mutant Reveals the Involvement of Mg-Chelatase H Subunit in Plastid-to-Nucleus Signal Transduction. Proc. Natl. Acad. Sci. USA 2001, 98, 2053–2058. [Google Scholar] [CrossRef] [Green Version]
  56. Ibata, H.; Nagatani, A.; Mochizuki, N. Chlh/Gun5 Function in Tetrapyrrole Metabolism Is Correlated with Plastid Signaling but Not Aba Responses in Guard Cells. Front. Plant Sci. 2016, 7, 1650. [Google Scholar] [CrossRef] [Green Version]
  57. Shang, Y.; Yan, L.; Liu, Z.Q.; Cao, Z.; Mei, C.; Xin, Q.; Wu, F.Q.; Wang, X.F.; Du, S.Y.; Jiang, T.; et al. The Mg-Chelatase H Subunit of Arabidopsis Antagonizes a Group of Wrky Transcription Repressors to Relieve Aba-Responsive Genes of Inhibition. Plant Cell 2010, 22, 1909–1935. [Google Scholar] [CrossRef] [PubMed] [Green Version]
  58. Berens, M.L.; Berry, H.M.; Mine, A.; Argueso, C.T.; Tsuda, K. Evolution of Hormone Signaling Networks in Plant Defense. Annu. Rev. Phytopathol. 2017, 55, 401–425. [Google Scholar] [CrossRef] [PubMed]
  59. Sagi, M.; Davydov, O.; Orazova, S.; Yesbergenova, Z.; Ophir, R.; Stratmann, J.W.; Fluhr, R. Plant Respiratory Burst Oxidase Homologs Impinge on Wound Responsiveness and Development in Lycopersicon Esculentum. Plant Cell 2004, 16, 616–628. [Google Scholar] [CrossRef] [PubMed] [Green Version]
  60. Kumar, S.; Kaur, A.; Chattopadhyay, B.; Bachhawat, A.K. Defining the Cytosolic Pathway of Glutathione Degradation in Arabidopsis Thaliana: Role of the Chac/Gcg Family of Gamma-Glutamyl Cyclotransferases as Glutathione-Degrading Enzymes and Atlap1 as the Cys-Gly Peptidase. Biochem. J. 2015, 468, 73–85. [Google Scholar] [CrossRef] [PubMed]
  61. Rojas, C.M.; Senthil-Kumar, M.; Tzin, V.; Mysore, K. Regulation of Primary Plant Metabolism during Plant-Pathogen Interactions and Its Contribution to Plant Defense. Front. Plant Sci. 2014, 5, 17. [Google Scholar] [CrossRef] [PubMed] [Green Version]
  62. Dixon, R.A.; Achnine, L.; Kota, P.; Liu, C.J.; Reddy, M.S.; Wang, L. The Phenylpropanoid Pathway and Plant Defence—A Genomics Perspective. Mol. Plant Pathol. 2002, 3, 371–390. [Google Scholar] [CrossRef]
  63. Vogt, T. Phenylpropanoid Biosynthesis. Mol. Plant 2010, 3, 2–20. [Google Scholar] [CrossRef] [PubMed] [Green Version]
  64. McManus, J.; Cheng, Z.; Vogel, C. Next-Generation Analysis of Gene Expression Regulation--Comparing the Roles of Synthesis and Degradation. Mol. Biosyst. 2015, 11, 2680–2689. [Google Scholar] [CrossRef] [PubMed] [Green Version]
  65. Liu, Y.; Beyer, A.; Aebersold, R. On the Dependency of Cellular Protein Levels on Mrna Abundance. Cell 2016, 165, 535–550. [Google Scholar] [CrossRef] [PubMed] [Green Version]
  66. Tsuzuki, T.; Takahashi, K.; Inoue, S.; Okigaki, Y.; Tomiyama, M.; Hossain, M.A.; Shimazaki, K.; Murata, Y.; Kinoshita, T. Mg-Chelatase H Subunit Affects Aba Signaling in Stomatal Guard Cells, but Is Not an Aba Receptor in Arabidopsis Thaliana. J. Plant Res. 2011, 124, 527–538. [Google Scholar] [CrossRef] [Green Version]
  67. Zhang, D.-P.; Wu, Z.-Y.; Li, X.-Y.; Zhao, Z.-X. Purification and Identification of a 42-Kilodalton Abscisic Acid-Specific-Binding Protein from Epidermis of Broad Bean Leaves. Plant Physiol. 2002, 128, 714–725. [Google Scholar] [CrossRef] [PubMed]
  68. Wu, F.Q.; Xin, Q.; Cao, Z.; Liu, Z.Q.; Du, S.Y.; Mei, C.; Zhao, C.X.; Wang, X.F.; Shang, Y.; Jiang, T.; et al. The Magnesium-Chelatase H Subunit Binds Abscisic Acid and Functions in Abscisic Acid Signaling: New Evidence in Arabidopsis. Plant Physiol. 2009, 150, 1940–1954. [Google Scholar] [CrossRef] [PubMed] [Green Version]
  69. Shen, Y.Y.; Wang, X.F.; Wu, F.Q.; Du, S.Y.; Cao, Z.; Shang, Y.; Wang, X.L.; Peng, C.C.; Yu, X.C.; Zhu, S.Y.; et al. The Mg-Chelatase H Subunit Is an Abscisic Acid Receptor. Nature 2006, 443, 823–826. [Google Scholar] [CrossRef]
  70. Muller, A.H.; Hansson, M. The Barley Magnesium Chelatase 150-Kd Subunit Is Not an Abscisic Acid Receptor. Plant Physiol. 2009, 150, 157–166. [Google Scholar] [CrossRef] [Green Version]
  71. Chan, K.X.; Phua, S.Y.; Crisp, P.; McQuinn, R.; Pogson, B.J. Learning the Languages of the Chloroplast: Retrograde Signaling and Beyond. Annu. Rev. Plant Biol. 2016, 67, 25–53. [Google Scholar] [CrossRef]
  72. Agrios, G.N. Plant Pathology, 5th ed.; Elsevier Academic Press: Amsterdam, The Netherlands; Boston, MA, USA, 2005; p. xxiii. 922p. [Google Scholar]
  73. Li, Y.; Han, Y.; Qu, M.; Chen, J.; Chen, X.; Geng, X.; Wang, Z.; Chen, S. Apoplastic Cell Death-Inducing Proteins of Filamentous Plant Pathogens: Roles in Plant-Pathogen Interactions. Front. Genet. 2020, 11, 661. [Google Scholar] [CrossRef]
  74. Caten, C.; Jinks, J. Spontaneous Variability of Single Isolates of Phytophthora Infestans. I. Cultural Variation. Can. J. Bot. 1968, 46, 329–348. [Google Scholar] [CrossRef]
  75. Wilson, U.; Coffey, M. Cytological Evaluation of General Resistance to Phytophthora Infestans in Potato Foliage. Ann. Bot. 1980, 45, 81–90. [Google Scholar]
  76. Yin, J.; Gu, B.; Huang, G.; Tian, Y.; Quan, J.; Lindqvist-Kreuze, H.; Shan, W. Conserved Rxlr Effector Genes of Phytophthora Infestans Expressed at the Early Stage of Potato Infection Are Suppressive to Host Defense. Front. Plant Sci. 2017, 8, 2155. [Google Scholar] [CrossRef] [Green Version]
  77. Schneider, C.A.; Rasband, W.S.; Eliceiri, K.W. Nih Image to Imagej: 25 Years of Image Analysis. Nat. Methods 2012, 9, 671–675. [Google Scholar] [CrossRef] [PubMed]
  78. Faurobert, M.; Pelpoir, E.; Chaib, J. Phenol Extraction of Proteins for Proteomic Studies of Recalcitrant Plant Tissues. Methods Mol. Biol. 2007, 355, 9–14. [Google Scholar]
  79. Wu, X.; Xiong, E.; Wang, W.; Scali, M.; Cresti, M. Universal Sample Preparation Method Integrating Trichloroacetic Acid/Acetone Precipitation with Phenol Extraction for Crop Proteomic Analysis. Nat. Protoc. 2014, 9, 362–374. [Google Scholar] [CrossRef] [PubMed]
  80. Saravanan, R.S.; Rose, J.K. A Critical Evaluation of Sample Extraction Techniques for Enhanced Proteomic Analysis of Recalcitrant Plant Tissues. Proteomics 2004, 4, 2522–2532. [Google Scholar] [CrossRef] [PubMed]
  81. Fan, K.T.; Wang, K.H.; Chang, W.H.; Yang, J.C.; Yeh, C.F.; Cheng, K.T.; Hung, S.C.; Chen, Y.R. Application of Data-Independent Acquisition Approach to Study the Proteome Change from Early to Later Phases of Tomato Pathogenesis Responses. Int. J. Mol. Sci. 2019, 20, 863. [Google Scholar] [CrossRef] [PubMed] [Green Version]
  82. Chen, C.J.; Chen, W.Y.; Tseng, M.C.; Chen, Y.R. Tunnel Frit: A Nonmetallic in-Capillary Frit for Nanoflow Ultra High-Performance Liquid Chromatography-Mass Spectrometryapplications. Anal. Chem. 2012, 84, 297–303. [Google Scholar] [CrossRef] [PubMed]
  83. Scheltema, R.A.; Hauschild, J.P.; Lange, O.; Hornburg, D.; Denisov, E.; Damoc, E.; Kuehn, A.; Makarov, A.; Mann, M. The Q Exactive HF, a Benchtop Mass Spectrometer with a Pre-Filter, High-Performance Quadrupole and an Ultra-High-Field Orbitrap Analyzer. Mol. Cell. Proteom. MCP 2014, 13, 3698–3708. [Google Scholar] [CrossRef] [Green Version]
  84. Bruderer, R.; Bernhardt, O.M.; Gandhi, T.; Xuan, Y.; Sondermann, J.; Schmidt, M.; Gomez-Varela, D.; Reiter, L. Optimization of Experimental Parameters in Data-Independent Mass Spectrometry Significantly Increases Depth and Reproducibility of Results. Mol. Cell. Proteom. MCP 2017, 16, 2296–2309. [Google Scholar] [CrossRef] [Green Version]
  85. Craig, R.; Beavis, R.C. Tandem: Matching Proteins with Tandem Mass Spectra. Bioinformatics 2004, 20, 1466–1467. [Google Scholar] [CrossRef] [PubMed]
  86. Keller, A.; Nesvizhskii, A.I.; Kolker, E.; Aebersold, R. Empirical Statistical Model to Estimate the Accuracy of Peptide Identifications Made by MS/MS and Database Search. Anal. Chem. 2002, 74, 5383–5392. [Google Scholar] [CrossRef] [PubMed]
  87. Shteynberg, D.; Deutsch, E.W.; Lam, H.; Eng, J.K.; Sun, Z.; Tasman, N.; Mendoza, L.; Moritz, R.L.; Aebersold, R.; Nesvizhskii, A.I. Iprophet: Multi-Level Integrative Analysis of Shotgun Proteomic Data Improves Peptide and Protein Identification Rates and Error Estimates. Mol. Cell. Proteom. MCP 2011, 10, M111-007690. [Google Scholar] [CrossRef] [PubMed] [Green Version]
  88. Deutsch, E.W.; Mendoza, L.; Shteynberg, D.; Slagel, J.; Sun, Z.; Moritz, R.L. Trans-Proteomic Pipeline, a Standardized Data Processing Pipeline for Large-Scale Reproducible Proteomics Informatics. Proteom. Clin. Appl. 2015, 9, 745–754. [Google Scholar] [CrossRef] [Green Version]
  89. Reiter, L.; Claassen, M.; Schrimpf, S.P.; Jovanovic, M.; Schmidt, A.; Buhmann, J.M.; Hengartner, M.O.; Aebersold, R. Protein Identification False Discovery Rates for Very Large Proteomics Data Sets Generated by Tandem Mass Spectrometry. Mol. Cell. Proteom. MCP 2009, 8, 2405–2417. [Google Scholar] [CrossRef] [Green Version]
  90. Lam, H.; Deutsch, E.W.; Eddes, J.S.; Eng, J.K.; Stein, S.E.; Aebersold, R. Building Consensus Spectral Libraries for Peptide Identification in Proteomics. Nat. Methods 2008, 5, 873–875. [Google Scholar] [CrossRef]
  91. Röst, H.L.; Sachsenberg, T.; Aiche, S.; Bielow, C.; Weisser, H.; Aicheler, F.; Andreotti, S.; Ehrlich, H.C.; Gutenbrunner, P.; Kenar, E.; et al. OpenMS: A Flexible Open-Source Software Platform for Mass Spectrometry Data Analysis. Nat. Methods 2016, 13, 741–748. [Google Scholar] [CrossRef]
  92. Schubert, O.T.; Gillet, L.C.; Collins, B.C.; Navarro, P.; Rosenberger, G.; Wolski, W.E.; Lam, H.; Amodei, D.; Mallick, P.; MacLean, B.; et al. Building High-Quality Assay Libraries for Targeted Analysis of Swath MS Data. Nat. Protoc. 2015, 10, 426–441. [Google Scholar] [CrossRef]
  93. Röst, H.L.; Rosenberger, G.; Navarro, P.; Gillet, L.; Miladinović, S.M.; Schubert, O.T.; Wolski, W.; Collins, B.C.; Malmström, J.; Malmström, L.; et al. OpenSWATH Enables Automated, Targeted Analysis of Data- Independent Acquisition MS Data. Nat. Biotechnol. 2014, 32, 219–223. [Google Scholar] [CrossRef] [PubMed] [Green Version]
  94. Lambert, J.P.; Ivosev, G.; Couzens, A.L.; Larsen, B.; Taipale, M.; Lin, Z.Y.; Zhong, Q.; Lindquist, S.; Vidal, M.; Aebersold, R.; et al. Mapping Differential Interactomes by Affinity Purification Coupled with Data-Independent Mass Spectrometry Acquisition. Nat. Methods 2013, 10, 1239–1245. [Google Scholar] [CrossRef] [PubMed] [Green Version]
  95. Perez-Riverol, Y.; Csordas, A.; Bai, J.; Bernal-Llinares, M.; Hewapathirana, S.; Kundu, D.J.; Inuganti, A.; Griss, J.; Mayer, G.; Eisenacher, M.; et al. The PRIDE Database and Related Tools and Resources in 2019: Improving Support for Quantification Data. Nucleic Acids Res. 2019, 47, D442–D450. [Google Scholar] [CrossRef] [PubMed]
Figure 1. Inoculation of detached tomato leaflets by P. infestans. Detached leaflets of five-week-old tomato plants were inoculated with P. infestans by placing a 20 μL drop of inoculum at eight spots on the abaxial surface of the leaflets. (A) Microscopic assessment of P. infestans developing on tomato leaflets at different time points post-inoculation after staining with trypan blue. At 6-h post-inoculation (hpi), the pathogens remained as cysts and started to germinate at 16 hpi. At 24 hpi, the primary hyphae (PH) were developed and the appressorium (Ap) structure was generated, indicating that the pathogen was ready to invade the plant cells. (B) Example leaflets showing P. infestans lesion development at 24, 48, 96 and 120 hpi. The white bar represents 1 cm. (C) Bar graphs showing the relative band intensity of reverse transcription-polymerase chain reaction (RT-PCR) products of P. infestans marker genes, SNE1, IpiO, and PiNPP1.1 is shown in Figure S1. The RNA samples were extracted from tomato leaflets at 24, 48, 96, and 120 hpi. The relative transcript abundance is shown as a proportion of the most intense band in each gel image. The expression level of P. infestans actin was used to evaluate the biomass of the pathogen in tomato leaves. The expression levels of biotrophic stage markers (SNE1 and IpiO) were reduced after 96 hpi, and the necrotrophic stage marker (PiNPP1.1) was continuously increased from 24 hpi to 120 hpi. The error bars are standard deviations and the graph represents the combined data from three biological replicates (n = 3). Differentially regulated genes with a p-value of less than 0.05 or a p-value of less than 0.01 are marked with single or double asterisks, respectively. Cy, cyst; Gt, germ tube; AP, appressorium; PH, primary hyphae.
Ijms 22 04174 g001
Figure 2. Proteome changes in tomato leaf between 24, 48 and 96 h post-inoculation with P. infestans compared to post-mock-inoculation at 24, 48, and 96 h, respectively. (A) Venn diagrams showing the unique and shared tomato or P. infestans proteins identified, quantified in three biological replicates, or showing a significant difference in abundance with a fold change greater than 1.5 or less than 0.67 in quantity (p < 0.05) due to inoculation. (B) Volcano plots showing the protein abundance ratio of P. infestans-inoculated over the mock group at 24, 48 and 96 hpi. Following liquid chromatography-mass spectrometry (LC-MS) analysis and data-independent acquisition (DIA) quantification, t-test-based significance values (log10 (p-value)) were plotted versus log2 (protein quantity ratio for all proteins between infected and mock). Differentially regulated proteins with p < 0.05 are plotted in red. A level of protein abundance change of 1.5 or 0.67-fold is marked with a dashed line.
Ijms 22 04174 g002
Figure 3. Functional analysis of biological processes for tomato proteins (A) upregulated or (B) downregulated at 24, 48, or 96 h post-inoculation with P. infestans. Tomato proteins up- or downregulated by P. infestans were matched to the Arabidopsis homolog proteins by Protein Basic Local Alignment Search Tool (BLASTP) against The Arabidopsis Information Resource (TAIR) database. The counts of these Arabidopsis homolog proteins were compared at different time points in the enriched function group with Gene Ontology (GO) categorization using the Database for Annotation, Visualization and Integrated Discovery (DAVID) v.6.8 (p < 0.05).
Ijms 22 04174 g003
Figure 4. Levels of tomato transcripts encoding proteins that were differentially regulated in response to different pathogenesis stages of P. infestans. The transcript levels of the selected P. infestans-regulated proteins (RD21a, HIR, C4H, PR-5, EDS1, PIP1, ENO1, TPL3, and CHLH/ABAR) in tomato were determined by qRT-PCR in the same samples prepared for the proteomics analysis in this study. The mean values from three biological repeats are shown (n = 3). All statistically significant differences between the P. infestans (Pi) and mock (M)-treated samples are indicated with asterisks (*, p < 0.05), based on the Student’s t-test using the log2-ratio of the gene or protein expression levels between these two conditions. The internal control Ubi-3 gene was used for normalization. Error bars are means ± SD. NQ, non-quantifiable as the protein quantification was only measurable in one or two biological replicates.
Ijms 22 04174 g004
Table 1. Proteins involved in defense mechanisms with a significant change in abundance at 24, 48 and 96 h post-inoculation with P. infestans.
24 h48 h96 h
Gene AccessionProtein DescriptionArabidopsis Homolog#
rep a
log2 ratio bpc#
rep a
log2 ratio bpc# rep alog2 ratio bpc
Solyc10g055800chitinaseAT3G125003−0.1210.80430.4540.34731.8160.023
Solyc02g082920class II chitinaseAT3G1250030.1400.32630.5560.00932.9820.019
Solyc01g008620glucan endo-1,3-beta-glucosidaseAT4G1626030.0720.1333−0.0220.93332.5630.001
Solyc10g079860LEQB L.esculentum TomQ’b beta (1,3) glucanaseAT3G5727030.0890.49630.6120.34434.0550.007
Solyc09g090990major allergen Pru ar.1 (PR-10 family)AT5G4586030.7550.16232.4460.00234.4790.001
Solyc07g005370norcoclaurine synthase (NCS; PR-10/Bet v 1 family)AT2G2604030.1350.64230.3750.1533−0.7560.033
Solyc08g080670pathogenesis-related 5-like protein (PR-5)AT4G116503−1.6330.0053−0.2980.62330.3940.436
Solyc01g097240pathogenesis-related protein 4 (PR-4)AT3G0472030.1990.02730.5220.05833.7450.007
Solyc09g090980pathogenesis-related protein STH-2-like (PR-10 family)AT1G2402030.1850.00931.2060.01033.4560.004
a Number of biological replicates in which the protein was quantifiable. b The average log2 ratio of protein quantity representing (inoculated/mock) from three biological replicates. c The p-value was calculated by Student’s t-test if the protein could be quantified from three biological replicates. Color codes: red, significant quantity change with greater than 0.58 of log2 ratio (p < 0.05); blue, significant quantity change less than −0.58 of log2 ratio; grey, no significant change between the inoculated and mock group (p ≥ 0.05) or not quantified in all three replicates (NQ); white, the quantity change is between 0.58 and −0.58 of log2 ratio (p < 0.05).
Table 2. Proteins involved in immune regulation with a significant change in abundance at 24, 48 and 96 h post-inoculation with P. infestans.
24 h48 h96 h
Gene AccessionProtein DescriptionArabidopsis Homolog#
rep a
log2 ratio bpc#
rep a
log2 ratio bpc# rep alog2 ratio bpc
Solyc02g077880auxin-repressed protein (ARP)AT2G338303−0.404 0.202 3−1.360 0.072 3−2.441 0.007
Solyc03g033790P-loop containing nucleoside triphosphate hydrolases superfamily proteinAT3G5093010.083 NQ20.304 NQ31.340 0.021
Solyc06g068840calcium-dependent phospholipid-binding copine family proteinAT5G6190020.262 NQ30.534 0.181 31.015 0.030
Solyc02g067750carbonic anhydrase (CA)AT3G0150031.884 0.719 3−1.904 0.374 38.330 0.012
Solyc04g078540cysteine proteinase RD21aAT1G4712830.331 0.102 3−0.029 0.888 30.716 0.036
Solyc06g071280enhanced disease susceptibility 1 (EDS1)AT3G480903−0.015 0.100 30.092 0.594 30.930 0.037
Solyc06g071050hypersensitive-induced response protein (HIR)AT5G627402−0.334 NQ3−0.430 0.525 30.686 0.016
Solyc03g098730Kunitz-type protease inhibitor (KTI)AT1G178603−0.607 0.220 30.076 0.744 32.740 0.008
Solyc07g043320myosin heavy chain, embryonic smooth proteinAT2G3224030.129 0.276 30.578 0.188 31.050 0.030
Solyc00g174340pathogenesis-related protein 1b (PR-1b)AT4G3372030.058 0.484 30.591 0.025 32.902 0.008
Solyc09g007010pathogenesis-related protein 1 (PR-1)AT4G3372030.097 0.354 30.411 0.302 32.296 0.043
Solyc02g077040phytophthora-inhibited protease 1 (PIP1)AT3G4934030.183 0.052 30.291 0.316 31.585 0.024
a Number of biological replicates in which the protein was quantifiable. b The average log2 ratio of protein quantity representing (inoculated/mock) from three biological replicates. c The p-value was calculated by Student’s t-test if the protein could be quantified from the three biological replicates. Color codes: red, significant quantity change with greater than 0.58 of log2 ratio (p < 0.05); blue, significant quantity change less than −0.58 of log2 ratio; grey, no significant change between the inoculated and mock group (p ≥ 0.05) or not quantified in all three replicates (NQ); white, the quantity change is between 0.58 and −0.58 of log2 ratio (p < 0.05).
Table 3. Proteins involved in hormone biosynthesis and signaling with significant changes in abundance at 24, 48 and 96 h post-inoculation with P. infestans.
24 h48 h96 h
Gene AccessionProtein DescriptionArabidopsis Homolog#
rep a
log2 ratio bpc#
rep a
log2 ratio bpc#
rep a
log2 ratio bpc
Solyc07g0495301-aminocyclopropane-1-carboxylate oxidase 1 (ACO1)AT1G0501030.109 0.521 30.877 0.007 32.288 0.012
Solyc04g015750cobN/magnesium chelatase (CHLH/ABAR)AT5G1363030.629 0.042 30.155 0.625 3−1.239 0.031
Solyc01g099160lipoxygenase (Lox)AT1G550200NDND32.0670.00333.0630.055
Solyc08g029000lipoxygenase (Lox)AT1G550203−0.2910.52731.8890.00333.8040.008
Solyc03g122340lipoxygenase D (LoxD)AT1G174203−0.6110.0463−0.4530.3941−1.177NQ
Solyc12g062290protease do-like 9 (DEGP9)AT5G4020030.133 0.268 3−0.588 0.011 20.000 NQ
Solyc01g100050topless 3 (TPL3)AT5G2703030.205 0.067 30.307 0.188 30.817 0.004
a Number of biological replicates in which the protein was quantifiable. b The average log2 ratio of protein quantity representing (inoculated/mock) from three biological replicates. c The p-value was calculated by Student’s t-test if the protein could be quantified from three biological replicates. Color codes: red, significant quantity change with greater than 0.58 of log2 ratio (p < 0.05); blue, significant quantity change less than −0.58 of log2 ratio; grey, no significant change between the inoculated and mock group (p ≥ 0.05) or not quantified in all three replicates (NQ); white, the quantity change is between 0.58 and −0.58 of log2 ratio (p < 0.05).
Table 4. Proteins involved in ROS homeostasis and redox regulation with a significant change in abundance at 24, 48 and 96 h post-inoculation with P. infestans.
24 h48 h96 h
Gene AccessionProtein DescriptionArabidopsis Homolog#
rep a
log2 ratio bpc#
rep a
log2 ratio bpc#
rep a
log2 ratio bpc
Solyc04g073990annexin p34 (ANXP34)AT1G357203−0.122 0.603 30.107 0.883 30.690 0.002
Solyc04g082460catalase (CAT)AT4G3509030.223 0.122 3−0.182 0.724 3−0.845 0.046
Solyc01g107860CBS domain-containing protein-like (CDCP-like)AT4G369103−0.026 0.345 3−0.046 0.777 31.068 0.010
Solyc11g012910gamma-glutamylcyclotransferase (GGCG)AT1G447903−0.564 0.046 30.369 0.418 3−1.588 0.003
Solyc08g080940glutathione peroxidase -like encoding 1 (GPX-1) AT4G116003−0.037 0.498 30.241 0.319 30.957 0.019
Solyc06g083770glutathione S-transferase (GST)AT5G440003−0.008 0.967 3−0.260 0.366 3−1.300 0.016
Solyc10g084400glutathione S-transferase (GST)AT5G027903−0.099 0.596 30.221 0.100 31.572 0.000
Solyc09g011590glutathione S-transferase-like protein (GST-like)AT3G092703−1.121 0.316 30.987 0.272 32.891 0.007
Solyc02g081430microsomal Glutathione s-Transferase (MGST)AT1G6582030.082 0.263 30.201 0.644 3−0.790 0.006
Solyc01g096430NADPH:quinone oxidoreductase-like (NQR-like)AT3G278902−0.040 NQ30.140 0.814 31.794 0.034
Solyc03g111720peptide methionine sulfoxide reductase (MSR)AT5G616403−0.440 0.079 30.135 0.396 30.829 0.010
Solyc10g076240peroxidase (POX)AT5G053400NQNQ0NQNQ33.731 0.037
Solyc08g069040peroxidase (POX)AT4G375302−0.165 NQ 3−0.831 0.041 2−0.428 NQ
Solyc01g067740superoxide dismutase 1 (CSD1)AT1G0883030.320 0.060 30.074 0.820 31.113 0.038
Solyc04g081970thioredoxin (TRX)AT1G7608030.021 0.805 30.000 1.000 3−1.087 0.011
Solyc02g082250thioredoxin reductase (TRXR)AT2G1742030.015 0.883 30.217 0.262 30.607 0.013
Solyc03g117980whitefly-induced gp91-phox (GP91phox)AT5G4791030.039 0.777 30.765 0.038 32.345 0.016
a Number of biological replicates in which the protein was quantifiable. b The average log2 ratio of protein quantity representing (inoculated/mock) from three biological replicates. c The p-value was calculated by Student’s t-test if the protein could be quantified from three biological replicates. Color codes: red, significant quantity change with greater than 0.58 of log2 ratio (p < 0.05); blue, significant quantity change less than −0.58 of log2 ratio; grey, no significant change between the inoculated and mock group (p ≥ 0.05) or not quantified in all three replicates (NQ); white, the quantity change is between 0.58 and −0.58 of log2 ratio (p < 0.05).
Table 5. Proteins involved in energy metabolisms with a significant change in abundance at 24, 48 and 96 h post-inoculation with P. infestans.
24 h48 h96 h
Gene AccessionProtein DescriptionArabidopsis Homolog#
rep a
log2 ratio bpc#
rep a
log2 ratio bpc#
rep a
log2 ratio bpc
Metabolism-Primary-Energy Metabolisms
Solyc11g007720pyruvate dehydrogenase complex (PDC)AT3G522003−0.121 0.358 30.082 0.842 30.645 0.017
Solyc01g073740citrate synthase (CSY)AT2G443503−0.112 0.410 3−0.198 0.283 30.639 0.017
Solyc07g052350aconitate hydratase (ACO)AT2G0571030.019 0.872 30.110 0.544 30.708 0.047
Solyc12g005860aconitate hydratase (ACO)AT2G057103−0.084 0.054 3−0.100 0.605 30.968 0.023
Solyc01g005560isocitrate dehydrogenase (IDH)AT1G659303−0.125 0.650 30.311 0.369 30.753 0.049
Solyc07g064800oxoglutarate dehydrogenase complex (ODC)AT4G2691030.049 0.497 30.150 0.700 30.607 0.046
Solyc12g005080oxoglutarate dehydrogenase complex (ODC)AT5G550703−0.073 0.661 30.107 0.043 31.003 0.023
Solyc06g083790succinyl-CoA ligase (SCoAL)AT2G2042030.058 0.107 30.039 0.888 30.602 0.016
Solyc01g007910succinyl-CoA ligase (SCoAL)AT5G232503−0.131 0.132 30.295 0.529 30.630 0.035
Solyc09g075450fumarase (FUM)AT2G4751030.088 0.362 30.091 0.691 30.953 0.004
Solyc08g066360malic enzyme (ME)AT1G797503−0.007 0.978 3−0.016 0.957 30.903 0.045
Metabolism-Primary-Glycolysis
Solyc07g045160ATP-dependent 6-phosphofructokinase (PFK)AT4G2627030.217 0.106 30.107 0.497 31.052 0.037
Solyc10g005510glyceraldehyde-3-phosphate dehydrogenase (GAPDH)AT1G1630030.097 0.413 30.220 0.713 31.096 0.045
Solyc03g114500enolase (ENO1)AT1G7403030.599 0.049 3−1.053 0.430 21.073 NQ
Solyc03g097680pyruvate dehydrogenase 1 (PDH)AT5G508503−0.048 0.857 3−0.270 0.724 31.251 0.038
Metabolism-Primary-Carbohydrate Metabolisms-PPP
Solyc04g0051606-phosphogluconate dehydrogenase (6PGD) AT3G023603−0.046 0.033 30.524 0.031 31.886 0.016
Solyc05g008370ribose 5-phosphate isomerase A (Rpi)AT1G7110030.068 0.366 30.211 0.715 30.790 0.036
Solyc11g033288transaldolase (TAL)AT5G1342030.0290.7513−0.2060.72930.6670.032
Metabolism-Primary-Fatty Acid/Lipids
Solyc10g076600acyl-CoA oxidase/dehydrogenase (ACAD)AT3G518403−0.057 0.872 30.050 0.928 32.085 0.014
Solyc01g059830enoyl-CoA hydratase (ECH)AT4G1621030.469 0.386 2−0.156 NQ30.750 0.041
Solyc12g094450enoyl-CoA hydratase (ECH)AT1G761502−0.278 NQ30.202 0.216 31.663 0.002
a Number of biological replicates in which the protein was quantifiable. b The average log2 ratio of protein quantity representing (inoculated/mock) from three biological replicates. c The p-value was calculated by Student’s t-test if the protein could be quantified from three biological replicates. Color codes: red, significant quantity change with greater than 0.58 of log2 ratio (p < 0.05); blue, significant quantity change less than −0.58 of log2 ratio; grey, no significant change between the inoculated and mock group (p ≥ 0.05) or not quantified in all three replicates (NQ); white, the quantity change is between 0.58 and −0.58 of log2 ratio (p < 0.05).
Table 6. Proteins involved in carbon fixation with a significant change in abundance at 24, 48 and 96 h post-inoculation with P. infestans.
24 h48 h96 h
Gene AccessionProtein DescriptionArabidopsis Homolog#
rep a
log2 ratio bpc#
rep a
log2 ratio bpc# rep alog2 ratio bpc
Solyc06g063370chlorophyll a-b binding protein (LHCB)AT4G103403−0.061 0.659 30.391 0.212 3−0.662 0.014
Solyc12g005630cytochrome b6-f complex iron-sulfur subunit AT4G032803‒0.368 0.077 3‒0.001 0.998 3‒0.739 0.001
Solyc06g009940photosystem I (PSI) P700 chlorophyll a apoproteinATCG0035030.029 0.810 3‒0.121 0.869 3‒0.836 0.015
Solyc02g069450photosystem I (PSI) reaction center subunit IIIAT1G3133030.107 0.605 30.048 0.930 3‒0.661 0.038
Solyc08g013670photosystem I (PSI) reaction center subunit NAT5G6404030.416 0.244 30.412 0.498 3‒0.854 0.033
Solyc05g150152photosystem I (PSI) reaction centre subunit N protein AT1G4997520.073 NQ3‒0.279 0.587 3‒0.599 0.048
Solyc06g060340photosystem II (PSII) 22 kDa proteinAT1G445753‒0.091 0.339 30.234 0.063 3‒0.910 0.008
Solyc05g052600sedoheptulose-1,7-bisphosphatase (SBPase)AT3G5580030.077 0.001 3‒0.292 0.626 3‒0.758 0.039
a Number of biological replicates in which the protein was quantifiable. b The average log2 ratio of protein quantity representing (inoculated/mock) from three biological replicates. c The p-value was calculated by Student’s t-test if the protein could be quantified from three biological replicates. Color codes: red, significant quantity change with greater than 0.58 of log2 ratio (p < 0.05); blue, significant quantity change less than −0.58 of log2 ratio; grey, no significant change between the inoculated and mock group (p ≥ 0.05) or not quantified in all three replicates (NQ); white, the quantity change is between 0.58 and −0.58 of log2 ratio (p < 0.05).
Table 7. Proteins involved in secondary metabolism with a significant change in abundance at 24, 48 and 96 h post-inoculation with P. infestans.
24 h48 h96 h
Gene AccessionProtein DescriptionArabidopsis Homolog#
rep a
log2 ratio bpc#
rep a
log2 ratio bpc# rep alog2 ratio bpc
Solyc06g150137cinnamate 4-hydroxylase (C4H)AT2G304903−0.075 0.505 30.164 0.736 31.390 0.004
Solyc03g1178704-coumarate:CoA ligase (4CL)AT3G2124030.185 0.366 30.622 0.178 32.293 0.004
Solyc01g0911905-enolpyruvylshikimate-3-phosphate synthase (ESPS)AT2G453003−0.124 0.369 30.208 0.229 31.165 0.022
a Number of biological replicates in which the protein was quantifiable. b The average log2 ratio of protein quantity representing (inoculated/mock) from three biological replicates. c The p-value was calculated by Student’s t-test if the protein could be quantified from three biological replicates. Color codes: red, significant quantity change with greater than 0.58 of log2 ratio (p < 0.05); blue, significant quantity change less than −0.58 of log2 ratio; grey, no significant change between the inoculated and mock group (p ≥ 0.05) or not quantified in all three replicates (NQ); white, the quantity change is between 0.58 and −0.58 of log2 ratio (p < 0.05).
Publisher’s Note: MDPI stays neutral with regard to jurisdictional claims in published maps and institutional affiliations.

