Article

The Role of Selected Wavelengths of Light in the Activity of Photosystem II in Gloeobacter violaceus

by
Monika Kula-Maximenko
,
Kamil Jan Zieliński
and
Ireneusz Ślesak
*
The Franciszek Górski Institute of Plant Physiology, Polish Academy of Sciences, Niezapominajek 21, 30-239 Kraków, Poland
*
Author to whom correspondence should be addressed.
Int. J. Mol. Sci. 2021, 22(8), 4021; https://doi.org/10.3390/ijms22084021
Submission received: 17 March 2021 / Revised: 9 April 2021 / Accepted: 12 April 2021 / Published: 13 April 2021

Abstract

:
Gloeobacter violaceus is a cyanobacteria species with a lack of thylakoids, while photosynthetic antennas, i.e., phycobilisomes (PBSs), photosystem II (PSII), and I (PSI), are located in the cytoplasmic membrane. We verified the hypothesis that blue–red (BR) light supplemented with a far-red (FR), ultraviolet A (UVA), and green (G) light can affect the photosynthetic electron transport chain in PSII and explain the differences in the growth of the G. violaceus culture. The cyanobacteria were cultured under different light conditions. The largest increase in G. violaceus biomass was observed only under BR + FR and BR + G light. Moreover, the shape of the G. violaceus cells was modified by the spectrum with the addition of G light. Furthermore, it was found that both the spectral composition of light and age of the cyanobacterial culture affect the different content of phycobiliproteins in the photosynthetic antennas (PBS). Most likely, in cells grown under light conditions with the addition of FR and G light, the average antenna size increased due to the inactivation of some reaction centers in PSII. Moreover, the role of PSI and gloeorhodopsin as supplementary sources of metabolic energy in the G. violaceus growth is discussed.

1. Introduction

Photosynthetic organisms have specific pigment–protein complexes called antennas that capture light energy and then send excitation energy to the photosynthetic reaction centers, where the primary photochemical reactions occur. Cyanobacteria are believed to be primordial organisms that perform oxygenic photosynthesis and their antenna systems consist of phycobiliproteins, which form the phycobilisome (PBS) complex, located outside of thylakoid membranes [1,2,3,4,5,6]. Cyanobacterial thylakoid membranes contain photosystems I (PSI) and II (PSII), which are universal to all oxyphototrophs but have a lack of typical light-harvesting complexes (LHC) that can only be found in photosynthetically active eukaryotic cells. Instead of LHC, they have PBSs, which contain three main types of phycobiliproteins: (1) phycoerythrin (C-PE), (2) phycocyanin (C-PC), and (3) allophycocyanin (APC). The excited electrons, that are generated by light in the antennas, are transferred to the PS I and PS II reaction centers and initiate the photosynthetic electron transport chain (PETC). Fluorescence emission from chlorophyll a (chl a) and heat dissipation from PSII, together with PETC, allow for the effective monitoring of changes in the process of photosynthesis in plants, algae, and cyanobacteria [7,8,9]. PBSs absorb light in the wavelength region of 500–650 nm. The displacement of each type of phycobiliproteins in PBS affects the amount of absorbed photon energy. C-PE, which is located at the ends of the antenna, absorbs short wavelengths, i.e.: 498 nm, and in the range from 545 to 575 nm, which have the highest values of photon energy. C-PC absorbs a longer wavelength of light (~620 nm) with a lower photon energy than C-PE, and it is located between C-PE and APC. At the bottom, close to the membrane surface, APC is connected to the protein, which absorbs a wavelength of light ca. 650 nm [3,4,10,11].
Cyanobacteria, as with other organisms that perform oxygenic photosynthesis, can maintain efficient conversion of light energy under various environmental conditions. In a similar way to higher plants, cyanobacteria are also able to regulate functions of light-harvesting antennas in response to changes in the environment, such as the spectral composition and intensity of light and/or temperature. Therefore, PBSs perform a major role in these regulatory processes [12,13,14]. The unique feature of aquatic environments is the rapid disappearance of far-red (FR) light with depth compared to terrestrial environments. Despite this, photomorphogenic mechanisms in organisms from aquatic ecosystems are similar to those from terrestrial habitats [15,16]. The vertical distribution of cyanobacteria in aquatic biota depends on the degree of their sensitivity to UV radiation. UV light is a well-known factor that can damage the photosynthetic apparatus of cyanobacteria, and thus, inhibit their growth [17,18,19]. The usage of different white light (WL) wavelength regions by cyanobacteria depends on the ratio of the photosynthetic pigments in the cells, which is a feature of each species and strain. In cyanobacteria, the light is absorbed by chl a and PBS, which may suggest a preference for yellow and green light absorbance [20], but not blue and red light, which are absorbed by chl a and b, as in algae and higher plants [21].
The application of traditional light sources, such as fluorescent lamps, incandescent lamps or high-pressure sodium lamps, makes studies that concern the role of specific WL wavelength range in cyanobacteria growth and development very expensive in terms of operation due to their high electricity consumption and heat production. Light-emitting diodes (LEDs) represent an alternative because they are characterized by a much lower energy consumption, long and environmentally friendly functioning [22,23]. LEDs also show excellent regulation of the spectral composition of light due to the use of various chips and wavelength-conversion materials, which allow for adjusting the emitted light to plant and cyanobacteria photoreceptors and enabling the best growth of their biomass [24,25]. In most studies that focus on plant or algae growth, LEDs in the blue light (BL, 400–500 nm), red light (RL, 620–690 nm), and rarely FR light (700–740 nm) region, are used. It is believed that only these colors of the WL spectrum are critical in photosynthesis, phototropism, and photomorphogenic responses [23,26]. The remaining wavelengths of the WL spectrum are omitted because they are considered irrelevant for the proper conditions of the photosynthetic process [23].
One of the simplest cyanobacteria is Gloeobacter violaceus, frequently used as a model organism in studies related to the origin and evolution of oxygenic photosynthesis [27]. Based on phylogenetic studies with 16S rRNA, it has been shown that G. violaceus represents the phylogenetically oldest form among the cyanobacteria [6,28,29,30]. This strain was described by Rippke et al. (1974) on the surface of a limestone rock collected in Canton Obwalden, Switzerland, where higher plants do not grow [31]. Based on the cell morphology and ecology, it was found that G. violaceus is similar to Gloeothece coerulea cells [32]. The color of G. violaceus cells may change to some extent depending on life cycle and environmental conditions [30]. Larger cells, forming aggregates, have a characteristic violet color, which may change to a blue–grey color in suboptimal growth conditions [29,30]. The ultrastructure of G. violaceus is distinguished by the absence of thylakoids [6,8,31,33,34] and instead of a typical PBS structure, it contains simpler vertical rods that are associated with the plasma membrane [1,8,10,11,35]. The cell membrane contains photosynthetic apparatus with chlorophyll (chl), various types of carotenoids (car), and phycobiliproteins as antenna pigments [1,36,37,38]. The G. violaceus features mentioned above indicate that this strain belongs to the phylogenetically oldest form of cyanobacteria [5,6,30].
The growth and PSII activity of G. violaceus in different LED-dependent light conditions have not yet been studied. Therefore, the main interest of this work was to verify the hypothesis that some light wavelengths in the range of 390–700 nm affect the PSII antenna and PETC in PSII and lead to differences in the growth of the G. violaceus culture. For testing this hypothesis, LEDs were used for the first time as sole effective light sources in the G. violaceus culture. It was also found that the amount of phycobiliproteins might perform a key role in the proper functioning of the photosynthetic apparatus of G. violaceus. The obtained results allow for approximating the adaptive mechanisms that occur during the growth of G. violaceus under different light conditions.

2. Results

2.1. Growth of the Gloeobacter violaceus Culture Depends on LED Conditions

The weaker intensity of the violet color of the cultures grown under BR light in comparison to other light conditions was related to the proliferation rate of the cyanobacterial cells (Figure 1 and Supplementary Materials Figure S1).
A lag-induction phase of the G. violaceus cultures was observed for all applied lights for the first five days. After the 10th day, the phase of cell growth became exponential and the spectral light composition significantly affected the biomass growth. This effect was especially noticeable in BR light with the additional region of light wavelength, i.e.: BR + FR, BR + UVA, BR + G, where the growth curve showed a typical exponential shape, while for BR light, the shape of the curve was more flattened. The highest increase in biomass was noted in the cultures grown under BR + FR and BR + G light (Figure 1).
Moreover, it was found that the spectral composition of light significantly influenced the shape of the G. violaceus cells grown under the BR + G light (Table 1). The culture grown under the light with the addition of green light (BR + G) was the most elongated, resembling an ellipse-like shape with a diameter of 0.9 µm and a length of 1.5 µm, and was different from the other cultures (Table 1). The cells grown under the other light conditions were more spherical. The BR + FR light induced a larger size but a lower number of cells in comparison to the BR + G light, which stimulated the growth of a larger number of smaller in size and oval cells (Figure 1 and Table 1).

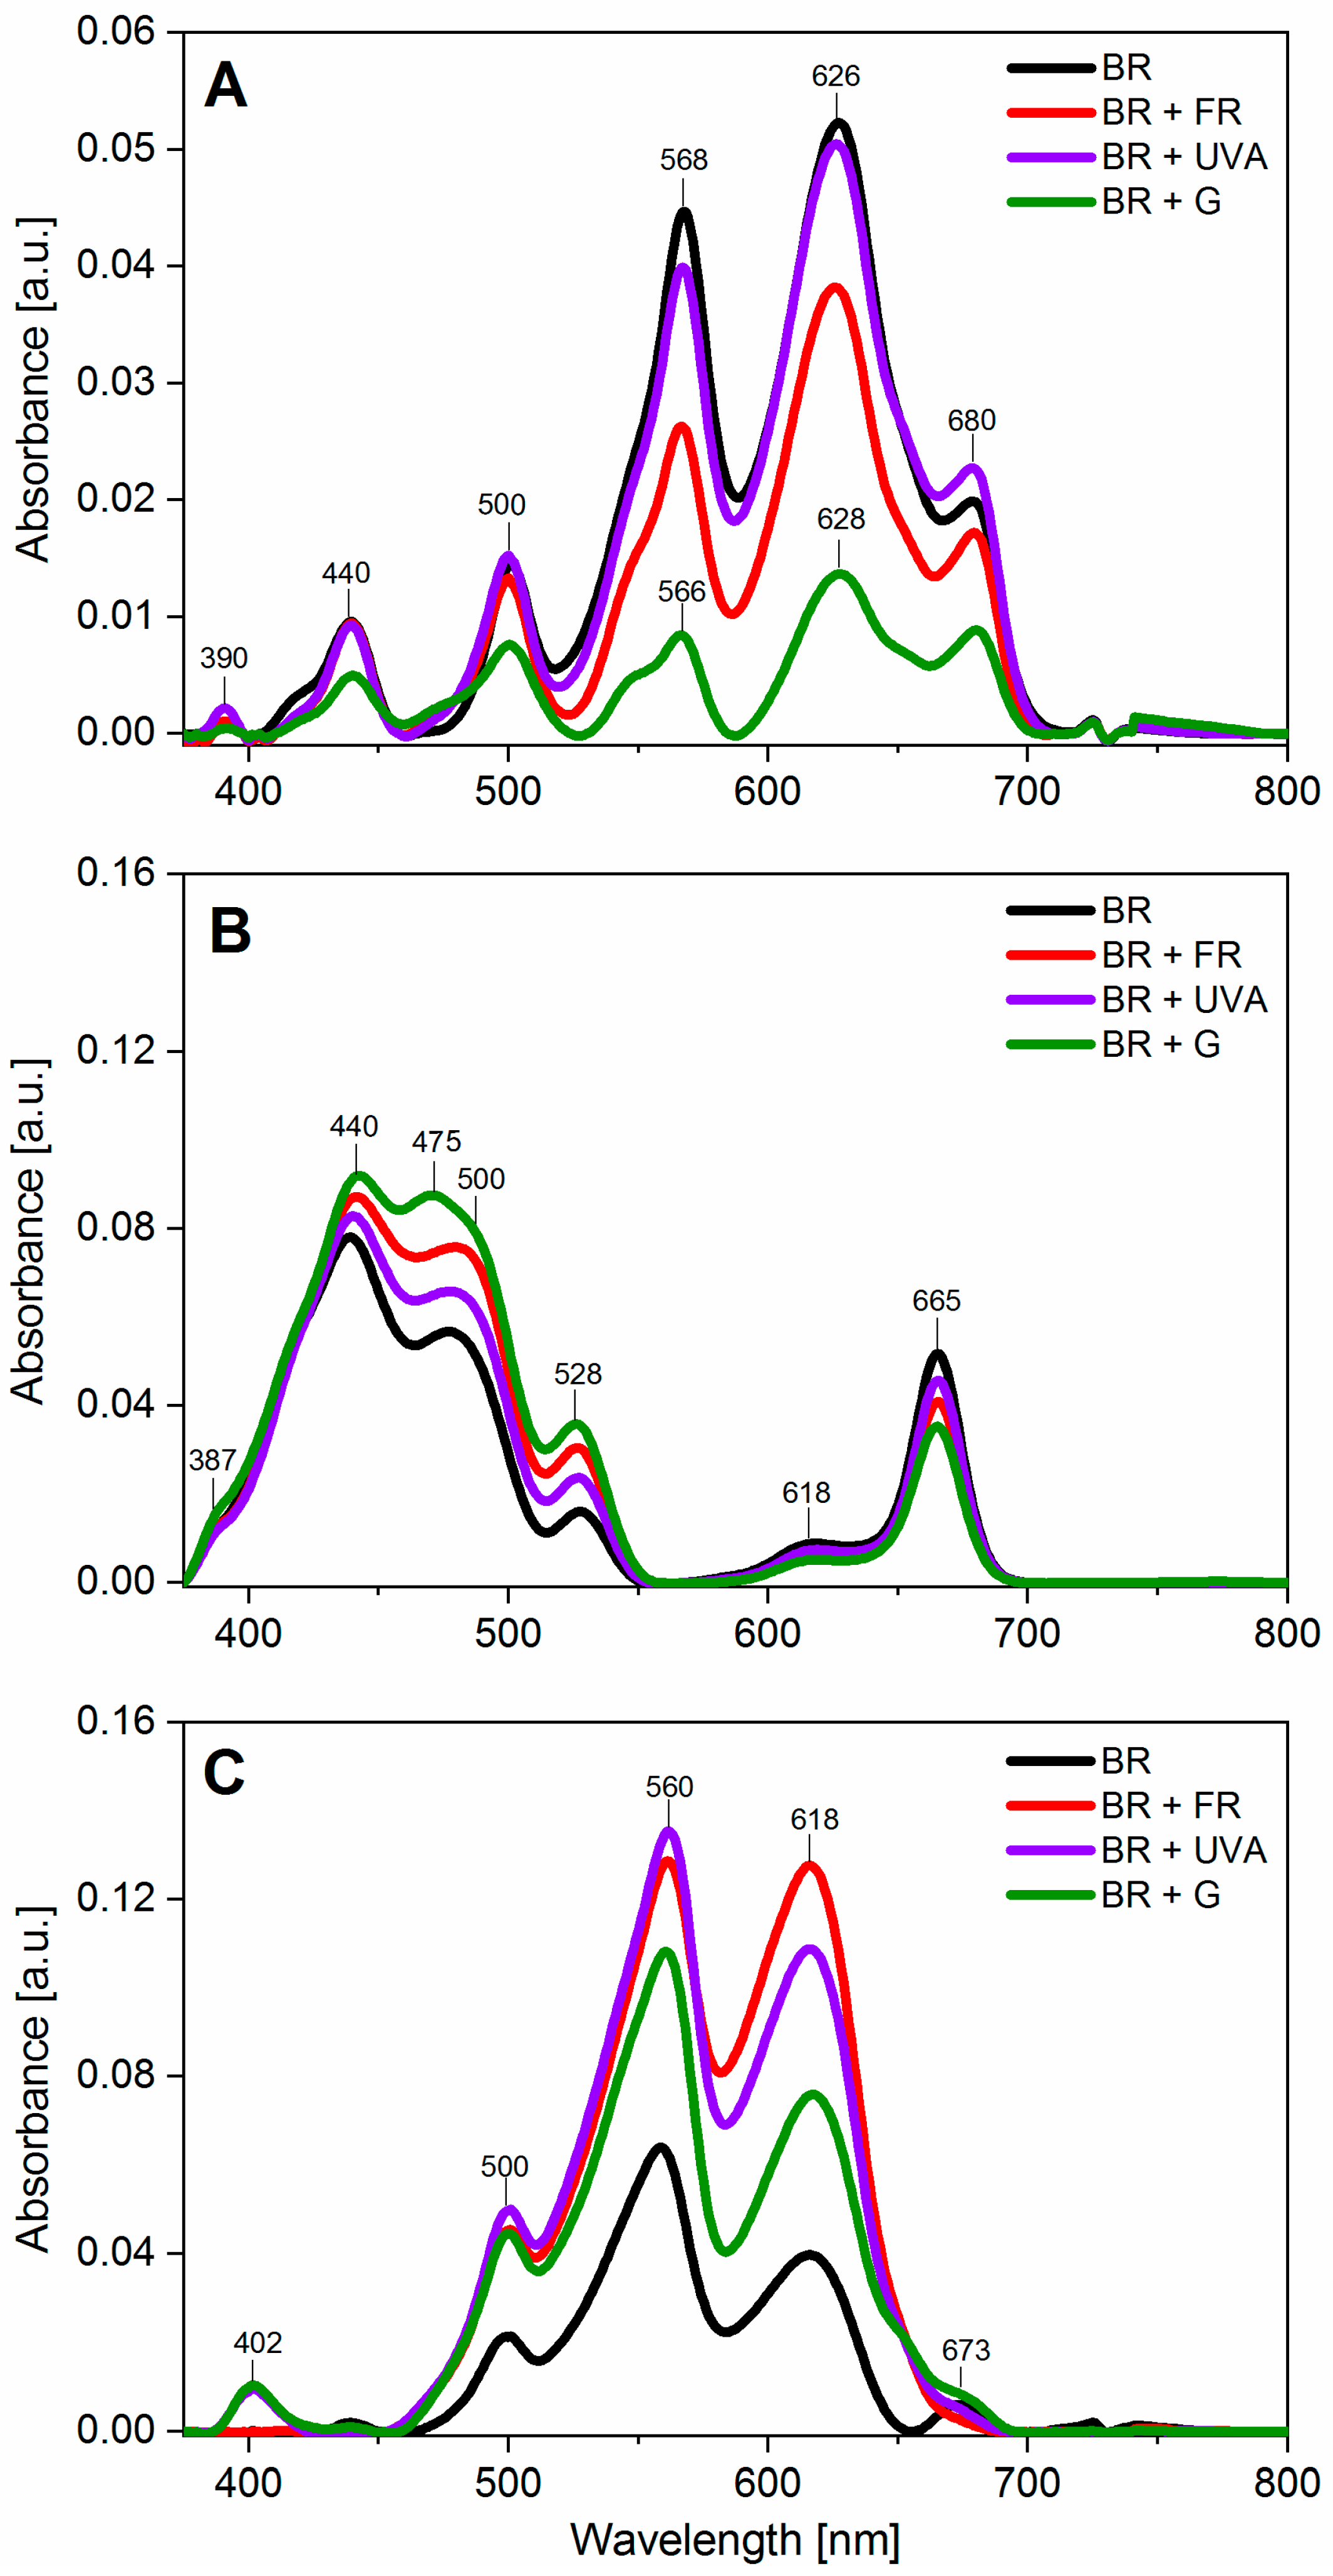
2.2. Light Conditions Modify Photosynthetic Pigments Content in Gloeobacter violaceus

In the initial exponential phase of growth (measured on the 10th day), there were no significant differences in the content of chl a. However, differences in the levels of car between the cultures grown under various light conditions were observed. Significantly higher amounts of car were found in cells grown under BR + FR and BR + G light compared to in cells grown in BR or BR + UVA (Figure 2A). The content of chl a was significantly lower in the cultures grown under BR + FR, BR + UVA, and BR + G light in comparison to BR light. The car content was significantly lower in the cells grown under BR + UVA light as compared to the cells grown under other light conditions (Figure 2B,C). Generally, in the entire growth period, the content of chl a and car decreased with the span of the culture, independently of the spectral composition of light.
Differences in the content of phycobiliproteins were found, and they were dependent on the light wavelength. The most visible changes were observed in the content of C-PC and C-PE, which are the main phycobiliproteins of G. violaceus [38,39]. The growth phase was not related to the level of APC, while the spectral composition of light affected the APC content (Figure 2D–F). At the beginning of the exponential growth phase, on day 10, the number of cyanobacterial cells was low regardless of the light spectrum. In the cells grown under BR + G and BR + FR light, a significantly lower content of C-PC and APC, respectively, in comparison to other tested light conditions was found (Figure 2D). A distinct increase in the amount of C-PC and C-PE was observed in the cells grown under BR + FR, BR + UVA, and BR + G light on the 25th day of cultivation. However, similar changes were not observed in the cells grown under BR light. Such a large content of the main phycobiliproteins may indicate intensive light harvesting and energy transfer to PSII reaction center (RC), and thus, the achievement of the highest growth rate (Figure 2E). At the end of the exponential growth phase (day 30), there was still significantly more C-PC and C-PE than in the cells grown only under BR light (Figure 2F). The higher content of APC was found in the cells grown under BR + G light in comparison to G. violaceus grown under the other spectral regions of used light (Figure 2F).
The spectrum of live cell cultures in the medium was characterized by higher absorbance intensities ranging from 390 to 680 nm (Figure 3A). The absorption spectra were characterized by six peaks in all cultures. The intensity of these peaks depended on the spectral composition of light used in the culture. These peaks originated from car (390 nm), chl a (440 nm), and phycobiliproteins (500, 568 and 618 nm), but the peak at 680 nm was the result of the overlap of the chl a and phycobiliprotein bands. The spectra indicated that phycobiliproteins dominated in G. violaceus, while chl a and car were present to a smaller extent (Figure 3A). G. violaceus from BR and BR + UVA light showed a typical absorption spectrum with the predominance of absorbance range for phycobiliproteins, and lower absorbance for the chl a and car. The spectrum of the cultures grown under BR + FR and BR + G light was different than for BR. In these spectra, the ratio of the peaks’ intensity for phycobiliproteins of chl a and car was much smaller (Figure 3). The content of purified photosynthetic pigments enabled us to identify that the maxima of pigments in cell cultures were dependent on the spectral composition of light (Figure 3B,C). Chl a (440 and 665 nm) and car (387, 475, and 528 nm) bands were found in all cultures regardless of the light wavelength used in the G. violaceus culture.
In the case of the absorption spectra of the extracted phycobiliproteins, the intensities of the peaks were related to the spectral composition of light. However, independently of the spectral composition of light, in all cultures, there were peaks for phycourobilin (PUB) (500 nm), C-PE (560 nm), C-PC, and APC (618 nm). Moreover, the most likely gloeorhodopsin (GR), with a peak at 402 nm, was identified in the extracts from BR + UVA and BR + G light. A similar spectrum with a peak at 402 nm and 618 nm has been noted for one type of GR with a modified retinal analogue [40]. A peak at 673 nm, corresponding to APC, was visible only in the spectra from BR light, while in other cultures APC was the frame of the peak at 618 nm (Figure 3C).
For a more detailed analysis that concerns the occurrence of individual photosynthetic pigments, a deconvolution of the spectrum of the G. violaceus cultures from experimental light conditions was performed. As a result, the absorption spectrum of each of the cyanobacterial cultures was divided into six peaks characteristic to individual photosynthetic pigments (Figure 4). Moreover, an additional peak at 475 nm was identified in the spectrum of the culture grown under BR + G light (Figure 4D). The locations of six peaks were common to all tested cultures, regardless of the spectral composition of the light. However, their intensity was related to the light conditions of the culture growth (Figure 4). The identified peaks and their area are presented in Table 2. It was found that C-PC (peak at 628 nm) was the most abundant pigment in G. violaceus cells. However, the C-PC content in the cells grown under the BR + G light was much lower than in cyanobacteria from other cultures. It was noted that the increased contents of C-PE and GR pigments were in the culture grown under BR light, compared to cyanobacteria from BR + FR, BR + UVA, and BR + G light conditions. On the other hand, adding another wavelength to BR light increased the amount of R-phycoerythrin (R-PE), car, and GR if compared to their content under BR light only.

2.3. PSII Activity in Gloeobacter violaceus Is Affected by the Spectral Region of Light

2.3.1. OJIP Test

The fluorescence curve course (Vt) may allow for the evaluation of both photochemical and thermal phases of photosynthesis [43,44,45]. We can distinguish five main phases: the O-K, O-J, J-I, and I-P phase. In general, the curve shape course for G. violaceus was very similar to that observed for other cyanobacteria, algae, and higher plant leaves [46,47,48,49].
Based on the changes in the OJIP-test curves and the parameters of the kinetics of chl a fluorescence of cyanobacterial cultures, the comparison of changes in the flow of electrons between PSII and PSI in different phases of growth, as well as in terms of the spectral composition of light was performed. This allowed for evaluating the activity of the photosynthetic apparatus in G. violaceus. The differences in the electron transport efficiency (I-P curve, ψEo) and the number of electrons on the acceptor side of PSII (J-I curve, φEo), dependent on the growth phase and spectral composition of light, were observed (Figure 5 and Figure 6).
The decrease in the number of electrons transported from quinone A (QA) to quinone B (QB) on the acceptor side of PSII, observed as an increase in the J-I curve, was found in the cultures grown under BR + FR and BR + G light during the adaptation phase (day 10). This indicates a decrease in the electron flow from PSII to PSI. Moreover, the relationship is shown as positive values on the ΔVt plots in the J-I phase (Figure 5D). In the exponential phase of growth (day 25), there was an increase in the electron transport efficiency in the cultures grown under BR + FR, BR + UVA, and BR + G light compared to the cultures grown under BR light, while the electron transport was still reduced in cyanobacteria grown under BR + FR light (Figure 5E). In the last stationary phase of growth (day 30), in the culture grown under BR + UVA light, a reduction in electron flow was observed, i.e., thus, the efficiency of electron transport from PSII to PSI decreased compared to the exponential phase of growth of the cultures from other light conditions (Figure 5F). The cyanobacteria from BR + FR and BR + G light showed the highest efficiency of PETC.
The I-P phase on the ΔVt curve showed large differences in the course of the curve depending on the phase of growth and the spectral composition of light (Figure 5D–F). In phase I-P, the negative values of ΔVt indicate more NADP + molecules per active RC, and an increased pool of plastoquinone (PQ). This result suggests a compensatory mechanism in response to altered light conditions. Positive values of ΔVt in the I-P phase were found in the cultures grown under BR + FR, BR + UVA, and BR + G light, and were slightly decreased under BR + UVA light (Figure 5E,F). This implicates a reduced pool of PQ and suggests an adaptation of G. violaceus to light conditions, which in turn contributed to more efficient photosynthesis that led to a greater increase in biomass in the BR + FR, BR + G, and BR + UVA cultures (Figure 1). Moreover, it should be noted that the appearance of the K point on the ΔVt curve in the O-K phase indicates a disturbance in the oxygen-evolving complex and an occurrence of stress conditions [46,50]. It is worth emphasizing that the K point appeared in the culture grown under BR + FR light only for the exponential growth phase (Figure 5E,F), when the culture showed a large increase in biomass (Figure 1).
The determined fluorescence parameters describing the quantum yield and energy flow through the RC showed significant differences in the functioning of the photosynthetic apparatus of G. violaceus depending on the phase of growth and the light growth conditions. Most determined fluorescent parameters for cyanobacteria cultured in BR light (control), in days 10, 25, and 30, were increased, which indicates the induction of PSII efficiency in G. violaceus (Figure 6 and Supplementary Materials Table S1). Elevated activity of PSII in BR light was also reflected in the biomass increase.
It should be noted that the majority of values of the measured parameters increased with the proliferation of cyanobacteria in the cultures (Figure 1). On the 10th day of culture, a decrease in the values of Fv/Fm, Fv/Fo, φEo parameters in the cells grown under the BR + FR and BR + G light was found compared to the values for the cells grown under the BR light only. Aside from that, on day 25 and 30, the values of Fo/Fm and M0 increased in the cells grown under BR + FR and BR + G light (for BR + G only in day 25) in comparison to BR light (control). The increase in these parameters indicates a disturbance of the PSII efficiency and the occurrence of stress in these cultures already in the adaptation phase of growth (day 10) (Figure 6). In the exponential phase of growth (day 25), multiple changes in PSII functioning were found in the cultures grown under BR + FR, BR + UVA, and BR + G light, and they affected the increase in the biomass of these cultures. In the exponential phase of growth, the values of the Fo/Fm, Vj, M0 parameters increased, while the value of quantum electron transport efficiency (φEo) decreased in the cultures from BR + FR and BR + G light in comparison to the control (Figure 6). Moreover, there was a decrease in the values of the Fv/Fm and Fv/Fo parameters in cells grown under BR + FR and BR + G light. A higher index of the rate of closure of RCs (Vj), an increase in the net rate of QA reduction (M0) as well as the major dissipation of non-captured energy as heat and/or fluorescence (DIo/RC), indicate altered PSII performance in these cultures. Despite the disturbance of PSII functioning, these cultures were characterized by a large increase in biomass, which may indicate the operation of a different compensation process or the choice of a different way of electron transport than by PSII (day 25) (Figure 6). In the stationary phase of growth (day 30) under BR + FR, BR + UVA, and BR + G light, a significant increase in the biomass of G. violaceus cultures was observed, which was also related to the elevated values of most of the analyzed fluorescent parameters in comparison to the culture grown under BR light. Only the value of φEo was unchanged in the culture grown in BR + FR light compared to the other cultures (day 30) (Figure 6).

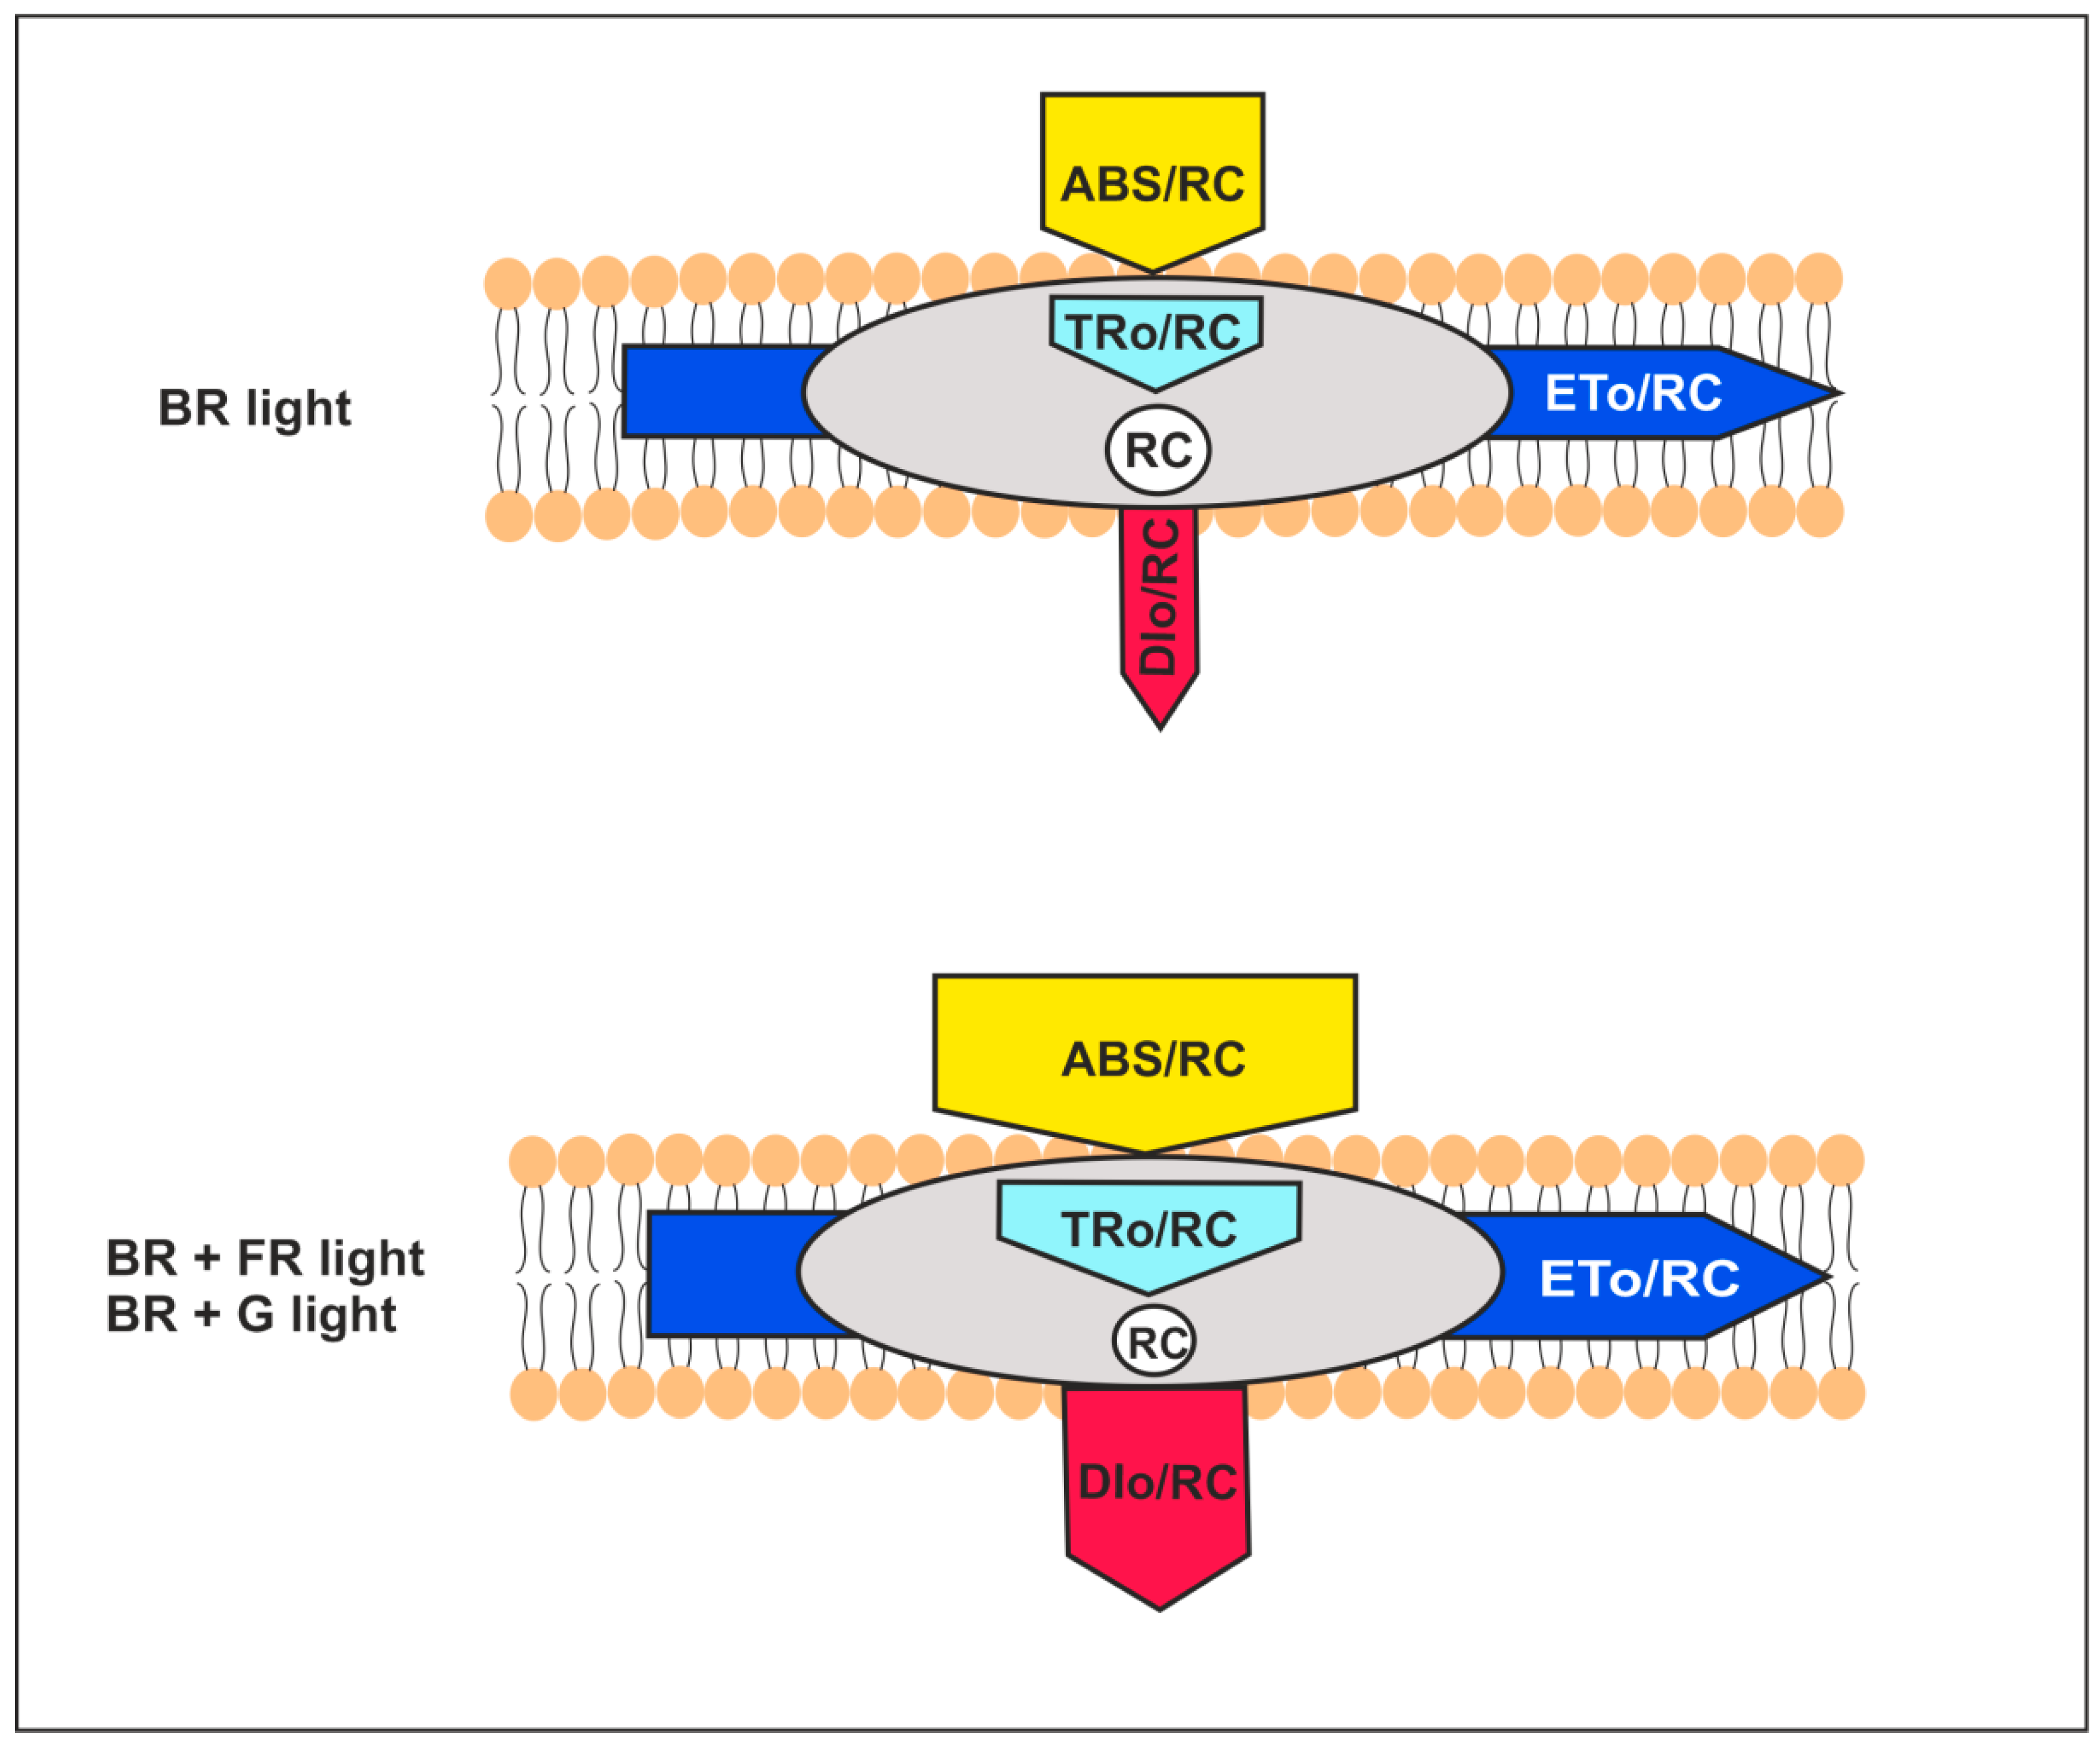
2.3.2. The Energy Flux Pipeline Model

Among the various fluorescent data analyzed here, interesting changes were observed for parameters linked to energy fluxes in PSII. For day 30, we used the pipeline model to visualize the energy fluxes modified by the light environment (Figure 7). The width of the arrows reflects the values of selected energy flux parameters collected based on the data presented in Figure 6 and Supplementary Materials Table S1.
DIo/RC, a part of the flux of light excitation energy dissipated mainly as heat per RC and ABS/RC that is the measure of the average antenna size [46,51], increased on days 25 and 30 in all light conditions, in comparison to BR (control); an exception is the ABS/RC value on day 30 for BR + UVA (Figure 6 and Supplementary Materials Table S1). The model for day 30 indicates that G. violaceus exposed predominantly to BR + FR, and BR + G increased both the average antenna size and energy dissipation as indicated by elevated values of ABS/RC and DIo/RC, respectively. ABS/RC and DIo/RC were not changed in BR + UVA G. violaceus samples, while TRo/RC and ETo/RC values were increased for all light conditions on day 30 (Figure 6 and Supplementary Materials Table S1). Moreover, the increase in antenna size was related to the decrease in chl a content, while C-PC and C-PE in PBSs increased in BR + FR, BR + UVB, and BR + G samples. Most likely, the drop in the chl a content in RC induced changes related to the optimization of the G. violaceus light-harvesting system via an increase in antenna size (ABC/RC) based on the phycobiliproteins content in PBSs (Figure 2D–F, Figure 4C, Figure 6 and Figure 7).

2.3.3. Principal Component Analysis (PCA)

The results of the PCA analysis showed a positive correlation (r > 0.7) between chl a and APC, which were negatively correlated with the other tested phycobiliproteins (C-PC and C-PE), and photosynthetic parameters: TRo/RC, ABS/RC, DIo/RC, Vj, and M0 (Figure 8). Moreover, the highest values of chl a and APC were found in G. violaceus on the 10th day of culture, regardless of the spectral composition of light, and in the following phases of growth (day 25 and 30) in the cyanobacteria from BR light only (Figure 8). Additionally, a positive correlation between C-PC and C-PE (r > 0.96) was found. However, a low positive correlation (r > 0.4) between these two pigments (C-PC and C-PE) and some of the photosynthesis parameters, such as TRo/RC, ABS/RC, DIo/RC, Vj, and M0, was observed. The highest contents of C-PC and C-PE were found in the cultures grown under BR + UVA light. However, their levels decreased in the cultures from BR + FR and BR + G light on day 25 in comparison to the control (BR) (Figure 8). On the 30th day of culture, the highest values of TRo/RC, ABS/RC, DIo/RC, Vj, and M0 parameters were found in G. violaceus grown under BR + FR light compared to other cultures (Figure 6—30th day BR + FR). It was also observed that the photosynthetic parameters i.e.: Fv/Fo, Fv/Fm, ETo/RC, φEo, and ψEo, were negatively correlated with the other parameters and with photosynthetic pigments. However, Fv/Fo, Fv/Fm, ETo/RC, φEo, and ψEo showed a very strong positive correlation with each other (r > 0.9). It should be noted that their highest values were found in the cyanobacteria grown under BR + UVA and BR + G light on the 30th day of culture (Figure 8).

3. Discussion

The occurrence of cyanobacteria in various habitats indicates their high adaptability to changes in the environment. Light is an important factor influencing the proper growth of cyanobacteria. The light is absorbed by the photoreceptors, which combine light signals with oxygenic photosynthesis and other metabolic pathways [52,53,54]. In cyanobacteria, there are two specific aspects of the light-dependent processes. The first concerns the role of different wavelengths of light on the biosynthesis of PBS. The second feature refers to how cyanobacteria adjust light harvesting and the functioning of the photosynthetic apparatus to the light intensity and its wavelength [10,15,55,56].

3.1. The Spectral Composition of Light Affects the Growth of Gloeobacter violaceus

The colonization of limestone rock and alkaline substrates [11,57] and an unusual structure of the photosynthetic apparatus may suggest different preferences of G. violaceus for the spectral composition of light than other cyanobacteria living in typical aquatic environments. The first studies concerning G. violaceus and light conditions were carried out with the filters passing a specific light [31]. Currently, for research on the influence of monochromatic light on growth and development of plants, algae, and cyanobacteria, specially dedicated monochromatic lamps based on the LED technology are used [58]. Our research has shown that the spectral composition of light significantly affected the growth of G. violaceus, and its shape. In natural conditions, G. violaceus cells reach the size of 0.6–1.8 μm in diameter and 1.2–8.6 μm in length [5,31,59], and it is in the range reported in our studies (Table 1). According to Mareš et al. (2019), phylogenetically old cyanobacteria like G. violaceus usually have small dimensions, and the cells with a diameter ca. 2 μm represent a physiological limitation to packing entire thylakoid structures. Light-dependent changes in cyanobacterial shape have been reported previously [60]. For example, in the filamentous cyanobacterium, Fremyella diplosiphon, more spherical and shorter cells were observed in red light, whereas rectangular and longer cells were related to the growth in green light [61]. We can speculate that the more flattened and ellipsoidal G. violaceus cells in BR + G light are a form of adaptation to maximize the green light penetration through the cell and its harvesting by photosynthetic apparatus.

3.2. Light Wavelengths Modify Pigments Content in Gloeobacter violaceus

PBSs, as a key light-harvesting structure, are not a part of the chl-binding proteins of PSII core but perform a crucial role in photosynthesis of cyanobacteria. It has been observed that the content of chls in algae and cyanobacteria decreases with the age of cells, as well as with the high light intensity [62]. When the light and thermal conditions are optimal for photosynthesis, the amount of organic compounds increases faster than the content of chl, and therefore the content of chl in the biomass decreases [63]. The previous studies showed that under red light (640 nm), PC and APC content was increased, while for the cells grown under green light (550 nm), the level of PC decreased but of PE increased [15]. It is believed that the light conditions affect the photoreceptors controlling the complementary chromatic adaptation (CCA) in cyanobacteria [10]. CCA photoreceptors absorb in the red and green range of photosynthetically active radiation (PAR) but demonstrate different responses to these light wavelengths. In red light, PC biosynthesis prevails, while in green light, PE production is dominant. Exposure of cells to natural sunlight, which is a mixture of different wavelengths of light (including green and red colors), causes the synthesis of phycobiliproteins with an intermediate content of PC and PE [10,31,64]. Here, we demonstrated different amounts of photosynthetic pigments depending on the spectral composition of light and the phase of G. violaceus growth (Figure 2). This indicates a light-dependent adaptation of G. violaceus photosynthesis. A clear role of the culture age in the level of phycobiliproteins (C-PC and C-PE) was also found. Their decreased content may suggest a slowdown of photosynthesis and cell growth as a result of cells competition for light [10]. Moreover, the pigment content may also vary depending on the phase of growth and the growth conditions as a result of reaching the limit of nutrients [10,65,66]. Another indicator of light-induced changes in the G. violaceus metabolism was the absorption spectrum of G. violaceus cultures (Figure 3). The obtained spectra confirmed the occurrence of main, previously characterized pigments and pigment-protein complexes: phycobiliproteins chl a and carotenoids [11,15,30,31,39,42].

3.3. The Activity of PSII in Gloeobacter violaceus Depends on the Spectral Region of Light

Previous studies have shown that the content of phycobiliproteins has also a significant impact on the fluorescence yield of PSII, the composition and organization of the antenna rods in cyanobacteria [2,3,67,68,69]. Measurements of chl a fluorescence are also used in cyanobacteria to monitor PSII efficiency in various stressful conditions [70,71,72,73,74,75,76]. To our knowledge, chlorophyll fluorescence transients are not sufficiently recognized in G. violaceus. A frequently used parameter to evaluate the functioning of the photosynthetic apparatus is Fv/Fm. In cyanobacteria, this parameter is much lower than in terrestrial plants or algae. This is due to the different structures of photosynthetic antennae (PBS) and the lack of chlorophyll b in most cyanobacteria. Bernát et al. (2012) showed that the Fv/Fm parameter ranged from 0.2 to 0.6 depending on the light intensity and temperature conditions in G. violaceus, and they are within the range of Fv/Fm described for Synechococcus sp. PCC 6301 and the values obtained in the present work (Figure 6) [27,68]. Moreover, the study of six cyanobacteria species showed that Fv/Fm (0.6–0.7) was higher in marine cyanobacteria with a low PBS to chl ratio in comparison to freshwater cyanobacteria (Fv/Fm 0.5–0.6), which had a higher PBS to chl ratio [77]. These varied results of the Fv/Fm parameter allow for observing how this parameter can differ depending on the strain and living conditions. Cyanobacteria can change the amount of energy transfer from PSII to PSI. This depends on the spectral composition of the light which affects the production of PBSs [78]. Blue light causes the extinction of energy in the PSI, while the G and FR lights generate energy without losses when moving from PBS to chl in RC. However, but the fastest transfer of energy was in the cells grown under yellow light [78]. In cyanobacteria, PETC depends on the spectral composition of light. For example, the PSII quenching analysis showed that energy captured by C-PE is transferred from the PBS to the PSI to keep the balanced electron transport when the Calothrix sp. PCC 7601 strain is grown under G light [8,79].
The general demonstration of the excitation energy fluxes per RC in PSII is shown in the pipeline model (Figure 7). In Spirodela polyrhiza, under Cr stress conditions, an increase in antenna size (ABS/RC) has been linked to a simultaneous decline in chl content and an increase in the energy flux used in PSII photochemistry (TRo/RC, ETo/RC) [80]. The increase in the average antenna size in G. violaceus is due to inactivation of some RCs linked to the depletion of chl a content in RCs, and that most likely is a result of the increasing size of PBSs, which is in line with increasing dissipation of total energy per RC (DIo/RC). However, unlike in S. polyrhiza, the specific energy fluxes per RC for trapping (TRo/RC) and electron transport (ETo/RC) in PSII of G. violaceus were increased. Additionally, it cannot be excluded that ETo/RC increased due to thermal activation of the dark reactions [46]. Moreover, in S. polyrhiza, the Cr-induced increase in ABS/RC has been related to the inhibition of growth [80]. In contrast to this, the enlarged antenna size of PSII in G. violaceus cultured in BR + FR and BR + G light did not change or even induce PSII efficiency (ψEo, φEo). In the same light conditions, the largest increase in biomass was observed (Figure 1). It cannot be excluded that the increased electron transport (ETo/RC, ψEo, φEo) also affects PSI activity and the generation of metabolic energy via cyclic electron transport, especially under BR + FR light conditions. The obtained data indicate that the spectral properties of light strongly affect PETC in PSII of G. violaceus, which is clearly different than in plants.
However, an additional source of energy needed for growth might also be derived from other light-dependent metabolic energy generating systems. The largest biomass growth was found for cyanobacteria grown under BR + FR and BR + G light. It suggests that G. violaceus photosystems absorb in the red and green PAR regions, and the production of ATP, driven by proton (H+) gradients, is also established by the cell membrane-located GR [42,81]. Several studies have documented that the presence of rhodopsin in some microorganisms supports their growth and/or survival under stress conditions, as well as participates in various physiological processes [82,83,84,85,86,87,88,89]. Thus, rhodopsin can compensate for the poor production of energy from PETC by creating an additional proton gradient in the periplasm. According to this model, G. violaceus transforms light energy into a proton driving force using phycobilin and GR [42]. Vogt et al. (2013) described that the function of rhodopsin can maintain a temporary membrane tension when photosynthesis is not based on chl [90]. It allows for assuming that the GR-based proton pump was activated in G. violaceus grown under BR + FR and BR + G light.

4. Materials and Methods

4.1. Cyanobacteria

The strain Gloeobacter violaceus (CCALA 979) was purchased from the Culture Collection of Autotrophic Organisms (CCALA) of Institute of Botany from University in Prague (Czech Republic). This strain is an ecotype of the reference strain G. violaceus PCC 7421 [33].

4.2. Growth Conditions
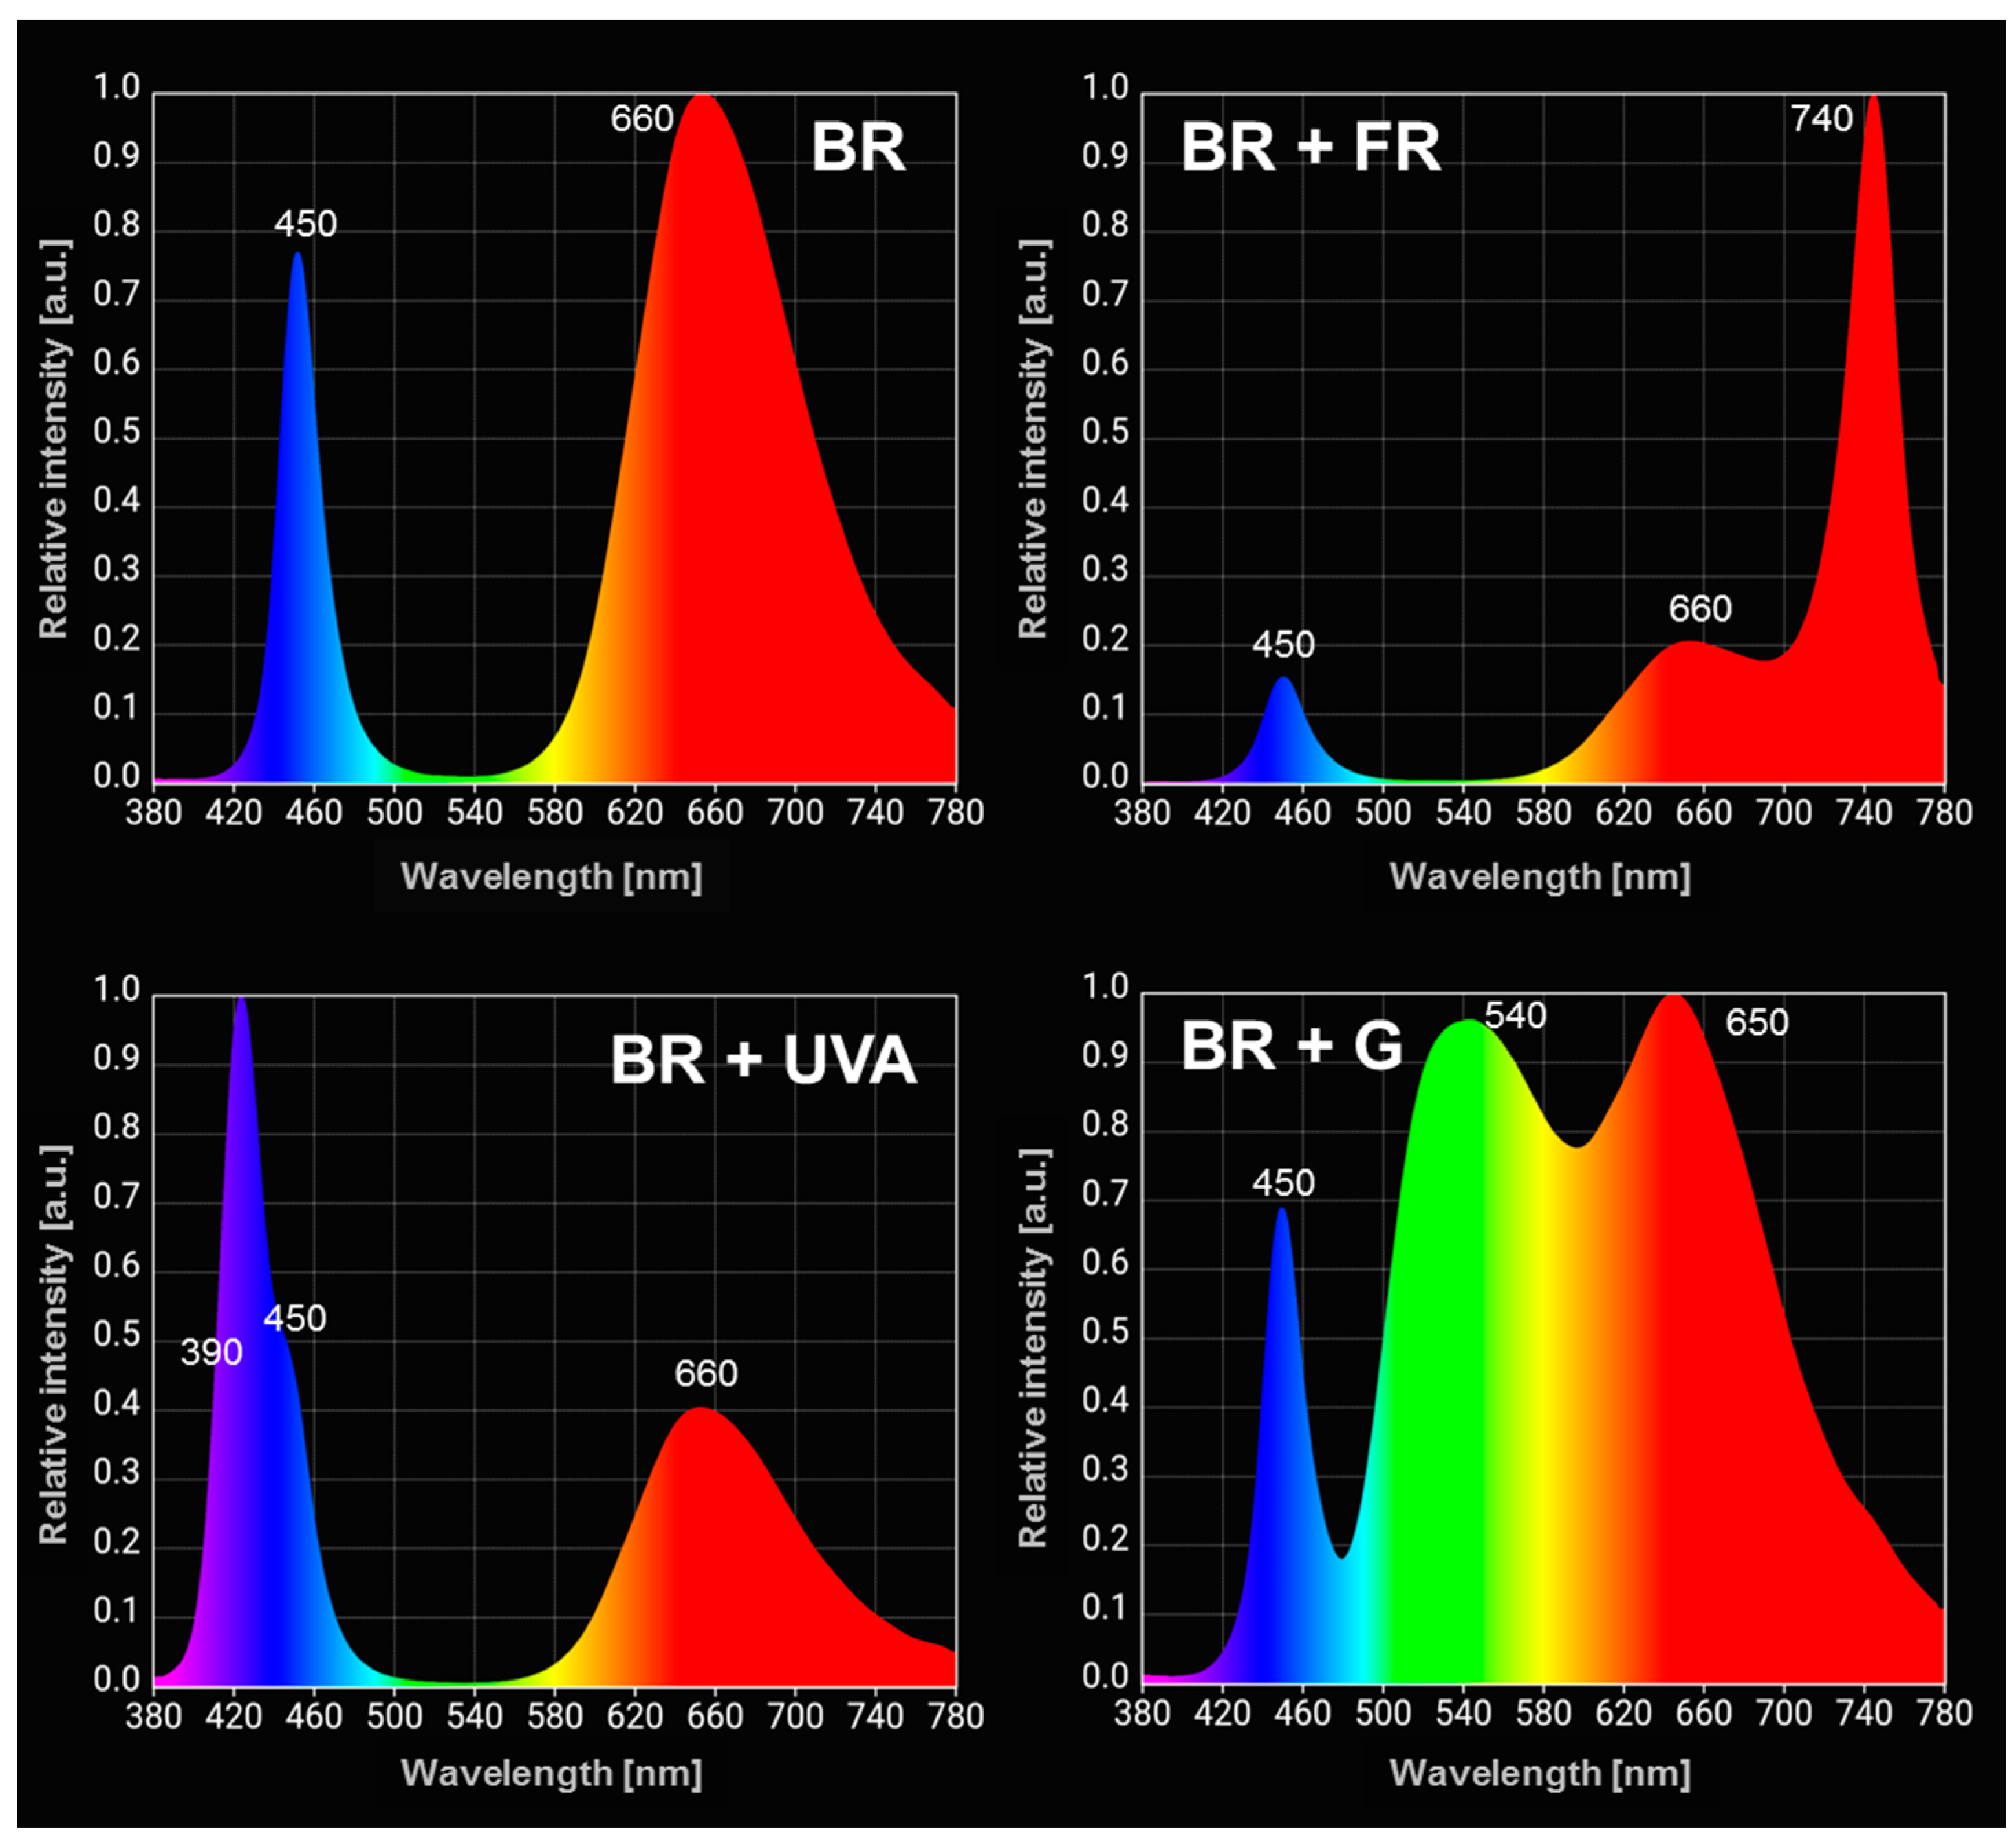
G. violaceus was cultivated on the BG11 medium [91] in 500 mL Duran bottles (with 400 mL working volume). The bottles and medium were sterilized by autoclaving (121 °C, 21 min). After autoclaving, the medium was adjusted to pH = 7.5. The bottles were bubbled with air using a membrane aquarium pump (SERA Air 550 R Plus, Heinsberg, Germany). For the culture, 400 mL of medium was used, to which 16 mL of the cyanobacterial suspension was added. The cultures were grown for 30 days at 25 ± 1 °C at a photoperiod of 16/8 h (light/dark).

4.3. Light Sources

Light sources based on light-emitting diodes (LEDs) with different spectral light compositions were used. An LED lamp with a maximum wavelength in the blue (440 nm) and red (660 nm) region of the spectrum was applied as a control light (BR). The BR lamp was the basis for the construction of lamps with the addition of a different wavelength of light. The next lamps consisted of the BR lamp with the addition of a wavelength in another region of the spectrum, i.e., the BR + far-red (FR) lamps with an additional wavelength in the FR spectrum region (740 nm), BR + ultraviolet A (UVA) with the UVA spectrum region (390 nm), and BR + green (G) with the green region (550 nm) of visible light. The spectral composition of individual LED lamps is shown in Figure 9. The light intensity was adjusted to the level of 70 µmol photons m−2 s−1, regardless of the spectral composition of the LED lamps.
The light intensity was measured in three various places at the surface of culture bottles using the Asensetek Lighting Passport Spectrometer (New Taipei City, Taiwan).

4.4. Determination of Biomass Growth

The growth rate of G. violaceus biomass was determined based on the optical density (OD) of the culture. OD was measured as the absorbance of the cell suspension at 730 nm on a microplate reader (Synergy 2, BioTek, Winooski, VT, USA). Medium BG11 was used as a blank.

4.5. Size of Gloeobacter violaceus Cells

The size of the cells was measured using a scanning electron microscope (SEM), which overview is presented in Figure S2. Minor and major cell axes were measured to visualize the shape of the cells. The minor cell axis is the perpendicular length between the cell cavity and its end (a), while the major cell axis is the length along the cell (b) (Table 1). The ratio of axis a to axis b indicates whether the cell has the shape close to a sphere (ratio ~ 0.8–1.0) or an ellipse (ratio < 0.7). The cell shape model was performed by CorelDraw 2020 program.

4.6. Content of Photosynthetic Pigments in the Gloeobacter violaceus Culture

4.6.1. Chlorophyll and Carotenoids

The content of chlorophyll a (chl a) is only presented due to the absence of chlorophyll b (chl b) for most of the cyanobacteria [92]. According to Herrmann and Gehringer (2019) [38] G. violaceus possess only chl a. Determination of chl a and carotenoid (car) contents in the G. violaceus biomass was performed according to the method of Leu and Hsu (2005) [93] by using the equations proposed by Liechtenthaler (1987) [94].
chl a =16.72 × A665 − 9.16 × A652 (µL·mL−1)
car = (1000 × A470 − 1.63 × chl a)/221 (µL·mL−1)
A total of 2 mL of pure methanol was added to the centrifuged pellet of the sample. The samples were homogenized for 5 min in an ultrasonic bath, incubated at 60 °C for 40 min, and then transferred to 0 °C for 15 min. Then, the contents of chl a and car were determined spectrophotometrically based on absorption values at 470 (A470), 665 (A665) and 652 (A652) nm. The content of the pigments was normalized into OD730 nm of the culture on a given day.

4.6.2. Phycobiliproteins

To extract phycobiliproteins from G. violaceus, the biomass was lyophilized for 48 h and then the cells were mechanically disrupted in the tissulizer (Retsch, MM400). A total of 2 mL of sodium phosphate buffer (0.1 mM, pH 7) [95] was added to the biomass and homogenized for 5 min in an ultrasonic bath. After this, the samples were centrifuged for 15 min at 4 °C at 4300× g (Hettich). The content of phycobiliproteins: phycocyanin (C-PC), allophycocyanin (APC), and phycoerythrin (C-PE), in the supernatant was determined by the absorbance at wavelengths: 620 (A620), 652 (A652), and 562 (A562) nm [96]. The content of phycobiliproteins was normalized into the OD730 nm of the culture.
Phycobiliproteins concentration was calculated according to the equations by Bennett and Bogorad (1973) [96]:
C-PC = (A620 − 0.474 × A652)/5.34 [mg mL−1]
APC = (A652 − 0.208 × A620)/5.09 [mg mL−1]
C-PE = (A562 − (2.41 ∗ C − PC) − (0.849 × APC))/9.62 [mg mL−1]

4.7. Absorption Spectroscopy

The absorption spectra of the G. violaceus suspension and extracted photosynthetic pigments were determined with a JASCO V-630 spectrophotometer UV-VIS with Spectra Manager™ CFR software. The cells were collected directly from the culture, while the photosynthetic pigments (phycobiliproteins, chlorophyll, and carotenoids) were extracted as described above. The measurement was performed in a quartz cuvette in the range of 375 to 800 nm with a scanning speed of 400 nm/min. Spectra deconvolution was performed with the normalization to the largest peak (628 nm) and then the Lorenz components were fitted. For the spectra analyses, OriginLab 2020 software was used.

4.8. Photosystem II Activity

PSII photochemical efficiency of G. violaceus was determined by the fast fluorescence method. The chl a fluorescence parameters were measured using a Handy Plant Efficiency Analyzer apparatus (Handy PEA, Hansatech Instruments, King’s Lynn, UK) with an adapter used for liquid samples at room temperature. The sample was illuminated with a red light saturating flash of 3500 μmol photons m−2 s−1 with a 637 nm peak wavelength. A total of 2 mL of cell suspension—collected directly from the cultures—was added to the measuring cuvette. The measurements were performed after 6 min adaptation of the sample to the darkness. Adaptation time was optimized experimentally before the start of the experiments. Kinetic fluorescence parameters were recorded within the range of 10 µs to 1 s. The analyses of the relationship between the structure and function of PSII and the assessment of the vitality of G. violaceus were based on the OJIP test [7,8,62,76,97,98]. The list of analyzed fluorescence parameters is shown in Table 3 [46,99,100,101]. The fluorescence parameters and OJIP curves were normalized to the content of chl a.

Principal Component Analysis

To show the more complex correlation between chl a fluorescence parameters and photosynthetic pigments in the cultures of G. violaceus grown under different spectral compositions of light, a principal component analysis (PCA) was performed. OriginLab software was used to draw the charts.

4.9. Statistical Analysis

The results presented in the study represent the means of four independent biological repetitions. The comparison of the significance of differences in mean values between objects was performed using the Tukey’s HSD test procedure at the level of significance: p ≤ 0.0001 (***), p ≤ 0.001 (**), and p ≤ 0.01. The statistical analysis was performed using GraphPad v. 7.01 and OriginLab 2020 programs.

5. Conclusions

The study emphasized a significant effect of FR and G light on the growth of the G. violaceus cultures. Based on the quantitative analyses of phycobiliproteins content and PETC carried out in this study, it can be assumed that both the spectral composition of light and age of the cyanobacterial culture affect the level of C-PC and C-PE in the PBS rode. The contents of C-PC, C-PE, and APC are related to the light wavelength absorbed by phycobiliproteins. Moreover, the modification of the shape of G. violaceus cells under G light suggests a morphological adaptation of this cyanobacteria species to the changing light environment. Most likely, BR + FR and BR + G light also influence the PBS-based antenna, PSII efficiency, and GR-related generation of metabolic energy. For further studies, deeper structural analyses of PBS isolated from G. violaceus grown under different spectral compositions of light are needed.

Supplementary Materials

The following are available online at https://www.mdpi.com/article/10.3390/ijms22084021/s1, Figure S1: The 30-day growth of the cultures in Erlenmeyer flasks under different light conditions, Figure S2: SEM overview of Gloeobacter violaceus culture grown under BR light (A), BR + FR light (B), BR + UVA light (C), and BR + G light (D), Table S1: Chlorophyll a fluorescence parameters of Gloeobacter violaceus from different spectral compositions of light and days of culture.

Author Contributions

Conceptualization, M.K.-M. and I.Ś.; methodology, M.K.-M. and I.Ś.; investigation, M.K.-M. and K.J.Z.; data curation, M.K.-M. and I.Ś.; writing—original draft preparation, M.K.-M.; writing—review and editing, M.K.-M. and I.Ś.; visualization, M.K.-M.; supervision, I.Ś. All authors have read and agreed to the published version of the manuscript.

Funding

This manuscript received no external funding.

Institutional Review Board Statement

Not applicable.

Informed Consent Statement

Not applicable.

Data Availability Statement

Data sharing not applicable.

Acknowledgments

The authors acknowledge Magdalena Parlińska-Wojtan for allowing the use of Scanning Electron Microscope located at the Institute of Nuclear Physics Polish Academy of Sciences.

Conflicts of Interest

The authors declare no conflict of interest.

Abbreviations

APCallophycocyanin
B-PEB-phycoerythrin
C-PCphycocyanin
C-PEphycoerythrin
carcarotenoids
chlchlorophyll
chl achlorophyll a
chl bchlorophyll b
GAFcGMP-specific phosphodiesterases/cyanobacterial adenylate cyclases/FhlA domain
GRgloeorhodopsin
PASPer/ARNT/Sim domain
PHYphytochrome-specific domain
PUBphycourobilin
RCreaction center
R-PER-phycoerythrin

References

  1. Krogmann, D.W.; Pérez-Gómez, B.; Gutiérrez-Cirlos, E.B.; Chagolla-López, A.; González De La Vara, L.; Gómez-Lojero, C. The presence of multidomain linkers determines the bundle-shape structure of the phycobilisome of the cyanobacterium Gloeobacter violaceus PCC 7421. Photosynth. Res. 2007, 93, 27–43. [Google Scholar] [CrossRef]
  2. Tamary, E.; Kiss, V.; Nevo, R.; Adam, Z.; Bernát, G.; Rexroth, S.; Rögner, M.; Reich, Z. Structural and functional alterations of cyanobacterial phycobilisomes induced by high-light stress. Biochim. Biophys. Acta Bioenerg. 2012, 1817, 319–327. [Google Scholar] [CrossRef]
  3. Zlenko, D.V.; Krasilnikov, P.M.; Stadnichuk, I.N. Structural modeling of the phycobilisome core and its association with the photosystems. Photosynth. Res. 2016, 130, 347–356. [Google Scholar] [CrossRef] [PubMed]
  4. Zlenko, D.V.; Galochkina, T.V.; Krasilnikov, P.M.; Stadnichuk, I.N. Coupled rows of PBS cores and PSII dimers in cyanobacteria: Symmetry and structure. Photosynth. Res. 2017, 133, 245–260. [Google Scholar] [CrossRef] [PubMed]
  5. Montejano, G.; Becerra-Absalón, I.; Gold-Morgan, M.; Osorio-Santos, K. Gloeobacter violaceus: Primitive reproductive scheme and its significance. Plant Syst. Evol. 2018, 304, 1221–1229. [Google Scholar] [CrossRef]
  6. Mareš, J.; Strunecký, O.; Bučinská, L.; Wiedermannová, J. Evolutionary patterns of thylakoid architecture in cyanobacteria. Front. Microbiol. 2019, 10, 277. [Google Scholar] [CrossRef]
  7. Strasser, R.J.; Srivastava, A. Govindjee Polyphasic chlorophyll a fluorescence transient in plants and cyanobacteria. Photochem. Photobiol. 1995, 61, 32–42. [Google Scholar] [CrossRef]
  8. Campbell, D.; Hurry, V.; Clarke, A.K.; Gustafsson, P.; Öquist, G. Chlorophyll fluorescence analysis of cyanobacterial photosynthesis and acclimation. Microbiol. Mol. Biol. Rev. 1998, 62, 667–683. [Google Scholar] [CrossRef] [PubMed] [Green Version]
  9. Kaňa, R.; Prášil, O.; Komárek, O.; Papageorgiou, G.C. Govindjee Spectral characteristic of fluorescence induction in a model cyanobacterium, Synechococcus sp. (PCC 7942). Biochim. Biophys. Acta Bioenerg. 2009, 1787, 1170–1178. [Google Scholar] [CrossRef] [PubMed] [Green Version]
  10. Grossman, A.R.; Bhaya, D.; He, Q. Tracking the light environment by cyanobacteria and the dynamic naure of light harvesting. J. Biol. Chem. 2001, 276, 11449–11452. [Google Scholar] [CrossRef] [Green Version]
  11. Yokono, M.; Akimoto, S.; Koyama, K.; Tsuchiya, T.; Mimuro, M. Energy transfer processes in Gloeobacter violaceus PCC 7421 that possesses phycobilisomes with a unique morphology. Biochim. Biophys. Acta Bioenerg. 2008, 1777, 55–65. [Google Scholar] [CrossRef] [PubMed] [Green Version]
  12. Horton, P.; Wentworth, M.; Ruban, A. Control of the light harvesting function of chloroplast membranes: The LHCII-aggregation model for non-photochemical quenching. FEBS Lett. 2005, 579, 4201–4206. [Google Scholar] [CrossRef] [PubMed] [Green Version]
  13. Stoitchkova, K.; Zsiros, O.; Jávorfi, T.; Páli, T.; Andreeva, A.; Gombos, Z.; Garab, G. Heat- and light-induced reorganizations in the phycobilisome antenna of Synechocystis sp. PCC 6803. Thermo-optic effect. Biochim. Biophys. Acta Bioenerg. 2007, 1767, 750–756. [Google Scholar] [CrossRef] [PubMed] [Green Version]
  14. Büchel, C. Evolution and function of light harvesting proteins. J. Plant Physiol. 2015, 172, 62–75. [Google Scholar] [CrossRef] [PubMed]
  15. Kehoe, D.M. Chromatic adaptation and the evolution of light color sensing in cyanobacteria. Proc. Natl. Acad. Sci. USA 2010, 107, 9029–9030. [Google Scholar] [CrossRef] [PubMed] [Green Version]
  16. Rockwell, N.C.; Lagarias, J.C. Phytochrome diversification in cyanobacteria and eukaryotic algae. Curr. Opin. Plant Biol. 2018, 37, 87–93. [Google Scholar] [CrossRef] [Green Version]
  17. Sicora, C.I.; Appleton, S.E.; Brown, C.M.; Chung, J.; Chandler, J.; Cockshutt, A.M.; Vass, I.; Campbell, D. Cyanobacterial psbA families in Anabaena and Synechocystis encode trace, constitutive and UVB-induced D1 isoforms. Biochim. Biophys. Acta Bioenerg. 2006, 1757, 47–56. [Google Scholar] [CrossRef] [PubMed] [Green Version]
  18. Sicora, C.I.; Brown, C.M.; Cheregi, O.; Vass, I.; Campbell, D. The psbA gene family responds differentially to light and UVB stress in Gloeobacter violaceus PCC 7421, a deeply divergent cyanobacterium. Biochim. Biophys. Acta Bioenerg. 2008, 1777, 130–139. [Google Scholar] [CrossRef] [PubMed] [Green Version]
  19. Gao, K.; Ma, Z. Photosynthesis and growth of Arthrospira (Spirulina) platensis (Cyanophyta) in response to solar UV radiation, with special reference to its minor variant. Environ. Exp. Bot. 2008, 63, 123–129. [Google Scholar] [CrossRef]
  20. Das, P.; Lei, W.; Aziz, S.S.; Obbard, J.P. Enhanced algae growth in both phototrophic and mixotrophic culture under blue light. Bioresour. Technol. 2011, 102, 3883–3887. [Google Scholar] [CrossRef] [PubMed]
  21. Satoh, S.; Ikeuchi, M.; Mimuro, M.; Tanaka, A. Chlorophyll b expressed in cyanobacteria functions as a light-harvesting antenna in photosystem I through flexibility of the proteins. J. Biol. Chem. 2001, 276, 4293–4297. [Google Scholar] [CrossRef] [Green Version]
  22. Xia, Z.; Meijerink, A. Ce3+-Doped garnet phosphors: Composition modification, luminescence properties and applications. Chem. Soc. Rev. 2017, 46, 275–299. [Google Scholar] [CrossRef] [PubMed] [Green Version]
  23. Wu, Y.; Zhuang, Y.; Lv, Y.; Ruan, K.; Xie, R.J. A high-performance non-rare-earth deep-red-emitting Ca14−xSrxZn6Al10O35:Mn4+ phosphor for high-power plant growth LEDs. J. Alloys Compd. 2019, 781, 702–709. [Google Scholar] [CrossRef]
  24. Chen, H.B.; Wu, J.Y.; Wang, C.F.; Fu, C.C.; Shieh, C.J.; Chen, C.I.; Wang, C.Y.; Liu, Y.C. Modeling on chlorophyll a and phycocyanin production by Spirulina platensis under various light-emitting diodes. Biochem. Eng. J. 2010, 53, 52–56. [Google Scholar] [CrossRef]
  25. Meng, F.; Cui, H.; Wang, Y.; Li, X. Responses of a new isolated cyanobacterium aponinum strain to temperature, pH, CO2 and light quality. J. Appl. Phycol. 2018, 30, 1525–1532. [Google Scholar] [CrossRef]
  26. Zhou, Z.; Xia, M.; Zhong, Y.; Gai, S.; Huang, S.; Tian, Y.; Lu, X.; Zhou, N. Dy3+Mn4+ co-doped Ca14Ga10−mAlmZn6O35 far-red emitting phosphors with high brightness and improved luminescence and energy transfer properties for plant growth LED lights. J. Mater. Chem. C 2017, 5, 8201–8210. [Google Scholar] [CrossRef]
  27. Bernát, G.; Schreiber, U.; Sendtko, E.; Stadnichuk, I.N.; Rexroth, S.; Rögner, M.; Koenig, F. Unique properties vs. Common themes: The atypical cyanobacterium Gloeobacter violaceus PCC 7421 is capable of state transitions and blue-light-induced fluorescence quenching. Plant Cell Physiol. 2012, 53, 528–542. [Google Scholar] [CrossRef] [PubMed]
  28. Nelissen, B.; De Baere, R.; Wilmotte, A.; De Wachter, R. Phylogenetic relationships of nonaxenic filamentous cyanobacterial strains based on 16S rRNA sequence analysis. J. Mol. Evol. 1996, 42, 194–200. [Google Scholar] [CrossRef] [PubMed]
  29. Nakamura, Y.; Kaneko, T.; Sato, S.; Mimuro, M.; Miyashita, H.; Tsuchiya, T.; Sasamoto, S.; Watanabe, A.; Kawashima, K.; Kishida, Y.; et al. Complete genome structure of Gloeobacter violaceus PCC 7421, a cyanobacterium that lacks thylakoids. DNA Res. 2003, 10, 137–145. [Google Scholar] [CrossRef] [PubMed]
  30. Mareš, J.; Hrouzek, P.; Kaňa, R.; Ventura, S.; Strunecký, O.; Komárek, J. The primitive thylakoid-less cyanobacterium Gloeobacter is a common rock-dwelling organism. PLoS ONE 2013, 8, e66323. [Google Scholar] [CrossRef] [PubMed] [Green Version]
  31. Rippka, R.; Waterbury, J.; Cohen-Bazire, G. A cyanobacterium which lacks thylakoids. Arch. Microbiol. 1974, 100, 419–436. [Google Scholar] [CrossRef]
  32. Geitler, L. Neue Blaualgen aus Lunz. Arch. Protistenkd. 1928, 60, 440–448. [Google Scholar]
  33. Mareš, J.; Komárek, J.; Compère, P.; Oren, A. Validation of the generic name Gloeobacter Rippka et al. 1974, Cyanophyceae. Cryptogam. Algol. 2013, 34, 255–262. [Google Scholar] [CrossRef]
  34. Herdman, M.; Castenholz, R.W.; Rippka, R. Form-Genus VII. Gloeobacter Rippka, Waterbury and Cohen-Bazire 1974. In Bergey’s Manual of Systematic Bacteriology; Boone, D.R., Castenholz, R.W., Eds.; Springer: New York, NY, USA, 2001. [Google Scholar]
  35. Adir, N. Elucidation of the molecular structures of components of the phycobilisome: Reconstructing a giant. Photosynth. Res. 2005, 85, 15–32. [Google Scholar] [CrossRef]
  36. Guglielmi, G.; Cohen-Bazire, G.; Bryant, D.A. The structure of Gloeobacter violaceus and its phycobilisomes. Arch. Microbiol 1981, 129, 181–189. [Google Scholar] [CrossRef]
  37. Sutter, M.; Wilson, A.; Leverenz, R.L.; Lopez-Igual, R.; Thurotte, A.; Salmeen, A.E.; Kirilovsky, D.; Kerfeld, C.A. Crystal structure of the FRP and identification of the active site for modulation of OCP-mediated photoprotection in cyanobacteria. Proc. Natl. Acad. Sci. USA 2013, 110, 10022–10027. [Google Scholar] [CrossRef] [Green Version]
  38. Herrmann, A.J.; Gehringer, M.M. An investigation into the effects of increasing salinity on photosynthesis in freshwater unicellular cyanobacteria during the late Archaean. Geobiology 2019, 17, 343–359. [Google Scholar] [CrossRef]
  39. Koenig, F.; Schmidt, M. Gloeobacter violaceus—Investigation of an unusual photosynthetic apparatus. Absence of the long wavelength emission of photosystem I in 77 K fluorescence spectra. Physiol. Plant 1995, 94, 621–628. [Google Scholar] [CrossRef]
  40. Ganapathy, S.; Venselaar, H.; Chen, Q.; De Groot, H.J.M.; Hellingwerf, K.J.; De Grip, W.J. Retinal-based proton pumping in the near infrared. J. Am. Chem. Soc. 2017, 139, 2338–2344. [Google Scholar] [CrossRef]
  41. Lichtenthaler, H.K.; Buschmann, C. Chlorophylls and carotenoids: Measurement and characterization by UV-VIS spectroscopy. Curr. Protoc. Food Anal. Chem. 2001, 1, F4.3.1–F4.3.8. [Google Scholar] [CrossRef]
  42. Choi, A.R.; Shi, L.; Brown, L.S.; Jung, K.H. Cyanobacterial light-driven proton pump, Gloeobacter rhodopsin: Complementarity between rhodopsin-based energy production and photosynthesis. PLoS ONE 2014, 9, e110643. [Google Scholar] [CrossRef] [PubMed] [Green Version]
  43. Papageorgiou, G.C. Govindjee Photosystem II fluorescence: Slow changes—Scaling from the past. J. Photochem. Photobiol. B Biol. 2011, 104, 258–270. [Google Scholar] [CrossRef]
  44. Stirbet, A. Govindjee on the relation between the Kautsky effect (chlorophyll a fluorescence induction) and photosystem II: Basics and applications of the OJIP fluorescence transient. J. Photochem. Photobiol. B Biol. 2011, 104, 236–257. [Google Scholar] [CrossRef] [PubMed]
  45. Stirbet, A. Govindjee Chlorophyll a fluorescence induction: A personal perspective of the thermal phase, the J–I–P rise. Photosynth. Res. 2012, 113, 15–61. [Google Scholar] [CrossRef]
  46. Strasser, R.J.; Srivastava, A.; Tsimilli-Michael, M. The fluorescence transient as a tool to characterize and screen photosynthetic samples. In Chlorophyll a Fluorescence: A Signature of Photosynthesis; Kluwer Academic Publisher: Dordrecht, The Netherlands, 2000; pp. 443–480. ISBN 0748408215. [Google Scholar]
  47. Strasser, R.J.; Tsimilli-Michael, M.; Qiang, S.; Goltsev, V. Simultaneous in vivo recording of prompt and delayed fluorescence and 820-nm reflection changes during drying and after rehydration of the resurrection plant Haberlea rhodopensis. Biochim. Biophys. Acta Bioenerg. 2010, 1797, 1313–1326. [Google Scholar] [CrossRef] [Green Version]
  48. Zushi, K.; Kajiwara, S.; Matsuzoe, N. Chlorophyll a fluorescence OJIP transient as a tool to characterize and evaluate response to heat and chilling stress in tomato leaf and fruit. Sci. Hortic. 2012, 148, 39–46. [Google Scholar] [CrossRef]
  49. Perales-Vela, H.V.; García, R.V.; Gómez- Juárez, E.A.; Salcedo-Álvarez, M.O.; Cañizares-Villanueva, R.O. Streptomycin affects the growth and photochemical activity of the alga Chlorella vulgaris. Ecotoxicol. Environ. Saf. 2016, 132, 311–317. [Google Scholar] [CrossRef] [PubMed]
  50. Guisse, B.; Srivastava, A.; Strasser, R.J. The polyphasic rise of the chlorophyll a fluorescence (O-K-J-I-P) in heat stressed leaves. Arch. Sci. 1995, 48, 147–160. [Google Scholar]
  51. Krüger, G.H.J.; Tsimilli-Michael, M.; Strasser, R.J. Light stress provokes plastic and elastic modifications in structure and function of photosystem II in camellia leaves. Physiol. Plant 1997, 101, 265–277. [Google Scholar] [CrossRef]
  52. Glazer, A.N.; Chan, C.; Williams, R.C.; Yeh, S.W.; Clark, J.H. Kinetics of energy flow in the phycobilisome core. Science 1985, 230, 1051–1053. [Google Scholar] [CrossRef]
  53. Kehoe, D.M.; Grossman, A.R. Similarity of a chromatic adaptation sensor to phytochrome and ethylene receptors. Science 1996, 273, 1409–1412. [Google Scholar] [CrossRef]
  54. Grossman, A.R.; Kehoe, D.M. Phosphorelay control of phycobilisome biogenesis during complementary chromatic adaptation. Photosynth. Res. 1997, 53, 95–108. [Google Scholar] [CrossRef]
  55. Yamanaka, G.; Glazer, A.N. Dynamic aspects of phycobilisome structure. Arch. Microbiol. 1980, 124, 39–47. [Google Scholar] [CrossRef]
  56. Collier, J.L.; Herbert, S.K.; Fork, D.C.; Grossman, A.R. Changes in the cyanobacterial photosynthetic apparatus during acclimation to macronutrient deprivation. Photosynth. Res. 1994, 42, 173–183. [Google Scholar] [CrossRef] [PubMed]
  57. Golubic, S.; Campbell, S.E. Analogous microbial forms in recent subaerial habi- tats and in precambrian cherts: Gloeothece coerulea Geitler and Eosynechococcus moorei Hofmann. Precambrian Res. 1979, 8, 201–217. [Google Scholar] [CrossRef]
  58. Dayani, S.; Heydarizadeh, P.; Sabzalian, M.R. Efficiency of light-emitting diodes for future photosynthesis. In Handbook of Photosynthesis; Pessarakli, M., Ed.; CRC Press: Boca Raton, FL, USA; Taylor & Francis: Abingdon, UK, 2016; pp. 761–783. [Google Scholar]
  59. Stanier, R.Y.; Deruelles, J.; Rippka, R.; Herdman, M.; Waterbury, J.B. Generic assignments, strain histories and properties of pure cultures of cyanobacteria. J. Gen. Microbiol. 1979, 111, 1–61. [Google Scholar] [CrossRef] [Green Version]
  60. Montgomery, B.L. Light-dependent governance of cell shape dimensions in cyanobacteria. Front. Microbiol. 2015, 6, 514. [Google Scholar] [CrossRef] [PubMed] [Green Version]
  61. Bordowitz, J.R.; Montgomery, B.L. Photoregulation of cellular morphology during complementary chromatic adaptation requires sensor-kinase-class protein RcaE in Fremyella diplosiphon. J. Bacteriol. 2008, 190, 4069–4074. [Google Scholar] [CrossRef] [Green Version]
  62. Kula, M.; Kalaji, H.M.; Skoczowski, A. Culture density influence on the photosynthetic efficiency of microalgae growing under different spectral compositions of light. J. Photochem. Photobiol. B Biol. 2017, 167, 290–298. [Google Scholar] [CrossRef] [PubMed]
  63. Porra, R.J. The chequered history of the development and use of simultaneous equations for the accurate determination of chlorophylls a and b. Photosynth. Res. 2002, 73, 149–156. [Google Scholar] [CrossRef] [PubMed]
  64. Szwarc, D.; Zieliński, M. Effect of lighting on the intensification of phycocyanin production in a culture of Arthrospira platensis. MDPI Proc. 2018, 2, 1305. [Google Scholar] [CrossRef] [Green Version]
  65. Stevens, S.E.; Balkwill, D.L.; Paone, D.A.M. The effects of nitrogen limitation on the ultrastructure of the cyanobacterium Agmenellum quadruplicatum. Arch. Microbiol. 1981, 130, 204–212. [Google Scholar] [CrossRef]
  66. Bhaya, D.; Grossman, A.R.; Steunou, A.S.; Khuri, N.; Cohan, F.M.; Hamamura, N.; Melendrez, M.C.; Bateson, M.M.; Ward, D.M.; Heidelberg, J.F. Population level functional diversity in a microbial community revealed by comparative genomic and metagenomic analyses. ISME J. 2007, 1, 703–713. [Google Scholar] [CrossRef] [Green Version]
  67. Bald, D.; Kruip, J.; Rögner, M. Supramolecular architecture of cyanobacterial thylakoid membranes: How is the phycobilisome connected with the photosystems? Photosynth. Res. 1996, 49, 103–118. [Google Scholar] [CrossRef] [PubMed]
  68. Fraser, J.M.; Tulk, S.E.; Jeans, J.A.; Campbell, D.A.; Bibby, T.S.; Cockshutt, A.M. Photophysiological and Photosynthetic Complex Changes during Iron Starvation in Synechocystis sp. PCC 6803 and Synechococcus elongatus PCC 7942. PLoS ONE 2013, 8, e59861. [Google Scholar] [CrossRef] [Green Version]
  69. Liu, H.; Blankenship, R.E. On the interface of light-harvesting antenna complexes and reaction centers in oxygenic photosynthesis. Biochim. Biophys. Acta Bioenerg. 2019, 1860, 148079. [Google Scholar] [CrossRef] [PubMed]
  70. Figueroa, F.L.; Conde-Alvarez, R.; Gomez, I. Relations between electron transport rates determined by pulse amplitude modulated chlorophyll fluorescence and oxygen evolution in macroalgae under different light conditions. Photosynth. Res. 2003, 75, 259–275. [Google Scholar] [CrossRef] [PubMed]
  71. Shao, J.; Yu, G.; Wu, Z.; Peng, X.; Li, R. Responses of Synechocystis sp. PCC 6803 (cyanobacterium) photosystem II to pyrene stress. J. Environ. Sci. 2010, 22, 1091–1095. [Google Scholar] [CrossRef]
  72. Tóth, T.; Zsiros, O.; Kis, M.; Garab, G.; Kovács, L. Cadmium exerts its toxic effects on photosynthesis via a cascade mechanism in the cyanobacterium, Synechocystis PCC 6803. Plant Cell Environ. 2012, 35, 2075–2086. [Google Scholar] [CrossRef] [PubMed]
  73. Schuurmans, R.M.; Van Alphen, P.; Schuurmans, J.M.; Matthijs, H.C.P.; Hellingwerf, K.J. Comparison of the photosynthetic yield of cyanobacteria and green algae: Different methods give different answers. PLoS ONE 2015, 10, e0139061. [Google Scholar] [CrossRef] [PubMed] [Green Version]
  74. Touloupakis, E.; Cicchi, B.; Torzillo, G. A bioenergetic assessment of photosynthetic growth of Synechocystis sp. PCC 6803 in continuous cultures. Biotechnol. Biofuels 2015, 8, 133. [Google Scholar] [CrossRef] [PubMed] [Green Version]
  75. Touloupakis, E.; Cicchi, B.; Benavides, A.M.S.; Torzillo, G. Effect of high pH on growth of Synechocystis sp. PCC 6803 cultures and their contamination by golden algae (Poterioochromonas sp.). Appl. Microbiol. Biotechnol. 2016, 100, 1333–1341. [Google Scholar] [CrossRef] [Green Version]
  76. Wu, L.; Lei, Y.; Lan, S.; Hu, C. Photosynthetic recovery and acclimation to excess light intensity in the rehydrated lichen soil crusts. PLoS ONE 2017, 12, e0172537. [Google Scholar] [CrossRef] [Green Version]
  77. Misumi, M.; Katoh, H.; Tomo, T.; Sonoike, K. Relationship between photochemical quenching and non-photochemical quenching in six species of cyanobacteria reveals species difference in redox state and species commonality in energy dissipation. Plant Cell Physiol. 2016, 57, 1510–1517. [Google Scholar] [CrossRef]
  78. Akimoto, S.; Yokono, M.; Hamada, F.; Teshigahara, A.; Aikawa, S.; Kondo, A. Adaptation of light-harvesting systems of Arthrospira platensis to light conditions, probed by time-resolved fluorescence spectroscopy. Biochim. Biophys. Acta Bioenerg. 2012, 1817, 1483–1489. [Google Scholar] [CrossRef] [PubMed] [Green Version]
  79. Campbell, D.; Öquist, G. Predicting light acclimation in cyanobacteria from nonphotochemical quenching of photosystem II fluorescence, which reflects state transitions in these organisms. Plant Physiol. 1996, 111, 1293–1298. [Google Scholar] [CrossRef] [PubMed] [Green Version]
  80. Appenroth, K.J.; Stöckel, J.; Srivastava, A.; Strasser, R.J. Multiple effects of chromate on the photosynthetic apparatus of Spirodela polyrhiza as probed by OJIP chlorophyll a fluorescence measurements. Environ. Pollut. 2001, 115, 49–64. [Google Scholar] [CrossRef]
  81. Larkum, A.W.D.; Ritchie, R.J.; Raven, J.A. Living off the Sun: Chlorophylls, bacteriochlorophylls and rhodopsins. Photosynthetica 2018, 56, 11–43. [Google Scholar] [CrossRef]
  82. Gómez-Consarnau, L.; González, J.M.; Coll-Lladó, M.; Gourdon, P.; Pascher, T.; Neutze, R.; Pedrós-Alió, C.; Pinhassi, J. Light stimulates growth of proteorhodopsin-containing marine Flavobacteria. Nature 2007, 445, 210–213. [Google Scholar] [CrossRef] [Green Version]
  83. Gómez-Consarnau, L.; Akram, N.; Lindell, K.; Pedersen, A.; Neutze, R.; Milton, D.L.; González, J.M.; Pinhassi, J. Proteorhodopsin phototrophy promotes survival of marine bacteria during starvation. PLoS Biol. 2010, 8, e1000358. [Google Scholar] [CrossRef] [Green Version]
  84. Kimura, H.; Young, C.R.; Martinez, A.; DeLong, E.F. Light-induced transcriptional responses associated with proteorhodopsin-enhanced growth in a marine flavobacterium. ISME J. 2011, 5, 1641–1651. [Google Scholar] [CrossRef] [PubMed] [Green Version]
  85. Steindler, L.; Schwalbach, M.S.; Smith, D.P.; Chan, F.; Giovannoni, S.J. Energy starved Candidatus pelagibacter ubique substitutes light-mediated ATP production for endogenous carbon respiration. PLoS ONE 2011, 6, e19725. [Google Scholar] [CrossRef] [PubMed]
  86. Wang, Z.; O’Shaughnessy, T.J.; Soto, C.M.; Rahbar, A.M.; Robertson, K.L.; Lebedev, N.; Vora, G.J. Function and regulation of Vibrio campbellii proteorhodopsin: Acquired phototrophy in a classical organoheterotroph. PLoS ONE 2012, 7, e38749. [Google Scholar] [CrossRef] [PubMed] [Green Version]
  87. Akram, N.; Palovaara, J.; Forsberg, J.; Lindh, M.V.; Milton, D.L.; Luo, H.; González, J.M.; Pinhassi, J. Regulation of proteorhodopsin gene expression by nutrient limitation in the marine bacterium Vibrio sp. AND4. Environ. Microbiol. 2013, 15, 1400–1415. [Google Scholar] [CrossRef] [PubMed]
  88. Feng, S.; Powell, S.M.; Wilson, R.; Bowman, J.P. Light-stimulated growth of proteorhodopsin-bearing sea-ice psychrophile Psychroflexus torquis is salinity dependent. ISME J. 2013, 7, 2206–2213. [Google Scholar] [CrossRef] [PubMed] [Green Version]
  89. Palovaara, J.; Akram, N.; Baltar, F.; Bunse, C.; Forsberg, J.; Pedros-Alio, C.; Gonzalez, J.M.; Pinhassi, J. Stimulation of growth by proteorhodopsin phototrophy involves regulation of central metabolic pathways in marine planktonic bacteria. Proc. Natl. Acad. Sci. USA 2014, E3650–E3658. [Google Scholar] [CrossRef] [Green Version]
  90. Vogt, A.; Wietek, J.; Hegemann, P. Gloeobacter rhodopsin, limitation of proton pumping at high electrochemical load. Biophys. J. 2013, 105, 2055–2063. [Google Scholar] [CrossRef] [Green Version]
  91. Rippka, R.; Herdman, M. Pasteur culture collection of cyanobacterial strains in axenic culture. In Catalogue of Strains; Institut Pasteur: Paris, France, 1992; p. 103. ISBN 9783440126349. [Google Scholar]
  92. Thiel, V.; Tank, M.; Bryant, D.A. Diversity of chlorophototrophic bacteria revealed in the omics era. Annu. Rev. Plant Biol. 2018, 69, 21–49. [Google Scholar] [CrossRef]
  93. Leu, K.L.; Hsu, B.D. A programmed cell disintegration of Chlorella after heat stress. Plant Sci. 2005, 168, 145–152. [Google Scholar] [CrossRef]
  94. Lichtenthaler, H.K. Chlorophylls and carotenoids: Pigments of photosynthetic biomembranes. Methods Enzymol. 1987, 148, 350–382. [Google Scholar] [CrossRef]
  95. Sambrook, J.; Russell, D.W. Molecular Cloning: A Laboratory Manual; Argentine, J., Irwin, N., Janssen, K.A., Curtis, S., Zierler, M., McInerny, N., Brown, D., Schaefer, S., Eds.; Cold Spring Harbor Laboratory Press: New York, NY, USA, 2001. [Google Scholar]
  96. Bennett, A.; Bogobad, L. Complementary chromatic adaptation in a filamentous blue-green alga. J. Cell Biol. 1973, 58, 419–435. [Google Scholar] [CrossRef] [PubMed]
  97. Force, L.; Critchley, C.; Van Rensen, J.J.S. New fluorescence parameters for monitoring photosynthesis in plants. Photosynth. Res. 2003, 78, 17–33. [Google Scholar] [CrossRef]
  98. Kalaji, M.H.; Goltsev, V.N.; Zuk-Golaszewska, K.; Zivcak, M.; Brestic, M. Chlorophyll Fluorescence, Understanding Crop Performance; CRC Press: Boca Raton, FL, USA, 2017; ISBN 9781498764490. [Google Scholar]
  99. Bąba, W.; Kalaji, H.M.; Kompała-Baba, A.; Goltsev, V. Acclimatization of photosynthetic apparatus of tor grass (Brachypodium pinnatum) during expansion. PLoS ONE 2016, 11, e0156201. [Google Scholar] [CrossRef] [Green Version]
  100. Dąbrowski, P.; Baczewska, A.H.; Pawluśkiewicz, B.; Paunov, M.; Alexandrov, V.; Goltsev, V.; Kalaji, M.H. Prompt chlorophyll a fluorescence as a rapid tool for diagnostic changes in PSII structure inhibited by salt stress in Perennial ryegrass. J. Photochem. Photobiol. B Biol. 2016, 157, 22–31. [Google Scholar] [CrossRef] [PubMed]
  101. Kalaji, H.M.; Schansker, G.; Brestic, M.; Bussotti, F.; Calatayud, A.; Ferroni, L.; Goltsev, V.; Guidi, L.; Jajoo, A.; Li, P.; et al. Frequently asked questions about chlorophyll fluorescence, the sequel. Photosynth. Res. 2016, 132, 13–66. [Google Scholar] [CrossRef] [Green Version]
Figure 1. Growth of the Gloeobacter violaceus cultures under different light conditions, where the growth of the culture was shown as the increase in the optical density of cells at 730 nm. Light conditions: blue-red (BR) light (black); BR + far-red (FR) (red); BR + ultraviolet A (UVA) (violet); BR + G (green). The values represent means ± SD (n = 10).
Ijms 22 04021 g001
Figure 2. Photosynthetic pigments in Gloeobacter violaceus from different days of culture and light conditions. (AC) Chlorophyll a (chl a) and carotenoids content, respectively at 10th, 25th and 30th day of the culture. (DF) Content of different phycobiliproteins at 10th, 25th and, 30th day of culture, respectively. C-PC, phycocyanin; APC, allophycocyanin; C-PE, phycoerythrin. The data represent means ± SD (n = 12). The significance of the content of the pigments in comparison to the BR (control) was determined based on Tukey’s post-test (*** p ≤ 0.0001; ** p ≤ 0.001; * p ≤ 0.01; ns, non-significant).
Ijms 22 04021 g002
Figure 3. Absorption spectra of the Gloeobacter violaceus culture and extracted photosynthetic pigments at the 30th day of culture. (A) Absorption spectra of the culture. (B) Absorption spectra of chlorophyll a and carotenoids. (C) Absorption spectra of phycobiliproteins. The main peaks for each spectrum are indicated. The spectra are means from three independent measurements. The lines correspond to the cultures from a definite light spectrum BR (control)—black line; BR + FR—red line; BR + UVA—violet line; BR + G—green line.
Ijms 22 04021 g003
Figure 4. Deconvoluted spectra of the Gloeobacter violaceus cultures grown under different light conditions. Solid and dotted lines: BR (control)—black; BR + FR—red; BR + UVA—violet; BR + G—green. Dotted and solid lines describe the original spectra of the culture (as in Figure 3) and cumulative fits after deconvolution (AD), respectively.
Ijms 22 04021 g004
Figure 5. The effect of spectral light compositions on Gloeobacter violaceus photosystem II (PSII) activity at 10th (A,D), 25th (B,E) and 30th (C,F) day of culture, respectively, grown under different light conditions: BR (control)—black line; BR + FR—red line; BR + UVA—violet line; BR + G—green line. (AC) Chlorophyll a fluorescence induction curves (ΔVt). The K point indicates the K step at about 300 μs, the J point indicates the J step at 3 ms, the I point indicates the I step at 30 ms, and the P point indicates the P step at about 300 ms. (DF) ΔVt curves represent the difference of variable fluorescence curves, which were calculated as the difference between the normalized fluorescence curves for a control curve (BR), that was equal to “0” (ΔVt = VtBR − VtBR = 0) and BR + FR, BR + UVB, and BR + G. The presented data are mean values from 8 independent replicates.
Ijms 22 04021 g005
Figure 6. The spider-plot presentation of selected fluorescence parameters quantifying the changes of PSII of Gloeobacter violaceus from different days of culture and light conditions. The presented data are mean values from 8 independent replicates. The fluorescence parameters are described in Table 3 (Materials and Methods).
Ijms 22 04021 g006
Figure 7. Pipeline membrane model for specific fluxes in PSII of Gloeobacter violaceus under different light conditions at the 30th day of the culture. The model demonstrates the specific energy fluxes per reaction center (RC): ABS/RC, TRo/RC, ETo/RC, and DIo/RC (for details see Table 3 and text). The value of each energy flux parameter is expressed by the appropriate adjustment of the corresponding arrow.
Ijms 22 04021 g007
Figure 8. Principal Component Analysis (PCA) of the variability of the OJIP-test parameters and photosynthetic pigments in Gloeobacter violaceus from different days of culture (10th, 25th and 30th day) and light conditions: BR (control), BR + FR, BR + UVA, and BR + G. The abbreviations are described in Table 3 and Figure 9.
Ijms 22 04021 g008
Figure 9. The spectral composition of light-emitting diodes (LEDs) matrix used during the culture of Gloeobacter violaceus. BR—blue and red light (control); BR + FR—blue and red light enriched with the far-red light; BR + UVA—blue and red light with the addition of UV-A light; BR + G—blue and red light with the addition of the green light. The maxima for the wavelengths are shown.
Ijms 22 04021 g009
Table 1. Gloeobacter violaceus cell sizes and shapes, which were obtained on the 30th day of the culture growth under different light conditions. The data represent means ± SD (n = 10). The star indicates statistical significance from BR light (control) at the level p < 0.05 (*).
Ijms 22 04021 i001The Spectral Composition of Light
BR (Control)BR + FRBR + UVABR + G
Minor axis (a) (µm)0.9 ± 0.10.8 ± 0.11.0 ± 0.10.9 ± 0.2
Major axis (b) (µm)1.3 ± 0.21.0 ± 0.11.3 ± 0.21.5 ± 0.3
Ratio a:b0.7 ± 0.10.8 ± 0.10.8 ± 0.10.6 ± 0.1 *
The model of the cell shape Ijms 22 04021 i002 Ijms 22 04021 i003 Ijms 22 04021 i004 Ijms 22 04021 i005
Table 2. Identification of photosynthetic pigments based on the area of each peak of the absorption spectrum after deconvolution of the Gloeobacter violaceus culture spectrum at day 30 under different light spectral composition. Identification of peaks for each of the pigments was based on the position of the peaks found in the literature [15,30,31,41,42].
Component
(Photosynthetic Pigments)
Peak Maximum Wavelength (nm)BRBR + FRBR + UVABR + G
Peak Area (a.u.)
chl a44078613
car475---8
R-PE, car, PUB500610813
C-PE, GR, B-PE54811898
C-PE, R-PE56522151910
C-PC62877737858
chl a, APC6807101022
Table 3. The description of chl a fluorescence parameters used in these studies [97,101].
Energy Flow Rates
Fo/Fmquantum yield baseline, it is used as an indicator of the physiological state (state change index);
Fv/Fma value that is related to the maximum quantum yield of PSII;
Fv/Foa value that is proportional to the activity of the water-splitting complex on the donor side of the PSII;
Vjrelative variable fluorescence at phase J of the fluorescence induction curve;
M0the approximated initial slope of the fluorescent transient, which is related to the rate of closure of reaction centers;
Specific Energy Fluxes
ABS/RCthe antenna size of active PSII per reaction center (RC) and light absorption energy flux (for PSII antenna chlorophylls);
DIo/RCtotal energy dissipated per reaction center (RC) as heat, fluorescence, and energy transfer to PSI;
TRo/RCtrapping flux leading to QA reduction per reaction center (RC);
ETo/RCthe electron flux transferred per active reaction center (RC);
Quantum Yields
ψEo (Ψo)probability (at time 0) that a trapped exciton moves an electron into the electron transport chain beyond QA;
φEothe quantum efficiency of electron transfer from QA to plastoquinone.
Publisher’s Note: MDPI stays neutral with regard to jurisdictional claims in published maps and institutional affiliations.

