Article

Cardiac Oxidative Signaling and Physiological Hypertrophy in the Na/K-ATPase α1s/sα2s/s Mouse Model of High Affinity for Cardiotonic Steroids

1
Marshall Institute for Interdisciplinary Research, Huntington, WV 25703, USA
2
Department of Biomedical Sciences, Marshall University Joan C. Edwards School of Medicine, Huntington, WV 25755, USA
3
Gladstone Institute of Cardiovascular Disease, San Francisco, CA 94158, USA
4
Department of Internal Medicine, University of Michigan, Ann Arbor, MI 48109, USA
5
Department of Molecular Genetics, Biochemistry and Microbiology, University of Cincinnati College of Medicine, Cincinnati, OH 45267, USA
*
Author to whom correspondence should be addressed.
Deceased.
Int. J. Mol. Sci. 2021, 22(7), 3462; https://doi.org/10.3390/ijms22073462
Submission received: 27 February 2021 / Revised: 18 March 2021 / Accepted: 23 March 2021 / Published: 27 March 2021
(This article belongs to the Special Issue Cardiotonic Steroids: From Toxins to Hormones)

Abstract

:
The Na/K-ATPase is the specific receptor for cardiotonic steroids (CTS) such as ouabain and digoxin. At pharmacological concentrations used in the treatment of cardiac conditions, CTS inhibit the ion-pumping function of Na/K-ATPase. At much lower concentrations, in the range of those reported for endogenous CTS in the blood, they stimulate hypertrophic growth of cultured cardiac myocytes through initiation of a Na/K-ATPase-mediated and reactive oxygen species (ROS)-dependent signaling. To examine a possible effect of endogenous concentrations of CTS on cardiac structure and function in vivo, we compared mice expressing the naturally resistant Na/K-ATPase α1 and age-matched mice genetically engineered to express a mutated Na/K-ATPase α1 with high affinity for CTS. In this model, total cardiac Na/K-ATPase activity, α1, α2, and β1 protein content remained unchanged, and the cardiac Na/K-ATPase dose–response curve to ouabain shifted to the left as expected. In males aged 3–6 months, increased α1 sensitivity to CTS resulted in a significant increase in cardiac carbonylated protein content, suggesting that ROS production was elevated. A moderate but significant increase of about 15% of the heart-weight-to-tibia-length ratio accompanied by an increase in the myocyte cross-sectional area was detected. Echocardiographic analyses did not reveal any change in cardiac function, and there was no fibrosis or re-expression of the fetal gene program. RNA sequencing analysis indicated that pathways related to energy metabolism were upregulated, while those related to extracellular matrix organization were downregulated. Consistent with a functional role of the latter, an angiotensin-II challenge that triggered fibrosis in the α1r/rα2s/s mouse failed to do so in the α1s/sα2s/s. Taken together, these results are indicative of a link between circulating CTS, Na/K-ATPase α1, ROS, and physiological cardiac hypertrophy in mice under baseline laboratory conditions.

1. Introduction

Levels of endogenous cardiac steroids (CTS) vary in response to physiological and pathophysiological stresses such as exercise, pregnancy [1,2,3], hypertension [2,4,5], and heart failure [2,6]. The role of endogenous CTS as hormones with distinct but related modulatory effects on growth as well as cardiovascular equipoise [7,8,9] and dysfunction [5,6,10,11,12] has been increasingly recognized. In the meantime, key issues such as their respective contributions, synthetic pathways, and regulations are areas of very active investigation [9,12,13,14,15,16,17].
CTS effects are mediated through the Na+/K+-ATPase (NKA), the plasma membrane transporter that utilizes the energy from ATP hydrolysis to catalyze the exchange of intracellular Na+ for extracellular K+ [18,19]. In the pharmacological-to-toxic range, CTS inhibit the NKA enzyme. The adjustment of Na+/Ca2+ exchange that ensues ultimately leads to the modulation of cardiac contractility and excitability, which is the molecular basis for the use of the CTS digoxin in the clinical management of heart failure and atrial fibrillation [19,20,21,22].
Understanding the physiological/pathophysiological role of CTS/NKA interaction beyond the effect of administration of exogenous CTS in the therapeutic-to-toxic range has been more challenging. In particular, it has been difficult to establish that systemic concentrations of endogenous CTS reach levels that significantly inhibit NKA [2,23,24,25,26]. Modulation of the more recently discovered, non-canonical NKA receptor signaling function has emerged as a more likely mechanism of action for endogenous CTS [27,28,29]. Indeed, CTS concentrations as low as 100 times below the inhibitory threshold have been shown to induce the assembly of multiple protein complexes into functional microdomains and activate diverse signaling pathways [30]. In the ensuing NKA signaling cascades, activation of Src, 1,4,5-triphosphate receptor (IP3R), EGFR, mitogen-activated protein kinases, mitochondrial reactive oxygen species (ROS), and intracellular Ca2+ oscillations has been reported in many cells and organs [9,31,32].
Early experimental evidence supporting structural changes of cardiac cells in response to CTS were reported by Peng et al. and Huang et al. [33,34]. Subsequent studies have exposed the role of ROS in this process [24,31,35]. This line of work, expanded to multiple systems and in vivo models, has led to the current understanding of the Na/K-ATPase/Src/ROS feedforward mechanism and its modulation by CTS [36]. One of the most direct evidence for the importance of this loop in cardiac tissue came from a study by Liu et al., in which blockade of the loop using pNaKtide injection dampened the hypertrophic remodeling of uremic cardiomyopathy in vivo [37]. However, because those studies used pharmacological approaches to inhibit the pathway, non-specific/off-target effects have not been ruled out. To obtain a direct evidence that interaction between endogenous CTS and Na/K-ATPase regulates cardiac ROS and hypertrophic growth, we here compare the cardiac phenotype of mice expressing the rodent wild type Na/K-ATPase α1 with a low affinity for CTS to that of mice genetically engineered to express a Na/K-ATPase α1 with high affinity for CTS. This study, which is the first to examine the CTS-sensitive α1s/sα2s/s mouse heart, reveals a mild but significant cardiac phenotypic change consistent with a model whereby increased CTS binding to NKA increases cardiac ROS, favors physiological hypertrophic growth, and reduces angiotensin II-induced fibrosis. RNA sequencing reveals an upregulation of metabolic pathways, especially fatty acid β-oxidation, and a downregulation of pathways related to the extracellular matrix organization in the α1s/sα2s/s mouse heart.

2. Results

2.1. Cardiac Na+/K+-ATPase in the α1s/sα2s/s Mouse

To assess whether increasing sensitivity to CTS affected Na/K-ATPase isoform expression and enzymatic activity, we compared heart preparations from α1s/sα2s/s mice and α1r/rα2s/s littermates. Expression levels of cardiac Na/K-ATPase subunits (α1, α2 and β1) and total enzymatic activity were not altered (Figure 1a,b). Na/K-ATPase in the mouse heart typically exhibits a biphasic dose–response curve to the CTS ouabain, with a low affinity site attributable to α1-containing isoenzymes and a high affinity component attributable to α2-containing isoenzymes. In contrast, dose–response curves from α1s/sα2s/s hearts were best fitted assuming one IC50, resulting in a monophasic curve and a computed IC50 around 10−6 M (Figure 1c). This leftward shift in ouabain dose–response is consistent with the expected impact of R111Q and D122N substitutions on NKA α1, which resulted in greater sensitivity and made it indistinguishable from the α2 site in α1s/sα2s/s mice.

2.2. Cardiac Phenotype of the α1s/sα2s/s Mouse

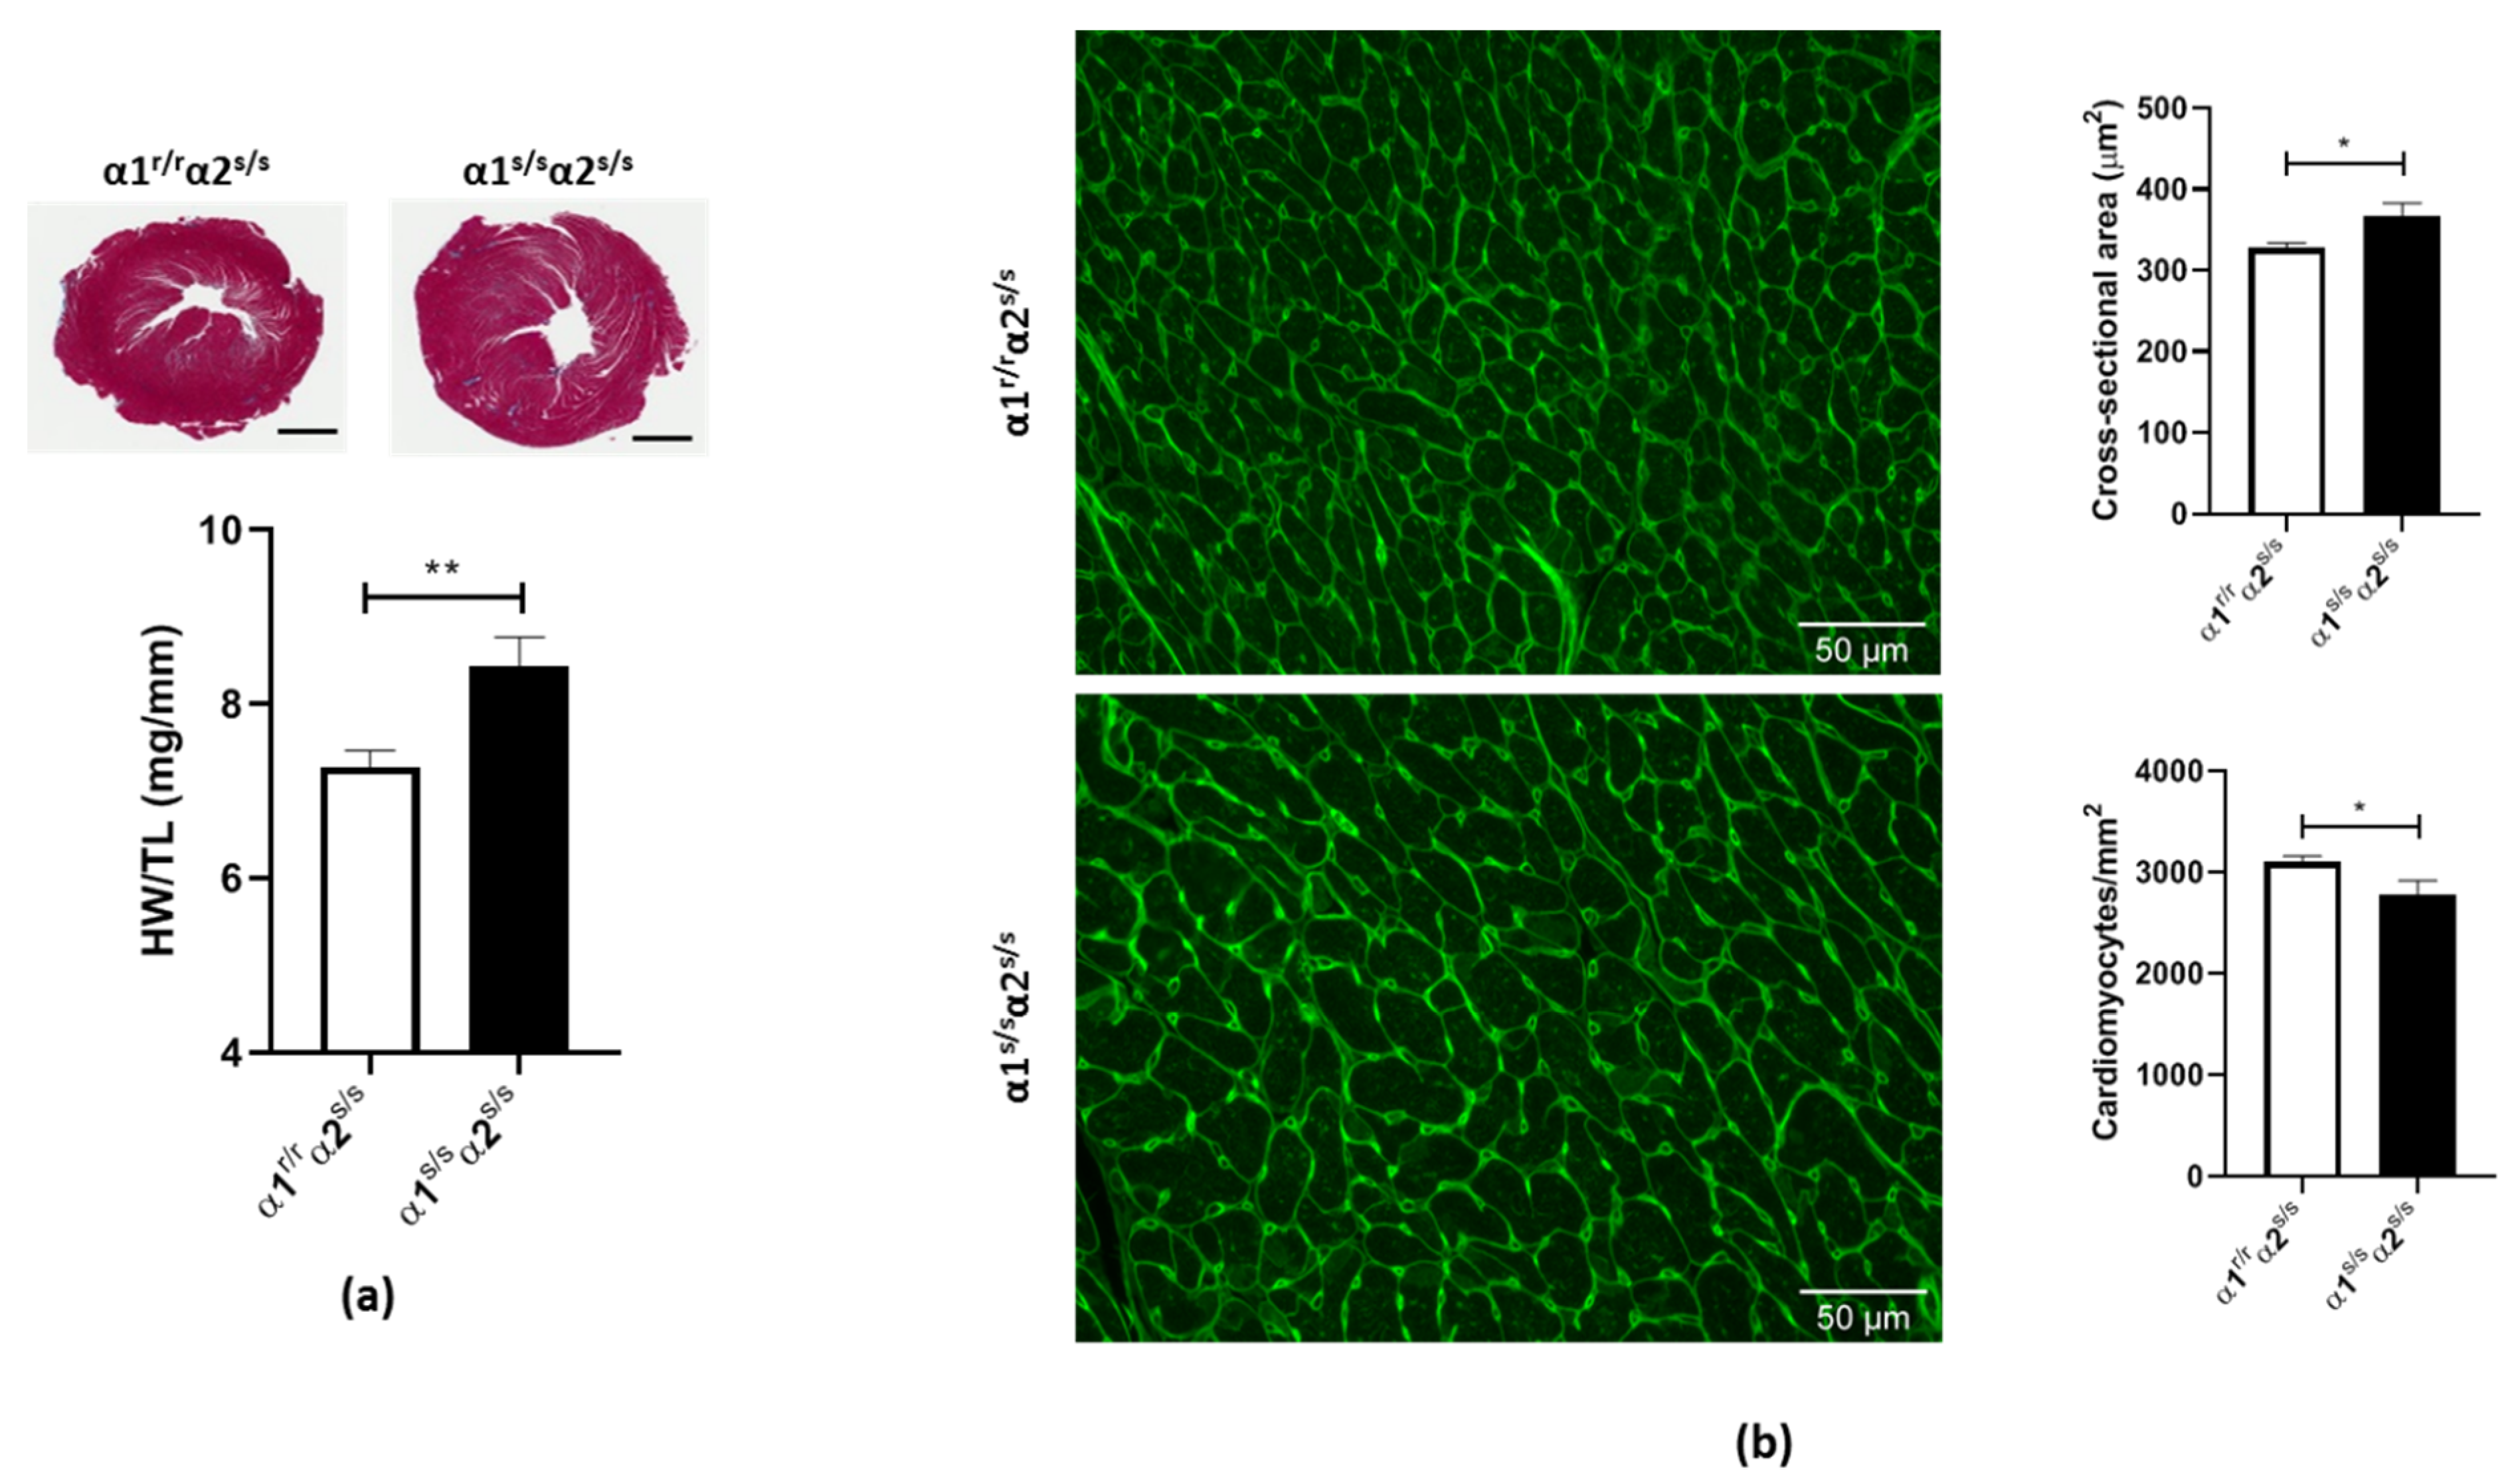
A moderate but significant increase in cardiac weight in α1s/sα2s/s hearts was observed, as shown in Figure 2a (15% increase in HW/TL ratio, p < 0.01). Since increased HW/TL ratios are commonly associated with increased cardiomyocyte size, we next evaluated cardiomyocyte cross-sectional area (CSA) and density in left ventricle histological preparations stained with wheat germ agglutinin (WGA). A significant increase of 15% of the mean cardiomyocyte area was detected in α1s/sα2s/s compared to α1r/rα2s/s littermates (Figure 2b). Accordingly, a decrease in cardiomyocyte density was observed due to the increased cardiomyocyte size (Figure 2b).

2.3. Absence of Adverse Cardiac Remodeling in α1s/sα2s/s Mice

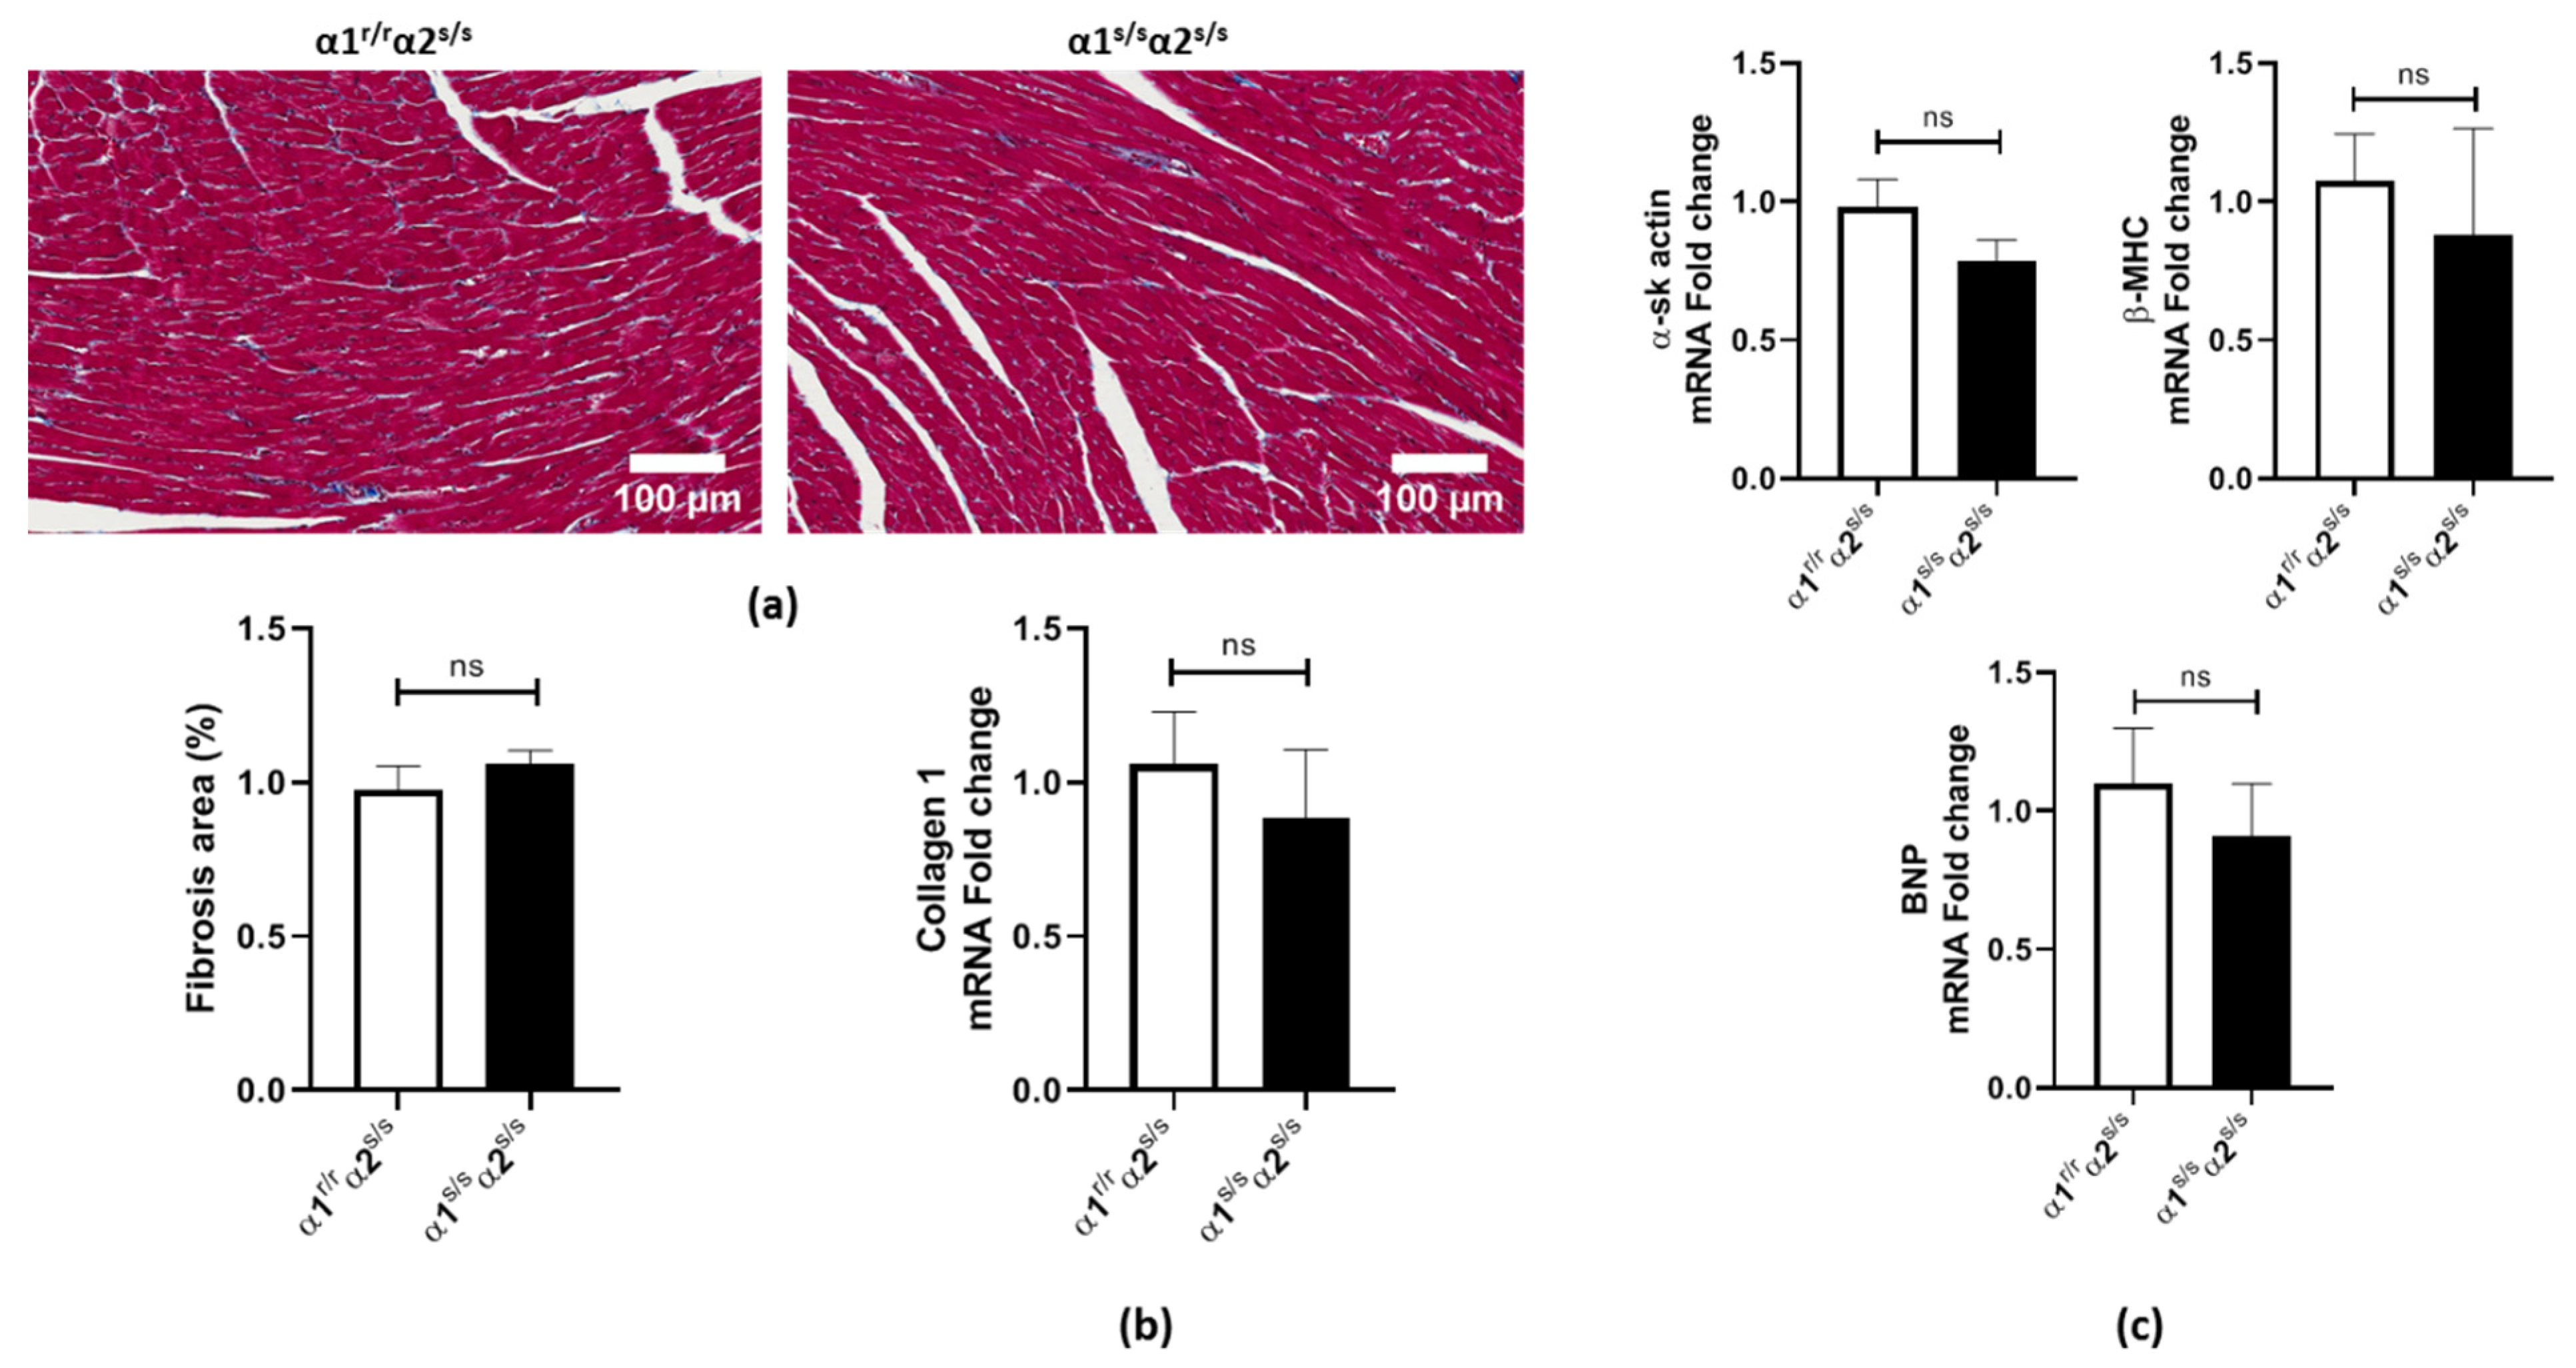
Physiological stimuli such as exercise result in cardiac hypertrophy, which is characterized by an overall normal cardiac structure and the absence of adverse remodeling, preserved or improved cardiac function, and minimal alteration in cardiac gene expression. In contrast, pathological hypertrophy is associated with adverse remodeling, functional alteration, and/or re-expression of fetal genes. Accordingly, we set out to assess cardiac fibrosis and re-expression of the fetal gene program in α1s/sα2s/s mice. No evidence of fibrosis was observed by Masson’s trichrome staining (Figure 3a). Collagen-1 mRNA content was also found to be unchanged compared to the control littermates (Figure 3b). The cardiac fetal gene program, a key feature of pathological cardiac hypertrophy, was not changed in α1s/sα2s/s compared to α1r/rα2s/s littermates (Figure 3c).
Furthermore, we analyzed the systolic function of α1s/sα2s/s mice by echocardiography. We observed a significant increase in the left ventricle mass and left ventricle anterior wall thickness, at systole, in agreement with the histological characterization (Table 1). Despite those changes, no major changes in systolic cardiac function were observed. Given the absence of fibrosis, fetal gene program re-expression, and functional abnormalities, it was concluded that increased α1 affinity for endogenous CTS had favored physiological cardiac hypertrophy in this gain-of-function mouse model.

2.4. RNA-Seq Analysis

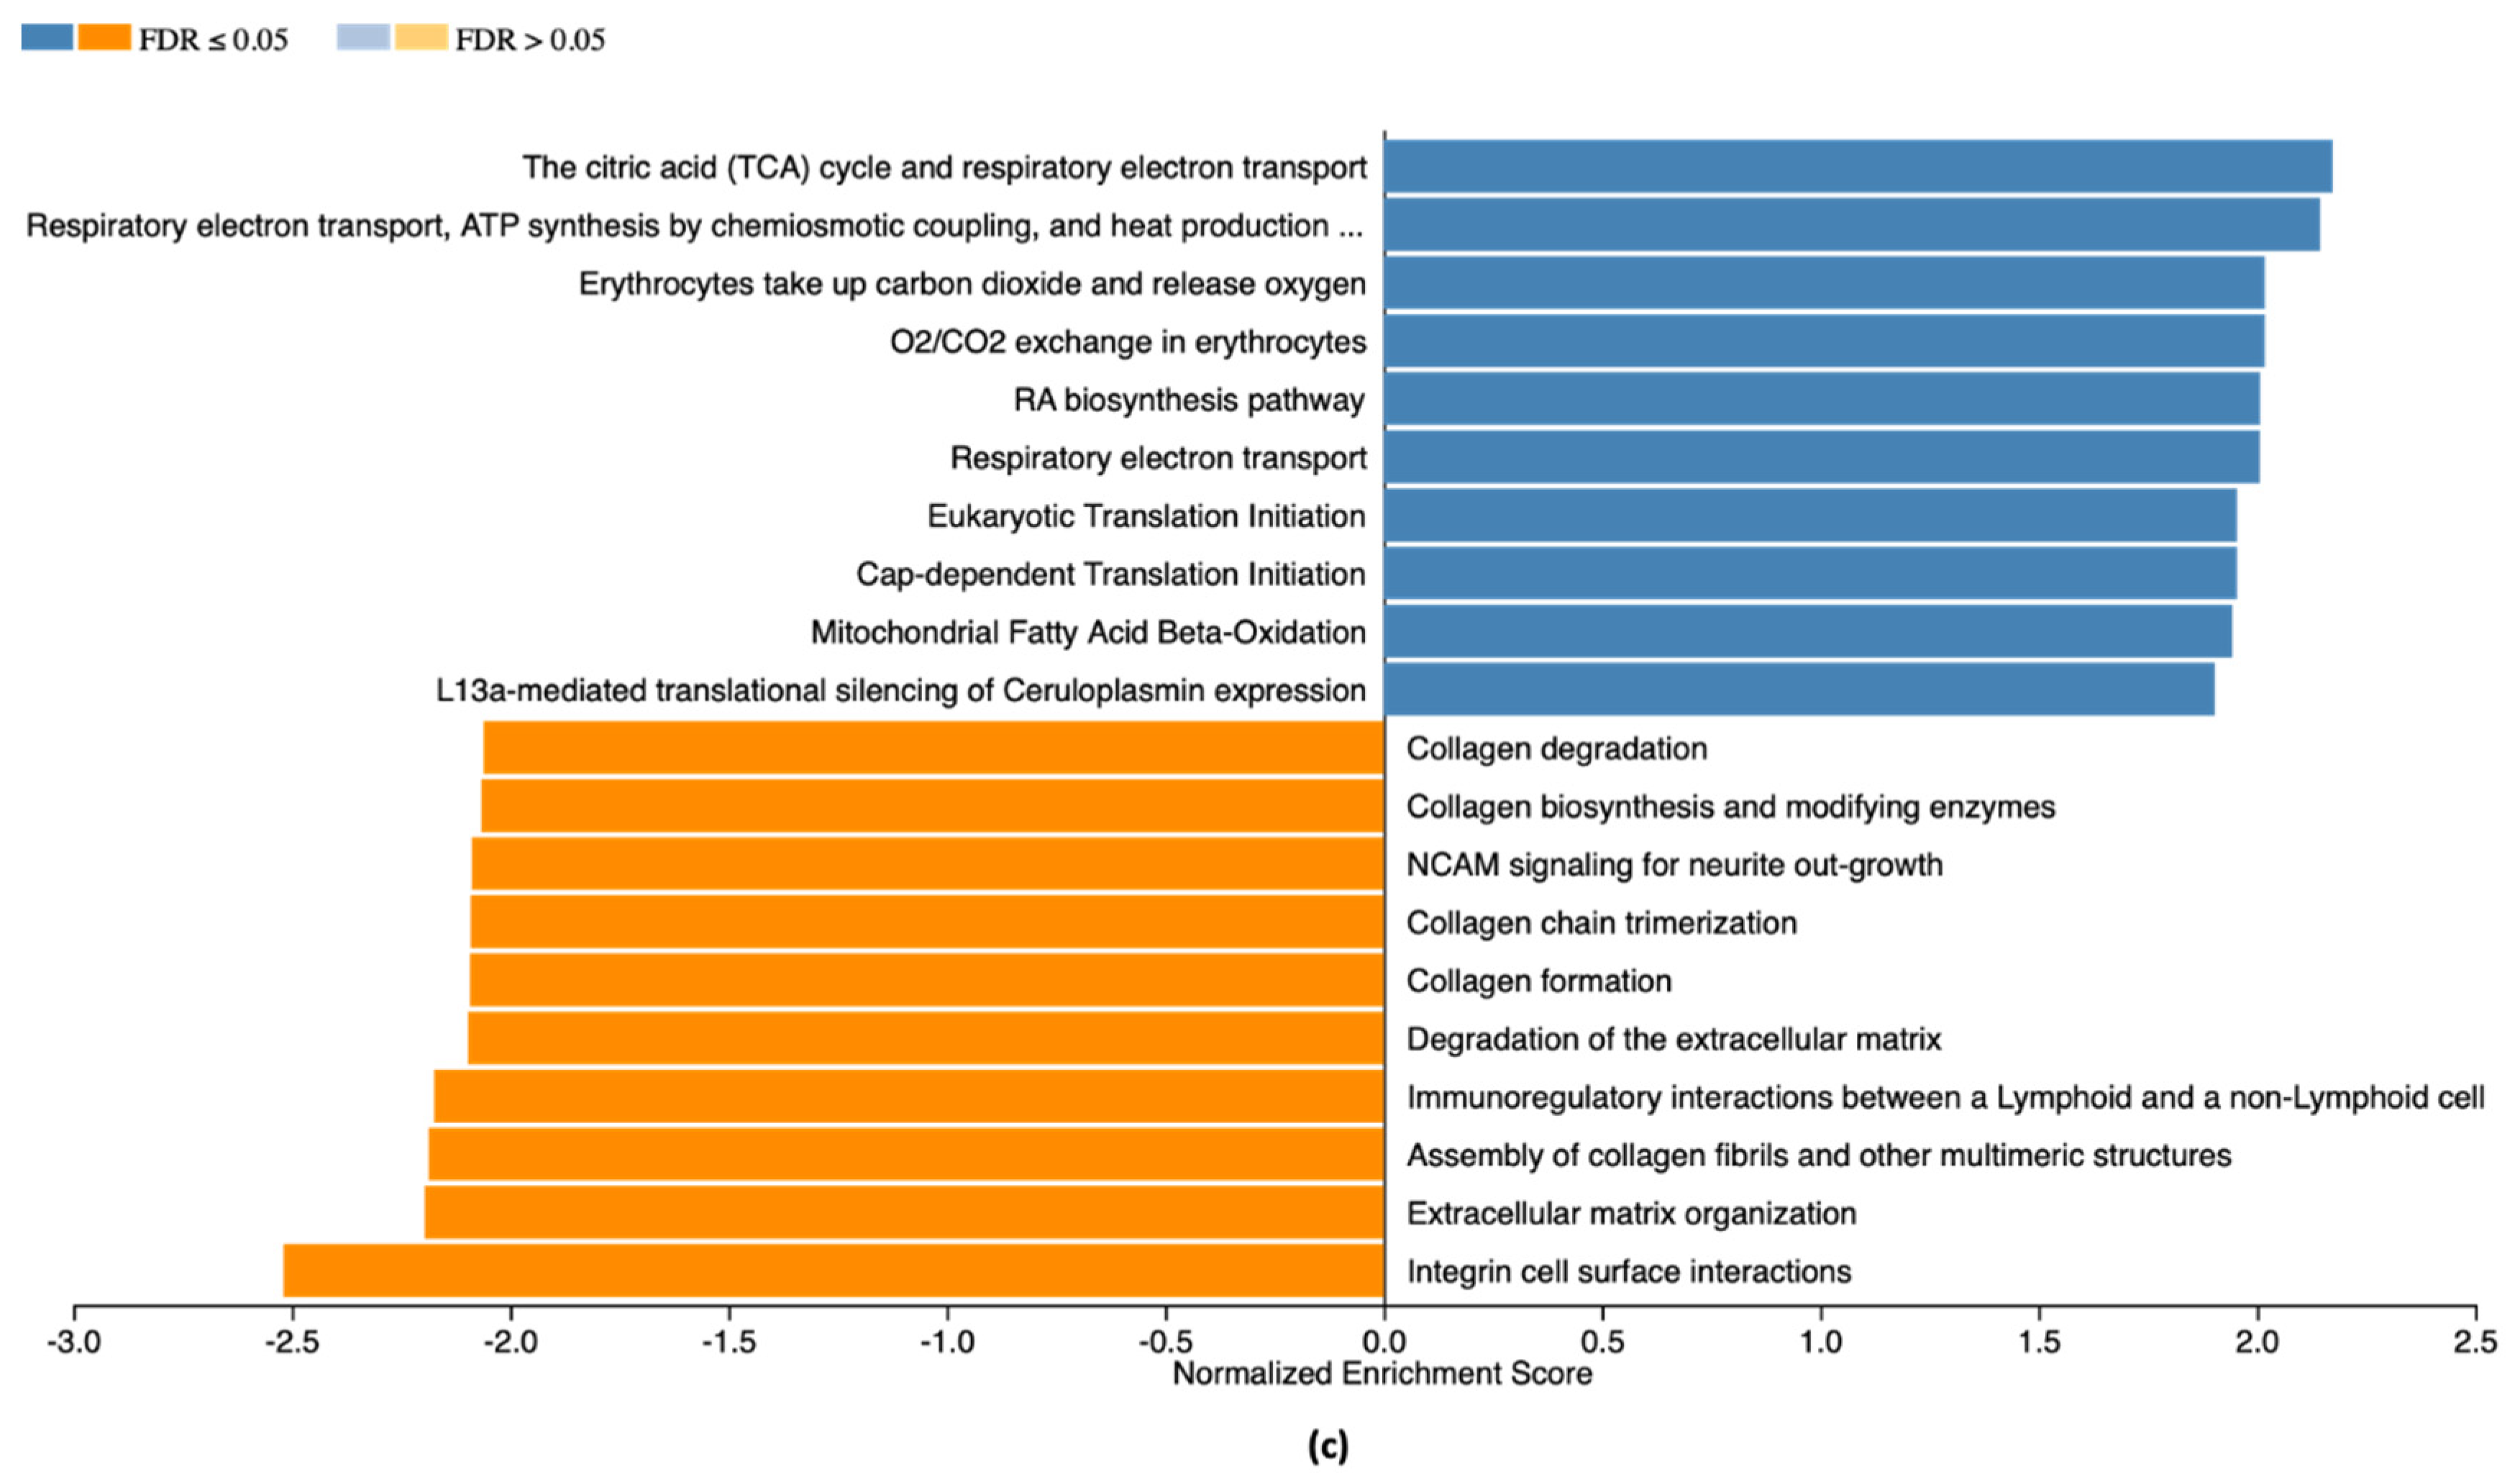
RNA-seq analysis was carried out in whole hearts from 3-month-old α1s/sα2s/s male mice and age-matched α1r/rα2s/s (3 mice/genotype). A volcano plot is shown in Figure 4a with the distribution of genes that were up- (right) or downregulated (left). A total of 388 genes were found to be differentially expressed, 152 being downregulated and 235 upregulated. A Gene Set Enrichment Analysis (GSEA) was performed to assess the pathways that were up- and downregulated in α1s/sα2s/s hearts compared to α1r/rα2s/s hearts. Using the Cellular Component in the Gene Ontology database (Figure 4b), we observed downregulated pathways, such as the extracellular matrix and collagen trimer. Moreover, upregulated pathways, such as the NADH dehydrogenase complex, respiratory chain, and mitochondrial protein complex, suggested an increase in energy demand that is commonly observed with cardiac hypertrophy [38,39,40,41,42]. Using the Reactome database (Figure 4c), a similar trend was noted for downregulated pathways involving the extracellular matrix, and upregulated pathways related to energy production, such as citric acid cycle, respiratory electron transport, and mitochondrial fatty acid β-oxidation.

2.5. Evidence of Activation of the Na/K-ATPase Oxidant Amplification Loop in α1s/sα2s/s Mice

The increased energetic metabolism suggested by RNA-seq analysis is consistent with hypertrophic growth, but also increased the levels of reactive oxygen species (ROS) [43,44,45]. Consistently, increased sensitivity to CTS would be expected to stimulate the NKA α1 oxidant amplification loop [36,46], which prompted us to explore redox signaling in α1s/sα2s/s mouse hearts. Indeed, multiple lines of evidence suggest that Na/K-ATPase and ROS induce cardiac hypertrophic growth through close and reciprocal regulatory mechanisms in cultured cardiac myocytes [31,35]. To this end, carbonylated protein content was measured as one of the earliest and more stable indicators of ROS generation. Consistent with an activation of ROS signaling, a 50% increase in protein carbonylation was observed in α1s/sα2s/s mice hearts compared to their α1r/rα2s/s littermates (Figure 5).

2.6. Angiotensin-II Does Not Induce Cardiac Fibrosis in α1s/sα2s/s Mice

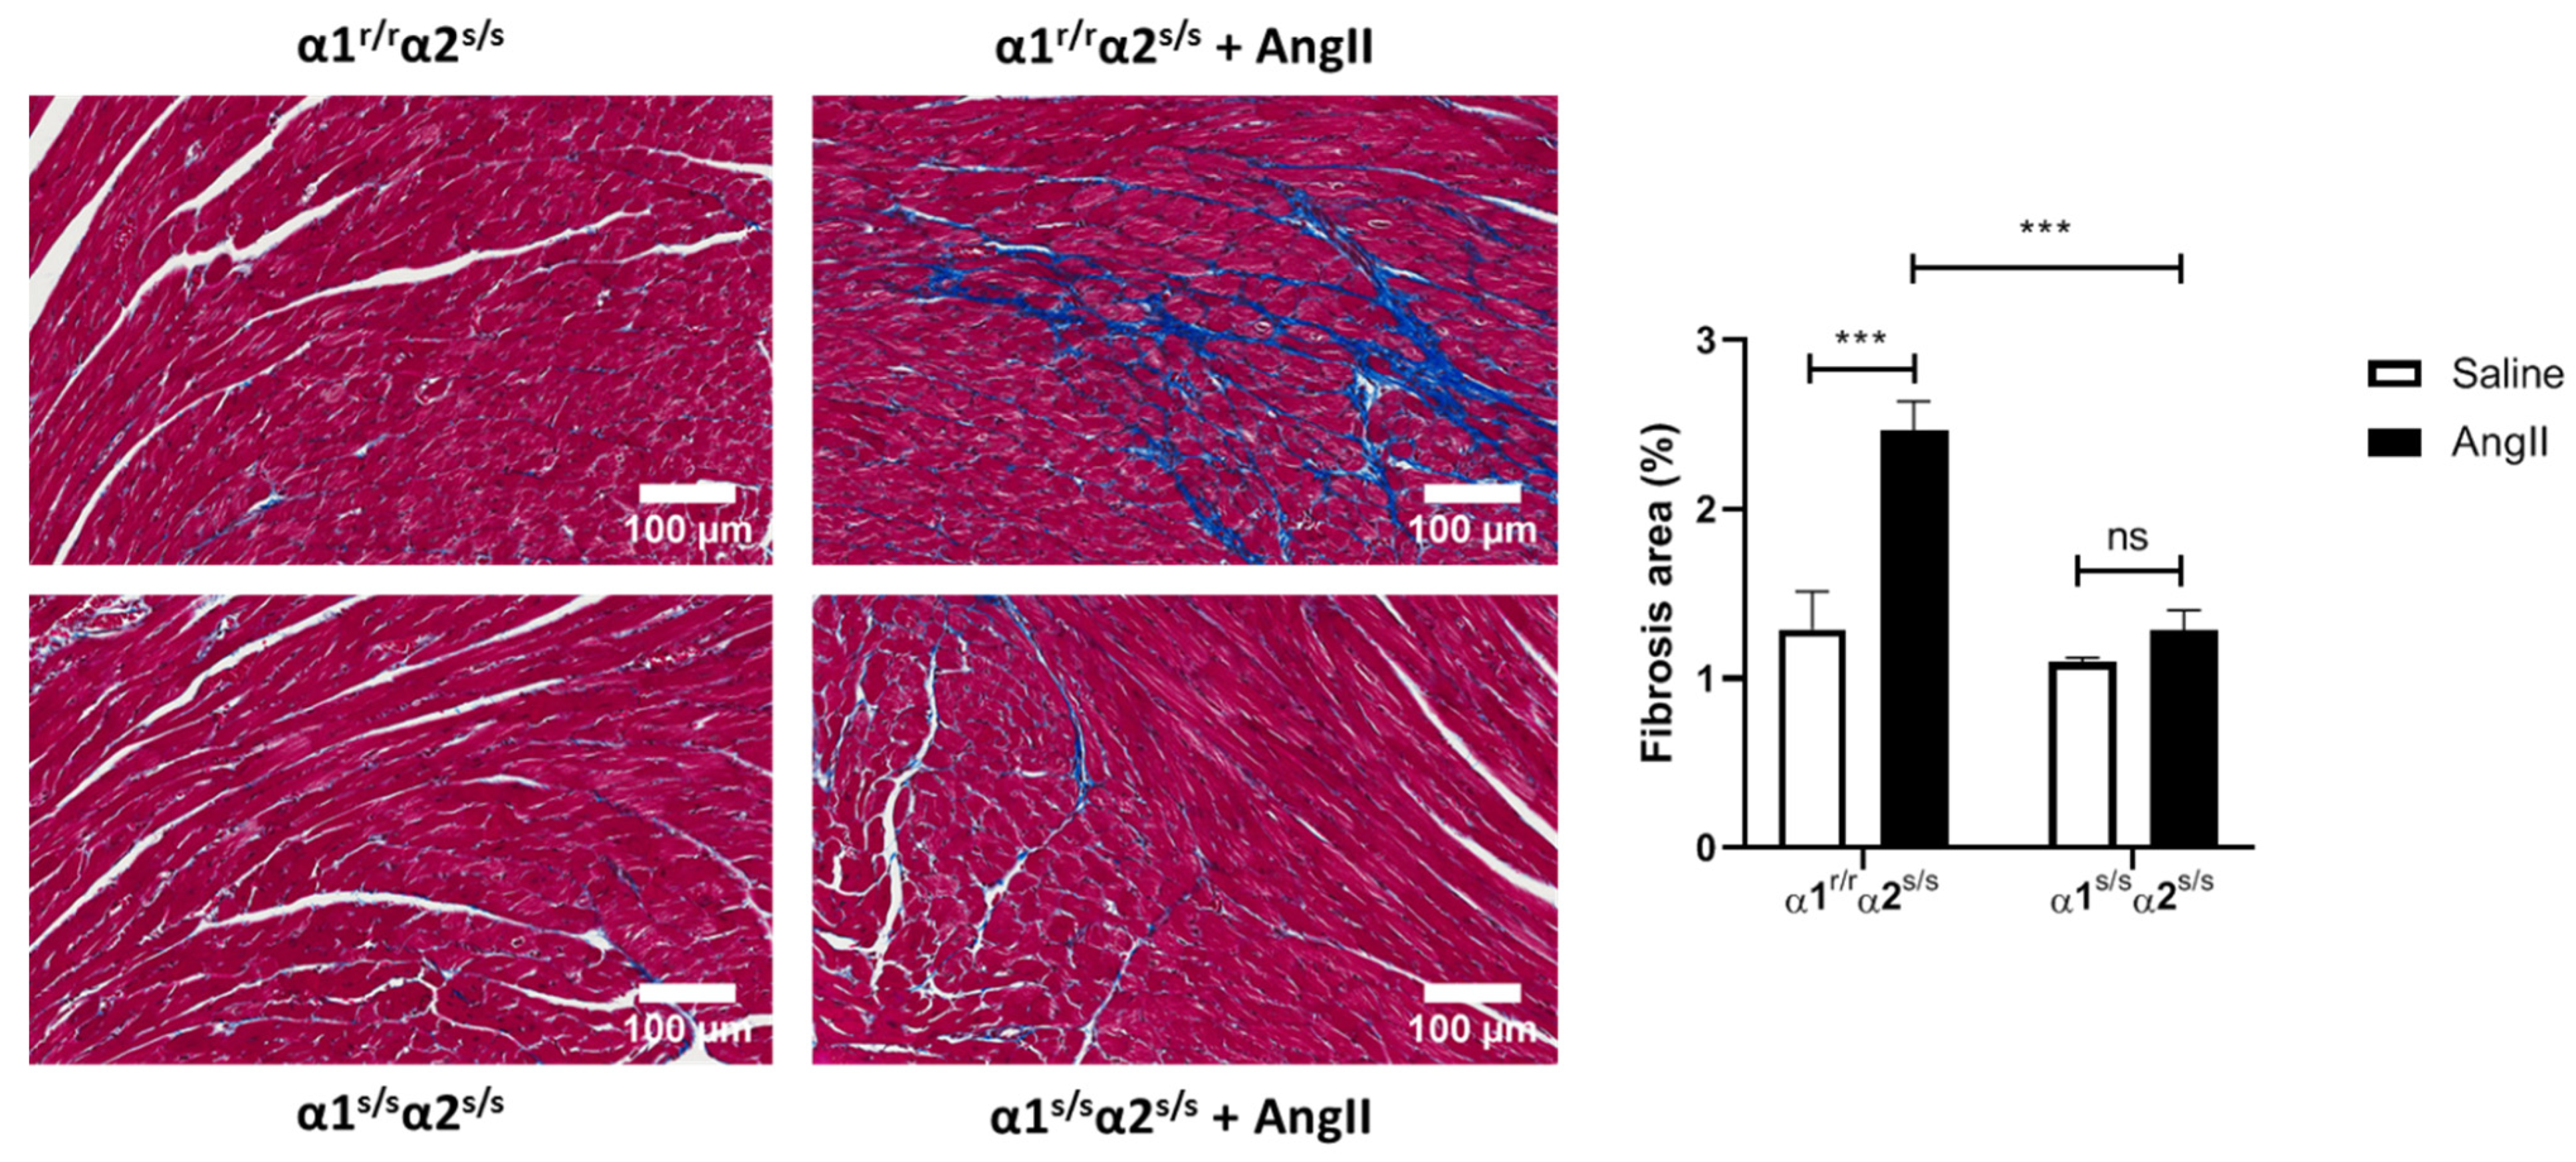
Angiotensin-II (AngII) infusion is a well-known trigger of cardiac fibrosis [47,48]. Since our RNA-seq analysis showed downregulation of pathways involved in extracellular matrix organization, we treated α1s/sα2s/s mice and age-matched α1r/rα2s/s for two weeks as described in the Materials and Methods section and evaluated cardiac fibrosis. As observed in Figure 6, AngII induced cardiac fibrosis in control α1r/rα2s/s mice but failed to do so in α1s/sα2s/s mice.

3. Discussion

In the 20 years that have elapsed since the first report of ouabain-induced hypertrophic growth in cultured cardiac myocytes, a lot has been learned about the underlying signaling mechanism involved. In the present study, we used the α1s/sα2s/s mouse model for the first time to understand the physiological/pathophysiological role of the endogenous CTS/NKA interaction on cardiac structure and function. We observed that a hundred-to-thousand-fold increase in NKA α1 affinity for CTS produces a 15% increase in cardiac mass (Figure 2) in α1s/sα2s/s male mice aged 3–6 months with no apparent change in cardiac function (Table 1). This increase in cardiac mass was not a consequence of changes in NKA isoform expression or altered Na+/K+-ATPase activity in the cardiac muscle (Figure 1), which is consistent with previous studies showing that mutations of amino acids arginine 111 and aspartate 122 of the NKA α-polypeptide do not alter enzyme function or expression in multiple tissues [49,50,51,52,53]. In the “SWAP” model (α1s/sα2r/r), mice did not have altered cardiac NKA either, but in that model the hundred-to-thousand-fold increase in NKA α1 affinity for CTS did not result in a significant change of cardiac mass when animals were maintained in normal laboratory conditions [50,51]. Certainly, differences in background (mixed 129SvJ /Black Swiss vs. C57Bl6) could contribute to the difference between the cardiac phenotypes of α1s/sα2r/r vs. α1s/sα2s/s at baseline. Alternatively, the increase in cardiac size observed in the α1s/sα2s/s and not in α1s/sα2r/r could indicate that CTS binding to both α1 and α2 isoforms contributes to the hypertrophic response.
Our RNA sequencing data (Figure 4) indicated a significant downregulation of pathways related to extracellular matrix organization (e.g., extracellular matrix and collagen trimer in Figure 4b, collagen formation and extracellular matrix organization in Figure 4c). This is in agreement with the absence of fibrosis observed at baseline (Figure 3) and was corroborated functionally by the observation that angiotensin-II challenge does not induce cardiac fibrosis in α1s/sα2s/s mice (Figure 6). Furthermore, upregulation of pathways related to metabolism and energy production (e.g., NADH dehydrogenase complex and respiratory chain in Figure 4b; tricarboxylic acid (TCA cycle), respiratory electron transport, ATP synthesis, and mitochondrial fatty acid β-oxidation in Figure 4c) is consistent with increased energy demand in cardiac hypertrophy [38,40,42]. In fact, studies have demonstrated that mice with cardiac-restricted constitutive activation of PI3K exhibit physiological cardiac hypertrophy and increased cardiac fatty acid oxidative capacity [54,55,56].
The results in Figure 5 show a clear increase in cardiac protein carbonylation in the α1s/sα2s/s mouse. This suggests that a ROS-related mechanism is involved, which is consistent with the well-established role of ROS in hypertrophic growth of the cardiac myocyte [57,58,59]. Based on multiple evidence of CTS-induced ROS production and subsequent impact on cardiomyocyte growth reported in vitro and in vivo [35,60,61,62], a direct effect of CTS on NKA α1 with increased affinity in the cardiac myocyte most likely played a role in the observed hypertrophy. Although beyond the scope of the present study, future studies may clarify the role of Src-mediated ROS amplification. Moreover, possible roles of NKA α1 related to intracellular ion homeostasis in cardiac myocytes, in other cardiac cell types and/or extra cardiac tissues cannot be excluded, and may have ultimately contributed to the cardiac phenotype of this global α1s/sα2s/s mouse model. Indeed, CTS/NKA interactions occur on a systemic level, with multiple opportunities for cross-talks and feedback mechanisms with neurohumoral regulators of cardiovascular function in health and disease [63,64,65]. For example, there is evidence that CTS secretion by adrenocortical cells is stimulated by angiotensin II and the adrenocorticotropic hormone (ACTH) [53,66].
Correlative as well as direct evidence for CTS-induced cardiac remodeling has been reported in both physiological and pathological hypertrophy. Examples of the former include normal postnatal growth [67,68], pregnancy-induced growth [69], and exercise-induced cardiac hypertrophy [1,70]. Evidence for the latter has been shown in chronic pressure or volume overload such as hypertensive disease [14,71,72], post-MI remodeling, and heart failure [11,73,74], as well as in major forms of cardiomyopathies [9,12,75]. Several lines of evidence suggest that the cardiac hypertrophic growth observed in the α1s/sα2s/s mouse is physiological rather than pathological in nature. First, the relatively mild increase in cardiac mass observed in the α1s/sα2s/s mouse (10%) is in the range typically observed for physiological hypertrophy, rather than the more pronounced effect of pathological hypertrophy induced by pressure overload with transverse aortic constriction (TAC) [76,77,78]. This observed increase in heart size resulted from an increase in myocyte size and occurred without a detectable change in fibrosis. Finally, echocardiographic analysis did not reveal any cardiac dysfunction and RT-qPCR analysis showed that there was no re-expression of the cardiac fetal gene program characteristic of pathological hypertrophy. Therefore, although increases in circulating amounts of CTS have been detected in both types of hypertrophy, the present study suggests that their direct impact in normal laboratory conditions favors the development of the physiological type. In all likelihood, the underlying mechanism involves the PI3K-IA pathway, which is typically associated with physiological cardiac hypertrophy, and is initiated upon exposure of cardiac myocytes to the CTS ouabain in vitro and in vivo. On the other hand, the cardiac phenotypic changes of the α1s/sα2s/s mouse do not reflect the well-known impact of the CTS/NKA α1 pathway involved in the development of fibrosis observed in vitro and in vivo [12,16,37,79,80,81] and in adverse remodeling associated with pathological hypertrophy [12,63,64,79,81,82,83]. This may be an additional indication that various endogenous CTS exert complementary and antagonistic effects, possibly through biased signaling [84,85,86] on cardiac structure. Such biased molecular mechanisms have been proposed in the regulation of blood pressure by CTS [87,88,89]. Therefore, the nature and amount of circulating CTS in health and diseases may ultimately dictate the type of hypertrophic response. In addition, crosstalk with various pathways that affect the NKA receptor itself, such as the deleterious ROS amplification loop encountered in uremic cardiomyopathy, is likely to alter the effects of CTS. Specifically, the stability of the α1 isoform expression combined with low basal levels of endogenous CTS in the α1s/sα2s/s mice, in contrast to decreased NKA α1 expression levels and elevated CTS in disease models such as cardiac hypertrophy, heart failure, and cardiomyopathy [90,91,92,93,94,95] may explain the occurrence of physiological vs. pathological hypertrophy through the CTS/NKA receptor.

4. Materials and Methods

4.1. Materials

Anti Na/K-ATPase α1 (NASE) primary-antibody was a gift from Drs. T. A. Pressley and P. Artigas, Texas Tech University HSC, Lubbock, TX, USA. Anti Na/K-ATPase α2 (AB-9094-I), and anti Na/K-ATPase β1 (05-382) were from Millipore (Billerica, MA, USA). β-actin (sc-7210), rabbit, and mouse secondary antibodies (sc-2004 and sc-2005, respectively) were purchased from Santa Cruz Biotechnology (Dallas, TX, USA). The 2,4-Dinitrophenylhydrazine (DNPH, D199303) and antibody against 2,4-dinitrophenyl (DNP, D9656) hydrazone derivatives were from Sigma-Aldrich (St. Louis, MO, USA).

4.2. Generation of the NKA α1 Sensitive Mouse Model

Mice expressing Na/K-ATPase (NKA) α1 isoform with high-affinity for CTS were created by introducing R111Q and D122N substitutions in the mouse α1 isoform of Na/K-ATPase [49]. Mice obtained from established colonies at the University of Cincinnati were backcrossed to a C57Bl6 background. Males NKA α1 sensitive (α1s/sα2s/s) and their control littermates (α1r/rα2s/s) aged 3 to 6 months were used in this study. Genotyping was performed using the following primers: A1Bgl-30 forward (5′-GAC ATG CAA AAC CGA ACC AG-3′) and A1bgl+164 reverse (5′-GGA GAT GAC AAG GTC CAG GG-3′).
All animals were kept in a 12-h dark/light cycle and fed standard chow ad libitum. All animal care and experiments were approved by the Marshall University Institutional Animal Care and Use Committee (IACUC) in accordance with the National Institutes of Health (NIH) Guide for the Care and Use of Laboratory Animals (NIH Publication, 8th Edition, 2011).

4.3. Western Blot Analysis

Whole heart lysates were prepared by homogenization in RIPA buffer as described [96]. Equal amounts of proteins were loaded and separated by 10% SDS-PAGE, transferred onto nitrocellulose membrane (GE Healthcare Life Sciences, Pittsburgh, PA, USA), and probed with the primary antibody (anti-NKA α1 1:1000; anti-NKA α2 1:1000; anti-NKA β1 1:1000; anti-β-actin 1:1000) followed by incubation with the HRP-conjugated secondary antibody. The signal was detected using chemiluminescence, and quantified using Image J software (National Institutes of Health (NIH), Bethesda, MD, USA). Cardiac protein carbonylation was assessed as previously described [97] using an anti-DNP antibody (dilution 1:20,000).

4.4. Na/K-ATPase Activity and Ouabain Dose-Response in Heart Lysates

Hearts were snap frozen in liquid nitrogen immediately after harvesting. Powdered heart tissue was placed into 10 mL ice-cold 1M KCl and homogenized in a 30 mL homogenizer by 15 times up-and-down strokes and followed by homogenization with a tissue mixer homogenizer at 30,000 rpm for 60 s (twice, 30 s each). The homogenates were centrifuged at 100 g for 10 min to remove cellular debris and unbroken cells. The supernatants were centrifuged at 1000 g for 10 min. The sediment was washed once with a solution containing 50 mM KCl and 50 mM Tris-HCl (pH 7.4), and twice with 50 mM Tris-HCl (pH 7.4). The final pellet was resuspended in 1mM Tris-EDTA (pH 7.4). The resulting crude homogenates were incubated with the ionophore alamethicin (0.1 mg/mg protein) 10 min at 37 °C prior to ouabain sensitive ATPase activity measurement [98]. This alamethicin treatment is necessary to ensure the access of substrates and inhibitors to both the ATP- and ouabain-binding sites of the enzyme in closed membrane vesicles that may form in crude homogenates. Na/K-ATPase activity was measured in alamethicin-pretreated samples (50 µg protein/sample) by colorimetric determination of inorganic phosphate released after incubation of 10 min at 37 °C in a reaction buffer containing (in mmol/L) Tris-HCl (20), MgCl2 (1), NaCl (100), KCl (20), EGTA-Tris (1), and NaN3 (5). After addition of 2 mmol/L Mg2+/ATP, the enzymatic reaction was allowed to run for 10 min before the addition of 1 mL ice-cold 8% trichloroacetic acid to terminate the reaction. The amount of phosphate released was determined using an inorganic phosphate detection kit (AK-111, Biomol Research Laboratories, Inc., Plymouth Meeting, PA, USA), according to the manufacturers’ recommendation. Ouabain insensitive activity was measured in a separate reaction in the presence of 2 mmol/L ouabain in the same buffer. Ouabain sensitive Na/K-ATPase activity was then determined by subtracting ouabain insensitive from total ATPase activity. To establish the ouabain dose–response curve, control hearts tissue was prepared as described above, and indicated concentrations of ouabain were added in the reaction buffer. The resulting data were analyzed by nonlinear regression and best fitted with biphasic curve or monophasic curve using GraphPad Prism 5.0 (GraphPad Software, Inc, La Jolla, CA, USA).

4.5. Echocardiography

Echocardiography was carried out under light anesthesia (1–2% isoflurane in oxygen) placed on a heating pad using a MS400: 18–38 MHz operating frequency MicroScan transducer and the Vevo 1100 Imaging System. Left ventricle dimensions were obtained during TM mode acquisition from the parasternal short axis view at the level of the papillary muscles. Images were analyzed with the Vevo 1100 Imaging System software (FUJFILM VisualSonics Inc., Tokyo, Japan), by an examiner blinded to the genotype of the animals as described [37].

4.6. Histology

Hearts were fixed in 10% buffered formalin solution and stored in 70% EtOH at 4 °C until embedding. Paraffin embedding, transverse sectioning, Wheat Germ Agglutinin (WGA) immunostaining, Masson’s trichrome staining, and imaging were performed by Wax-it Histology Services Inc. (Vancouver, BC, Canada). Dehydration was performed with ethanol 70%, 95% (2×) and 100% (3×) for 2 h, each followed by xylene (3×) for 1 h each. The specimens were then impregnated with paraffin at 60 °C (3 successive changes after 45 min, 1 h, 2 h under vacuum) and then embedded into wax blocks.
Masson’s trichrome staining was performed to assess cardiac fibrosis. Sections were rehydrated using xylene, decreasing % of ethanol, and water. Sections were treated with saturated picric acid at 60 °C for 1.5 h, rinsed, and stained in Weigart’s hematoxylin solution for 30 min. After rinsing, they were treated with acetic acid for 30 s, rinsed, stained in acid fuchsin–ponceau xylidine for 2 min, and rinsed. They were then treated in 1% phosphomolybdic acid for 5 min and stained with 1% aniline blue for 15 min. prior to rinsing with successive changes of 1% acetic acid and water. Total (i.e., interstitial plus perivascular) fibrosis was determined in each sample using 10 randomly selected fields from a 20× magnification whole heart scan and analyzed using ImageJ software (RSB NIH), which allows quantification of the positive blue stained area (fibrosis) and total area [99]. Fibrosis was expressed as percent of total area.
WGA immunostaining was used to examine cardiomyocyte cross-sectional area and density. Immunostaining was performed following rehydratation of sections in Tris buffered saline pH 7.4, followed by antigen retrieval (citrate buffer in steamer for 25 min) and permeabilized with TBS-T (0.5%) for 20 min at room temperature. Protein blocking was performed for 30 min at room temperature. WGA at a 1:200 dilution was incubated overnight at 4 °C, followed by secondary antibody tagged with Alexa 568 at a 1/500 dilution (30 min at room temperature). Sections were mounted with DAPI-Prolong gold (Invitrogen). To assess cardiomyocyte cross-sectional area and density, 10 fields per left ventricle stained by WGA were selected using a 40× magnification. The number and area of cardiomyocytes were determined using an ImageJ macro developed by Dr. Kees Straatman at the University of Leicester for automated batch processing of the images. The mean cardiomyocyte area and density was measured in over 1000 cells from at least 4 hearts per genotype.

4.7. Determination of mRNA Levels

Total RNA was extracted from cardiac tissue using Trizol® reagent according to the manufacturer’s instructions (Life Technologies, Carlsbad, CA, USA). The amount and quality of extracted RNA were assessed using the Nanodrop 2000 (Thermo Scientific, Waltham, MA, USA). First-strand cDNA was synthesized from mRNA using Superscript II First-Strand system (Invitrogen, Carlsbad, CA, USA). Gene expression of collagen 1, brain natriuretic peptide (BNP), alpha skeletal actin (α-sk actin), and beta myosin heavy chain (β-MHC) was analyzed by real-time quantitative PCR using PowerSYBR green (Life Technologies, Carlsbad, CA, USA). Real-time quantitative PCR was performed using a LightCycler® 480 Instrument II (Roche, Indianapolis, IN, USA) in a 384-well plate. Melting curve analysis was performed to ensure purity of the PCR products, and relative quantification was determined using the comparative CT method with data normalized to GAPDH and calibrated to the average of control group, as previously described [100]. Primer sequences are listed in Supplemental Table S1.

4.8. Angiotensin-II Treatment

Three-month-old male mice were treated with a pressor dose of Angiotensin-II (AngII) of 1.5 mg.kg−1.d−1 or saline for 14 days via osmotic minipumps (model 2002, AlzaCorp, Palo Alto, CA, USA), implanted subcutaneously at the dorsum of the neck as previously described [101].

4.9. RNA Sequencing (RNA-Seq) Analysis

Total RNA was extracted from cardiac tissue using Trizol® reagent (Life Technologies, Carlsbad, CA, USA) and the RNeasy Midi Kit (Qiagen, Hilden, Germany) according to the manufacturers’ instructions. RNA-seq was performed by Novogene (Sacramento, CA, USA) using the Illumina NovaSeq 6000 system. Quality control, mapping to reference genome, and quantification were performed by the company according to their standard protocol. Using the raw count data provided, we performed a differential gene expression (DEG) analysis using the DESeq2 R-package [102]. A Volcano Plot was constructed based on the DEG data using the EnhancedVolcano R-package. The gene list and associated log2 fold change obtained from the DESeq2 analysis were used as the input for Gene Set Enrichment Analysis (GSEA) using the WebGestalt toolkit (www.webgestalt.org. Accessed 17 February 2021.) [103]. The Cellular Component category of Gene Ontology and the Reactome database were selected for pathway enrichment analysis.

4.10. Statistical Analysis

The data are presented as means ± SEM. The data were analyzed by Student’s t-test for comparison between two independent groups and by two-way ANOVA followed by Tukey’s multiple comparisons test for grouped analysis. The data were stored and analyzed using GraphPad Prism software (La Jolla, CA, USA). A probability value of p < 0.05 was considered statistically significant.

Supplementary Materials

The following are available online at https://www.mdpi.com/article/10.3390/ijms22073462/s1, Table S1: Primers used for RT-qPCR.

Author Contributions

Conceptualization, P.V.M., M.T.P., Y.X., X.W., L.C., J.X.X., J.B.L., Z.X., J.T., S.V.P.; methodology, P.V.M., M.T.P., Y.X., L.C.K., D.M.C., Y.Y., C.K., Q.D., L.C., J.B.L., Z.X., J.T., S.V.P.; investigation, P.V.M., M.T.P., Y.X., L.C.K., D.M.C., Y.Y., C.K., X.W., Q.D., L.C.; writing—original draft preparation, P.V.M., M.T.P., Y.X., L.C.K., Y.Y., Q.D., L.C., J.B.L., Z.X., J.T., S.V.P.; writing—review and editing, P.V.M., M.T.P., Y.X., L.C.K., L.C., J.T., S.V.P.; visualization, P.V.M., M.T.P., Y.X., L.C.K., Y.Y., J.T.; funding acquisition, J.B.L.; Z.X.; S.V.P. All authors have read and agreed to the published version of the manuscript.

Funding

This Research was supported, in part, by the American Heart Association [AHA 19AIREA34450278] and the Heart, Lung and Blood Institute of National Institute of Health [R15 HL145666]. C. King was a fellow of the Marshall AHA-UGR 18UFEL33960330 summer program. D. M. Collins was a recipient of the Marshall University Creative Discovery & Research Scholar award.

Institutional Review Board Statement

The study was conducted according to the guidelines of the National Institutes of Health (NIH) Guidelines for Care and Use of Laboratory Animals and approved by the Institutional Animal Care and Use Committee (IACUC—Board Ref# 630, approval date: 1 February 2019).

Data Availability Statement

The data presented in this study have been deposited at the Gene Expression Omnibus at the National Center for Biotechnology Information and may be accessed using the accession number GSE169734.

Acknowledgments

We thank the Division of Animal Resources of the Marshall University Joan C. Edwards School of Medicine for animal care and husbandry, and Carla Cook for invaluable technical support.

Conflicts of Interest

The authors declare no conflict of interest.

References

  1. Bauer, N.; Müller-Ehmsen, J.; Krämer, U.; Hambarchian, N.; Zobel, C.; Schwinger, R.H.; Neu, H.; Kirch, U.; Grünbaum, E.G.; Schoner, W. Ouabain-like compound changes rapidly on physical exercise in humans and dogs: Effects of beta-blockade and angiotensin-converting enzyme inhibition. Hypertension 2005, 45, 1024–1028. [Google Scholar] [CrossRef] [Green Version]
  2. Bagrov, A.Y.; Shapiro, J.I.; Fedorova, O.V. Endogenous cardiotonic steroids: Physiology, pharmacology, and novel therapeutic targets. Pharmacol. Rev. 2009, 61, 9–38. [Google Scholar] [CrossRef]
  3. Ishkaraeva-Yakovleva, V.V.; Fedorova, O.V.; Solodovnikova, N.G.; Frolova, E.V.; Bzhelyansky, A.M.; Emelyanov, I.V.; Adair, C.D.; Zazerskaya, I.E.; Bagrov, A.Y. DigiFab interacts with endogenous cardiotonic steroids and reverses preeclampsia-induced Na/K-ATPase inhibition. Reprod. Sci. 2012, 19, 1260–1267. [Google Scholar] [CrossRef] [PubMed]
  4. Liu, J.; Xie, Z.J. The sodium pump and cardiotonic steroids-induced signal transduction protein kinases and calcium-signaling microdomain in regulation of transporter trafficking. Biochim. Biophys. Acta 2010, 1802, 1237–1245. [Google Scholar] [CrossRef] [Green Version]
  5. Hamlyn, J.M.; Manunta, P. Endogenous cardiotonic steroids in kidney failure: A review and an hypothesis. Adv. Chronic Kidney Dis. 2015, 22, 232–244. [Google Scholar] [CrossRef] [PubMed] [Green Version]
  6. Gottlieb, S.S.; Rogowski, A.C.; Weinberg, M.; Krichten, C.M.; Hamilton, B.P.; Hamlyn, J.M. Elevated concentrations of endogenous ouabain in patients with congestive heart failure. Circulation 1992, 86, 420–425. [Google Scholar] [CrossRef] [PubMed] [Green Version]
  7. Deray, G.; Rieu, M.; Devynck, M.A.; Pernollet, M.G.; Chanson, P.; Luton, J.P.; Meyer, P. Evidence of an endogenous digitalis-like factor in the plasma of patients with acromegaly. N. Engl. J. Med. 1987, 316, 575–580. [Google Scholar] [CrossRef] [PubMed]
  8. Bagrov, A.Y.; Fedorova, O.V.; Dmitrieva, R.I.; Howald, W.N.; Hunter, A.P.; Kuznetsova, E.A.; Shpen, V.M. Characterization of a urinary bufodienolide Na+,K+-ATPase inhibitor in patients after acute myocardial infarction. Hypertension 1998, 31, 1097–1103. [Google Scholar] [CrossRef] [Green Version]
  9. Schoner, W.; Scheiner-Bobis, G. Endogenous and exogenous cardiac glycosides: Their roles in hypertension, salt metabolism, and cell growth. Am. J. Physiol. Cell Physiol. 2007, 293, C509–C536. [Google Scholar] [CrossRef] [PubMed]
  10. Hauck, C.; Frishman, W.H. Systemic hypertension: The roles of salt, vascular Na+/K+ ATPase and the endogenous glycosides, ouabain and marinobufagenin. Cardiol. Rev. 2012, 20, 130–138. [Google Scholar] [CrossRef]
  11. Bagrov, A.Y.; Kuznetsova, E.A.; Fedorova, O.V. Endogenous digoxin-like factor in acute myocardial infarction. J. Intern. Med. 1994, 235, 63–67. [Google Scholar] [CrossRef] [PubMed]
  12. Kennedy, D.J.; Vetteth, S.; Periyasamy, S.M.; Kanj, M.; Fedorova, L.; Khouri, S.; Kahaleh, M.B.; Xie, Z.; Malhotra, D.; Kolodkin, N.I.; et al. Central role for the cardiotonic steroid marinobufagenin in the pathogenesis of experimental uremic cardiomyopathy. Hypertension 2006, 47, 488–495. [Google Scholar] [CrossRef] [PubMed]
  13. Gonick, H.C.; Ding, Y.; Vaziri, N.D.; Bagrov, A.Y.; Fedorova, O.V. Simultaneous measurement of marinobufagenin, ouabain, and hypertension-associated protein in various disease states. Clin. Exp. Hypertens. 1998, 20, 617–627. [Google Scholar] [CrossRef]
  14. Manunta, P.; Stella, P.; Rivera, R.; Ciurlino, D.; Cusi, D.; Ferrandi, M.; Hamlyn, J.M.; Bianchi, G. Left ventricular mass, stroke volume, and ouabain-like factor in essential hypertension. Hypertension 1999, 34, 450–456. [Google Scholar] [CrossRef] [Green Version]
  15. Periyasamy, S.M.; Chen, J.; Cooney, D.; Carter, P.; Omran, E.; Tian, J.; Priyadarshi, S.; Bagrov, A.; Fedorova, O.; Malhotra, D.; et al. Effects of uremic serum on isolated cardiac myocyte calcium cycling and contractile function. Kidney Int. 2001, 60, 2367–2376. [Google Scholar] [CrossRef] [PubMed] [Green Version]
  16. Drummond, C.A.; Hill, M.C.; Shi, H.; Fan, X.; Xie, J.X.; Haller, S.T.; Kennedy, D.J.; Liu, J.; Garrett, M.R.; Xie, Z.; et al. Na/K-ATPase signaling regulates collagen synthesis through microRNA-29b-3p in cardiac fibroblasts. Physiol. Genom. 2016, 48, 220–229. [Google Scholar] [CrossRef] [PubMed] [Green Version]
  17. Lichtstein, D.; Rosen, H.; Dvela, M. Cardenolides and bufadienolides as hormones: What is missing? Am. J. Physiol. Physiol. 2012, 302, F957–F958. [Google Scholar] [CrossRef] [Green Version]
  18. Sen, A.K.; Post, R.L. Stoichiometry and localization of adenosine triphosphate-dependent sodium and potassium transport in the erythrocyte. J. Biol. Chem. 1964, 239, 345–352. [Google Scholar] [CrossRef]
  19. Lingrel, J.B. The physiological significance of the cardiotonic steroid/ouabain-binding site of the Na,K-ATPase. Annu. Rev. Physiol. 2010, 72, 395–412. [Google Scholar] [CrossRef] [Green Version]
  20. Bavendiek, U.; Aguirre Davila, L.; Koch, A.; Bauersachs, J. Assumption versus evidence: The case of digoxin in atrial fibrillation and heart failure. Eur. Heart J. 2017, 38, 2095–2099. [Google Scholar] [CrossRef] [Green Version]
  21. Eisen, A.; Ruff, C.T.; Braunwald, E.; Hamershock, R.A.; Lewis, B.S.; Hassager, C.; Chao, T.F.; Le Heuzey, J.Y.; Mercuri, M.; Rutman, H.; et al. Digoxin Use and Subsequent Clinical Outcomes in Patients With Atrial Fibrillation With or Without Heart Failure in the ENGAGE AF-TIMI 48 Trial. J. Am. Heart Assoc. 2017, 6, e006035. [Google Scholar] [CrossRef]
  22. Ziff, O.J.; Lane, D.A.; Samra, M.; Griffith, M.; Kirchhof, P.; Lip, G.Y.; Steeds, R.P.; Townend, J.; Kotecha, D. Safety and efficacy of digoxin: Systematic review and meta-analysis of observational and controlled trial data. BMJ 2015, 351, h4451. [Google Scholar] [CrossRef] [Green Version]
  23. Khundmiri, S.J. Advances in understanding the role of cardiac glycosides in control of sodium transport in renal tubules. J. Endocrinol. 2014, 222, R11–R24. [Google Scholar] [CrossRef] [Green Version]
  24. Liu, J.; Tian, J.; Haas, M.; Shapiro, J.I.; Askari, A.; Xie, Z. Ouabain Interaction with Cardiac Na+/K+-ATPase Initiates Signal Cascades Independent of Changes in Intracellular Na+ and Ca2+ Concentrations. J. Biol. Chem. 2000, 275, 27838–27844. [Google Scholar] [CrossRef]
  25. Tian, J.; Liu, J.; Garlid, K.D.; Shapiro, J.I.; Xie, Z. Involvement of mitogen-activated protein kinases and reactive oxygen species in the inotropic action of ouabain on cardiac myocytes. A potential role for mitochondrial K(ATP) channels. Mol. Cell. Biochem. 2003, 242, 181–187. [Google Scholar] [CrossRef] [PubMed]
  26. Akimova, O.A.; Bagrov, A.Y.; Lopina, O.D.; Kamernitsky, A.V.; Tremblay, J.; Hamet, P.; Orlov, S.N. Cardiotonic steroids differentially affect intracellular Na+ and [Na+]i/[K+]i-independent signaling in C7-MDCK cells. J. Biol. Chem. 2005, 280, 832–839. [Google Scholar] [CrossRef] [PubMed] [Green Version]
  27. Scheiner-Bobis, G.; Schoner, W. A fresh facet for ouabain action. Nat. Med. 2001, 7, 1288–1289. [Google Scholar] [CrossRef] [PubMed]
  28. Fontana, J.M.; Burlaka, I.; Khodus, G.; Brismar, H.; Aperia, A. Calcium oscillations triggered by cardiotonic steroids. FEBS J. 2013, 280, 5450–5455. [Google Scholar] [CrossRef] [PubMed] [Green Version]
  29. Aperia, A.; Akkuratov, E.E.; Fontana, J.M.; Brismar, H. Na+-K+-ATPase, a new class of plasma membrane receptors. Am. J. Physiol. Cell Physiol. 2016, 310, C491–C495. [Google Scholar] [CrossRef] [Green Version]
  30. Xie, Z.; Askari, A. Na(+)/K(+)-ATPase as a signal transducer. Eur. J. Biochem. 2002, 269, 2434–2439. [Google Scholar] [CrossRef] [PubMed] [Green Version]
  31. Xie, Z.; Kometiani, P.; Liu, J.; Li, J.; Shapiro, J.I.; Askari, A. Intracellular Reactive Oxygen Species Mediate the Linkage of Na+/K+-ATPase to Hypertrophy and Its Marker Genes in Cardiac Myocytes. J. Biol. Chem. 1999, 274, 19323–19328. [Google Scholar] [CrossRef] [PubMed] [Green Version]
  32. Tian, J.; Cai, T.; Yuan, Z.; Wang, H.; Liu, L.; Haas, M.; Maksimova, E.; Huang, X.Y.; Xie, Z.J. Binding of Src to Na+/K+-ATPase forms a functional signaling complex. Mol. Biol. Cell 2006, 17, 317–326. [Google Scholar] [CrossRef] [PubMed] [Green Version]
  33. Peng, M.; Huang, L.; Xie, Z.; Huang, W.-H.; Askari, A. Partial Inhibition of Na/K-ATPase by Ouabain Induces the Ca-dependent Expressions of Early-response Genes in Cardiac Myocytes. J. Biol. Chem. 1996, 271, 10372–10378. [Google Scholar] [CrossRef] [PubMed] [Green Version]
  34. Huang, L.; Li, H.; Xie, Z. Ouabain-induced hypertrophy in cultured cardiac myocytes is accompanied by changes in expression of several late response genes. J. Biol. Chem. 1997, 29, 429–437. [Google Scholar] [CrossRef] [PubMed]
  35. Liu, L.; Li, J.; Liu, J.; Yuan, Z.; Pierre, S.V.; Qu, W.; Zhao, X.; Xie, Z. Involvement of Na+/K+-ATPase in hydrogen peroxide-induced hypertrophy in cardiac myocytes. Free Radic. Biol. Med. 2006, 41, 1548–1556. [Google Scholar] [CrossRef]
  36. Yan, Y.; Shapiro, A.P.; Haller, S.; Katragadda, V.; Liu, L.; Tian, J.; Basrur, V.; Malhotra, D.; Xie, Z.J.; Abraham, N.G.; et al. Involvement of reactive oxygen species in a feed-forward mechanism of Na/K-ATPase-mediated signaling transduction. J. Biol. Chem. 2013, 288, 34249–34258. [Google Scholar] [CrossRef] [PubMed] [Green Version]
  37. Liu, J.; Tian, J.; Chaudhry, M.; Maxwell, K.; Yan, Y.; Wang, X.; Shah, P.T.; Khawaja, A.A.; Martin, R.; Robinette, T.J.; et al. Attenuation of Na/K-ATPase Mediated Oxidant Amplification with pNaKtide Ameliorates Experimental Uremic Cardiomyopathy. Sci. Rep. 2016, 6, 34592. [Google Scholar] [CrossRef]
  38. Ritterhoff, J.; Young, S.; Villet, O.; Shao, D.; Neto, F.C.; Bettcher, L.F.; Hsu, Y.A.; Kolwicz, S.C., Jr.; Raftery, D.; Tian, R. Metabolic Remodeling Promotes Cardiac Hypertrophy by Directing Glucose to Aspartate Biosynthesis. Circ. Res. 2020, 126, 182–196. [Google Scholar] [CrossRef]
  39. Xiang, K.; Qin, Z.; Zhang, H.; Liu, X. Energy Metabolism in Exercise-Induced Physiologic Cardiac Hypertrophy. Front. Pharmacol. 2020, 11, 1133. [Google Scholar] [CrossRef] [PubMed]
  40. Maillet, M.; van Berlo, J.H.; Molkentin, J.D. Molecular basis of physiological heart growth: Fundamental concepts and new players. Nat. Rev. Mol. Cell Biol. 2013, 14, 38–48. [Google Scholar] [CrossRef] [Green Version]
  41. Gibb, A.A.; Hill, B.G. Metabolic Coordination of Physiological and Pathological Cardiac Remodeling. Circ. Res. 2018, 123, 107–128. [Google Scholar] [CrossRef]
  42. Nakamura, M.; Sadoshima, J. Mechanisms of physiological and pathological cardiac hypertrophy. Nat. Rev. Cardiol. 2018, 15, 387–407. [Google Scholar] [CrossRef]
  43. Quijano, C.; Trujillo, M.; Castro, L.; Trostchansky, A. Interplay between oxidant species and energy metabolism. Redox Biol. 2016, 8, 28–42. [Google Scholar] [CrossRef] [Green Version]
  44. Korla, K. Reactive oxygen species and energy machinery: An integrated dynamic model. J. Biomol. Struct. Dyn. 2016, 34, 1625–1640. [Google Scholar] [CrossRef]
  45. Jakubczyk, K.; Dec, K.; Kałduńska, J.; Kawczuga, D.; Kochman, J.; Janda, K. Reactive oxygen species—Sources, functions, oxidative damage. Pol. Merkur. Lek. 2020, 48, 124–127. [Google Scholar]
  46. Pratt, R.D.; Brickman, C.R.; Cottrill, C.L.; Shapiro, J.I.; Liu, J. The Na/K-ATPase Signaling: From Specific Ligands to General Reactive Oxygen Species. Int. J. Mol. Sci. 2018, 19, 2600. [Google Scholar] [CrossRef] [Green Version]
  47. Ichihara, S.; Senbonmatsu, T.; Price, E., Jr.; Ichiki, T.; Gaffney, F.A.; Inagami, T. Angiotensin II type 2 receptor is essential for left ventricular hypertrophy and cardiac fibrosis in chronic angiotensin II-induced hypertension. Circulation 2001, 104, 346–351. [Google Scholar] [CrossRef] [Green Version]
  48. Ni, H.; Li, W.; Zhuge, Y.; Xu, S.; Wang, Y.; Chen, Y.; Shen, G.; Wang, F. Inhibition of circHIPK3 prevents angiotensin II-induced cardiac fibrosis by sponging miR-29b-3p. Int. J. Cardiol. 2019, 292, 188–196. [Google Scholar] [CrossRef] [PubMed]
  49. Dostanic, I.; Schultz Jel, J.; Lorenz, J.N.; Lingrel, J.B. The alpha 1 isoform of Na,K-ATPase regulates cardiac contractility and functionally interacts and co-localizes with the Na/Ca exchanger in heart. J. Biol. Chem. 2004, 279, 54053–54061. [Google Scholar] [CrossRef] [PubMed]
  50. Wansapura, A.N.; Lasko, V.; Xie, Z.; Fedorova, O.V.; Bagrov, A.Y.; Lingrel, J.B.; Lorenz, J.N. Marinobufagenin enhances cardiac contractility in mice with ouabain-sensitive alpha1 Na+-K+-ATPase. Am. J. Physiol. Circ. Physiol. 2009, 296, H1833–H1839. [Google Scholar] [CrossRef] [Green Version]
  51. Wansapura, A.N.; Lasko, V.M.; Lingrel, J.B.; Lorenz, J.N. Mice expressing ouabain-sensitive α1-Na,K-ATPase have increased susceptibility to pressure overload-induced cardiac hypertrophy. Am. J. Physiol. Circ. Physiol. 2011, 300, H347–H355. [Google Scholar] [CrossRef] [Green Version]
  52. Dostanic-Larson, I.; Lorenz, J.N.; Van Huysse, J.W.; Neumann, J.C.; Moseley, A.E.; Lingrel, J.B. Physiological role of the alpha1- and alpha2-isoforms of the Na+-K+-ATPase and biological significance of their cardiac glycoside binding site. Am. J. Physiol. Integr. Comp. Physiol. 2006, 290, R524–R528. [Google Scholar] [CrossRef] [PubMed] [Green Version]
  53. Dostanic-Larson, I.; Van Huysse, J.W.; Lorenz, J.N.; Lingrel, J.B. The highly conserved cardiac glycoside binding site of Na,K-ATPase plays a role in blood pressure regulation. Proc. Natl. Acad. Sci. USA 2005, 102, 15845–15850. [Google Scholar] [CrossRef] [PubMed] [Green Version]
  54. Shioi, T.; Kang, P.M.; Douglas, P.S.; Hampe, J.; Yballe, C.M.; Lawitts, J.; Cantley, L.C.; Izumo, S. The conserved phosphoinositide 3-kinase pathway determines heart size in mice. EMBO J. 2000, 19, 2537–2548. [Google Scholar] [CrossRef] [Green Version]
  55. O’Neill, B.T.; Kim, J.; Wende, A.R.; Theobald, H.A.; Tuinei, J.; Buchanan, J.; Guo, A.; Zaha, V.G.; Davis, D.K.; Schell, J.C.; et al. A conserved role for phosphatidylinositol 3-kinase but not Akt signaling in mitochondrial adaptations that accompany physiological cardiac hypertrophy. Cell Metab. 2007, 6, 294–306. [Google Scholar] [CrossRef] [Green Version]
  56. Luo, J.; McMullen, J.R.; Sobkiw, C.L.; Zhang, L.; Dorfman, A.L.; Sherwood, M.C.; Logsdon, M.N.; Horner, J.W.; DePinho, R.A.; Izumo, S.; et al. Class IA phosphoinositide 3-kinase regulates heart size and physiological cardiac hypertrophy. Mol. Cell. Biol. 2005, 25, 9491–9502. [Google Scholar] [CrossRef] [Green Version]
  57. Sabri, A.; Hughie, H.H.; Lucchesi, P.A. Regulation of hypertrophic and apoptotic signaling pathways by reactive oxygen species in cardiac myocytes. Antioxid. Redox Signal. 2003, 5, 731–740. [Google Scholar] [CrossRef]
  58. Sag, C.M.; Santos, C.X.; Shah, A.M. Redox regulation of cardiac hypertrophy. J. Biol. Chem. 2014, 73, 103–111. [Google Scholar] [CrossRef] [Green Version]
  59. Anilkumar, N.; Sirker, A.; Shah, A.M. Redox sensitive signaling pathways in cardiac remodeling, hypertrophy and failure. Front. Biosci. 2009, 14, 3168–3187. [Google Scholar] [CrossRef] [PubMed]
  60. Schwarzer, M.; Osterholt, M.; Lunkenbein, A.; Schrepper, A.; Amorim, P.; Doenst, T. Mitochondrial reactive oxygen species production and respiratory complex activity in rats with pressure overload-induced heart failure. J. Physiol. 2014, 592, 3767–3782. [Google Scholar] [CrossRef]
  61. Dai, D.F.; Johnson, S.C.; Villarin, J.J.; Chin, M.T.; Nieves-Cintrón, M.; Chen, T.; Marcinek, D.J.; Dorn, G.W., 2nd; Kang, Y.J.; Prolla, T.A.; et al. Mitochondrial oxidative stress mediates angiotensin II-induced cardiac hypertrophy and Galphaq overexpression-induced heart failure. Circ. Res. 2011, 108, 837–846. [Google Scholar] [CrossRef] [Green Version]
  62. Ago, T.; Liu, T.; Zhai, P.; Chen, W.; Li, H.; Molkentin, J.D.; Vatner, S.F.; Sadoshima, J. A redox-dependent pathway for regulating class II HDACs and cardiac hypertrophy. Cell 2008, 133, 978–993. [Google Scholar] [CrossRef] [PubMed] [Green Version]
  63. Pavlovic, D. Endogenous cardiotonic steroids and cardiovascular disease, where to next? Cell Calcium 2020, 86, 102156. [Google Scholar] [CrossRef] [PubMed]
  64. Schoner, W.; Scheiner-Bobis, G. Role of endogenous cardiotonic steroids in sodium homeostasis. Nephrol. Dial. Transplant. 2008, 23, 2723–2729. [Google Scholar] [CrossRef] [PubMed] [Green Version]
  65. Kau, M.M.; Kan, S.F.; Wang, J.R.; Wang, P.S.; Lau, Y.T.; Wang, S.W. Acute effects of digoxin on plasma aldosterone and cortisol in monkeys. Metabolism 2009, 58, 55–61. [Google Scholar] [CrossRef] [PubMed]
  66. Sophocleous, A.; Elmatzoglou, I.; Souvatzoglou, A. Circulating endogenous digitalis-like factor(s) (EDLF) in man is derived from the adrenals and its secretion is ACTH-dependent. J. Endocrinol. Investig. 2003, 26, 668–674. [Google Scholar] [CrossRef]
  67. Dvela-Levitt, M.; Cohen-Ben Ami, H.; Rosen, H.; Ornoy, A.; Hochner-Celnikier, D.; Granat, M.; Lichtstein, D. Reduction in Maternal Circulating Ouabain Impairs Offspring Growth and Kidney Development. Am. J. Physiol. Circ. Physiol. 2015, 26, 1103–1114. [Google Scholar] [CrossRef] [Green Version]
  68. Chen, L.; Yue, J.; Wu, H.; Yang, J.; Han, X.; Li, J.; Hu, Y. Ouabain Attenuates Cardiac Hypertrophy of Male Rat Offspring Exposed to Intrauterine Growth Restriction Following High-Salt Diet Challenge. Reprod. Sci. 2015, 22, 1587–1596. [Google Scholar] [CrossRef] [PubMed]
  69. Jacobs, B.E.; Liu, Y.; Pulina, M.V.; Golovina, V.A.; Hamlyn, J.M. Normal pregnancy: Mechanisms underlying the paradox of a ouabain-resistant state with elevated endogenous ouabain, suppressed arterial sodium calcium exchange, and low blood pressure. Am. J. Physiol. Circ. Physiol. 2012, 302, H1317–H1329. [Google Scholar] [CrossRef] [Green Version]
  70. Clerico, A.; Cambi, A.; Del Chicca, M.G.; Cecchini, L.; Giaconi, S. Urinary excretion of digoxin-like immunoreactivity after physical exercise. Clin. Chem. 1988, 34, 215. [Google Scholar] [CrossRef] [PubMed]
  71. Yoshika, M.; Komiyama, Y.; Konishi, M.; Akizawa, T.; Kobayashi, T.; Date, M.; Kobatake, S.; Masuda, M.; Masaki, H.; Takahashi, H. Novel digitalis-like factor, marinobufotoxin, isolated from cultured Y-1 cells, and its hypertensive effect in rats. Hypertension 2007, 49, 209–214. [Google Scholar] [CrossRef] [Green Version]
  72. Ferrandi, M.; Barassi, P.; Molinari, I.; Torielli, L.; Tripodi, G.; Minotti, E.; Bianchi, G.; Ferrari, P. Ouabain antagonists as antihypertensive agents. Curr. Pharm. Des. 2005, 11, 3301–3305. [Google Scholar] [CrossRef] [PubMed]
  73. Maixent, J.M.; Lelièvre, L.G. Differential inactivation of inotropic and toxic digitalis receptors in ischemic dog heart. Molecular basis of the deleterious effects of digitalis. J. Biol. Chem. 1987, 262, 12458–12462. [Google Scholar] [CrossRef]
  74. Liu, C.C.; Fry, N.A.; Hamilton, E.J.; Chia, K.K.; Garcia, A.; Karimi Galougahi, K.; Figtree, G.A.; Clarke, R.J.; Bundgaard, H.; Rasmussen, H.H. Redox-dependent regulation of the Na⁺-K⁺ pump: New twists to an old target for treatment of heart failure. J. Biol. Chem. 2013, 61, 94–101. [Google Scholar] [CrossRef] [PubMed] [Green Version]
  75. Mohmand, B.; Malhotra, D.K.; Shapiro, J.I. Uremic cardiomyopathy: Role of circulating digitalis like substances. Front. Biosci. 2005, 10, 2036–2044. [Google Scholar] [CrossRef] [Green Version]
  76. Taniike, M.; Yamaguchi, O.; Tsujimoto, I.; Hikoso, S.; Takeda, T.; Nakai, A.; Omiya, S.; Mizote, I.; Nakano, Y.; Higuchi, Y.; et al. Apoptosis signal-regulating kinase 1/p38 signaling pathway negatively regulates physiological hypertrophy. Circulation 2008, 117, 545–552. [Google Scholar] [CrossRef] [Green Version]
  77. Tian, Z.; Miyata, K.; Kadomatsu, T.; Horiguchi, H.; Fukushima, H.; Tohyama, S.; Ujihara, Y.; Okumura, T.; Yamaguchi, S.; Zhao, J.; et al. ANGPTL2 activity in cardiac pathologies accelerates heart failure by perturbing cardiac function and energy metabolism. Nat. Commun. 2016, 7, 13016. [Google Scholar] [CrossRef] [PubMed] [Green Version]
  78. Ruppert, C.; Deiss, K.; Herrmann, S.; Vidal, M.; Oezkur, M.; Gorski, A.; Weidemann, F.; Lohse, M.J.; Lorenz, K. Interference with ERK(Thr188) phosphorylation impairs pathological but not physiological cardiac hypertrophy. Proc. Natl. Acad. Sci. USA 2013, 110, 7440–7445. [Google Scholar] [CrossRef] [Green Version]
  79. Haller, S.T.; Kennedy, D.J.; Shidyak, A.; Budny, G.V.; Malhotra, D.; Fedorova, O.V.; Shapiro, J.I.; Bagrov, A.Y. Monoclonal antibody against marinobufagenin reverses cardiac fibrosis in rats with chronic renal failure. Am. J. Hypertens. 2012, 25, 690–696. [Google Scholar] [CrossRef] [Green Version]
  80. Orlov, S.N.; La, J.; Smolyaninova, L.V.; Dulin, N.O. Na+,K+-ATPase as a Target for Treatment of Tissue Fibrosis. Curr. Med. Chem. 2019, 26, 564–575. [Google Scholar] [CrossRef]
  81. Kennedy, D.J.; Shrestha, K.; Sheehey, B.; Li, X.S.; Guggilam, A.; Wu, Y.; Finucan, M.; Gabi, A.; Medert, C.M.; Westfall, K.; et al. Elevated Plasma Marinobufagenin, An Endogenous Cardiotonic Steroid, Is Associated With Right Ventricular Dysfunction and Nitrative Stress in Heart Failure. Circ. Heart Fail. 2015, 8, 1068–1076. [Google Scholar] [CrossRef] [Green Version]
  82. Strauss-Kruger, M.; Kruger, R.; Smith, W.; Gafane-Matemane, L.F.; Mokwatsi, G.; Wei, W.; Fedorova, O.V.; Schutte, A.E. The Cardiotonic Steroid Marinobufagenin Is a Predictor of Increased Left Ventricular Mass in Obesity: The African-PREDICT Study. Nutrients 2020, 12, 3185. [Google Scholar] [CrossRef] [PubMed]
  83. Simonini, M.; Pozzoli, S.; Bignami, E.; Casamassima, N.; Messaggio, E.; Lanzani, C.; Frati, E.; Botticelli, I.M.; Rotatori, F.; Alfieri, O.; et al. Endogenous Ouabain: An Old Cardiotonic Steroid as a New Biomarker of Heart Failure and a Predictor of Mortality after Cardiac Surgery. BioMed Res. Int. 2015, 2015, 714793. [Google Scholar] [CrossRef] [Green Version]
  84. Xu, Y.; Jiang, X.; Xu, J.; Qu, W.; Xie, Z.; Jiang, R.W.; Feng, F. A previously undescribed phenylethanoid glycoside from Callicarpa kwangtungensis Chun acts as an agonist of the Na/K-ATPase signal transduction pathway. Phytochemistry 2021, 181, 112577. [Google Scholar] [CrossRef] [PubMed]
  85. Manunta, P.; Ferrandi, M. Different effects of marinobufagenin and endogenous ouabain. J. Hypertens. 2004, 22, 257–259. [Google Scholar] [CrossRef] [PubMed]
  86. Zulian, A.; Linde, C.I.; Pulina, M.V.; Baryshnikov, S.G.; Papparella, I.; Hamlyn, J.M.; Golovina, V.A. Activation of c-SRC underlies the differential effects of ouabain and digoxin on Ca(2+) signaling in arterial smooth muscle cells. Am. J. Physiol. Cell Physiol. 2013, 304, C324–C333. [Google Scholar] [CrossRef] [Green Version]
  87. Blaustein, M.P. Endogenous ouabain: Role in the pathogenesis of hypertension. Kidney Int. 1996, 49, 1748–1753. [Google Scholar] [CrossRef] [Green Version]
  88. Blaustein, M.P.; Hamlyn, J.M. Signaling mechanisms that link salt retention to hypertension: Endogenous ouabain, the Na(+) pump, the Na(+)/Ca(2+) exchanger and TRPC proteins. Biochim. Biophys. Acta 2010, 1802, 1219–1229. [Google Scholar] [CrossRef] [PubMed] [Green Version]
  89. Tomaschitz, A.; Piecha, G.; Ritz, E.; Meinitzer, A.; Haas, J.; Pieske, B.; Wiecek, A.; Rus-Machan, J.; Toplak, H.; März, W.; et al. Marinobufagenin in essential hypertension and primary aldosteronism: A cardiotonic steroid with clinical and diagnostic implications. Clin. Exp. Hypertens. 2015, 37, 108–115. [Google Scholar] [CrossRef] [PubMed]
  90. Ferrandi, M.; Molinari, I.; Barassi, P.; Minotti, E.; Bianchi, G.; Ferrari, P. Organ hypertrophic signaling within caveolae membrane subdomains triggered by ouabain and antagonized by PST 2238. J. Biol. Chem. 2004, 279, 33306–33314. [Google Scholar] [CrossRef] [Green Version]
  91. Zahler, R.; Gilmore-Hebert, M.; Sun, W.; Benz, E.J. Na, K-ATPase isoform gene expression in normal and hypertrophied dog heart. Basic Res. Cardiol. 1996, 91, 256–266. [Google Scholar] [CrossRef]
  92. Shamraj, O.I.; Grupp, I.L.; Grupp, G.; Melvin, D.; Gradoux, N.; Kremers, W.; Lingrel, J.B.; De Pover, A. Characterisation of Na/K-ATPase, its isoforms, and the inotropic response to ouabain in isolated failing human hearts. Cardiovasc. Res. 1993, 27, 2229–2237. [Google Scholar] [CrossRef] [Green Version]
  93. Schwinger, R.H.; Bundgaard, H.; Müller-Ehmsen, J.; Kjeldsen, K. The Na, K-ATPase in the failing human heart. Cardiovasc. Res. 2003, 57, 913–920. [Google Scholar] [CrossRef] [Green Version]
  94. Tsuruya, Y.; Ikeda, U.; Yamamoto, K.; Seino, Y.; Kanbe, T.; Shimada, K. Decreased Na,K-ATPase gene expression in cardiomyopathic hamster hearts. Life Sci. 1994, 54, 71–77. [Google Scholar] [CrossRef]
  95. Gerbi, A.; Barbey, O.; Raccah, D.; Coste, T.; Jamme, I.; Nouvelot, A.; Ouafik, L.; Levy, S.; Vague, P.; Maixent, J.M. Alteration of Na,K-ATPase isoenzymes in diabetic cardiomyopathy: Effect of dietary supplementation with fish oil (n-3 fatty acids) in rats. Diabetologia 1997, 40, 496–505. [Google Scholar] [CrossRef] [Green Version]
  96. Duan, Q.; Madan, N.D.; Wu, J.; Kalisz, J.; Doshi, K.Y.; Haldar, S.M.; Liu, L.; Pierre, S.V. Role of phosphoinositide 3-kinase IA (PI3K-IA) activation in cardioprotection induced by ouabain preconditioning. J. Biol. Chem. 2015, 80, 114–125. [Google Scholar] [CrossRef] [PubMed] [Green Version]
  97. Yan, Y.; Shapiro, A.P.; Mopidevi, B.R.; Chaudhry, M.A.; Maxwell, K.; Haller, S.T.; Drummond, C.A.; Kennedy, D.J.; Tian, J.; Malhotra, D.; et al. Protein Carbonylation of an Amino Acid Residue of the Na/K-ATPase α1 Subunit Determines Na/K-ATPase Signaling and Sodium Transport in Renal Proximal Tubular Cells. J. Am. Heart Assoc. 2016, 5, e003675. [Google Scholar] [CrossRef]
  98. Duan, Q.; Xu, Y.; Marck, P.V.; Kalisz, J.; Morgan, E.E.; Pierre, S.V. Preconditioning and Postconditioning by Cardiac Glycosides in the Mouse Heart. J. Cardiovasc. Pharmacol. 2018, 71, 95–103. [Google Scholar] [CrossRef] [PubMed]
  99. Bisserier, M.; Berthouze-Duquesnes, M.; Breckler, M.; Tortosa, F.; Fazal, L.; de Régibus, A.; Laurent, A.C.; Varin, A.; Lucas, A.; Branchereau, M.; et al. Carabin protects against cardiac hypertrophy by blocking calcineurin, Ras, and Ca2+/calmodulin-dependent protein kinase II signaling. Circulation 2015, 131, 390–400. [Google Scholar] [CrossRef] [PubMed] [Green Version]
  100. Livak, K.J.; Schmittgen, T.D. Analysis of relative gene expression data using real-time quantitative PCR and the 2(-Delta Delta C(T)) Method. Methods 2001, 25, 402–408. [Google Scholar] [CrossRef] [PubMed]
  101. Zhong, J.; Basu, R.; Guo, D.; Chow, F.L.; Byrns, S.; Schuster, M.; Loibner, H.; Wang, X.H.; Penninger, J.M.; Kassiri, Z.; et al. Angiotensin-converting enzyme 2 suppresses pathological hypertrophy, myocardial fibrosis, and cardiac dysfunction. Circulation 2010, 122, 717–728. [Google Scholar] [CrossRef] [PubMed]
  102. Love, M.I.; Huber, W.; Anders, S. Moderated estimation of fold change and dispersion for RNA-seq data with DESeq2. Genome Biol. 2014, 15, 550. [Google Scholar] [CrossRef] [PubMed] [Green Version]
  103. Liao, Y.; Wang, J.; Jaehnig, E.J.; Shi, Z.; Zhang, B. WebGestalt 2019: Gene set analysis toolkit with revamped UIs and APIs. Nucleic Acids Res. 2019, 47, W199–W205. [Google Scholar] [CrossRef] [PubMed] [Green Version]
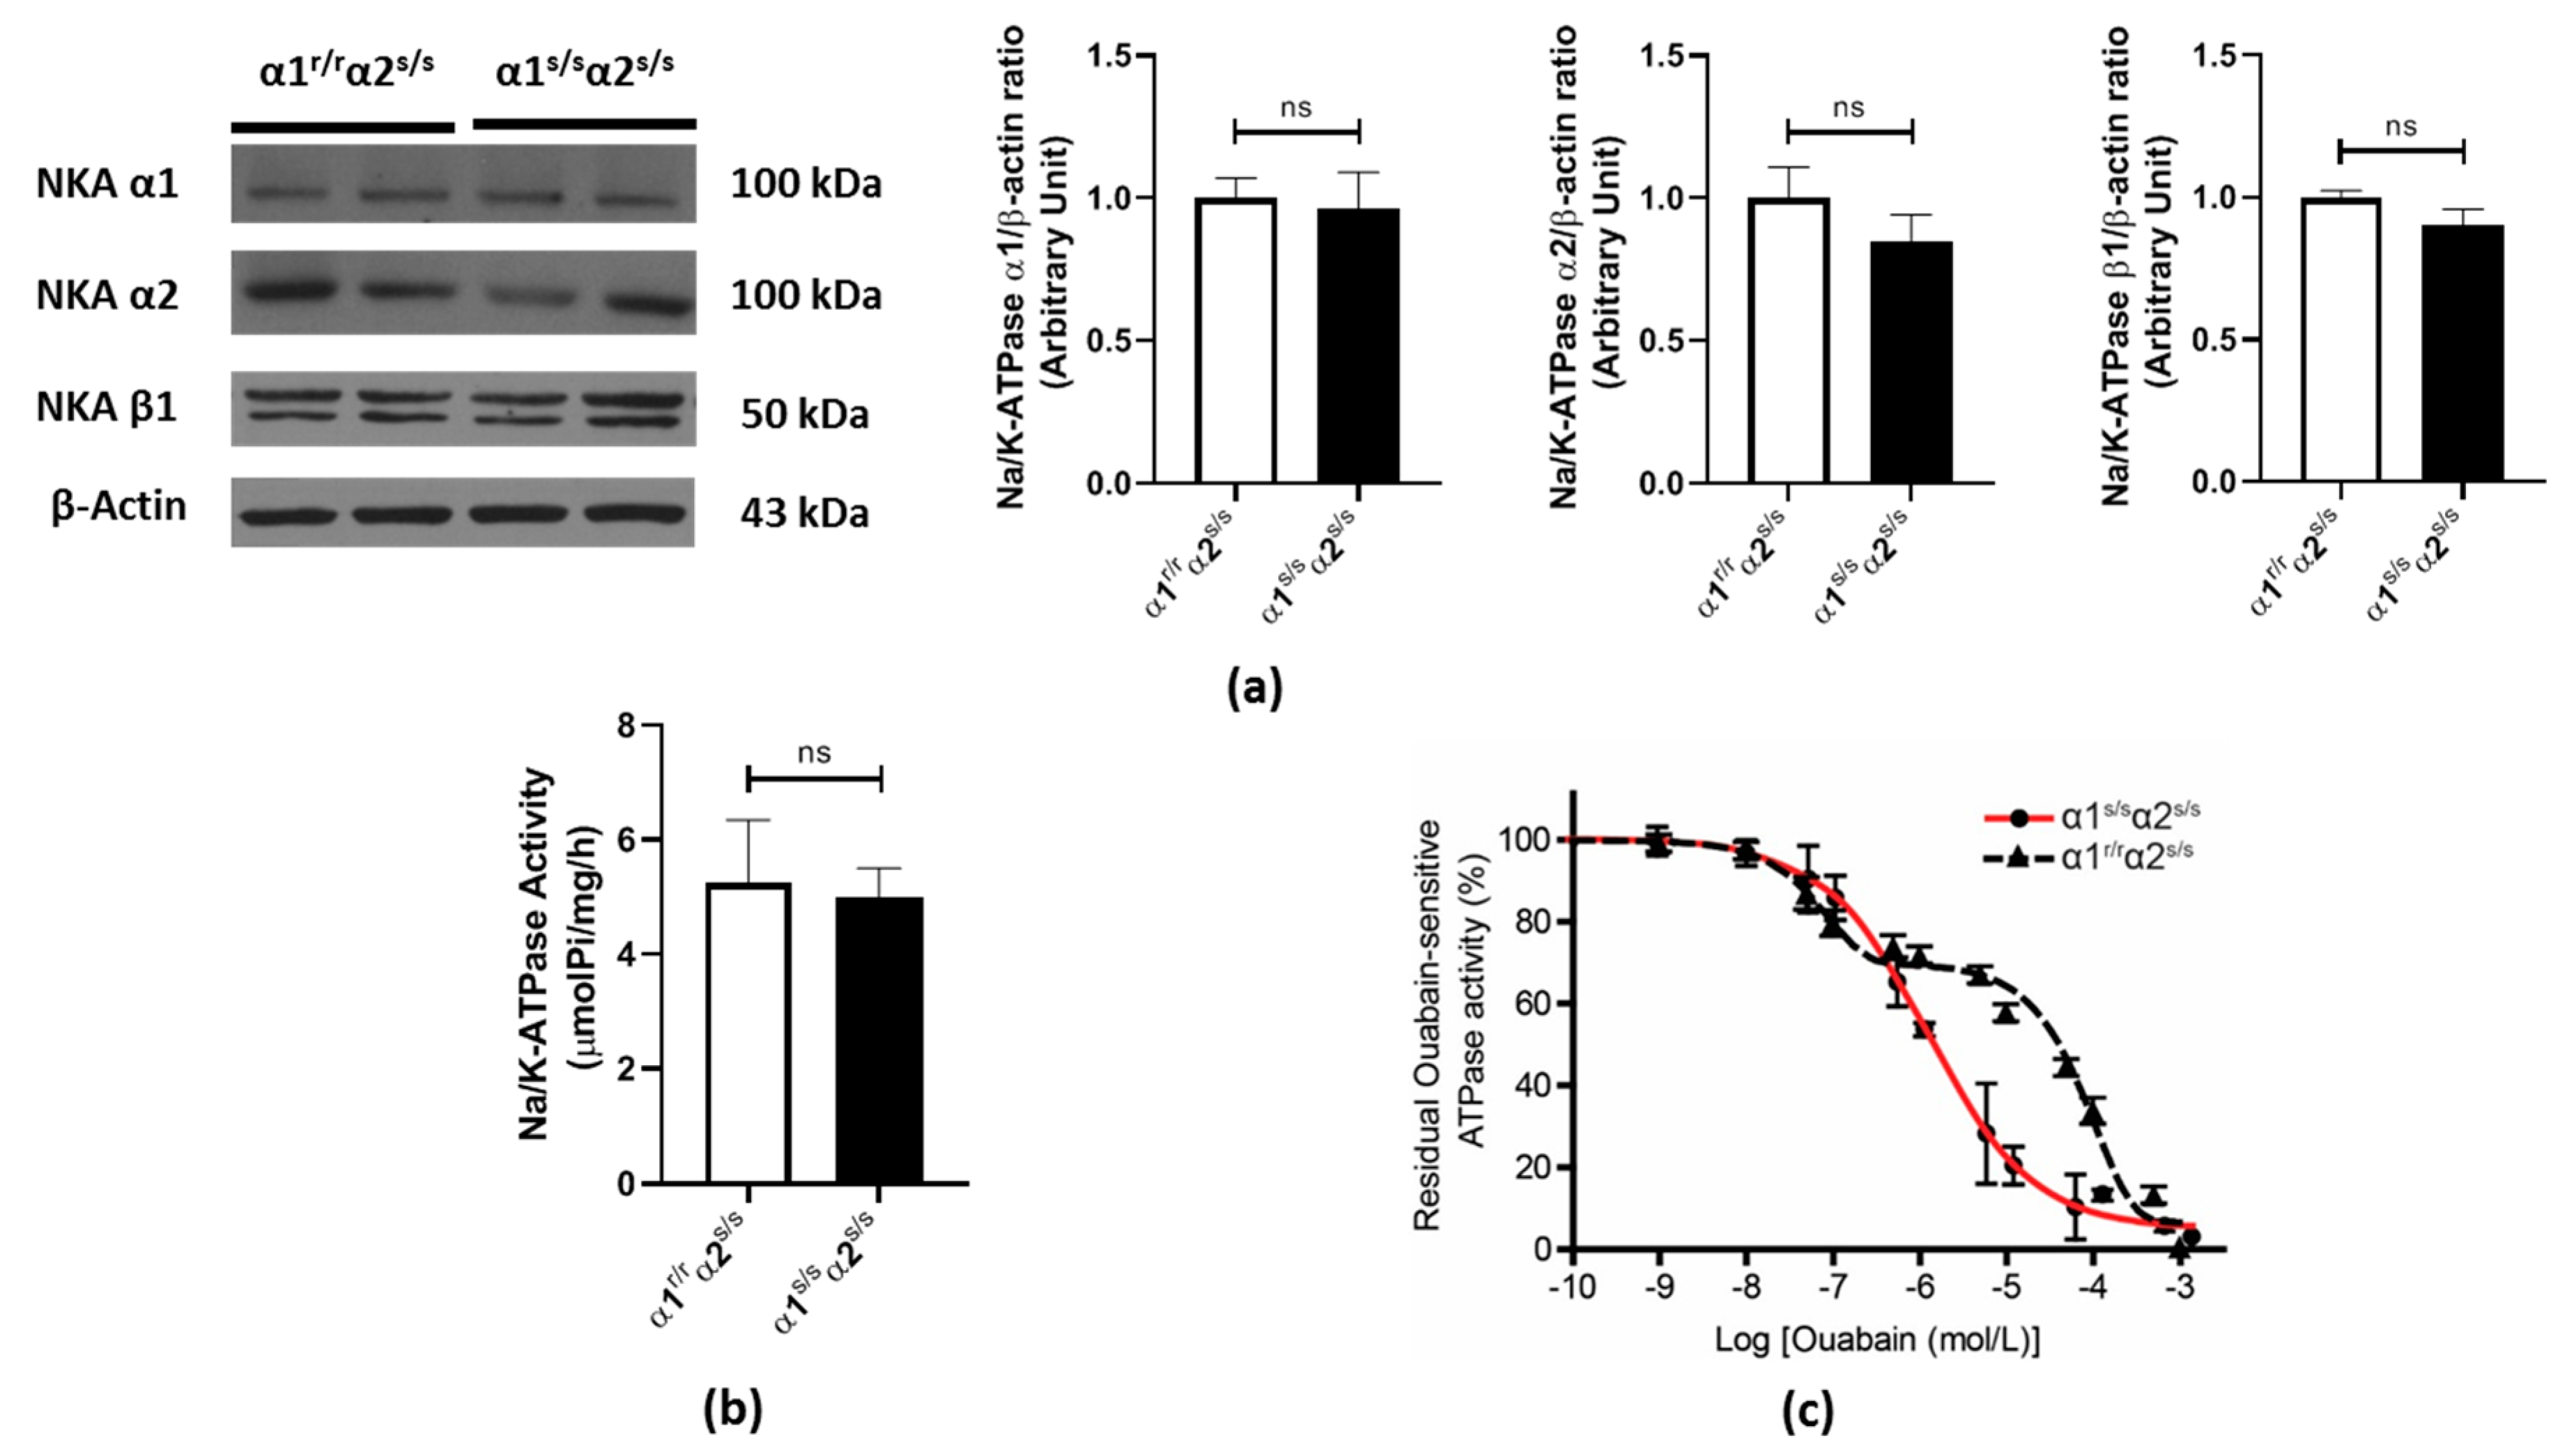
Figure 1. Increased Na/K-ATPase sensitivity to ouabain in α1s/sα2s/s hearts: (a) Representative Western blots and quantitative analysis for Na/K-ATPase α1, α2, and β1 isoforms in heart homogenates (n = 5–6 hearts/genotype). (b) Maximal ATPase activity in crude membrane fractions was measured using a colorimetric assay for Pi release (n = 6 hearts/genotype). (c) Na/K-ATPase dose–response curve to the cardiotonic steroids (CTS) ouabain. Maximal ATPase activity in crude membrane fractions was measured using a colorimetric assay for Pi release in the presence of the ionophore alamethicin and the indicated concentrations of ouabain. The monophasic curve obtained for the α1s/sα2s/s is shown in red along with the biphasic curve obtained in the wild-type (α1r/rα2s/s) mouse heart (n = 3 hearts/genotype). ns: non-significant, p > 0.05.
Ijms 22 03462 g001
Figure 2. Cardiac hypertrophy in α1s/sα2s/s mice: (a) Cross-section of whole left ventricles stained with Masson’s trichrome (top); scale bar = 1 mm. Heart weight/tibia length (HW/TL) quantification (bottom) (n = 14–16 hearts/genotype). (b) Wheat germ agglutinin (WGA) staining of left ventricle cross-sections from α1r/rα2s/s (top left) and α1s/sα2s/s (bottom left) mice; scale bar = 50 μm. Average cardiomyocyte cross-sectional area (top right) was automatically quantified in over 1000 cells from at least five different random fields (n = 4–7 hearts/genotype). Cardiomyocyte density (bottom right) was determined by the number of cardiomyocytes per mm2. * p < 0.05; ** p < 0.01.
Ijms 22 03462 g002
Figure 3. Absence of cardiac fibrosis or change in the fetal gene program in α1s/sα2s/s mice: (a) Representative histological sections of left ventricles from α1r/rα2s/s and α1s/sα2s/s (top) mice stained with Masson’s trichrome; scale bar = 200 μm. Fibrosis area quantification (bottom) (n = 5 hearts/genotype). (b) Collagen-1 mRNA levels in the left ventricle determined by RT-qPCR (n = 4–5 hearts/genotype). (c) mRNA levels of α-skeletal actin (α-sk actin), β-heavy myosin chain (β-MHC), and brain natriuretic peptide (BNP) in left ventricles determined by RT-qPCR (n = 6 hearts/genotype). ns: non-significant, p > 0.05.
Ijms 22 03462 g003
Figure 4. RNA-seq analysis comparing the transcriptome of α1r/rα2s/s and α1s/sα2s/s hearts: (a) Volcano plot of gene expression in α1r/rα2s/s and α1s/sα2s/s hearts plotting -log10 of adjusted p-value on y-axis and log2 fold change on x-axis. Red dots are downregulated (left) and upregulated (right) genes with a log2 fold change greater than 0.5. Blue dots represent those genes with a log2 fold change less than 0.5. Green and black dots represent genes with an adjusted p-value greater than 0.05. (b) The enriched pathways in the category of Cellular Component of the Gene Ontology database. (c) Pathway enrichment using the Reactome database. Pathway enrichment analysis were performed with Gene Set Enrichment Analysis (GSEA) as described in the Materials and Methods section. Blue bars represent upregulated pathways and orange bars represent downregulated pathways.
Ijms 22 03462 g004aIjms 22 03462 g004b
Figure 5. Increased protein carbonylation in α1s/sα2s/s hearts: Representative Western blot analysis of protein carbonylation and Ponceau S staining as a loading control in left ventricle homogenates and associated quantitative data (n = 7–8 hearts/group). *** p < 0.001; DNP: 2,4-dinitrophenyl.
Ijms 22 03462 g005
Figure 6. Angiotensin-II does not induce cardiac fibrosis in α1s/sα2s/s mice: The left panels show representative histological sections stained with Masson’s trichrome, and the right panels show the quantitative data of fibrosis analyzed using ImageJ (n = 4–8 hearts/group). Scale Bar = 100 µm. *** p < 0.001; ns: non-significant, p > 0.05.
Ijms 22 03462 g006
Table 1. Echocardiographic parameters in α1r/rα2s/s and α1s/sα2s/s mice. * p < 0.05.
Parameterα1r/rα2s/s (n = 9)α1s/sα2s/s (n = 6)
HR (bpm)457 ± 23475 ± 31
LVID; s (mm)2.50 ± 0.522.60 ± 0.42
LVID; d (mm)3.61 ± 0.543.86 ± 0.28
LV Volume; s (µL)23.7 ± 10.625.5 ± 9.2
LV Volume; d (µL)56.6 ± 18.764.9 ± 11.0
SV (µL)32.9 ± 11.239.4 ± 3.8
EF (%)59 ± 1162 ± 9
FS (%)31 ± 733 ± 7
CO (mL/min)14.9 ± 4.718.7 ± 2.1
LVAW; s (mm)1.34 ± 0.161.53 ± 0.12 *
LVAW; d (mm)0.95 ± 0.121.06 ± 0.11
LVPW; s (mm)1.19 ± 0.171.24 ± 0.24
LVPW; d (mm)0.80 ± 0.100.84 ± 0.18
LV Mass (mg)87.1 ± 12.4110.7 ± 19.9 *
Publisher’s Note: MDPI stays neutral with regard to jurisdictional claims in published maps and institutional affiliations.