
Amyloid-Beta Induces Different Expression Pattern of Tissue Transglutaminase and Its Isoforms on Olfactory Ensheathing Cells: Modulatory Effect of Indicaxanthin

 , , ,
, , ,  ,
,  ,
,  and
and
Abstract
1. Introduction
2. Results
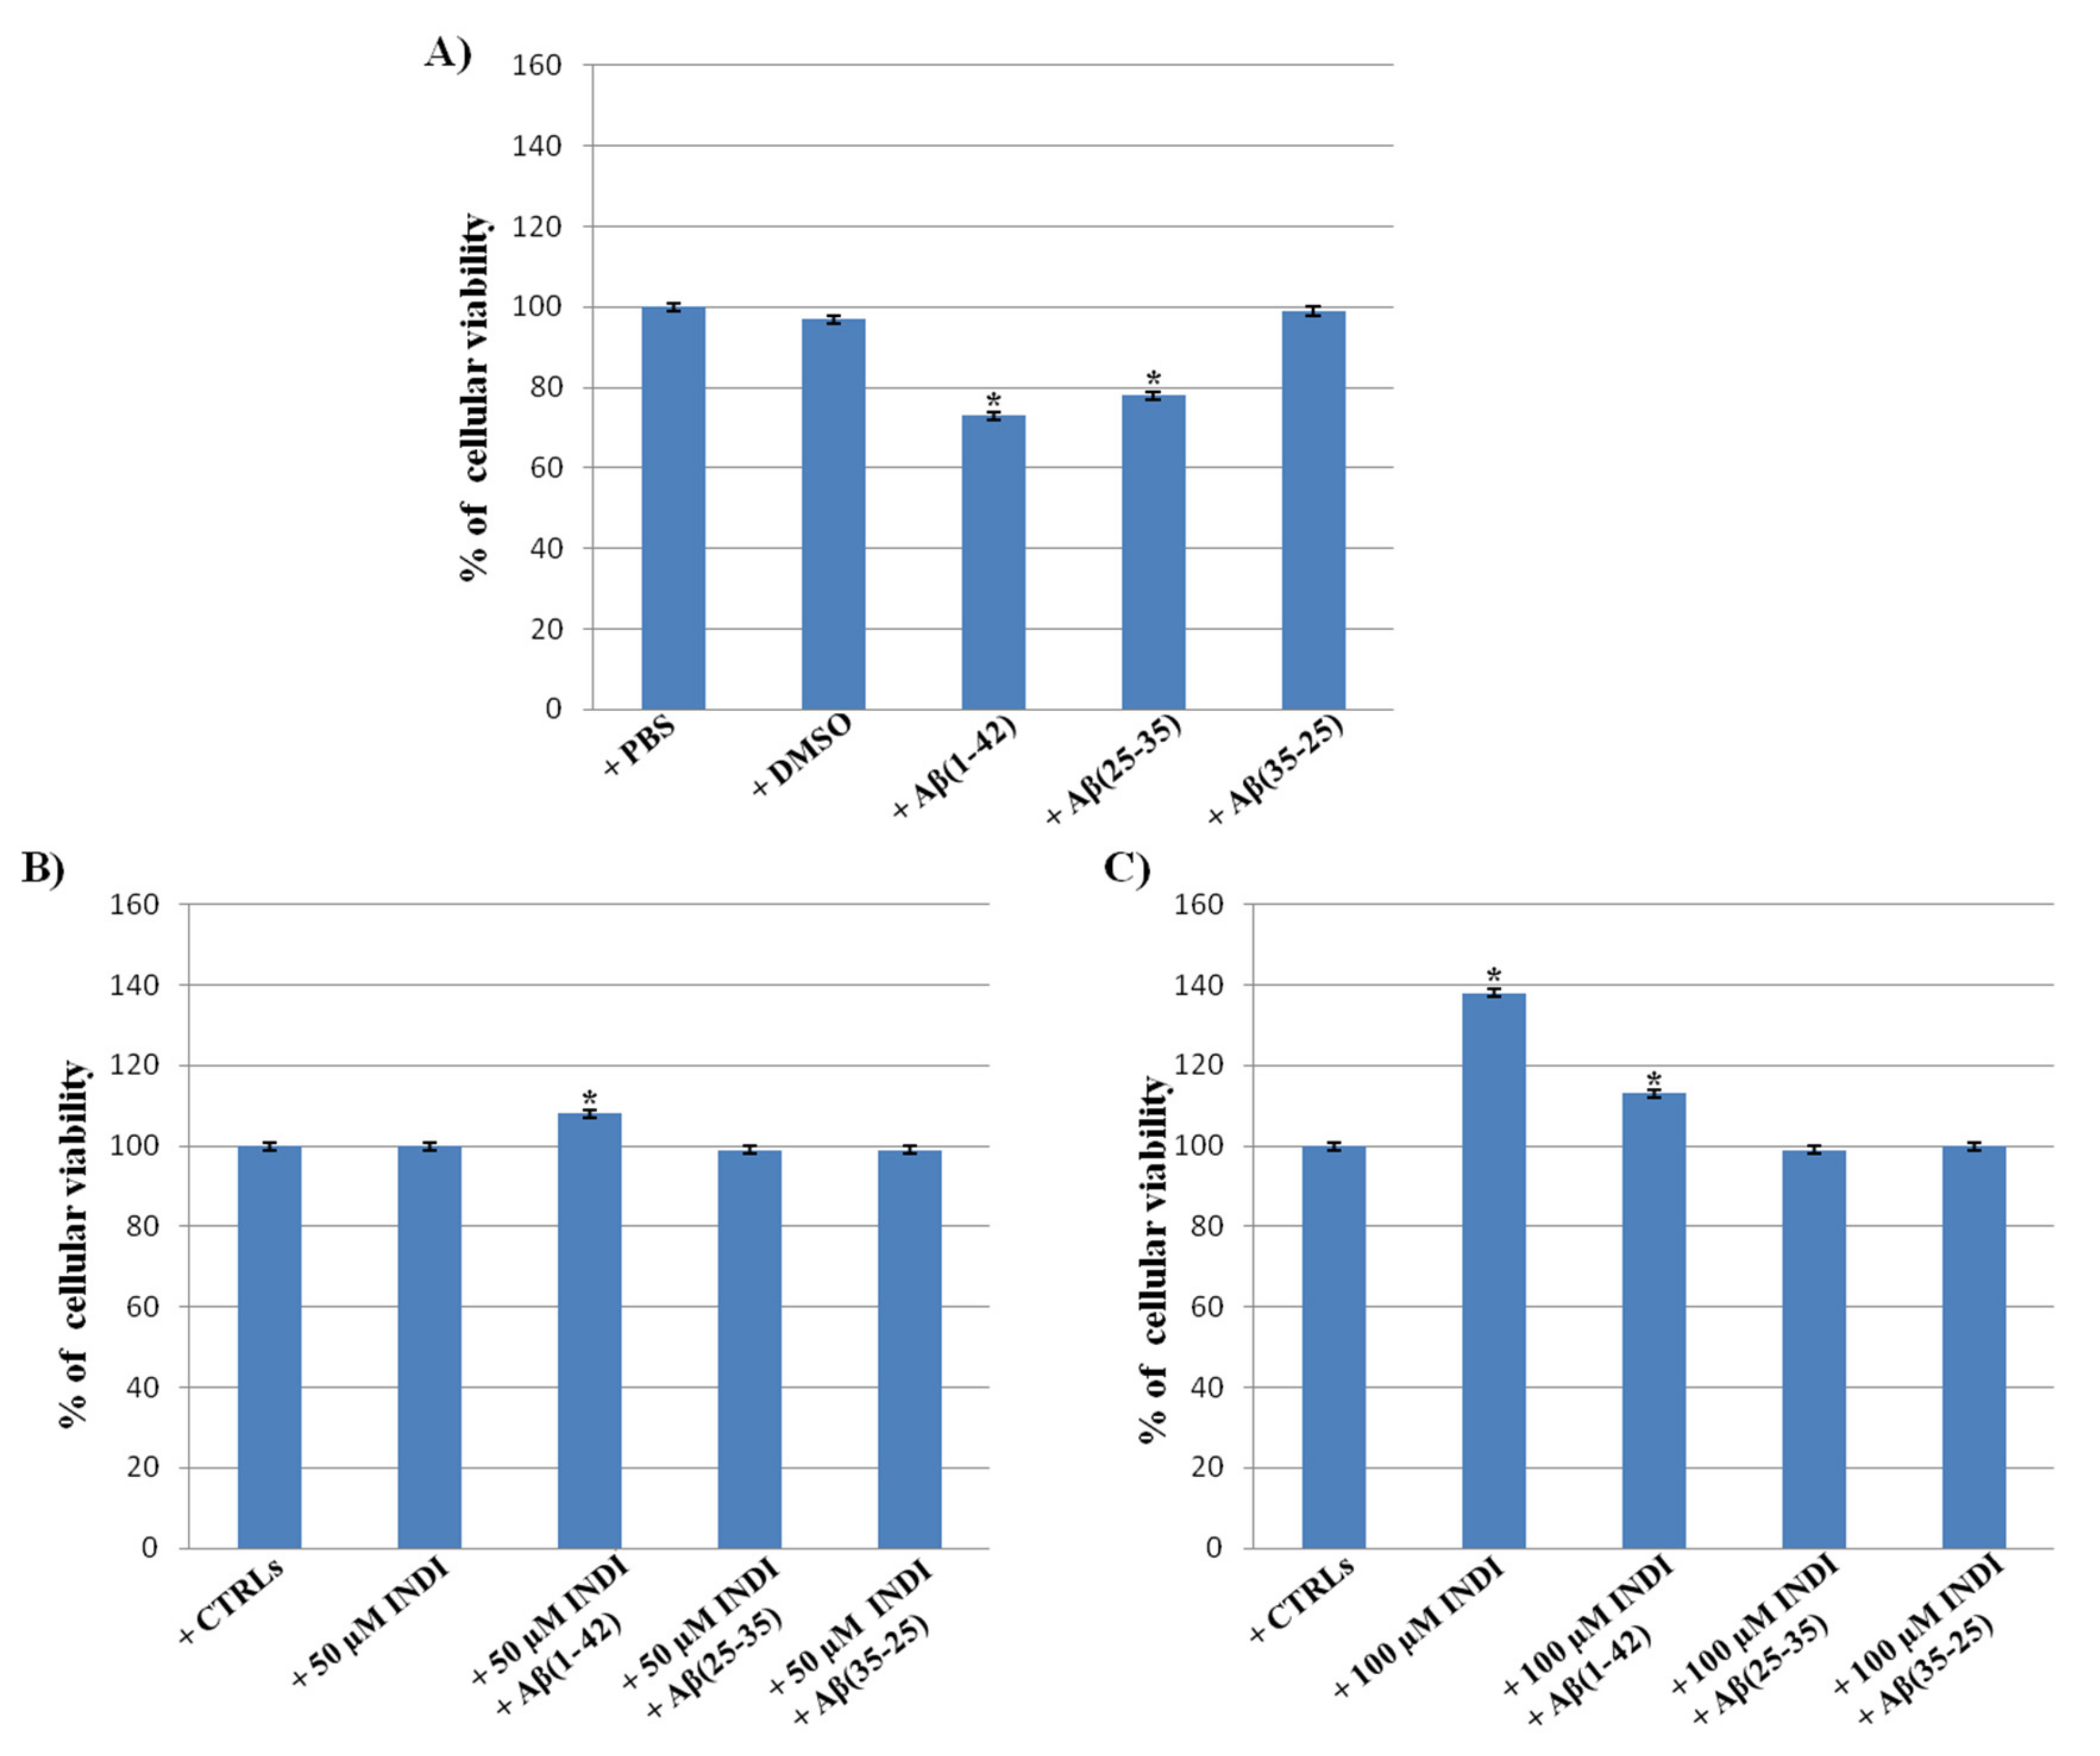
2.1. Cell Viability
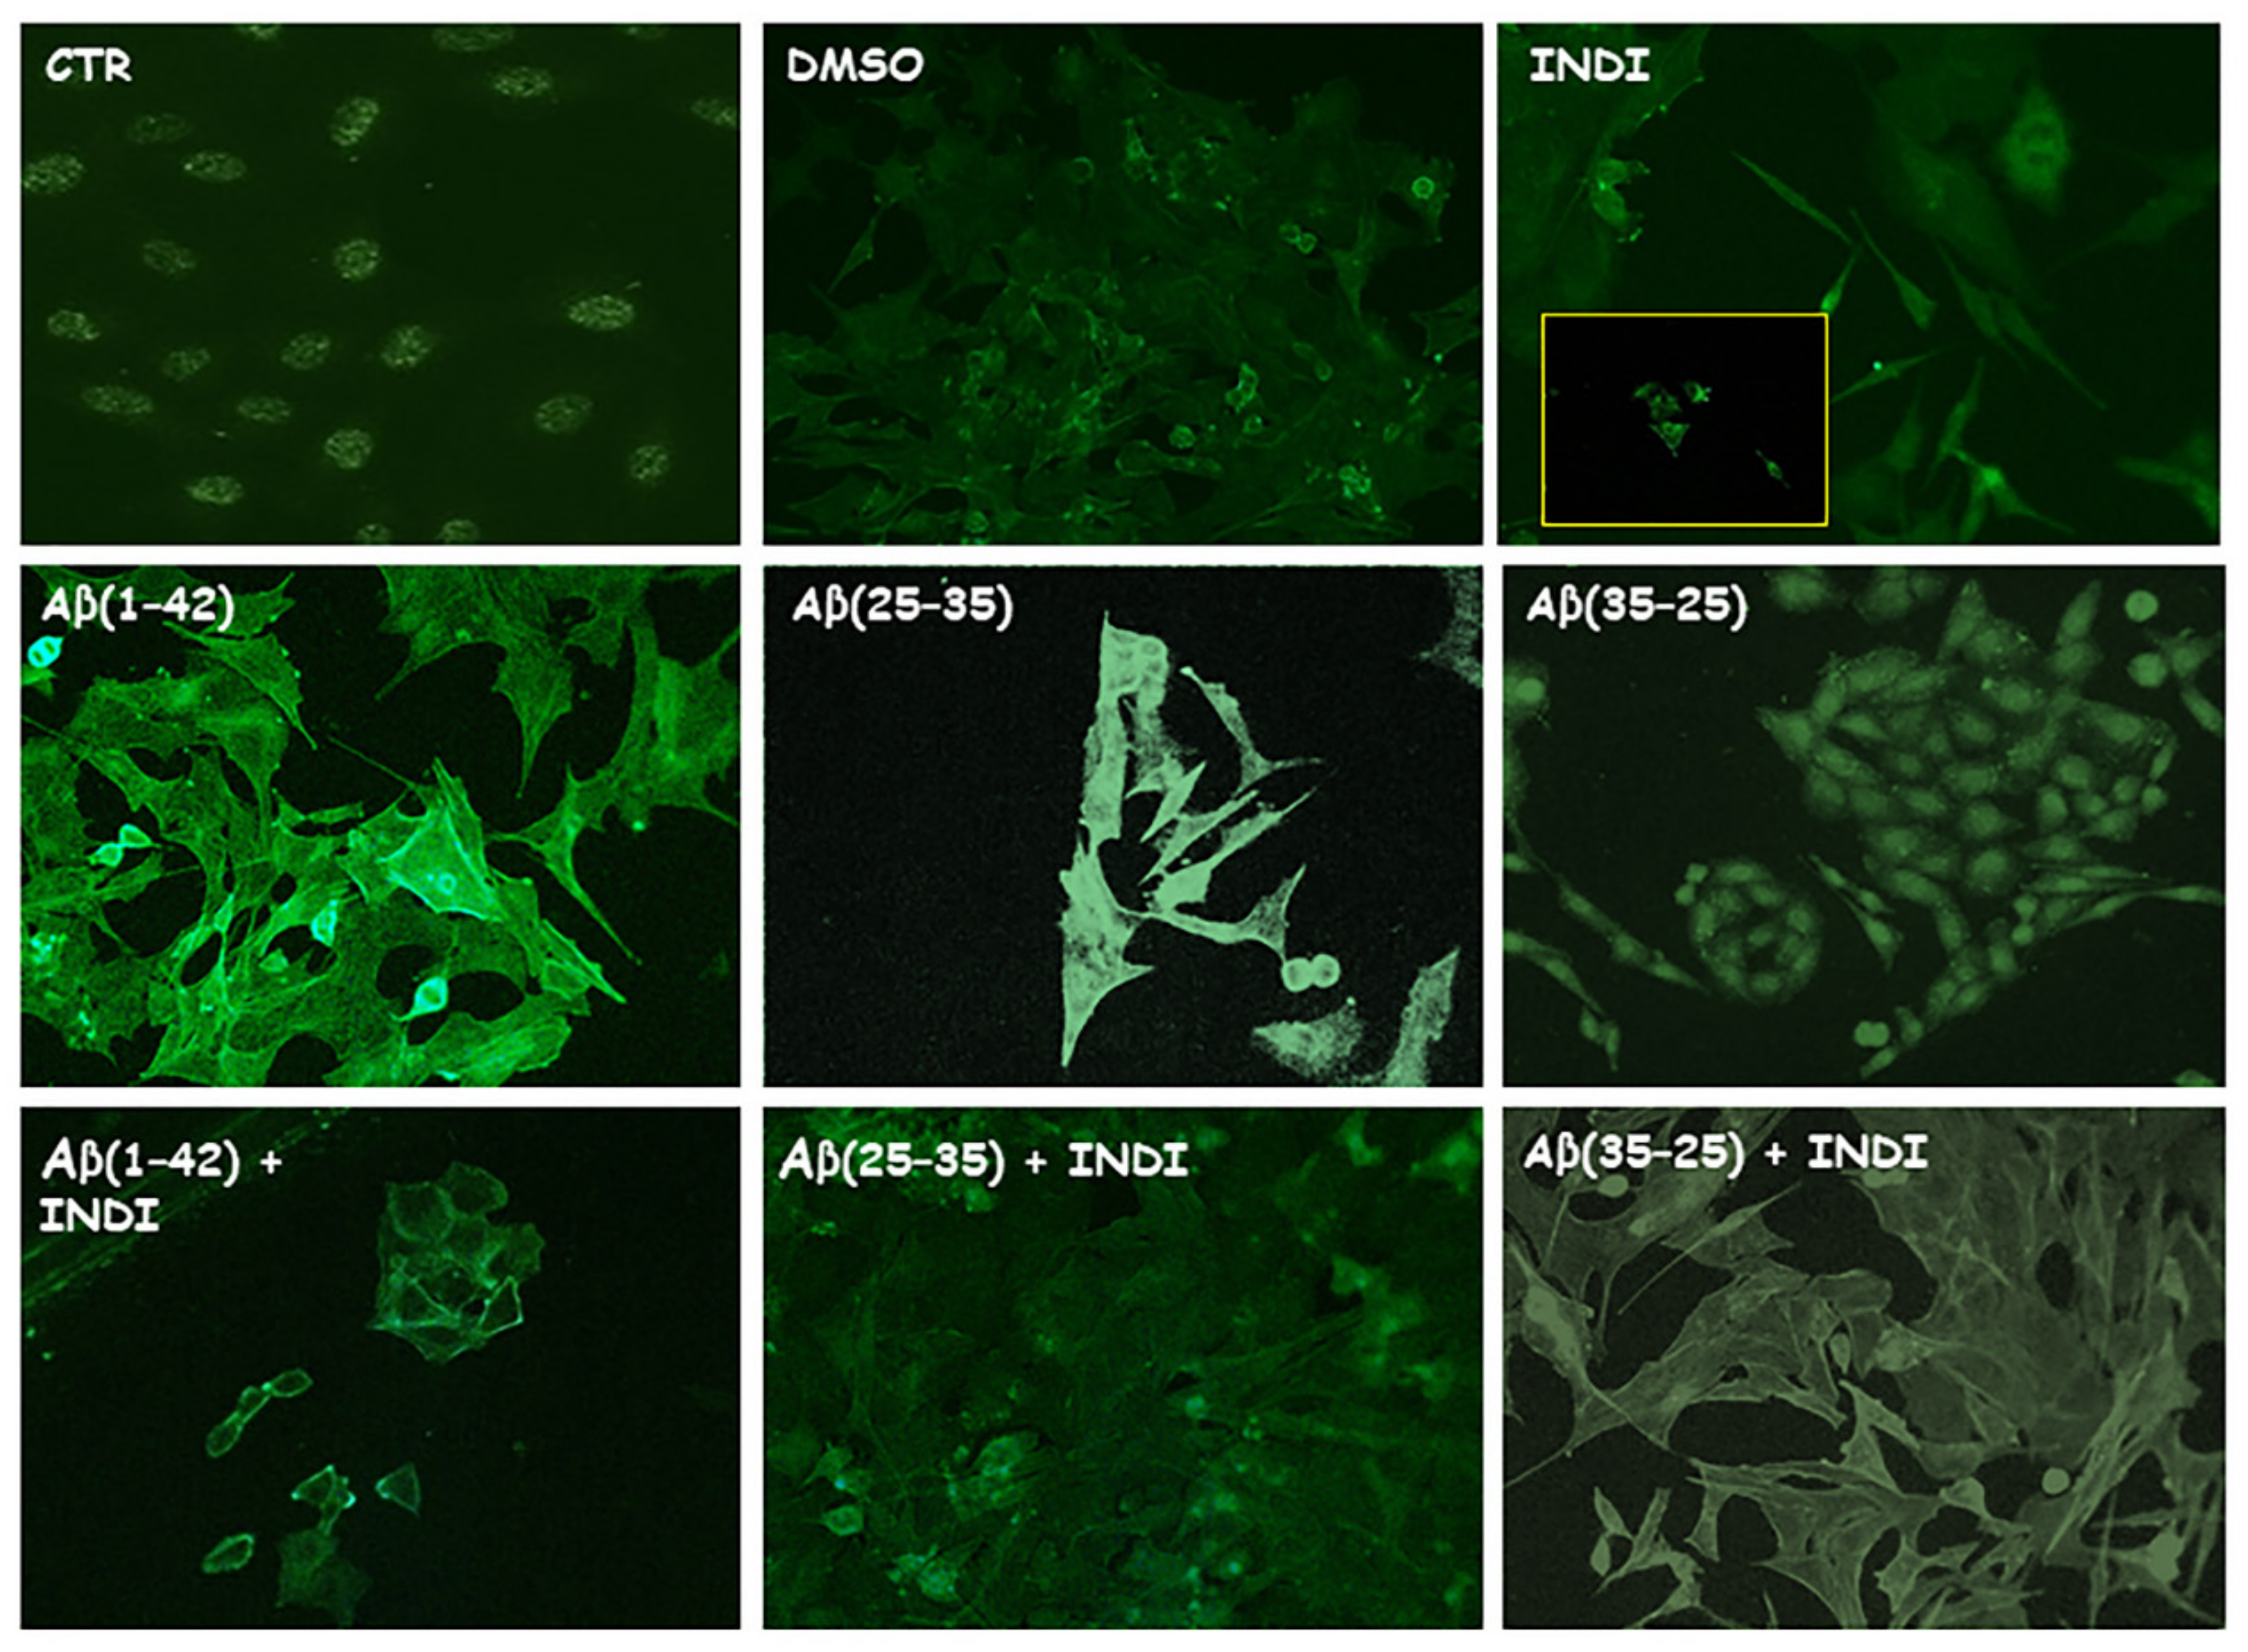
2.2. Vimentin and Glial Fibrillary Acid Protein (GFAP) Immunolabeling
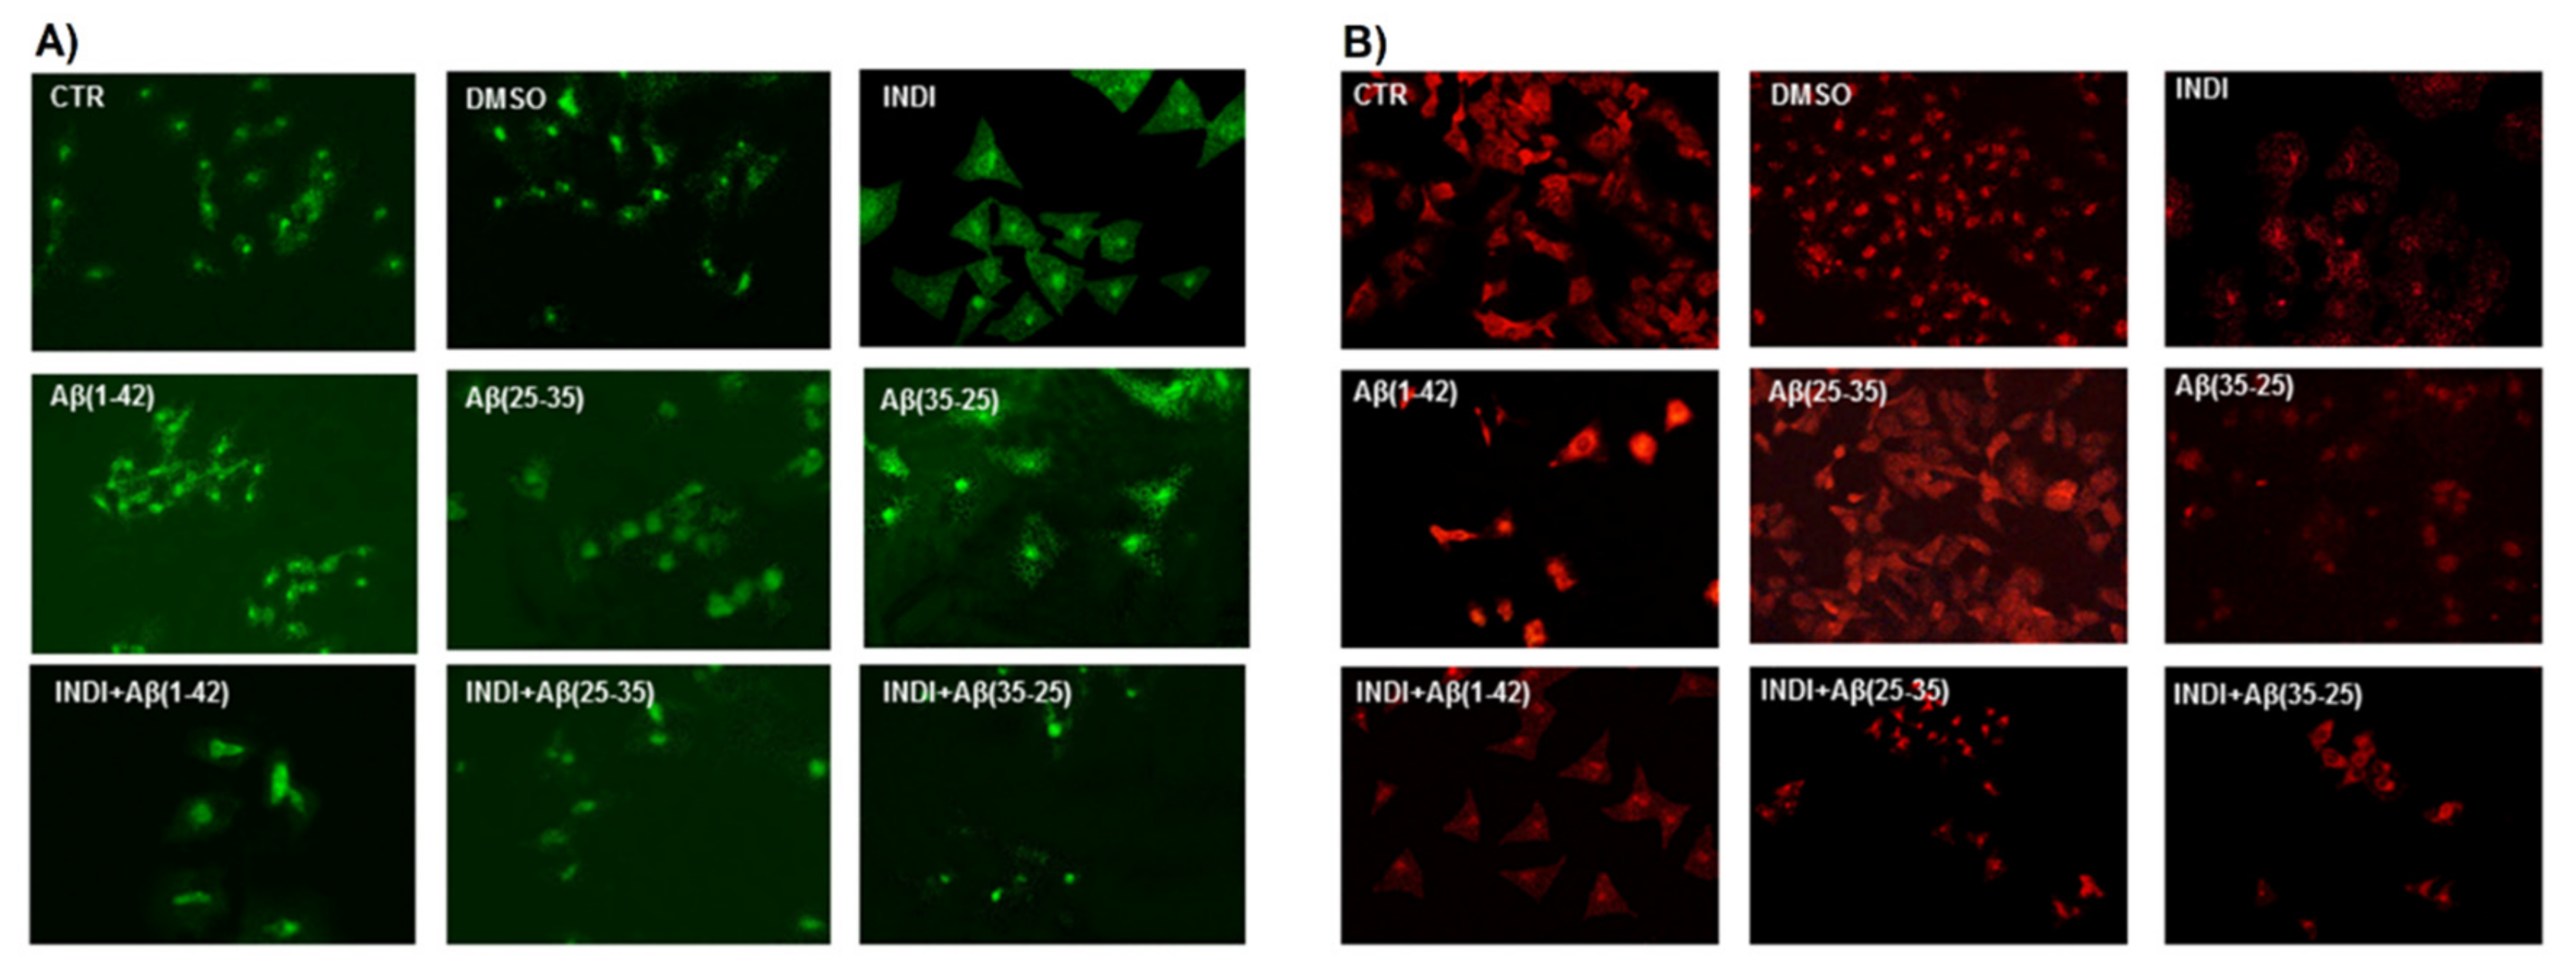
2.3. Total Reactive Oxygen Species (ROS)/O2− Generation
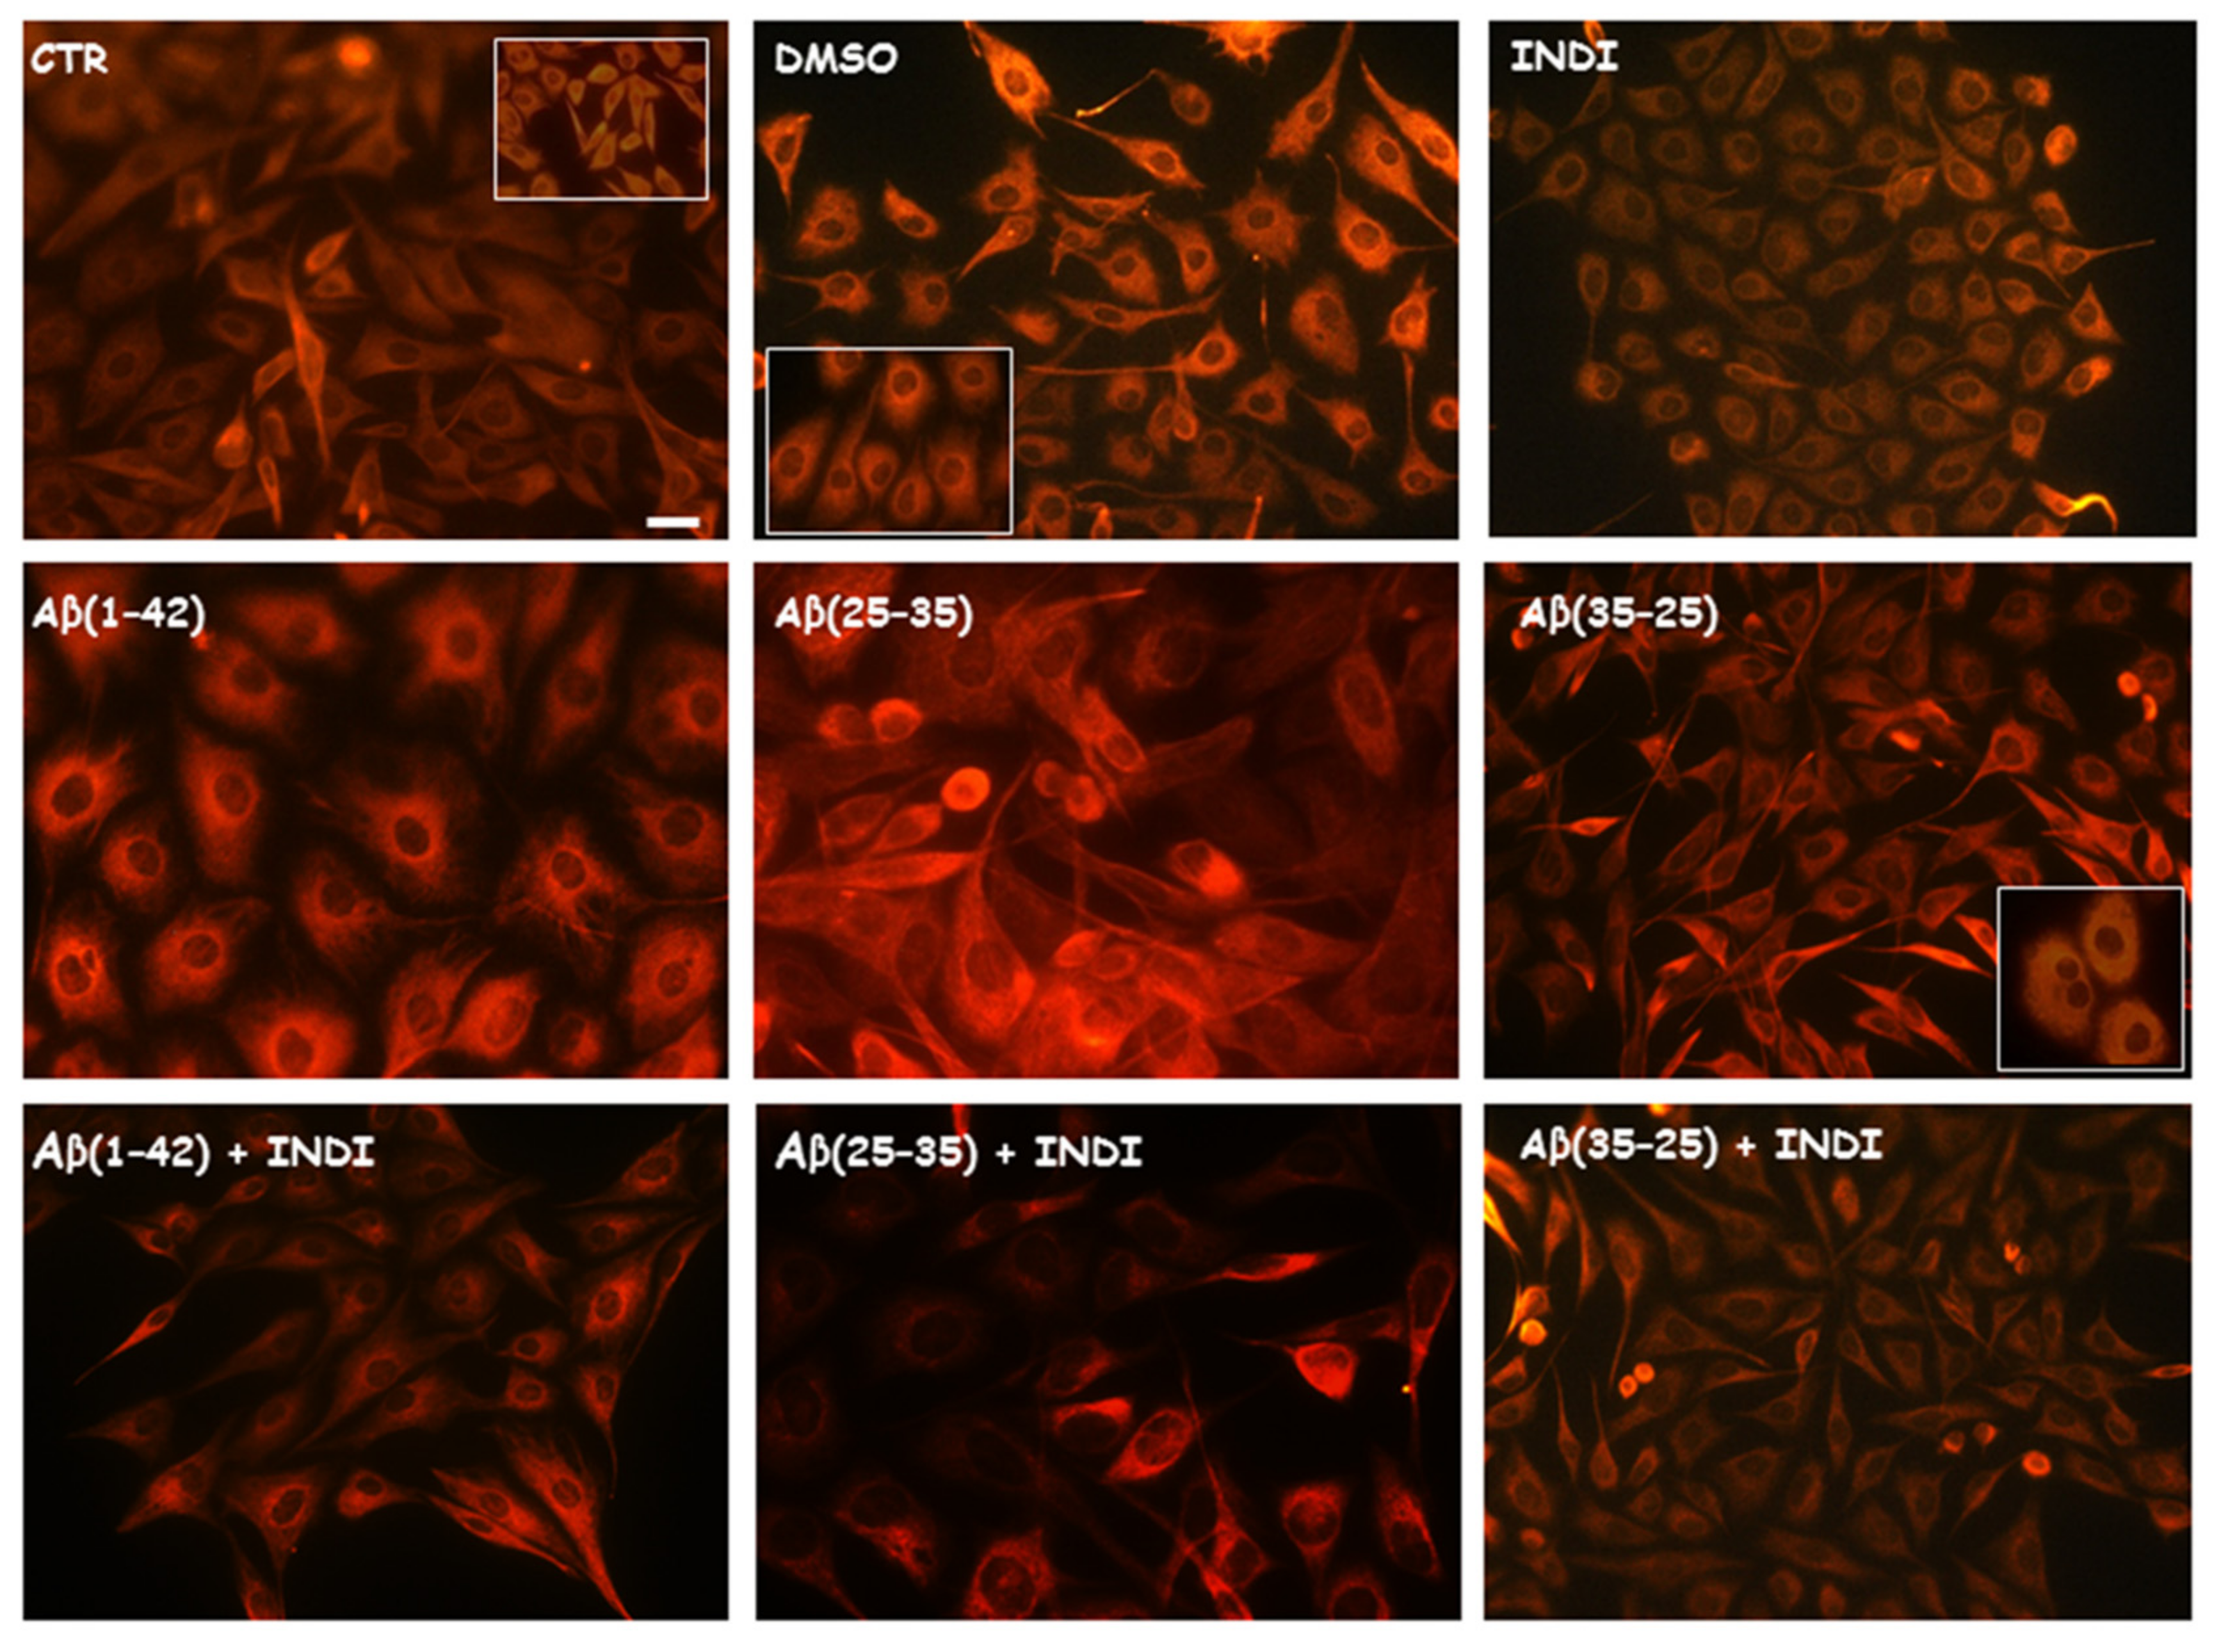
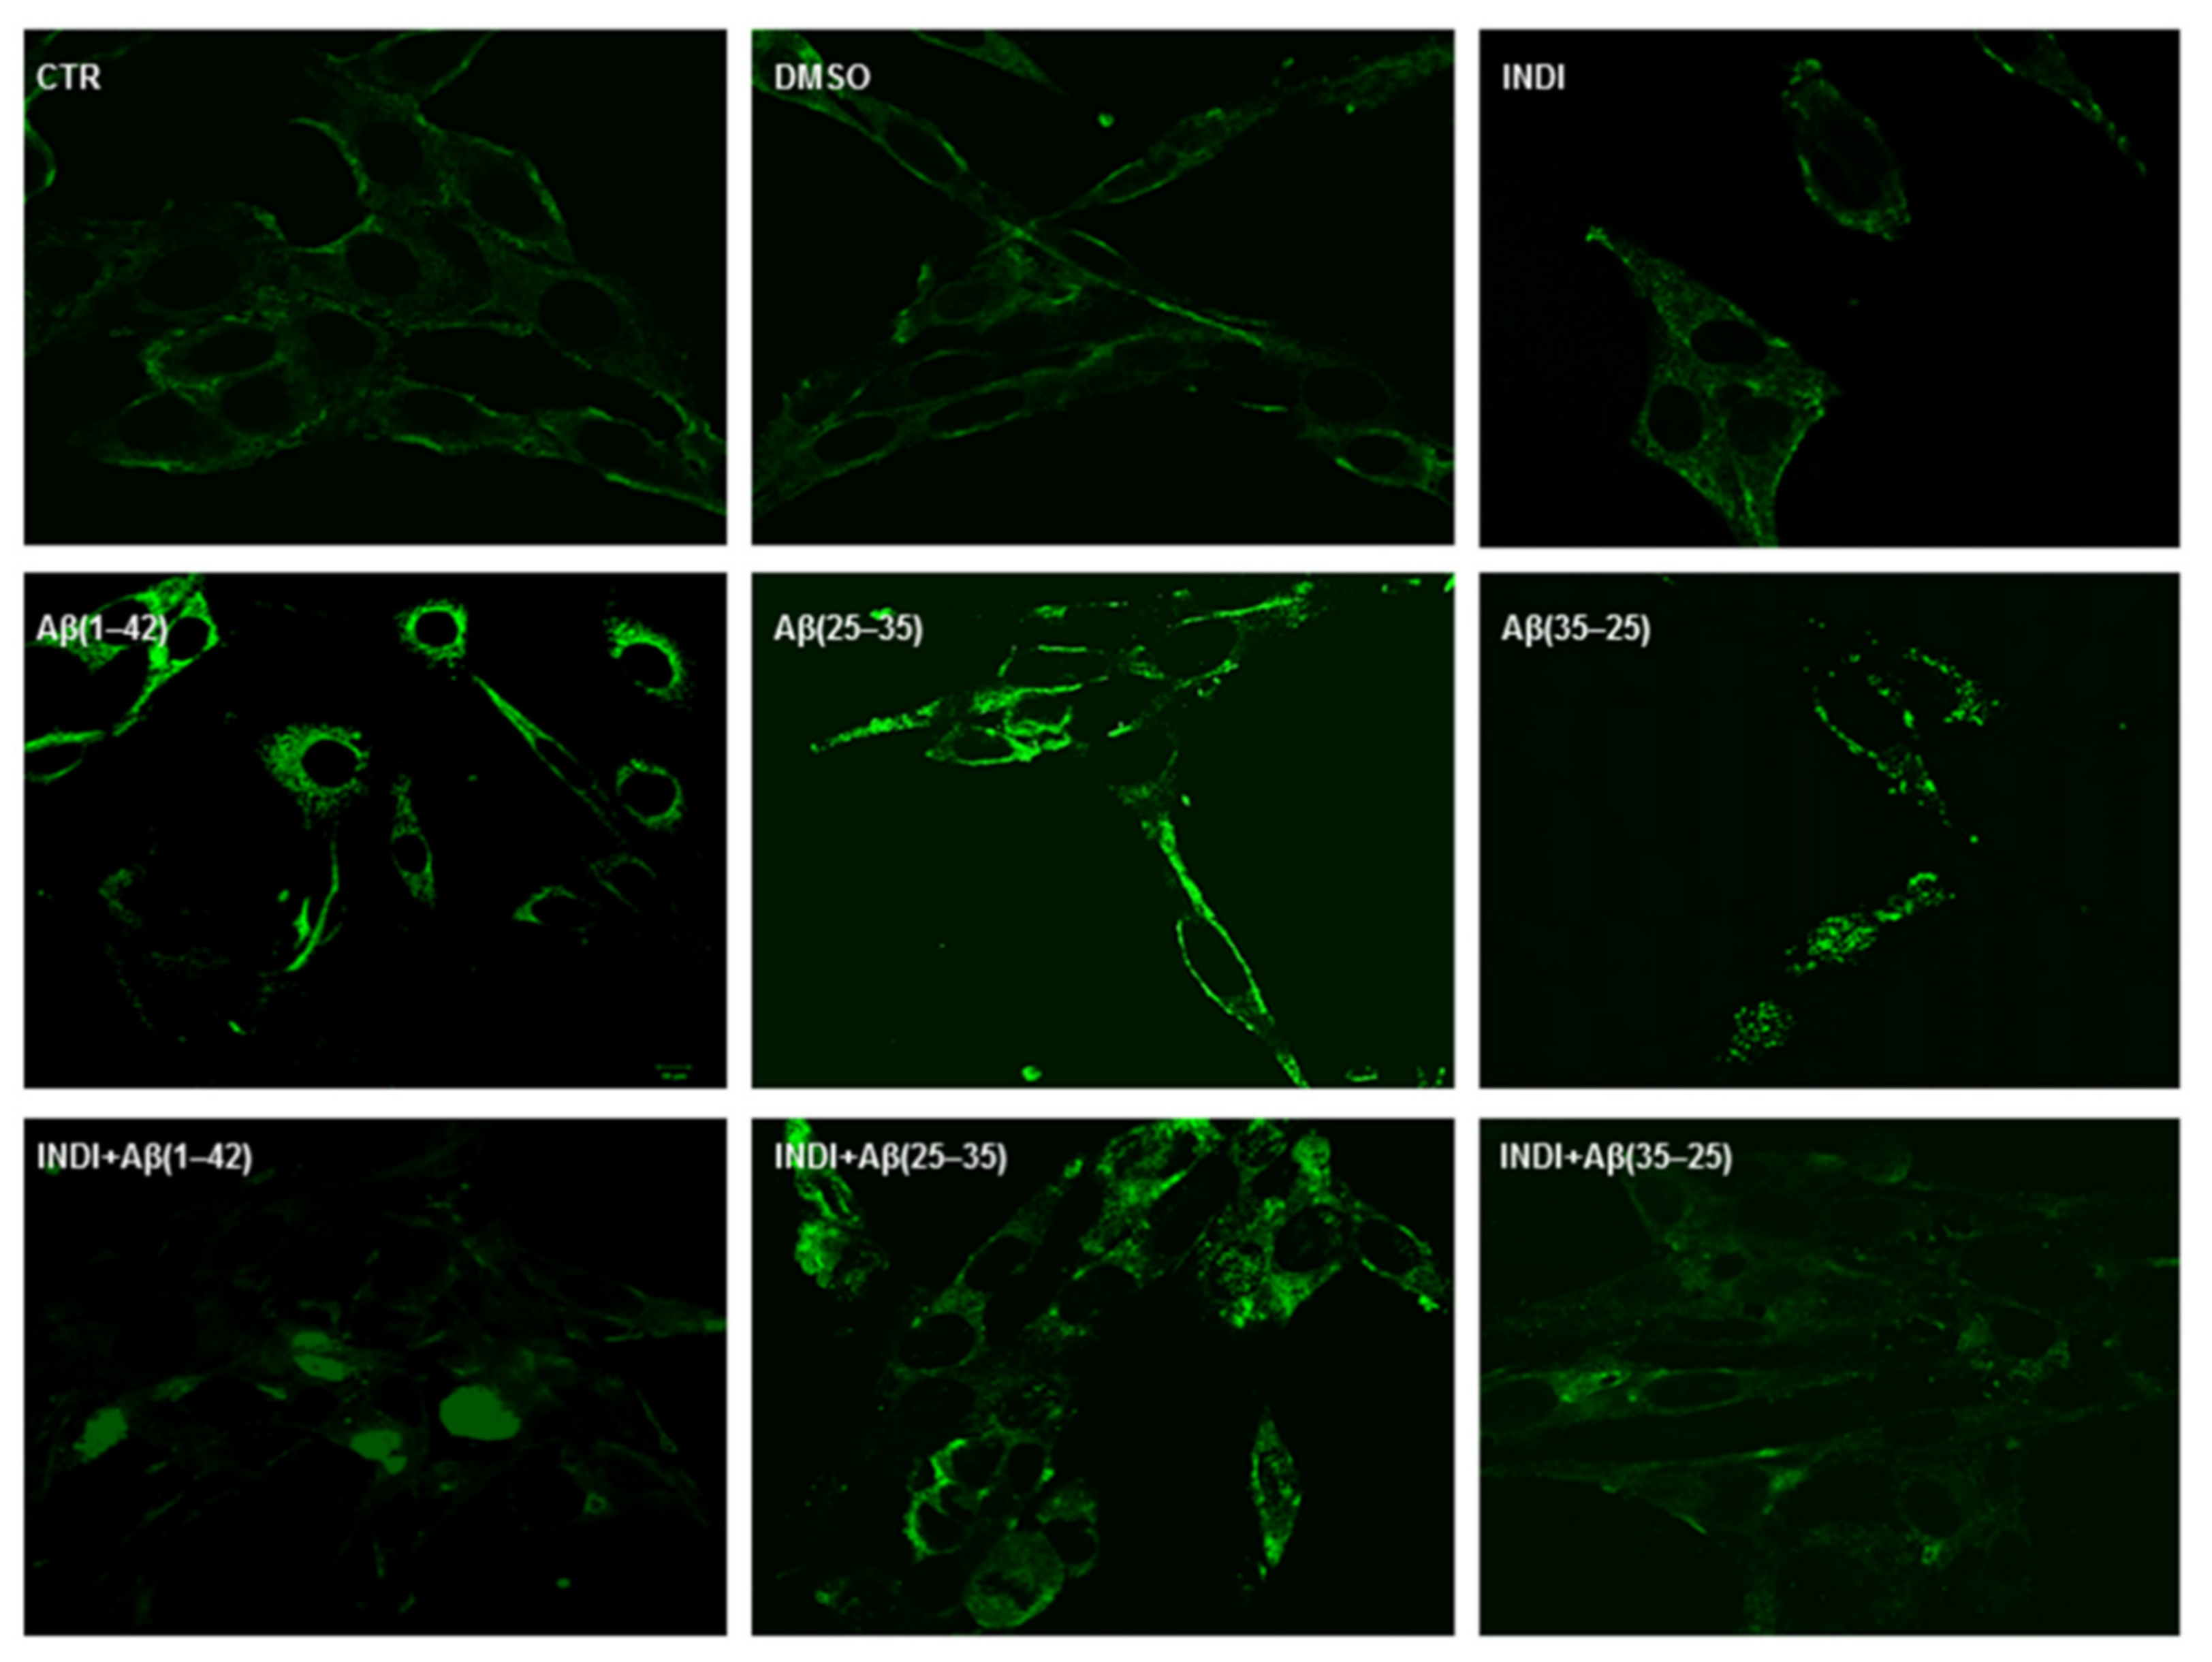
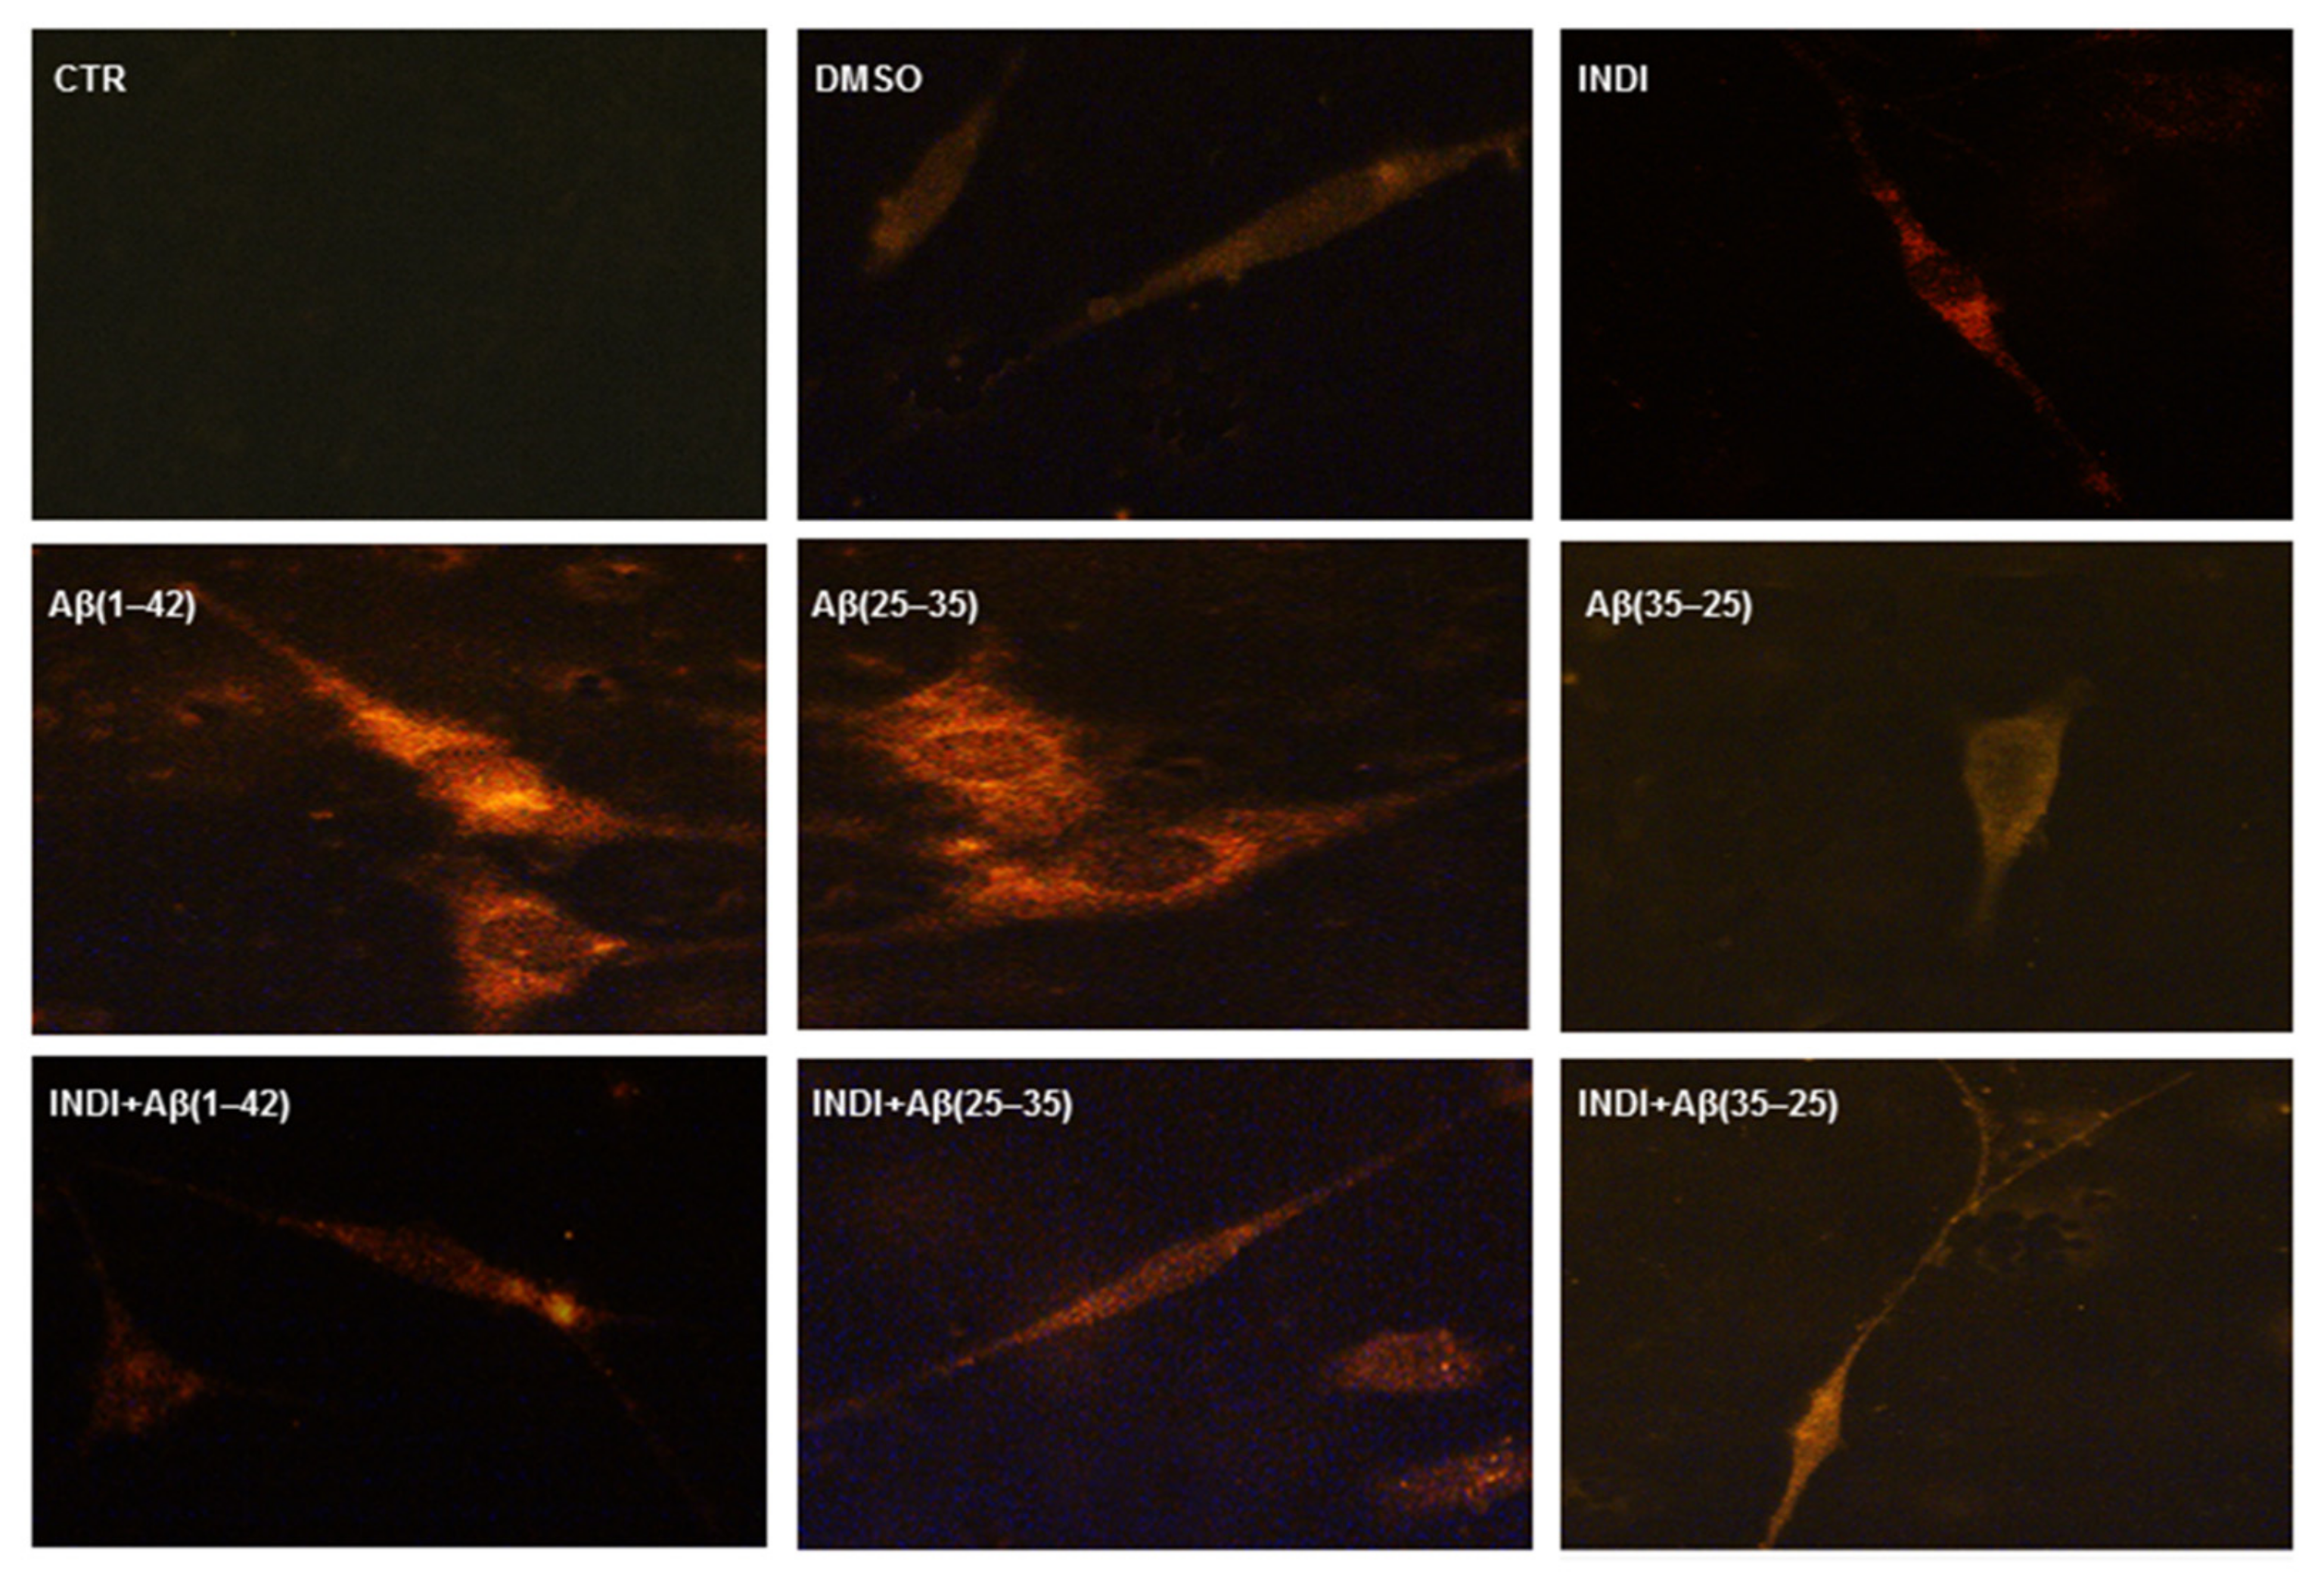
2.4. Total TG2 Expression through Immunocytochemistry
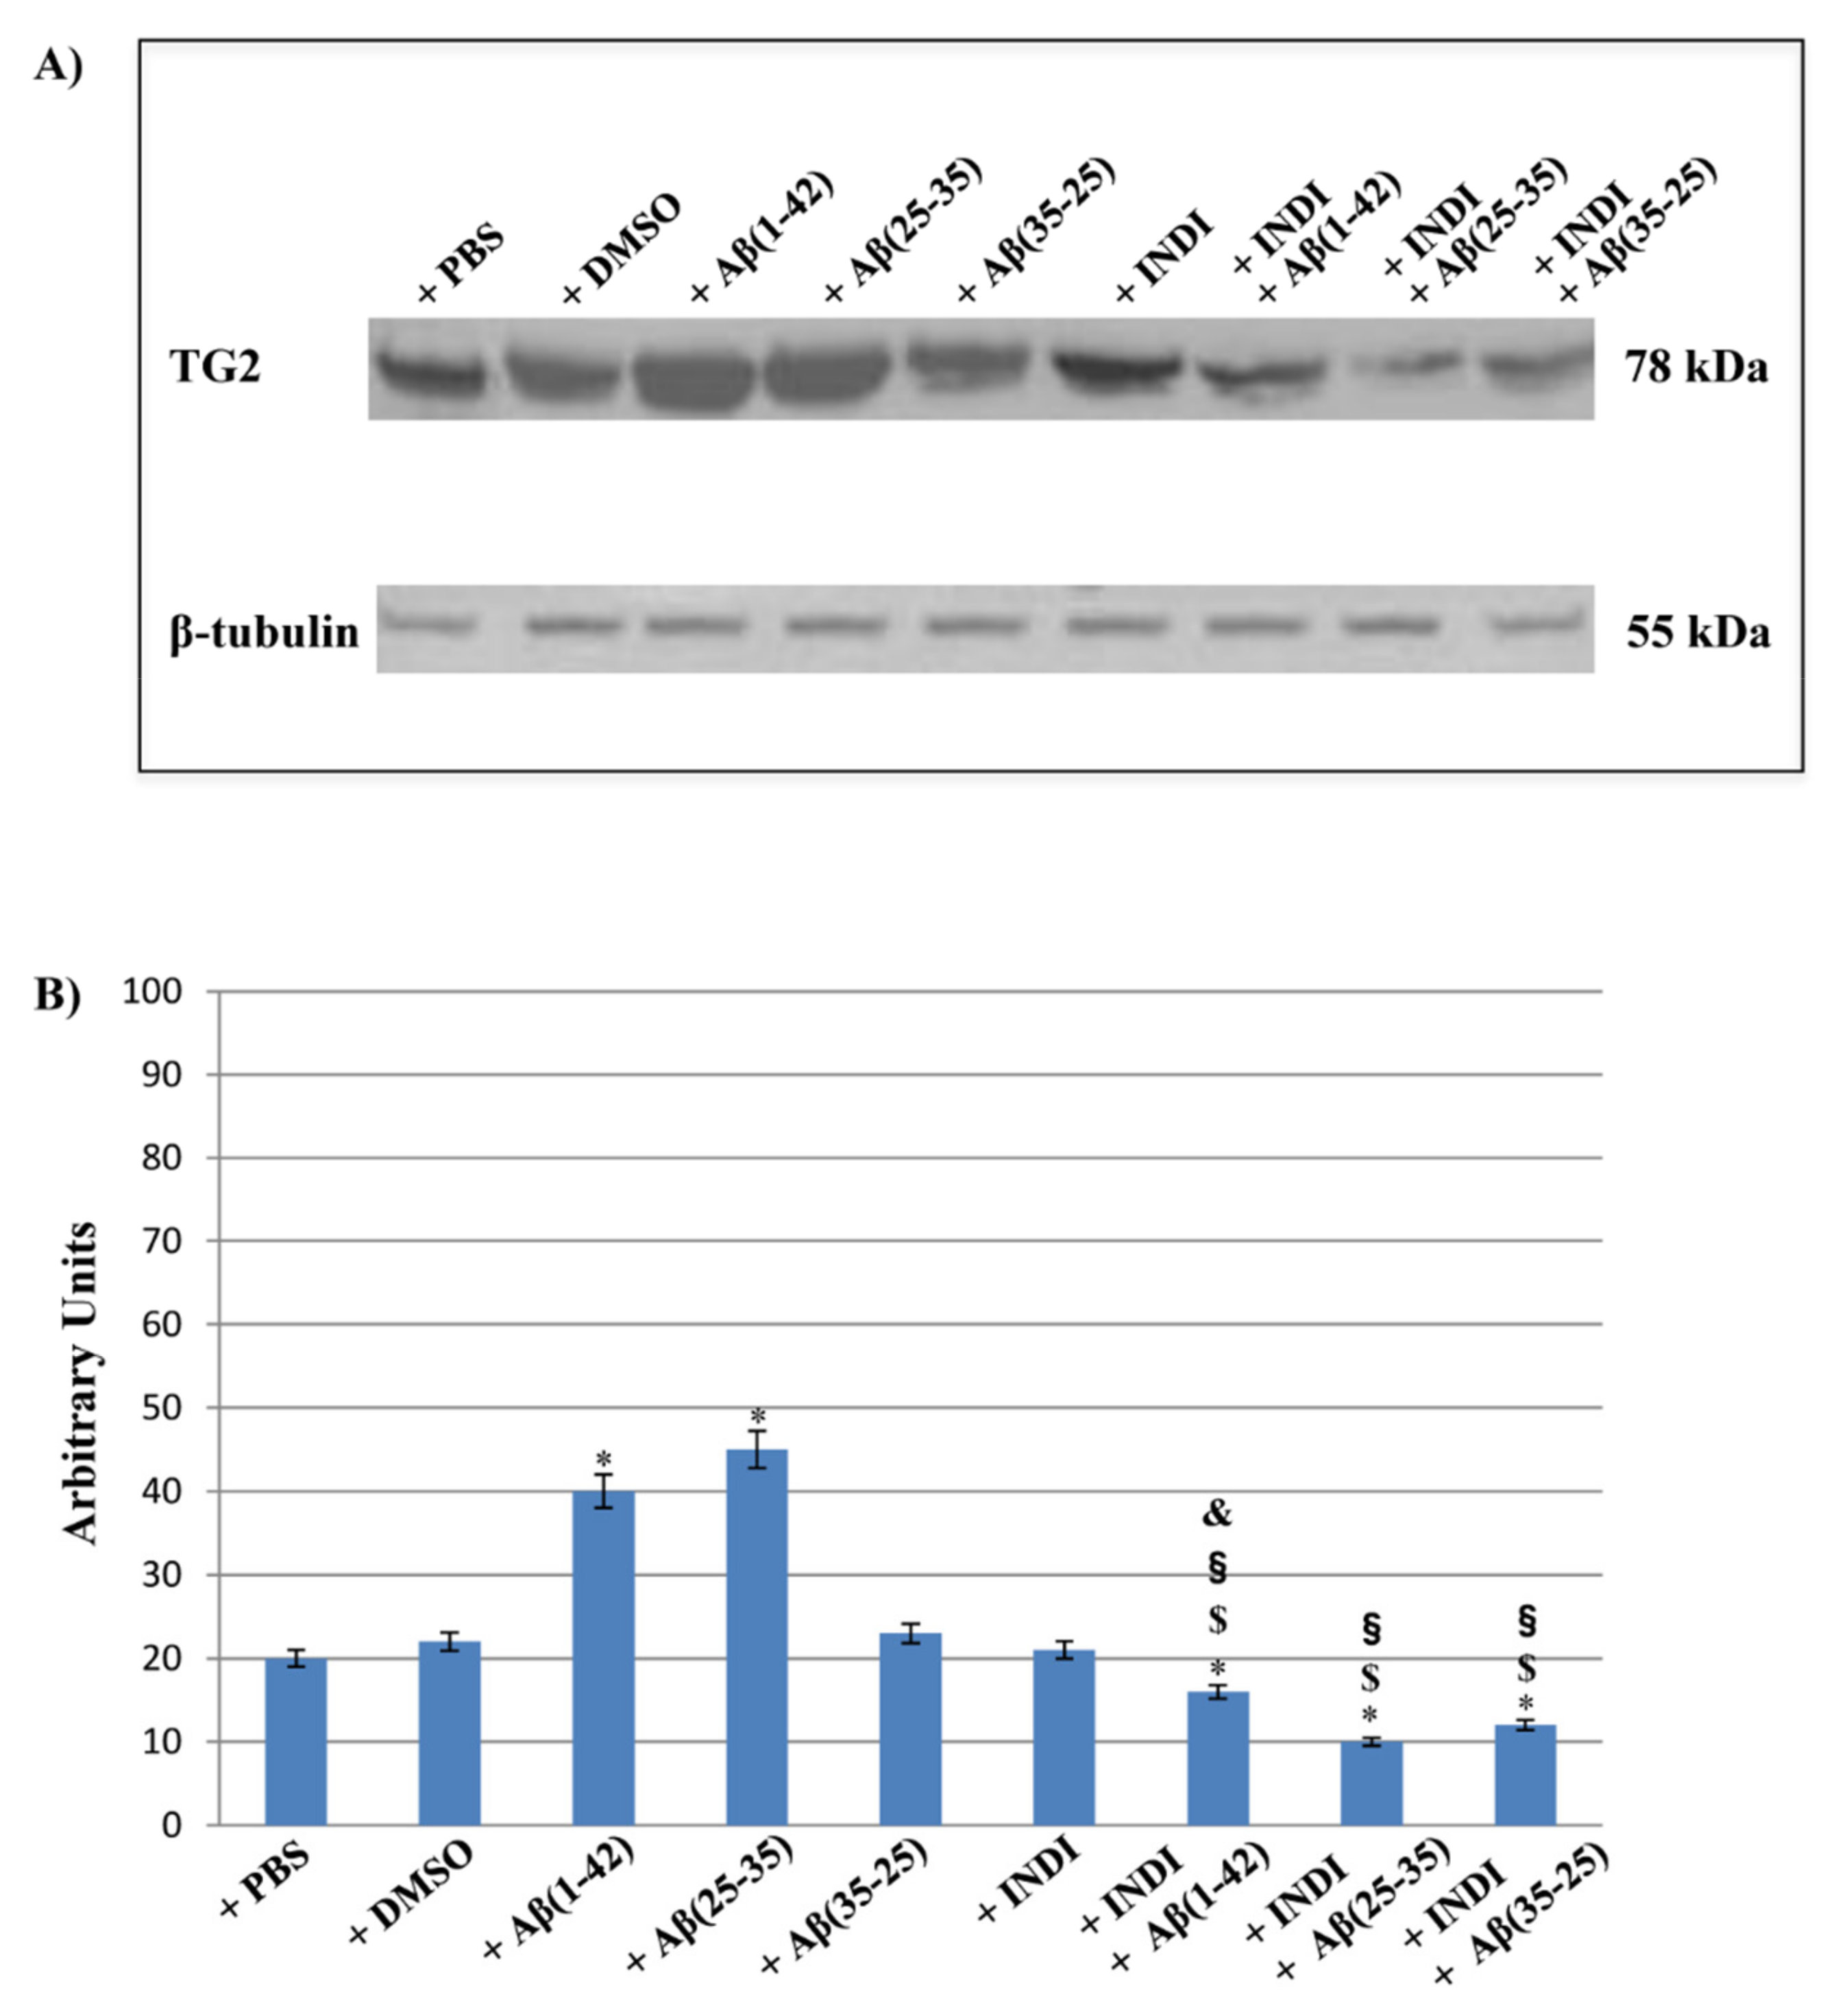
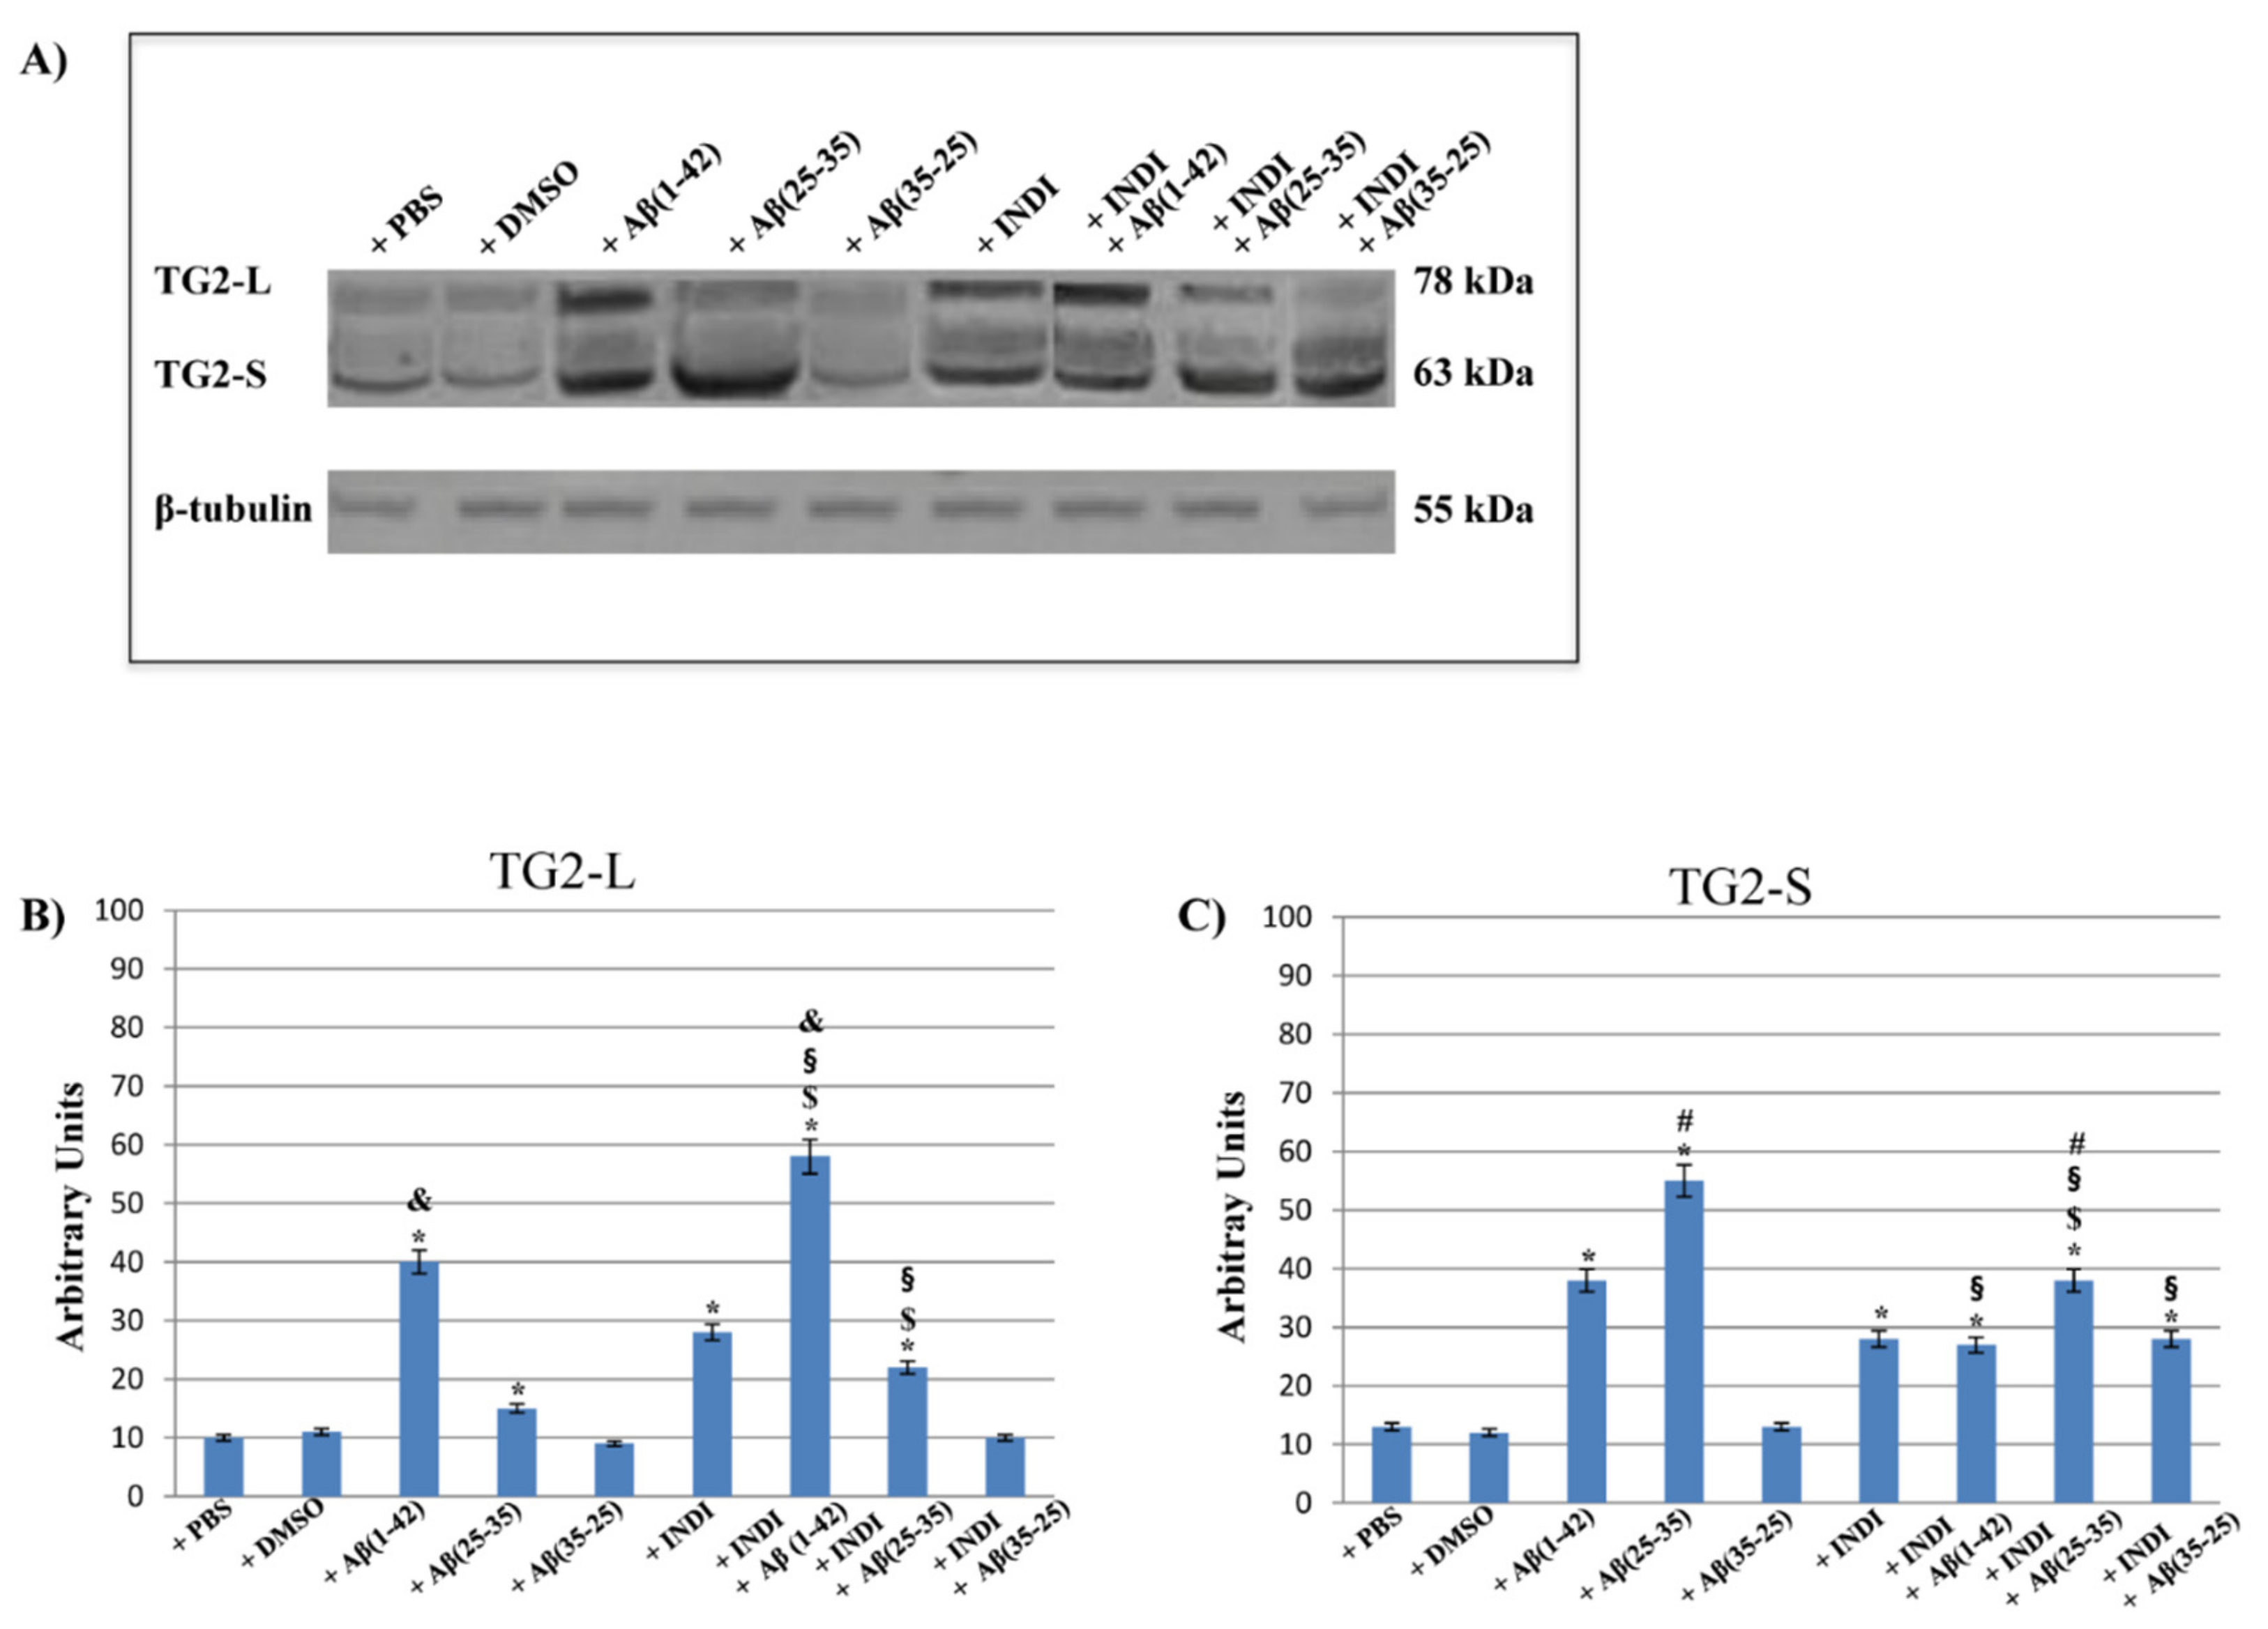
2.5. TG2 and Its Isoform Expression and Effect of Indicaxanthin
2.6. Caspase-3 Cleavage Immunolabeling
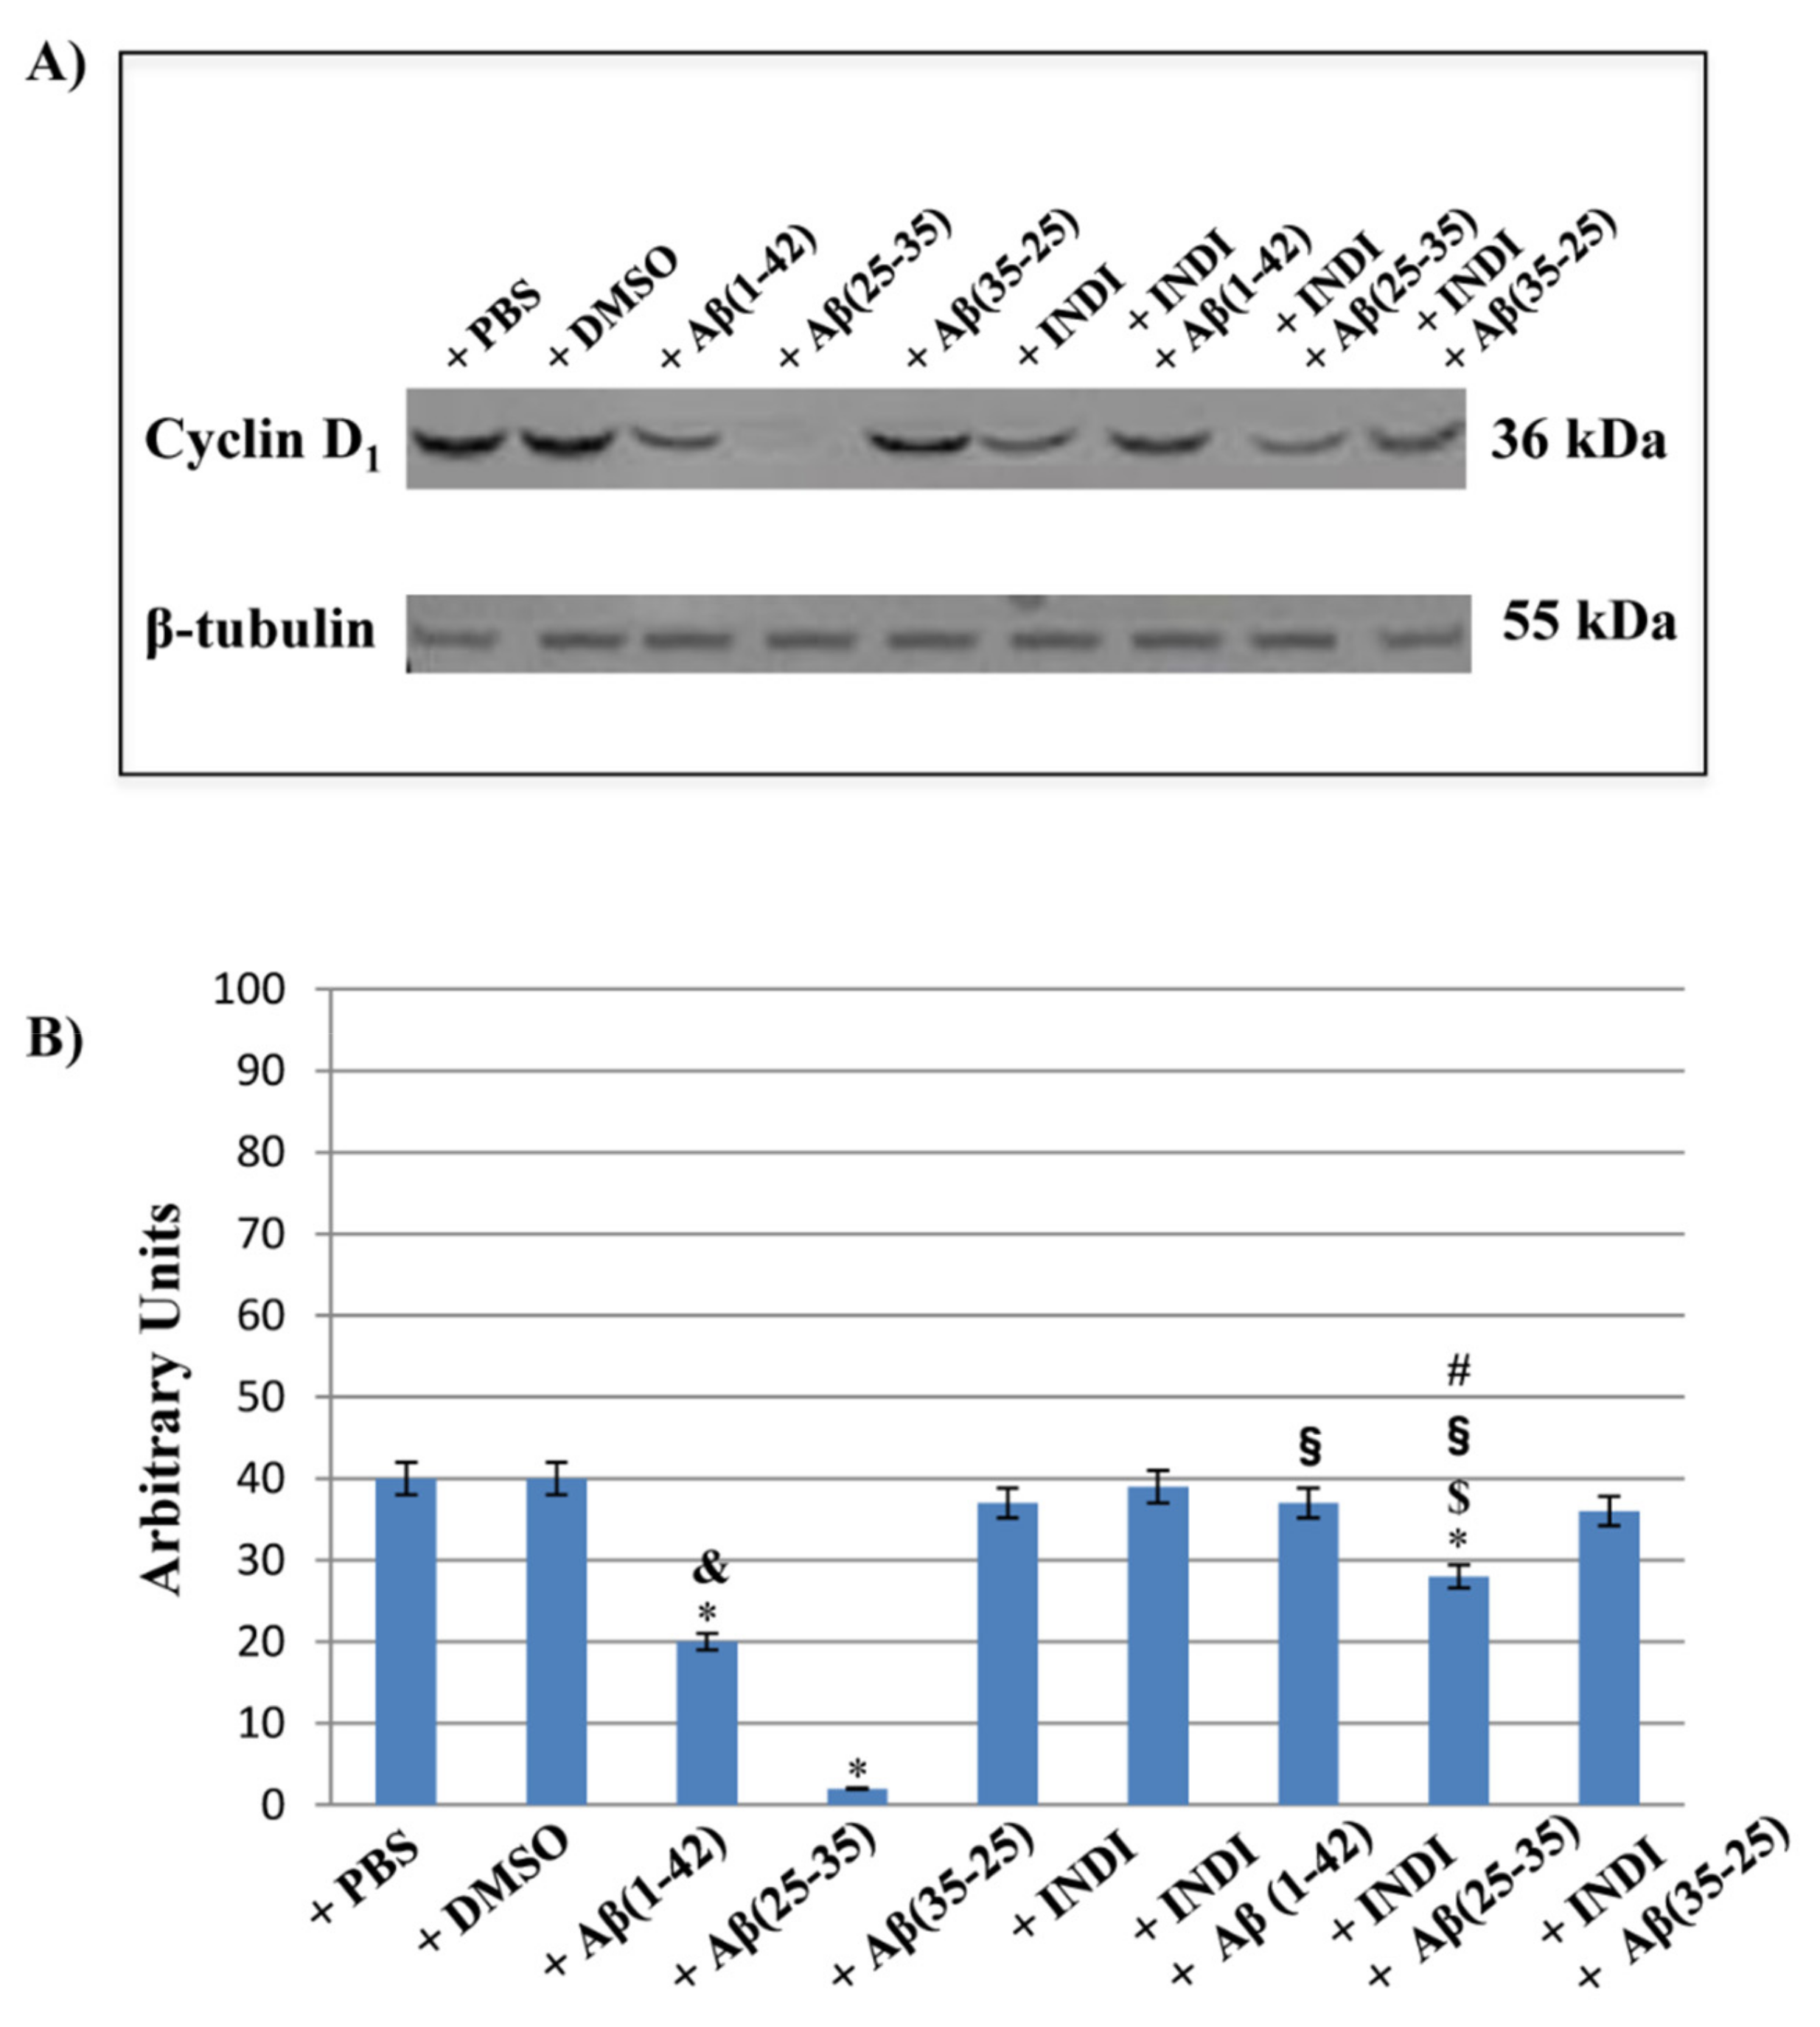
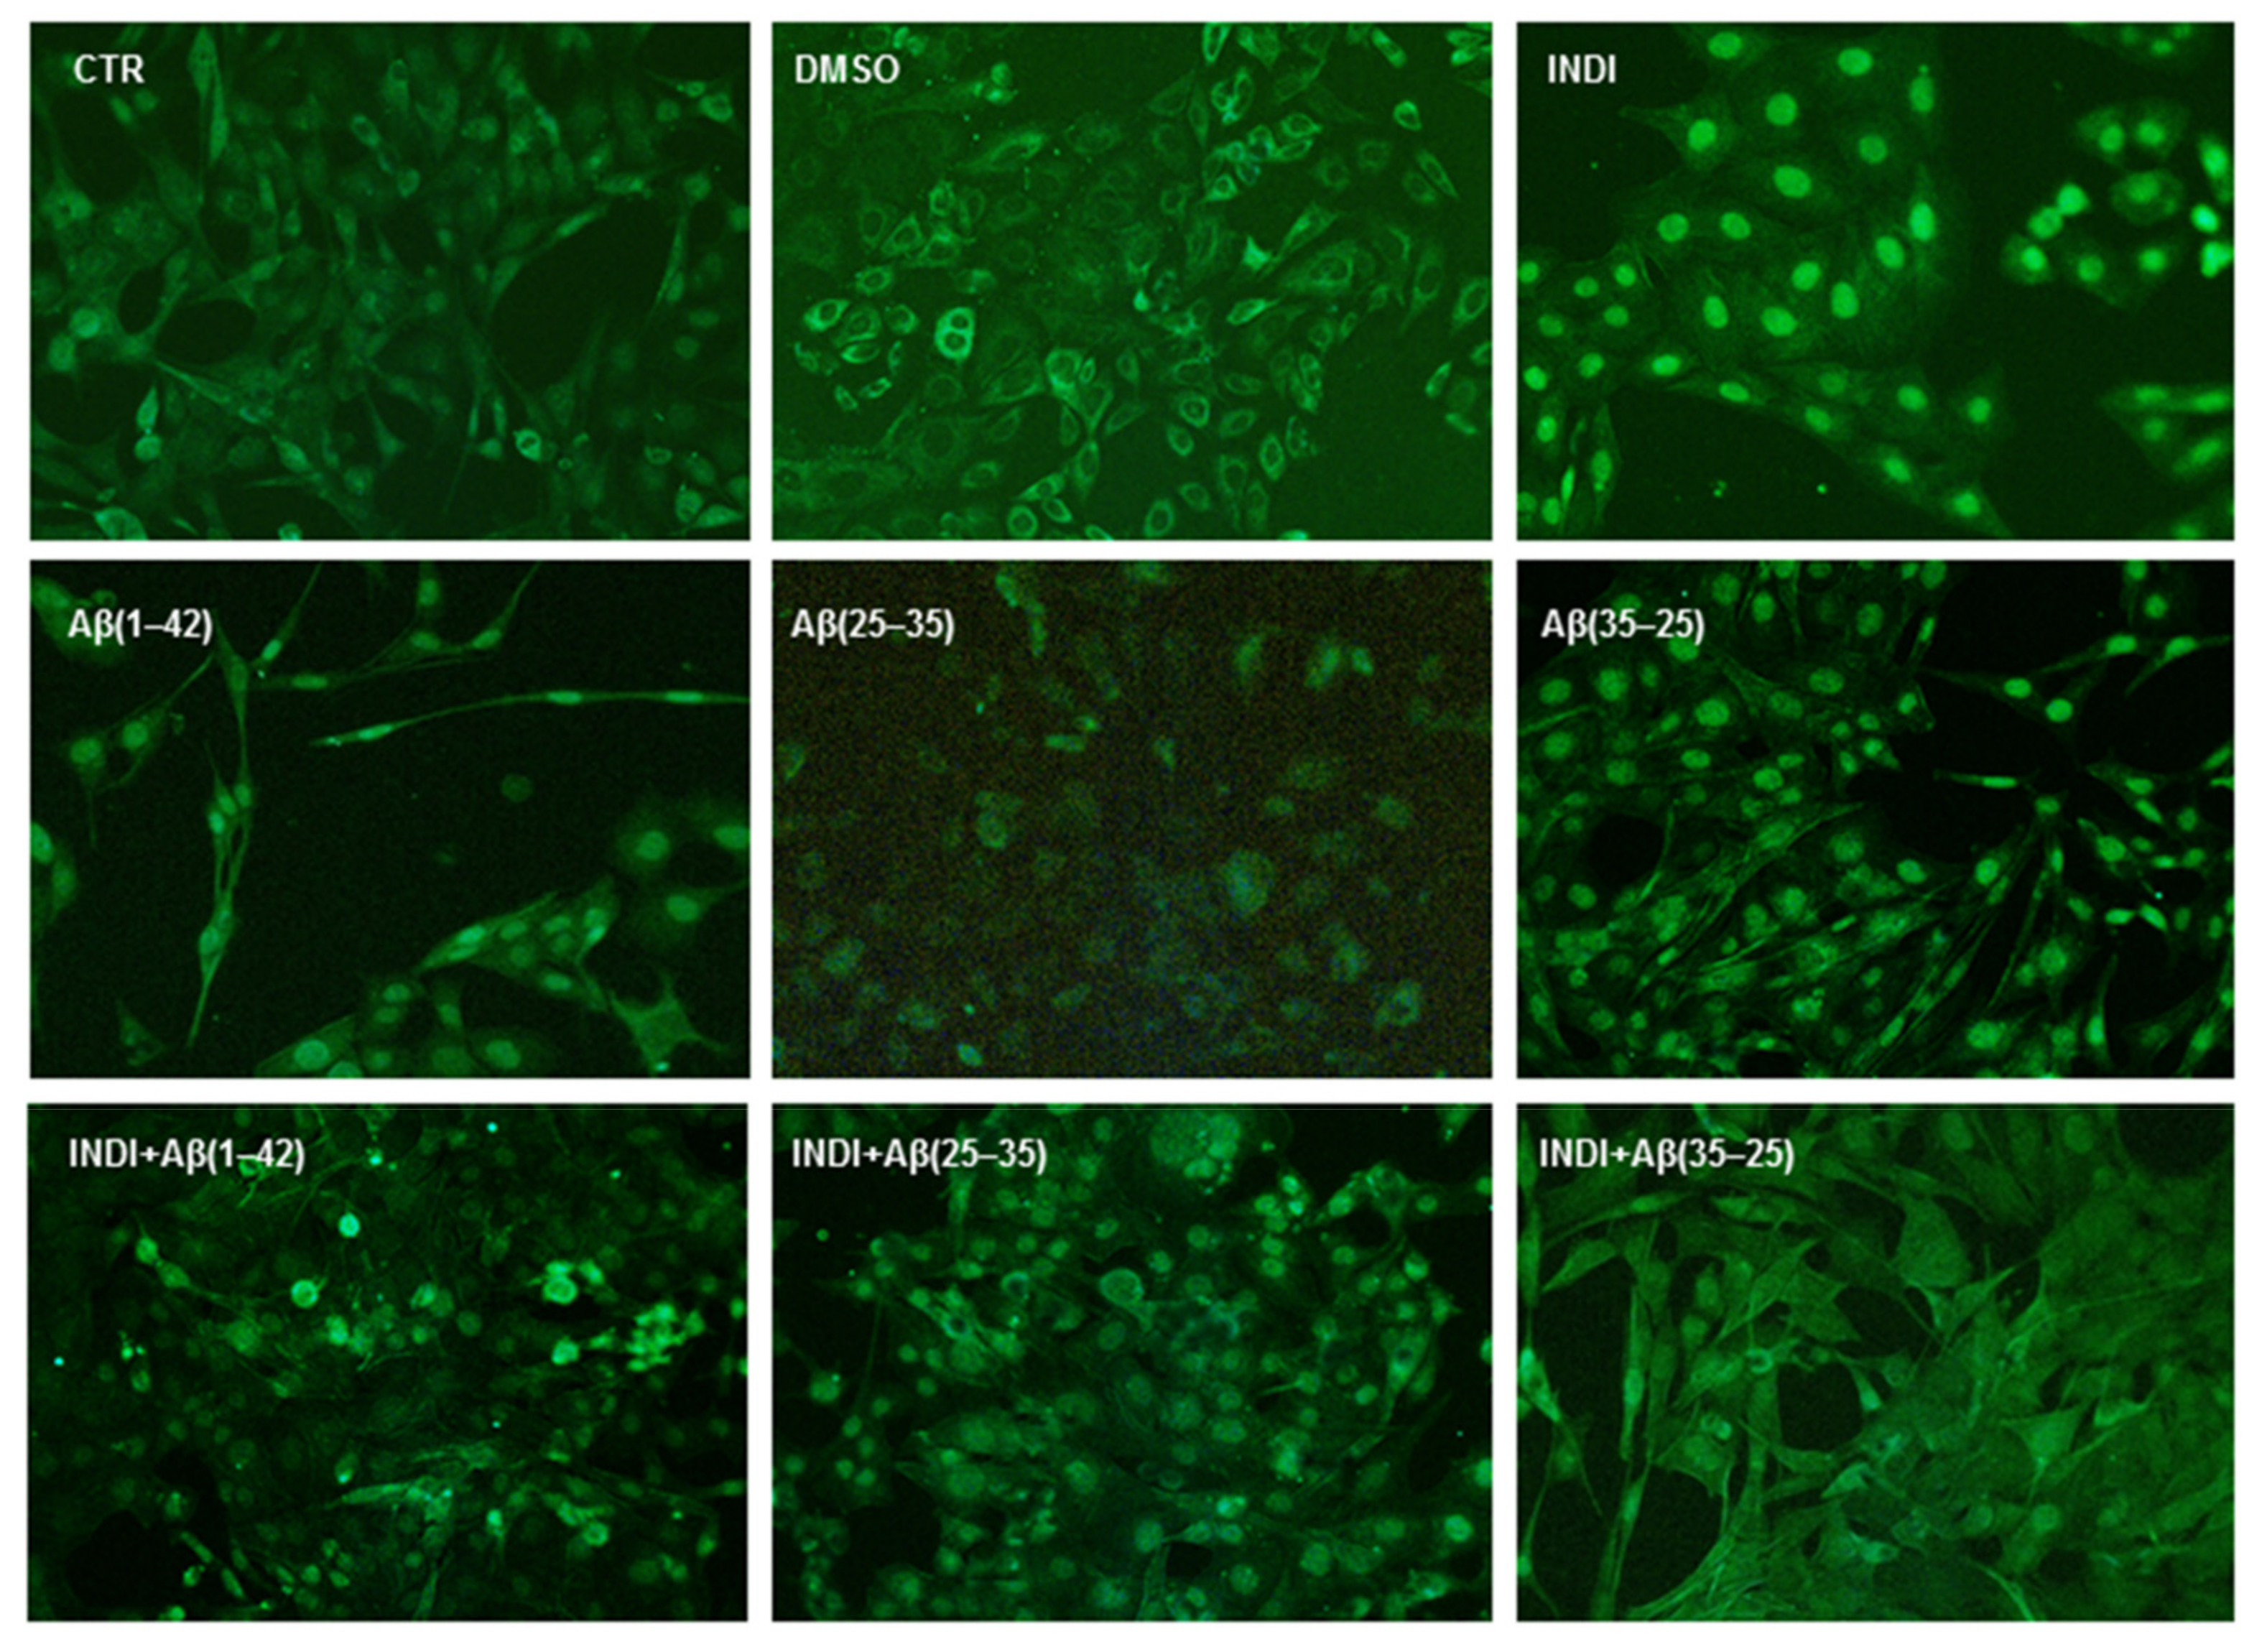
2.7. Cyclin d1 Expression Levels and Nestin Immunolabeling
3. Discussion
4. Materials and Methods
4.1. Materials
4.2. Animals
4.3. Olfactory Ensheathing Cell (OEC) Cultures
4.4. Indicaxanthin Purification
4.5. Treatment of OECs
4.6. 3(4,5-dimethyl-thiazol-2-yl)2,5-diphenyl-tetrazolium Bromide (MTT) Bioassay
4.7. Total ROS/O2− Production
4.8. Immunocytochemical Technique and Confocal Laser Scanning Microscope (CLSM) Analysis
4.9. Isolation of Total Protein and Western Blot Analysis
4.10. Statistical Analysis
5. Conclusions
Author Contributions
Funding
Institutional Review Board Statement
Informed Consent Statement
Data Availability Statement
Acknowledgments
Conflicts of Interest
Abbreviations
| AD | Alzheimer’s disease |
| Aβ | Amyloid Beta |
| TG2 | Tissue transglutaminase |
| TG2-L | Tissue transglutaminase Long |
| TG2-S | Tissue transglutaminase Short |
| OECs | Olfactory Ensheathing Cells |
| ROS | Reactive Oxygen Species |
| O2− | Superoxide anion |
| GFAP | Glial Fibrillary Acidic Protein |
| DMEM | Dulbecco Modified Eagles Medium |
| FBS | Fetal Bovine Serum |
References
- Kandimalla, R.; Reddy, P.H. Therapeutics of Neurotransmitters in Alzheimer’s Disease. J. Alzheimer’s Dis. 2017, 57, 1049–1069. [Google Scholar] [CrossRef] [PubMed]
- Lesort, M.; Tucholski, J.; Miller, M.L.; Johnson, G.V. Tissue transglutaminase: A possible role in neurodegenerative diseases. Prog. Neurobiol. 2000, 61, 439–463. [Google Scholar] [CrossRef]
- Hasegawa, G.; Suwa, M.; Ichikawa, Y.; Ohtsuka, T.; Kumagai, S.; Kikuchi, M.; Sato, Y.; Saito, Y. A novel function of tissue-type transglutaminase: Protein disulphide isomerase. Biochem. J. 2003, 373, 793–803. [Google Scholar] [CrossRef]
- Nakaoka, H.; Perez, D.M.; Baek, K.J.; Das, T.; Husain, A.; Misono, K.; Im, M.J.; Graham, R.M. Gh: A GTP-binding protein with transglutaminase activity and receptor signaling function. Science 1994, 264, 1593–1596. [Google Scholar] [CrossRef]
- Campisi, A.; Caccamo, D.; Raciti, G.; Cannavò, G.; Macaione, V.; Currò, M.; Macaione, S.; Vanella, A.; Ientile, R. Glutamate-induced increases in transglutaminase activity in primary cultures of astroglial cells. Brain Res. 2003, 978, 24–30. [Google Scholar] [CrossRef]
- Milakovic, T.; Tucholski, J.; McCoy, E.; Johnson, G.V. Intracellular localization and activity state of tissue transglutaminase differentially impacts cell death. J. Biol. Chem. 2004, 279, 8715–8722. [Google Scholar] [CrossRef] [PubMed]
- Kuo, T.F.; Tatsukawa, H.; Kojima, S. New insights into the functions and localization of nuclear transglutaminase. FEBS J. 2011, 278, 4756–4767. [Google Scholar] [CrossRef] [PubMed]
- Mishra, S.; Melino, G.; Murphy, L.J. Transglutaminase 2 kinase activity facilitates protein kinase A-induced phosphorylation of retinoblastoma protein. J. Biol. Chem. 2007, 282, 18108–18115. [Google Scholar] [CrossRef]
- Citron, B.A.; Suo, Z.; SantaCruz, K.; Davies, P.J.; Qin, F.; Festoff, B.W. Protein crosslinking, tissue transglutaminase, alternative splicing and neurodegeneration. Neurochem. Int. 2002, 40, 69–78. [Google Scholar] [CrossRef]
- Singh, G.; Zhang, J.; Ma, Y.; Cerione, R.A.; Antonyak, M.A. The different conformational states of tissue transglutaminase have opposing effects on cell viability. J. Biol. Chem. 2016, 291, 9119–9132. [Google Scholar] [CrossRef] [PubMed]
- Antonyak, M.A.; Jansen, J.M.; Miller, A.M.; Ly, T.K.; Endo, M.; Cerione, R.A. Two isoforms of tissue transglutaminase mediate opposing cellular fates. Proc. Natl. Acad. Sci. USA 2006, 103, 18609–18614. [Google Scholar] [CrossRef] [PubMed]
- Attems, J.; Walker, L.; Jellinger, K.A. Olfactory bulb involvement in neurodegenerative diseases. Acta Neuropathol. 2014, 127, 459–475. [Google Scholar] [CrossRef] [PubMed]
- Pellitteri, R.; Spatuzza, M.; Stanzani, S.; Zaccheo, D. Biomarkers expression in rat olfactory ensheathing cells. Front. Biosci. 2010, 2, 289–298. [Google Scholar] [CrossRef] [PubMed]
- Pellitteri, R.; Spatuzza, M.; Russo, A.; Zaccheo, D.; Stanzani, S. Olfactory ensheathing cells represent an optimal substrate for hippocampal neurons: An in vitro study. Int. J. Dev. Neurosci. 2009, 27, 453–458. [Google Scholar] [CrossRef]
- Castiglione, F.; Ferro, M.; Mavroudakis, E.; Pellitteri, R.; Bossolasco, P.; Zaccheo, D.; Morbidelli, M.; Silani, V.; Meli, A.; Moscatelli, D.; et al. NMR Metabolomics for Stem Cell type discrimination. Sci. Rep. 2017, 7, 15808–15820. [Google Scholar] [CrossRef]
- Pellitteri, R.; Cova, L.; Zaccheo, D.; Silani, V.; Bossolasco, P. Phenotypic modulation and neuroprotective effects of olfactory ensheathing cells: A promising tool for cell therapy. Stem Cell Rev. Rep. 2016, 12, 224–234. [Google Scholar] [CrossRef]
- Franssen, E.H.; de Bree, F.M.; Verhaagen, J. Olfactory ensheathing glia: Their contribution to primary olfactory nervous system regeneration and their regenerative potential following transplantation into the injured spinal cord. Brain Res. Rev. 2007, 56, 236–258. [Google Scholar] [CrossRef]
- Pellitteri, R.; Bonfanti, R.; Spatuzza, M.; Cambria, M.T.; Ferrara, M.; Raciti, G.; Campisi, A. Effect of some growth factors on tissue transglutaminase overexpression induced by β-amyloid in olfactory ensheathing cells. Mol. Neurobiol. 2017, 54, 6785–6794. [Google Scholar] [CrossRef]
- Mecocci, P.; Tinarelli, C.; Schulz, R.J.; Polidori, M.C. Nutraceuticals in cognitive impairment and Alzhèimer’s disease. Front. Pharmacol. 2014, 5, 147–158. [Google Scholar] [CrossRef] [PubMed]
- Tremocoldi, M.A.; Rosalen, P.L.; Franchin, M.; Massarioli, A.P.; Denny, C.; Daiuto, É.R.; Paschoal, J.A.R.; Melo, P.S.; Alencar, S.M. Exploration of avocado by-products as natural sources of bioactive compounds. PLoS ONE 2018, 13, e0192577–e0192589. [Google Scholar] [CrossRef] [PubMed]
- Naselli, F.; Tesoriere, L.; Caradonna, F.; Bellavia, D.; Attanzio, A.; Gentile, C.; Livrea, M.A. Anti-proliferative and pro-apoptotic activity of whole extract and isolated indicaxanthin from Opuntia ficus-indica associated with re-activation of the onco-suppressor p16(INK4a) gene in human colorectal carcinoma (Caco-2) cells. Biochem. Biophys. Res. Commun. 2014, 450, 652–658. [Google Scholar] [CrossRef]
- Allegra, M.; De Cicco, P.; Ercolano, G.; Attanzio, A.; Busà, R.; Cirino, G.; Tesoriere, L.; Livrea, M.A.; Ianaro, A. Indicaxanthin from Opuntia ficus indica (L. Mill) impairs melanoma cell proliferation, invasiveness, and tumor progression. Phytomedicine 2018, 50, 19–24. [Google Scholar] [CrossRef]
- Allegra, M.; Tutone, M.; Tesoriere, L.; Almerico, A.M.; Culletta, G.; Livrea, M.A.; Attanzio, A. Indicaxanthin, a multi-target natural compound from Opuntia ficus-indica fruit: From its poly-pharmacological effects to biochemical mechanisms and molecular modelling studies. Eur. J. Med. Chem. 2019, 179, 753–764. [Google Scholar] [CrossRef] [PubMed]
- Allegra, M.; Carletti, F.; Gambino, G.; Tutone, M.; Attanzio, A.; Tesoriere, L.; Ferraro, G.; Sardo, P.; Almerico, A.M.; Livrea, M.A. Indicaxanthin from Opuntia ficus-indica crosses the blood-brain barrier and modulates neuronal bioelectric activity in rat hippocampus at dietary-consistent amounts. J. Agric. Food Chem. 2015, 63, 7353–7360. [Google Scholar] [CrossRef]
- Choi, J.; Malakowsky, C.A.; Talent, J.M.; Conrad, C.C.; Carroll, C.A.; Weintraub, S.T.; Gracy, R.W. Anti-apoptotic proteins are oxidized by Aβ25–35 in Alzheimer’s fibroblasts. Biochim. Biophys. Acta 2003, 1637, 135–141. [Google Scholar] [CrossRef]
- Chen, C.L.; Wang, L.J.; Yan, Y.T.; Hsu, H.W.; Su, H.L.; Chang, F.P.; Hsieh, P.C.H.; Hwang, S.M.; Shen, C.N. Cyclin D1 acts as a barrier to pluripotent reprogramming by promoting neural progenitor fate commitment. FEBS Lett. 2014, 588, 4008–4017. [Google Scholar] [CrossRef]
- Safouris, A.; Tsivgoulis, G.; Sergentanis, T.N.; Psaltopoulou, T. Mediterranean diet and risk of dementia. Curr. Alzhèimer Res. 2015, 12, 335–349. [Google Scholar] [CrossRef]
- Rudrabhatla, P. Regulation of neuronal cytoskeletal protein phosphorylation in neurodegenerative diseases. J. Alzheimer’s Dis. 2014, 41, 671–684. [Google Scholar] [CrossRef]
- Osborn, L.M.; Kamphuis, W.; Wadman, W.J.; Hol, E.M. Astrogliosis: An integral player in the pathogenesis of Alzheimer’s disease. Prog. Neurobiol. 2016, 144, 121–141. [Google Scholar] [CrossRef]
- Djordjevic, J.; Jones-Gotman, M.; De Sousa, K.; Chertkow, H. Olfaction in patients with mild cognitive impairment and Alzheimer’s disease. Neurobiol. Aging 2008, 29, 693–706. [Google Scholar] [CrossRef] [PubMed]
- Vasavada, M.M.; Martinez, B.; Wang, J.; Eslinger, P.J.; Gill, D.J.; Sun, X.; Karunanayaka, P.; Yang, Q.X. Central olfactory dysfunction in Alzheimer’s disease and mild cognitive impairment: A functional MRI study. J. Alzheimer’s Dis. 2017, 59, 359–368. [Google Scholar] [CrossRef]
- Aqrabawi, A.J.; Kim, J.C. Topographic organization of hippocampal inputs to the Anterior Olfactory Nucleus. Front. Neuroanat. 2018, 12, 12–19. [Google Scholar] [CrossRef]
- Campisi, A.; Spatuzza, M.; Russo, A.; Raciti, G.; Vanella, A.; Stanzani, S.; Pellitteri, R. Expression of tissue transglutaminase on primary olfactory ensheathing cells cultures exposed to stress conditions. Neurosci. Res. 2012, 72, 289–295. [Google Scholar] [CrossRef]
- Campisi, A.; Caccamo, D.; Li Volti, G.; Currò, M.; Parisi, G.; Avola, R.; Vanella, A.; Ientile, R. Glutamate-evoked redox state alterations are involved in tissue transglutaminase upregulation in primary astrocyte cultures. FEBS Lett. 2004, 578, 80–84. [Google Scholar] [CrossRef] [PubMed]
- Mputhia, Z.; Hone, E.; Tripathi, T.; Sargeant, T.; Martins, R.; Bharadwaj, P. Autophagy modulation as a treatment of amyloid diseases. Molecules 2019, 24, 3372. [Google Scholar] [CrossRef]
- Gambino, G.; Allegra, M.; Sardo, P.; Attanzio, A.; Tesoriere, L.; Livrea, M.A.; Ferraro, G.; Carletti, F. Brain distribution and modulation of neuronal excitability by indicaxanthin from Opuntia ficus indica administered at nutritionally-relevant amounts. Front. Aging Neurosci. 2018, 10, 133–144. [Google Scholar] [CrossRef]
- Tesoriere, L.; Attanzio, A.; Allegra, M.; Gentile, C.; Livrea, M.A. Phytochemical indicaxanthin suppresses 7-ketocholesterol-induced THP-1 cell apoptosis by preventing cytosolic Ca(2+) increase and oxidative stress. Br. J. Nutr. 2013, 110, 230–240. [Google Scholar] [CrossRef] [PubMed]
- Tatsukawa, H.; Furutani, Y.; Hitomi, K.; Kojima, S. Transglutaminase 2 has opposing roles in the regulation of cellular functions as well as cell growth and death. Cell Death Dis. 2016, 7, e2244–e2256. [Google Scholar] [CrossRef]
- Wilhelmus, M.M.; Jongenelen, C.A.; Bol, J.G.J.M.; Drukarch, B. Interaction between tissue transglutaminase and amyloid-beta: Protein-protein binding versus enzymatic crosslinking. Anal. Biochem. 2020, 592, 113578. [Google Scholar] [CrossRef]
- Pellitteri, R.; Spatuzza, M.; Russo, A.; Stanzani, S. Olfactory ensheathing cells exert a trophic effect on the hypothalamic neurons in vitro. Neurosci. Lett. 2007, 417, 24–29. [Google Scholar] [CrossRef] [PubMed]
- Chuah, M.I.; Au, C. Cultures of ensheathing cells from neonatal rat olfactory bulbs. Brain Res. 1993, 601, 213–220. [Google Scholar] [CrossRef]
- Grasso, R.; Dell’Albani, P.; Carbone, C.; Spatuzza, M.; Bonfanti, R.; Sposito, G.; Puglisi, G.; Musumeci, F.; Scordino, A.; Campisi, A. Synergic pro-apoptotic effects of Ferulic Acid and nanostructured lipid carrier in glioblastoma cells assessed through molecular and Delayed Luminescence studies. Sci. Rep. 2020, 10, 4680–4693. [Google Scholar] [CrossRef] [PubMed]


Publisher’s Note: MDPI stays neutral with regard to jurisdictional claims in published maps and institutional affiliations. |
© 2021 by the authors. Licensee MDPI, Basel, Switzerland. This article is an open access article distributed under the terms and conditions of the Creative Commons Attribution (CC BY) license (http://creativecommons.org/licenses/by/4.0/).
Share and Cite
Campisi, A.; Raciti, G.; Sposito, G.; Grasso, R.; Chiacchio, M.A.; Spatuzza, M.; Attanzio, A.; Chiacchio, U.; Tesoriere, L.; Allegra, M.; et al. Amyloid-Beta Induces Different Expression Pattern of Tissue Transglutaminase and Its Isoforms on Olfactory Ensheathing Cells: Modulatory Effect of Indicaxanthin. Int. J. Mol. Sci. 2021, 22, 3388. https://doi.org/10.3390/ijms22073388
Campisi A, Raciti G, Sposito G, Grasso R, Chiacchio MA, Spatuzza M, Attanzio A, Chiacchio U, Tesoriere L, Allegra M, et al. Amyloid-Beta Induces Different Expression Pattern of Tissue Transglutaminase and Its Isoforms on Olfactory Ensheathing Cells: Modulatory Effect of Indicaxanthin. International Journal of Molecular Sciences. 2021; 22(7):3388. https://doi.org/10.3390/ijms22073388
Chicago/Turabian StyleCampisi, Agata, Giuseppina Raciti, Giovanni Sposito, Rosaria Grasso, Maria A. Chiacchio, Michela Spatuzza, Alessandro Attanzio, Ugo Chiacchio, Luisa Tesoriere, Mario Allegra, and et al. 2021. "Amyloid-Beta Induces Different Expression Pattern of Tissue Transglutaminase and Its Isoforms on Olfactory Ensheathing Cells: Modulatory Effect of Indicaxanthin" International Journal of Molecular Sciences 22, no. 7: 3388. https://doi.org/10.3390/ijms22073388
APA StyleCampisi, A., Raciti, G., Sposito, G., Grasso, R., Chiacchio, M. A., Spatuzza, M., Attanzio, A., Chiacchio, U., Tesoriere, L., Allegra, M., & Pellitteri, R. (2021). Amyloid-Beta Induces Different Expression Pattern of Tissue Transglutaminase and Its Isoforms on Olfactory Ensheathing Cells: Modulatory Effect of Indicaxanthin. International Journal of Molecular Sciences, 22(7), 3388. https://doi.org/10.3390/ijms22073388