Impact of Different Physical Exercises on the Expression of Autophagy Markers in Mice

 ,
,  ,
,  , ,
, ,
Abstract
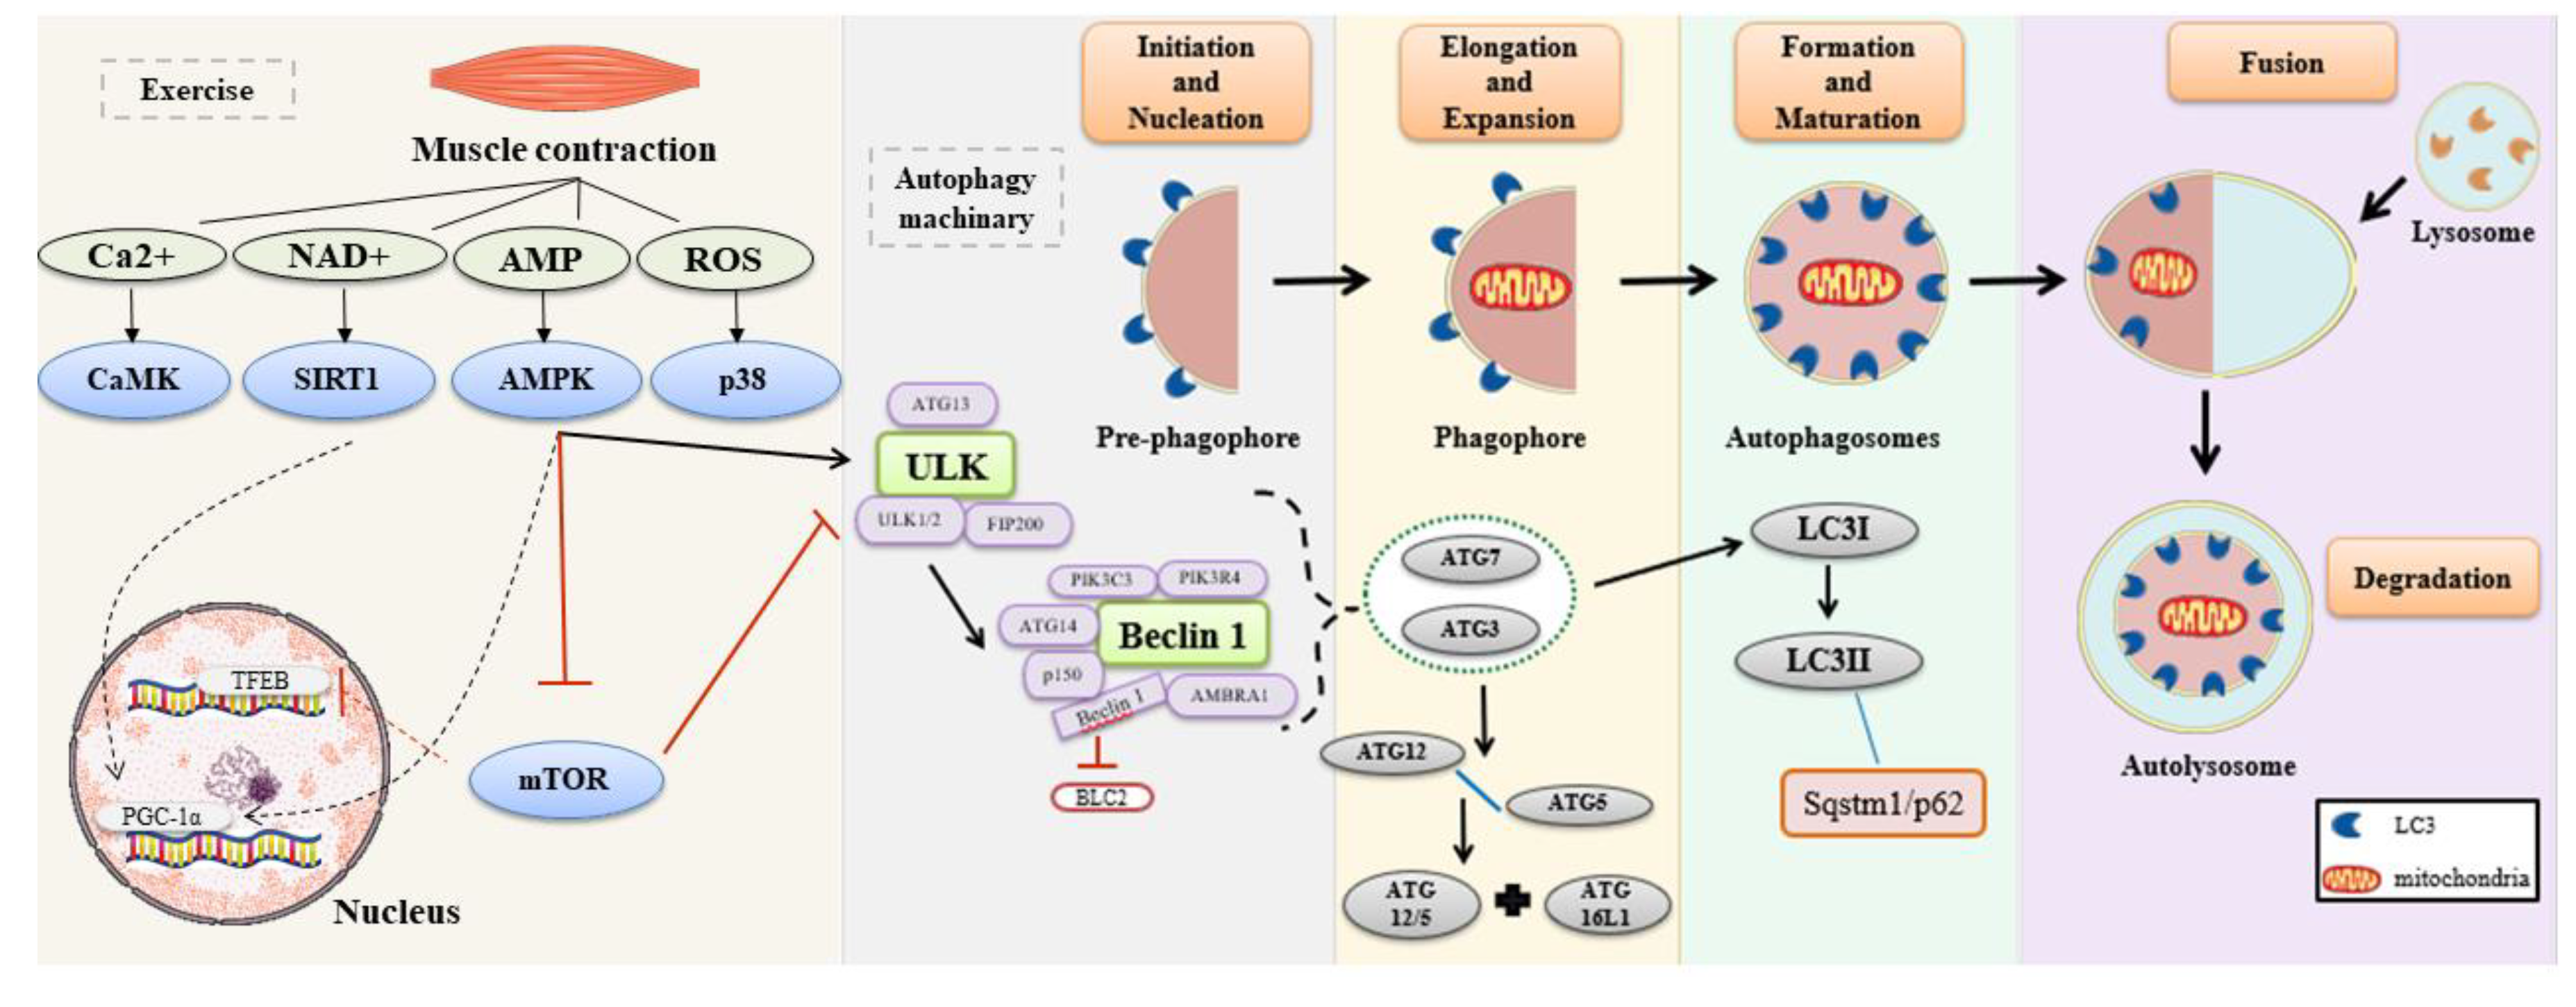
1. Introduction
2. Results
2.1. Body Weight and Glucose Concentrations
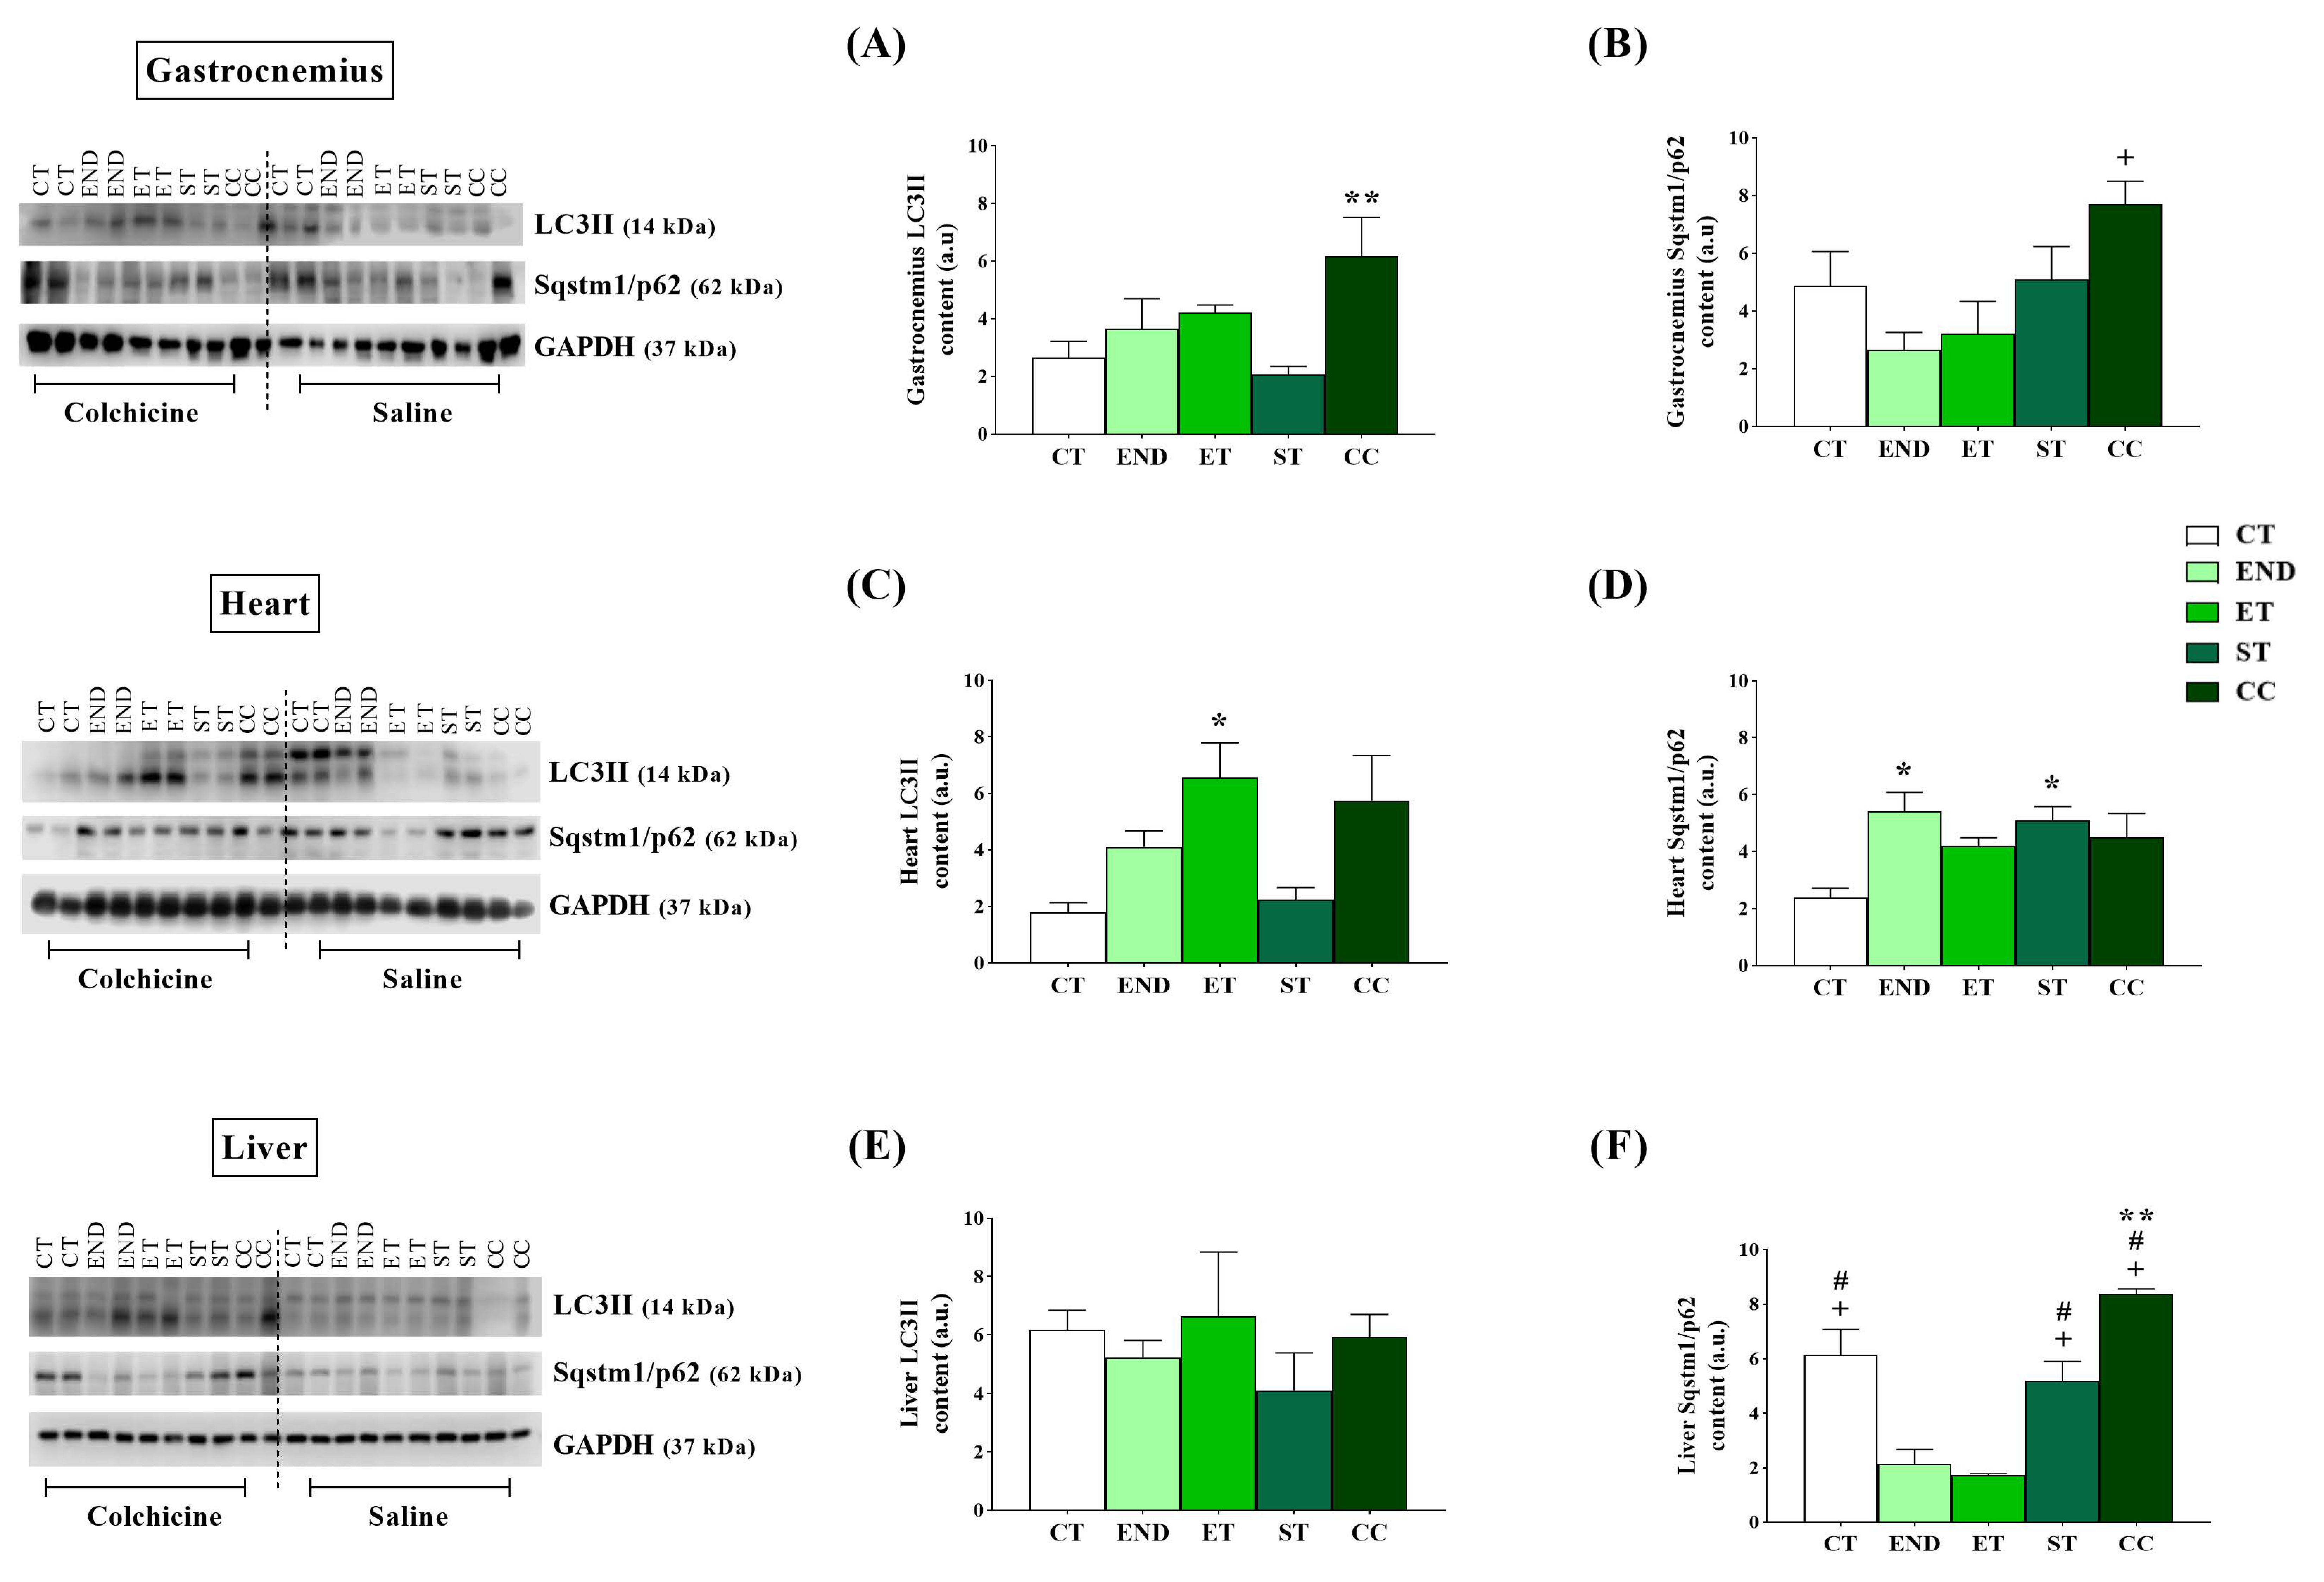
2.2. Effects of Acute Physical Exercise Protocols on Gastrocnemius Muscle
2.3. Effects of Acute Physical Exercise Protocols on the Heart
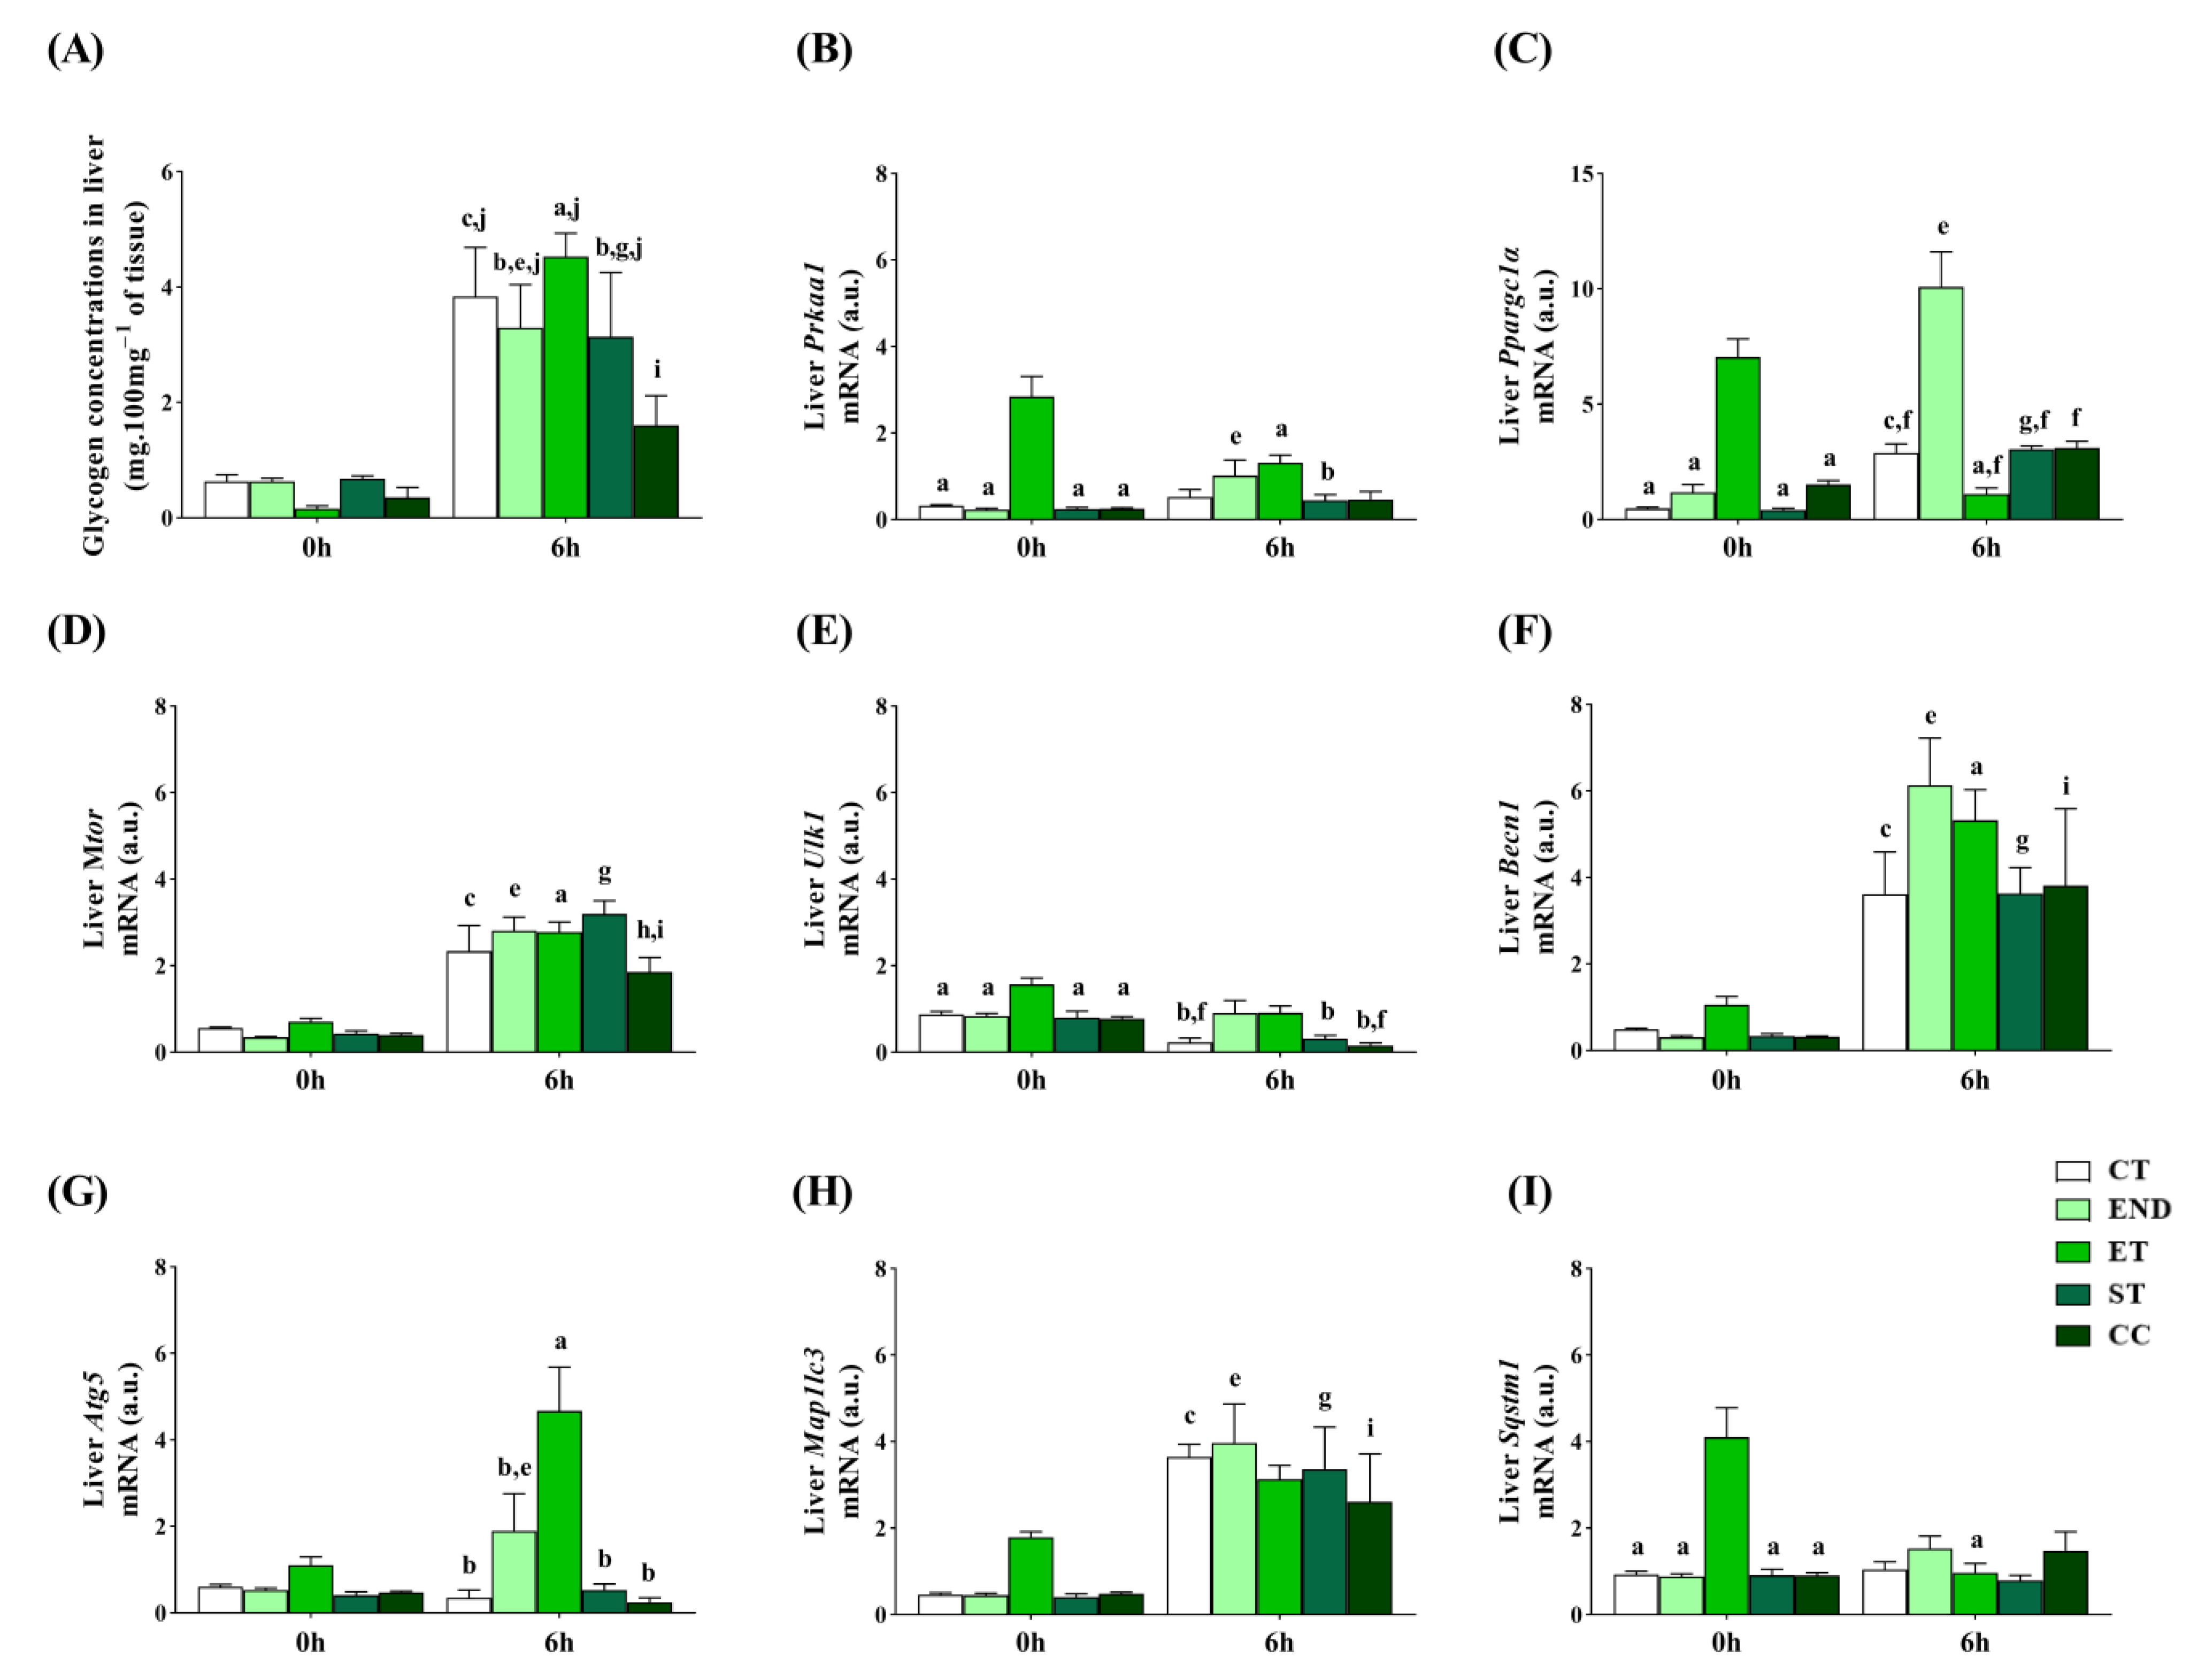
2.4. Effects of Acute Physical Exercise Protocols on the Liver
3. Discussion
3.1. Effects of Acute Physical Exercise Protocols on Gastrocnemius Muscle
3.2. Effects of Acute Physical Exercise Protocols on the Heart
3.3. Effects of Acute Physical Exercise Protocols on the Liver
4. Materials and Methods
4.1. Animals
4.2. Experimental Procedures
4.2.1. Incremental Load Test
4.2.2. Acute Physical Exercise Protocols
4.3. Glucose Levels
4.4. Tissue Extractions
4.5. Glycogen Concentrations
4.6. Reverse Transcription-Quantitative Polymerase Chain Reaction (RTq-PCR)
4.7. Markers of Autophagy
4.8. Immunoblotting Technique
4.9. Statistical Analysis
Supplementary Materials
Author Contributions
Funding
Institutional Review Board Statement
Informed Consent Statement
Data Availability Statement
Conflicts of Interest
Abbreviations
| ATG | Autophagy-related gene |
| BCL-2 | B cell lymphoma 2 |
| LC3 | Microtubule-associated protein |
| END | Endurance exercise |
| ET | Exhaustive exercise |
| ST | Strength exercise |
| CC | Concurrent exercise |
| MLSS | Maximal lactate steady state |
| EV | Exhaustion velocity |
References
- Vainshtein, A.; Hood, D.A. The regulation of autophagy during exercise in skeletal muscle. J. Appl. Physiol. 2016, 120, 664–673. [Google Scholar] [CrossRef] [PubMed]
- Hosokawa, N.; Hara, T.; Kaizuka, T.; Kishi, C.; Takamura, A.; Miura, Y.; Iemura, S.-I.; Natsume, T.; Takehana, K.; Yamada, N.; et al. Nutrient-dependent mTORC1 Association with the ULK1–Atg13–FIP200 Complex Required for Autophagy. Mol. Biol. Cell 2009, 20, 1981–1991. [Google Scholar] [CrossRef] [PubMed]
- Cantó, C.; Gerhart-Hines, Z.; Feige, J.N.; Lagouge, M.; Noriega, L.; Milne, J.C.; Elliott, P.J.; Puigserver, P.; Auwerx, J. AMPK regulates energy expenditure by modulating NAD+ metabolism and SIRT1 activity. Nat. Cell Biol. 2009, 458, 1056–1060. [Google Scholar] [CrossRef]
- Eskelinen, E.-L.; Saftig, P. Autophagy: A lysosomal degradation pathway with a central role in health and disease. Biochim. Biophys. Acta (BBA) Bioenerg. 2009, 1793, 664–673. [Google Scholar] [CrossRef] [PubMed]
- He, C.; Klionsky, D.J. Regulation mechanisms and signaling pathways of autophagy. Annu. Rev. Genet. 2009, 43, 67–93. [Google Scholar] [CrossRef] [PubMed]
- Martin-Rincon, M.; Morales-Alamo, D.; Calbet, J.A. Exercise-mediated modulation of autophagy in skeletal muscle. Scand. J. Med. Sci. Sports 2017, 28, 772–781. [Google Scholar] [CrossRef]
- Alers, S.; Loffler, A.S.; Wesselborg, S.; Stork, B. Role of AMPK-mTOR-Ulk1/2 in the regulation of autophagy: Cross talk, shortcuts, and feedbacks. Mol. Cell. Biol. 2012, 32, 2–11. [Google Scholar] [CrossRef]
- Hawley, J.A.; Hargreaves, M.; Joyner, M.J.; Zierath, J.R. Integrative Biology of Exercise. Cell 2014, 159, 738–749. [Google Scholar] [CrossRef]
- Wang, L.; Mascher, H.; Psilander, N.; Blomstrand, E.; Sahlin, K. Resistance exercise enhances the molecular signaling of mitochondrial biogenesis induced by endurance exercise in human skeletal muscle. J. Appl. Physiol. 2011, 111, 1335–1344. [Google Scholar] [CrossRef]
- Coffey, V.G.; Jemiolo, B.; Edge, J.; Garnham, A.P.; Trappe, S.W.; Hawley, J.A. Effect of consecutive repeated sprint and resistance exercise bouts on acute adaptive responses in human skeletal muscle. Am. J. Physiol. Integr. Comp. Physiol. 2009, 297, R1441–R1451. [Google Scholar] [CrossRef]
- Bayod, S.; Del Valle, J.; Pelegri, C.; Vilaplana, J.; Canudas, A.M.; Camins, A.; Jimenez, A.; Sanchez-Roige, S.; Lalanza, J.F.; Escorihuela, R.M.; et al. Macroautophagic process was differentially modulated by long-term moderate exercise in rat brain and peripheral tissues. J. Physiol. Pharmacol. Off. J. Pol. Physiol. Soc. 2014, 65, 229–239. [Google Scholar]
- Cui, M.; Yu, H.; Wang, J.; Gao, J.; Li, J. Chronic Caloric Restriction and Exercise Improve Metabolic Conditions of Dietary-Induced Obese Mice in Autophagy Correlated Manner without Involving AMPK. J. Diabetes Res. 2013, 2013, 1–8. [Google Scholar] [CrossRef] [PubMed]
- He, C.; Bassik, M.C.; Moresi, V.; Sun, K.; Wei, Y.; Zou, Z.; An, Z.; Loh, J.; Fisher, J.K.; Sun, Q.; et al. Exercise-induced BCL2-regulated autophagy is required for muscle glucose homeostasis. Nat. Cell Biol. 2012, 481, 511–515. [Google Scholar] [CrossRef] [PubMed]
- Pauly, M.; Assense, A.; Rondon, A.; Thomas, A.; Dubouchaud, H.; Freyssenet, D.; Benoit, H.; Castells, J.; Flore, P. High intensity aerobic exercise training improves chronic intermittent hypoxia-induced insulin resistance without basal autophagy modulation. Sci. Rep. 2017, 7, 43663. [Google Scholar] [CrossRef] [PubMed]
- Ogura, Y.; Iemitsu, M.; Naito, H.; Kakigi, R.; Kakehashi, C.; Maeda, S.; Akema, T. Single bout of running exercise changes LC3-II expression in rat cardiac muscle. Biochem. Biophys. Res. Commun. 2011, 414, 756–760. [Google Scholar] [CrossRef] [PubMed]
- Wohlgemuth, S.E.; Seo, A.Y.; Marzetti, E.; Lees, H.A.; Leeuwenburgh, C. Skeletal muscle autophagy and apoptosis during aging: Effects of calorie restriction and life-long exercise. Exp. Gerontol. 2010, 45, 138–148. [Google Scholar] [CrossRef]
- Halling, J.F.; Ringholm, S.; Nielsen, M.M.; Overby, P.; Pilegaard, H. PGC-1α promotes exercise-induced autophagy in mouse skeletal muscle. Physiol. Rep. 2016, 4, e12698. [Google Scholar] [CrossRef]
- Kim, Y.A.; Kim, Y.S.; Song, W. Autophagic response to a single bout of moderate exercise in murine skeletal muscle. J. Physiol. Biochem. 2012, 68, 229–235. [Google Scholar] [CrossRef]
- Luces, M.D.C.F.; Delmiro, A.; Soares-Miranda, L.; González-Murillo, Á.; Martínez-Palacios, J.; Ramírez-Orellana, M.; Lucia, A.; Morán, M. Exercise training can induce cardiac autophagy at end-stage chronic conditions: Insights from a graft-versus-host-disease mouse model. Brain Behav. Immun. 2014, 39, 56–60. [Google Scholar] [CrossRef]
- Gunadi, J.W.; Tarawan, V.M.; Ray, H.R.D.; Wahyudianingsih, R.; Lucretia, T.; Tanuwijaya, F.; Lesmana, R.; Supratman, U.; Setiawan, I. Different training intensities induced autophagy and histopathology appearances potentially associated with lipid metabolism in wistar rat liver. Heliyon 2020, 6, e03874. [Google Scholar] [CrossRef]
- Luo, L.; Lu, A.-M.; Wang, Y.; Hong, A.; Chen, Y.; Hu, J.; Li, X.; Qin, Z.-H. Chronic resistance training activates autophagy and reduces apoptosis of muscle cells by modulating IGF-1 and its receptors, Akt/mTOR and Akt/FOXO3a signaling in aged rats. Exp. Gerontol. 2013, 48, 427–436. [Google Scholar] [CrossRef] [PubMed]
- Ranjbar, K.; Ballarò, R.; Bover, Q.; Pin, F.; Beltrà, M.; Penna, F.; Costelli, P. Combined Exercise Training Positively Affects Muscle Wasting in Tumor-Bearing Mice. Med. Sci. Sports Exerc. 2019, 51, 1387–1395. [Google Scholar] [CrossRef] [PubMed]
- Aas, S.N.; Hamarsland, H.; Cumming, K.T.; Rognlien, S.H.; Aase, O.J.; Nordseth, M.; Karsrud, S.; Godager, S.; Tømmerbakke, D.; Handegard, V.; et al. The impact of age and frailty on skeletal muscle autophagy markers and specific strength: A cross-sectional comparison. Exp. Gerontol. 2019, 125, 110687. [Google Scholar] [CrossRef] [PubMed]
- Liu, A.; Guo, E.; Yang, J.; Yang, Y.; Liu, S.; Jiang, X.; Hu, Q.; Dirsch, O.; Dahmen, U.; Zhang, C.; et al. Young plasma reverses age-dependent alterations in hepatic function through the restoration of autophagy. Aging Cell 2017, 17. [Google Scholar] [CrossRef] [PubMed]
- Linton, P.-J.; Gurney, M.; Sengstock, D.; Mentzer, R.M.; Gottlieb, R.A. This old heart: Cardiac aging and autophagy. J. Mol. Cell. Cardiol. 2015, 83, 44–54. [Google Scholar] [CrossRef] [PubMed]
- Nakai, A.; Yamaguchi, O.; Takeda, T.; Higuchi, Y.; Hikoso, S.; Taniike, M.; Omiya, S.; Mizote, I.; Matsumura, Y.; Asahi, M.; et al. The role of autophagy in cardiomyocytes in the basal state and in response to hemodynamic stress. Nat. Med. 2007, 13, 619–624. [Google Scholar] [CrossRef]
- Ueno, T.; Komatsu, M. Autophagy in the liver: Functions in health and disease. Nat. Rev. Gastroenterol. Hepatol. 2017, 14, 170–184. [Google Scholar] [CrossRef]
- He, C.; Sumpter, J.R.; Levine, B. Exercise induces autophagy in peripheral tissues and in the brain. Autophagy 2012, 8, 1548–1551. [Google Scholar] [CrossRef]
- Bonam, S.R.; Wang, F.; Muller, S. Autophagy: A new concept in autoimmunity regulation and a novel therapeutic option. J. Autoimmun. 2018, 94, 16–32. [Google Scholar] [CrossRef]
- Bonam, S.R.; Bayry, J.; Tschan, M.P.; Muller, S. Progress and Challenges in The Use of MAP1LC3 as a Legitimate Marker for Measuring Dynamic Autophagy In Vivo. Cells 2020, 9, 1321. [Google Scholar] [CrossRef]
- Kliosnky, D. Guidelines for the Use and Interpretation of Assays for Monitoring Autophagy. Autophagy 2016, 12, 1–222. [Google Scholar]
- Armstrong, R.B.; Saubert, C.W.; Sembrowich, W.L.; Shepherd, R.E.; Gollnick, P.D. Glycogen depletion in rat skeletal muscle fibers at different intensities and durations of exercise. Pflüg. Arch. 1974, 352, 243–256. [Google Scholar] [CrossRef] [PubMed]
- Brasseur, J.E.; Curtis, R.L.; Mellender, J.W.; Rimm, A.A.; Melvin, J.L.; Sulaiman, A.R. Systematic distribution of muscle fiber types in the medial gastrocnemius of the laboratory mouse: A morphometric analysis. Anat. Rec. 1987, 218, 396–401. [Google Scholar] [CrossRef] [PubMed]
- Cambri, L.T.; Ribeiro, C.; Botezelli, J.D.; Ghezzi, A.C.; Mello, M.A. Muscle glycogen metabolism changes in rats fed early postnatal a fructose-rich diet after maternal protein malnutrition: Effects of acute physical exercise at the maximal lactate steady-state intensity. Diabetol. Metab. Syndr. 2014, 6, 118. [Google Scholar] [CrossRef] [PubMed]
- Ferreira, J.C.B.; Rolim, N.; Bartholomeu, J.B.; Gobatto, C.A.; Kokubun, E.; Brum, P.C. Maximal lactate steady state in running mice: Effect of exercise training. Clin. Exp. Pharmacol. Physiol. 2007, 34, 760–765. [Google Scholar] [CrossRef] [PubMed]
- Da Silva, A.S.; Pauli, J.R.; Ropelle, E.R.; Oliveira, A.G.; Cintra, D.E.; De Souza, C.T. Exercise intensity, inflammatory signaling, and insulin resistance in obese rats. Med. Sci. Sports Exerc. 2010, 42, 2180–2188. [Google Scholar] [CrossRef] [PubMed]
- Vainshtein, A.; Tryon, L.D.; Pauly, M.; Hood, D.A. Role of PGC-1α during acute exercise-induced autophagy and mitophagy in skeletal muscle. Am. J. Physiol. Physiol. 2015, 308, C710–C719. [Google Scholar] [CrossRef]
- Brandt, N.; Dethlefsen, M.M.; Bangsbo, J.; Pilegaard, H. PGC-1α and exercise intensity dependent adaptations in mouse skeletal muscle. PLoS ONE 2017, 12, e0185993. [Google Scholar] [CrossRef]
- Schwalm, C.; Jamart, C.; Benoit, N.; Naslain, D.; Prémont, C.; Prévet, J.; Van Thienen, R.; Deldicque, L.; Francaux, M. Activation of autophagy in human skeletal muscle is dependent on exercise intensity and AMPK activation. FASEB J. 2015, 29, 3515–3526. [Google Scholar] [CrossRef]
- Egan, B.; Zierath, J.R. Exercise Metabolism and the Molecular Regulation of Skeletal Muscle Adaptation. Cell Metab. 2013, 17, 162–184. [Google Scholar] [CrossRef]
- Kwon, I.; Jang, Y.; Cho, J.-Y.; Jang, Y.C.; Lee, Y. Long-term resistance exercise-induced muscular hypertrophy is associated with autophagy modulation in rats. J. Physiol. Sci. 2017, 68, 269–280. [Google Scholar] [CrossRef] [PubMed]
- Kim, Y.; Hood, D.A. Regulation of the autophagy system during chronic contractile activity-induced muscle adaptations. Physiol. Rep. 2017, 5, e13307. [Google Scholar] [CrossRef] [PubMed]
- Lira, V.A.; Okutsu, M.; Zhang, M.; Greene, N.P.; Laker, R.C.; Breen, D.S.; Hoehn, K.L.; Yan, Z. Autophagy is required for exercise training-induced skeletal muscle adaptation and improvement of physical performance. FASEB J. 2013, 27, 4184–4193. [Google Scholar] [CrossRef] [PubMed]
- da Rocha, A.L.; Pinto, A.P.; Morais, G.P.; Marafon, B.B.; Rovina, R.L.; Veras, A.S.C. Moderate, but Not Excessive, Training Attenuates Autophagy Machinery in Metabolic Tissues. Int. J. Mol. Sci. 2020, 21, 8416. [Google Scholar] [CrossRef] [PubMed]
- Li, J.-Y.; Pan, S.-S.; Wang, J.-Y.; Lu, J. Changes in Autophagy Levels in Rat Myocardium During Exercise Preconditioning-Initiated Cardioprotective Effects. Int. Hear. J. 2019, 60, 419–428. [Google Scholar] [CrossRef]
- Liu, H.; Lei, H.; Shi, Y.; Wang, J.-J.; Chen, N.; Li, Z.-H.; Chen, Y.-F.; Ye, Q.-F.; Yang, Y. Autophagy inhibitor 3-methyladenine alleviates overload-exercise-induced cardiac injury in rats. Acta Pharmacol. Sin. 2017, 38, 990–997. [Google Scholar] [CrossRef]
- Sciarretta, S.; Maejima, Y.; Zablocki, D.; Sadoshima, J. The Role of Autophagy in the Heart. Annu. Rev. Physiol. 2018, 80, 1–26. [Google Scholar] [CrossRef]
- Pinto, A.P.; Da Rocha, A.L.; Kohama, E.B.; Gaspar, R.C.; Simabuco, F.M.; Frantz, F.G.; De Moura, L.P.; Pauli, J.R.; Cintra, D.E.; Ropelle, E.R.; et al. Exhaustive acute exercise-induced ER stress is attenuated in IL-6-knockout mice. J. Endocrinol. 2019, 240, 181–193. [Google Scholar] [CrossRef]
- da Rocha, A.L.; Pereira, B.C.; Teixeira, G.R.; Pinto, A.P.; Frantz, F.G.; Elias, L.L.; Lira, F.S.; Pauli, J.R.; Cintra, D.E.; Ropelle, E.R.; et al. Treadmill slope influences inflammation, changes in the fiber composition, as well as androgen and glucocorticoid receptor expressions in the skeletal muscle of overtrained mice. Front. Immunol. 2017, 8, 1378. [Google Scholar] [CrossRef]
- da Rocha, A.L.; Teixeira, G.R.; Pinto, A.P.; de Morais, G.P.; Oliveira, L.D.C.; de Vicente, L.G. Excessive training induces molecular signs of pathologic cardiac hypertrophy. J. Cell. Physiol. 2018, 233, 8850–8861. [Google Scholar] [CrossRef]
- Palomer, X.; Alvarez-Guardia, D.; Rodríguez-Calvo, R.; Coll, T.; Laguna, J.C.; Davidson, M.M. TNF-alpha reduces PGC-1alpha expression through NF-kappaB and p38 MAPK leading to increased glucose oxidation in a human cardiac cell model. Cardiovasc. Res. 2009, 81, 703–712. [Google Scholar] [CrossRef] [PubMed]
- Rius-Pérez, S.; Torres-Cuevas, I.; Millán, I.; Ortega, Á.; Pérez, S. PGC-1. Oxid. Med. Cell Longev. 2020, 2020, 1452696. [Google Scholar] [PubMed]
- Eisele, P.S.; Handschin, C. Functional crosstalk of PGC-1 coactivators and inflammation in skeletal muscle pathophysiology. Semin. Immunopathol. 2013, 36, 27–53. [Google Scholar] [CrossRef]
- Yuan, Y.; Pan, S.-S.; Wan, D.-F.; Lu, J.; Huang, Y. H2O2 Signaling-Triggered PI3K Mediates Mitochondrial Protection to Participate in Early Cardioprotection by Exercise Preconditioning. Oxid. Med. Cell. Longev. 2018, 2018, 1–16. [Google Scholar] [CrossRef]
- Campos, J.C.; Queliconi, B.B.; Bozi, L.H.M.; Bechara, L.R.G.; Dourado, P.M.M.; Andres, A.M.; Jannig, P.R.; Gomes, K.M.S.; Zambelli, V.O.; Rocha-Resende, C.; et al. Exercise reestablishes autophagic flux and mitochondrial quality control in heart failure. Autophagy 2017, 13, 1304–1317. [Google Scholar] [CrossRef]
- Sun, M.; Chen, M.; Liu, Y.; Fukuoka, M.; Zhou, K.; Li, G.; Dawood, F.; Gramolini, A.; Li, X. Cathepsin-L contributes to cardiac repair and remodelling post-infarction. Cardiovasc. Res. 2010, 89, 374–383. [Google Scholar] [CrossRef] [PubMed]
- Tanaka, Y.; Guhde, G.; Suter, A.; Eskelinen, E.-L.; Hartmann, D.H.; Lüllmann-Rauch, R.; Janssen, P.M.L.; Blanz, J.; Von Figura, K.; Saftig, P. Accumulation of autophagic vacuoles and cardiomyopathy in LAMP-2-deficient mice. Nat. Cell Biol. 2000, 406, 902–906. [Google Scholar] [CrossRef]
- Kristensen, C.M.; Olsen, M.A.; Jessen, H.; Brandt, N.; Meldgaard, J.N.; Pilegaard, H. PGC-1α in exercise and fasting-induced regulation of hepatic UPR in mice. Pflügers Arch. 2018, 470, 1431–1447. [Google Scholar] [CrossRef]
- Kwon, I.; Song, W.; Jang, Y.; Choi, M.D.; Vinci, D.M.; Lee, Y. Elevation of hepatic autophagy and antioxidative capacity by endurance exercise is associated with suppression of apoptosis in mice. Ann. Hepatol. 2020, 19, 69–78. [Google Scholar] [CrossRef]
- Pinto, A.P.; Da Rocha, A.L.; Cabrera, E.M.; Marafon, B.B.; Kohama, E.B.; Rovina, R.L.; Simabuco, F.M.; Junior, C.R.B.; De Moura, L.P.; Pauli, J.R.; et al. Role of interleukin-6 in inhibiting hepatic autophagy markers in exercised mice. Cytokine 2020, 130, 155085. [Google Scholar] [CrossRef]
- Wyczalkowska-Tomasik, A.; Czarkowska-Pączek, B.; Piekarczyk-Persa, J.; Zendzian-Piotrowska, M. One session of exercise regulates cathepsin B activity in the livers of trained and untrained rats. J. Physiol. Pharmacol. Off. J. Pol. Physiol. Soc. 2017, 68, 715–720. [Google Scholar]
- Santos-Alves, E.; Marques-Aleixo, I.; Rizo-Roca, D.; Torrella, J.; Oliveira, P.J.; Magalhães, J.; Ascensão, A. Exercise modulates liver cellular and mitochondrial proteins related to quality control signaling. Life Sci. 2015, 135, 124–130. [Google Scholar] [CrossRef] [PubMed]
- Rodríguez, A.; Duran, A.; Selloum, M.; Champy, M.-F.; Diez-Guerra, F.J.; Flores, J.M.; Serrano, M.; Auwerx, J.; Diaz-Meco, M.T.; Moscat, J. Mature-onset obesity and insulin resistance in mice deficient in the signaling adapter p62. Cell Metab. 2006, 3, 211–222. [Google Scholar] [CrossRef] [PubMed]
- Komatsu, M.; Waguri, S.; Koike, M.; Sou, Y.-S.; Ueno, T.; Hara, T.; Mizushima, N.; Iwata, J.-I.; Ezaki, J.; Murata, S.; et al. Homeostatic Levels of p62 Control Cytoplasmic Inclusion Body Formation in Autophagy-Deficient Mice. Cell 2007, 131, 1149–1163. [Google Scholar] [CrossRef] [PubMed]
- Wang, H.; Sharma, N.; Arias, E.B.; Cartee, G.D. Insulin Signaling and Glucose Uptake in the Soleus Muscle of 30-Month-Old Rats After Calorie Restriction With or Without Acute Exercise. J. Gerontol. Ser. A Boil. Sci. Med. Sci. 2015, 71, 323–332. [Google Scholar] [CrossRef] [PubMed]
- Pereira, B.C.; Filho, L.A.L.; Alves, G.F.; Pauli, J.R.; Ropelle, E.R.; Souza, C.T.; Cintra, D.E.; Saad, M.J.A.; Da Silva, A.S.R. A new overtraining protocol for mice based on downhill running sessions. Clin. Exp. Pharmacol. Physiol. 2012, 39, 793–798. [Google Scholar] [CrossRef]
- Dubois, M.; Gilles, K.A.; Hamilton, J.K.; Rebers, P.T.; Smith, F. Colorimetric method for determination of sugar and related substances. Anal. Chem. 1956, 28, 350–356. [Google Scholar] [CrossRef]
- Ju, J.-S.; Varadhachary, A.S.; Miller, S.E.; Weihl, C.C. Quantitation of “autophagic flux” in mature skeletal muscle. Autophagy 2010, 6, 929–935. [Google Scholar] [CrossRef]
- Carter, H.N.; Kim, Y.; Erlich, A.T.; Zarrin-Khat, D.; Hood, D.A. Autophagy and mitophagy flux in young and aged skeletal muscle following chronic contractile activity. J. Physiol. 2018, 596, 3567–3584. [Google Scholar] [CrossRef]
- Rocchi, A.; He, C. Activating Autophagy by Aerobic Exercise in Mice. J. Vis. Exp. 2017, 2017, e55099. [Google Scholar] [CrossRef]
- Kim, Y.; Triolo, M.; Erlich, A.T.; Hood, D.A. Regulation of autophagic and mitophagic flux during chronic contractile activity-induced muscle adaptations. Pflügers Arch. 2019, 471, 431–440. [Google Scholar] [CrossRef] [PubMed]
- Oliveira, L.D.C.; de Morais, G.P.; da Rocha, A.L.; Teixeira, G.R.; Pinto, A.P.; de Vicente, L.G. Excessive treadmill training enhances the insulin signaling pathway and glycogen deposition in mice hearts. J. Cell. Biochem. 2019, 120, 1304–1317. [Google Scholar] [CrossRef] [PubMed]
- Sander, H.; Wallace, S.; Plouse, R.; Tiwari, S.; Gomes, A.V. Ponceau S waste: Ponceau S staining for total protein normalization. Anal. Biochem. 2019, 575, 44–53. [Google Scholar] [CrossRef] [PubMed]


| Parameters | CT | END | ET | ST | CC |
|---|---|---|---|---|---|
| Body weight (g) | 23.3 ± 0.5 | 22.9 ± 0.4 | 22.7 ± 0.8 | 23.6 ± 0.5 | 21.7 ± 0.43 |
| Basal glucose (mg/dL) | 157.4 ± 5.5 | 164.4 ± 5.6 | 193.8 ± 3.2 | 173.6 ± 7.9 | 154.6 ± 6.1 |
| Post-exercise glucose (mg/dL) | - | 147.8 ± 24.1 | 109.6 ± 12.2 a | 187.2 ± 12.3 | 126.0 ± 10.4 a |
| Delta variation (%) | - | 10.7 ± 12.79 | −43.3 ± 6.6 | −9.4 ± 10.1 b | −18.6 ± 5.3 |
| Gene | Forward | Reverse |
|---|---|---|
| Prkaa1 | CCAGGTCATCAGTACACCATCT | TTTCCTTTTCGTCCAACCTTCC |
| Ppargc1a | GAGTTGAAAAAGCTTGACTGGC | CAGCACACTCTATGTCACTCCA |
| Mtor | CCACGTGGTTAGCCAGACT | TAGCGGATATCAGGGTCAGGA |
| Ulk1 | AACATCCGAGTCAAGATTGCTG | ATAATGACCTCAGGAGCCATGT |
| Becn1 | AGGAACTCACAGCTCCATTACT | CTCTCCTGAGTTAGCCTCTTCC |
| Atg5 | GCTTTTGCCAAGAGTCAGCTAT | AACCAATTGGATAATGCCATTTCAG |
| Map1lc3b | AGATAATCAGACGGCGCTTG | TCGTACACTTCGGAGATGGG |
| Sqstm1 | ACAGCCAGAGGAACAGATGG | GTAGAGACTGGAGTTCACCTGTA |
| Gapdh | AAGAGGGATGCTGCCCTTAC | CGGGACGAGGAAACACTCTC |
Publisher’s Note: MDPI stays neutral with regard to jurisdictional claims in published maps and institutional affiliations. |
© 2021 by the authors. Licensee MDPI, Basel, Switzerland. This article is an open access article distributed under the terms and conditions of the Creative Commons Attribution (CC BY) license (http://creativecommons.org/licenses/by/4.0/).
Share and Cite
Pinto, A.P.; da Rocha, A.L.; Marafon, B.B.; Rovina, R.L.; Muñoz, V.R.; da Silva, L.E.C.M.; Pauli, J.R.; de Moura, L.P.; Cintra, D.E.; Ropelle, E.R.; et al. Impact of Different Physical Exercises on the Expression of Autophagy Markers in Mice. Int. J. Mol. Sci. 2021, 22, 2635. https://doi.org/10.3390/ijms22052635
Pinto AP, da Rocha AL, Marafon BB, Rovina RL, Muñoz VR, da Silva LECM, Pauli JR, de Moura LP, Cintra DE, Ropelle ER, et al. Impact of Different Physical Exercises on the Expression of Autophagy Markers in Mice. International Journal of Molecular Sciences. 2021; 22(5):2635. https://doi.org/10.3390/ijms22052635
Chicago/Turabian StylePinto, Ana P., Alisson L. da Rocha, Bruno B. Marafon, Rafael L. Rovina, Vitor R. Muñoz, Lilian E. C. M. da Silva, José R. Pauli, Leandro P. de Moura, Dennys E. Cintra, Eduardo R. Ropelle, and et al. 2021. "Impact of Different Physical Exercises on the Expression of Autophagy Markers in Mice" International Journal of Molecular Sciences 22, no. 5: 2635. https://doi.org/10.3390/ijms22052635
APA StylePinto, A. P., da Rocha, A. L., Marafon, B. B., Rovina, R. L., Muñoz, V. R., da Silva, L. E. C. M., Pauli, J. R., de Moura, L. P., Cintra, D. E., Ropelle, E. R., & da Silva, A. S. R. (2021). Impact of Different Physical Exercises on the Expression of Autophagy Markers in Mice. International Journal of Molecular Sciences, 22(5), 2635. https://doi.org/10.3390/ijms22052635