
Expression of Interferons Lambda 3 and 4 Induces Identical Response in Human Liver Cell Lines Depending Exclusively on Canonical Signaling

 ,
,  ,
,  ,
,  and
and 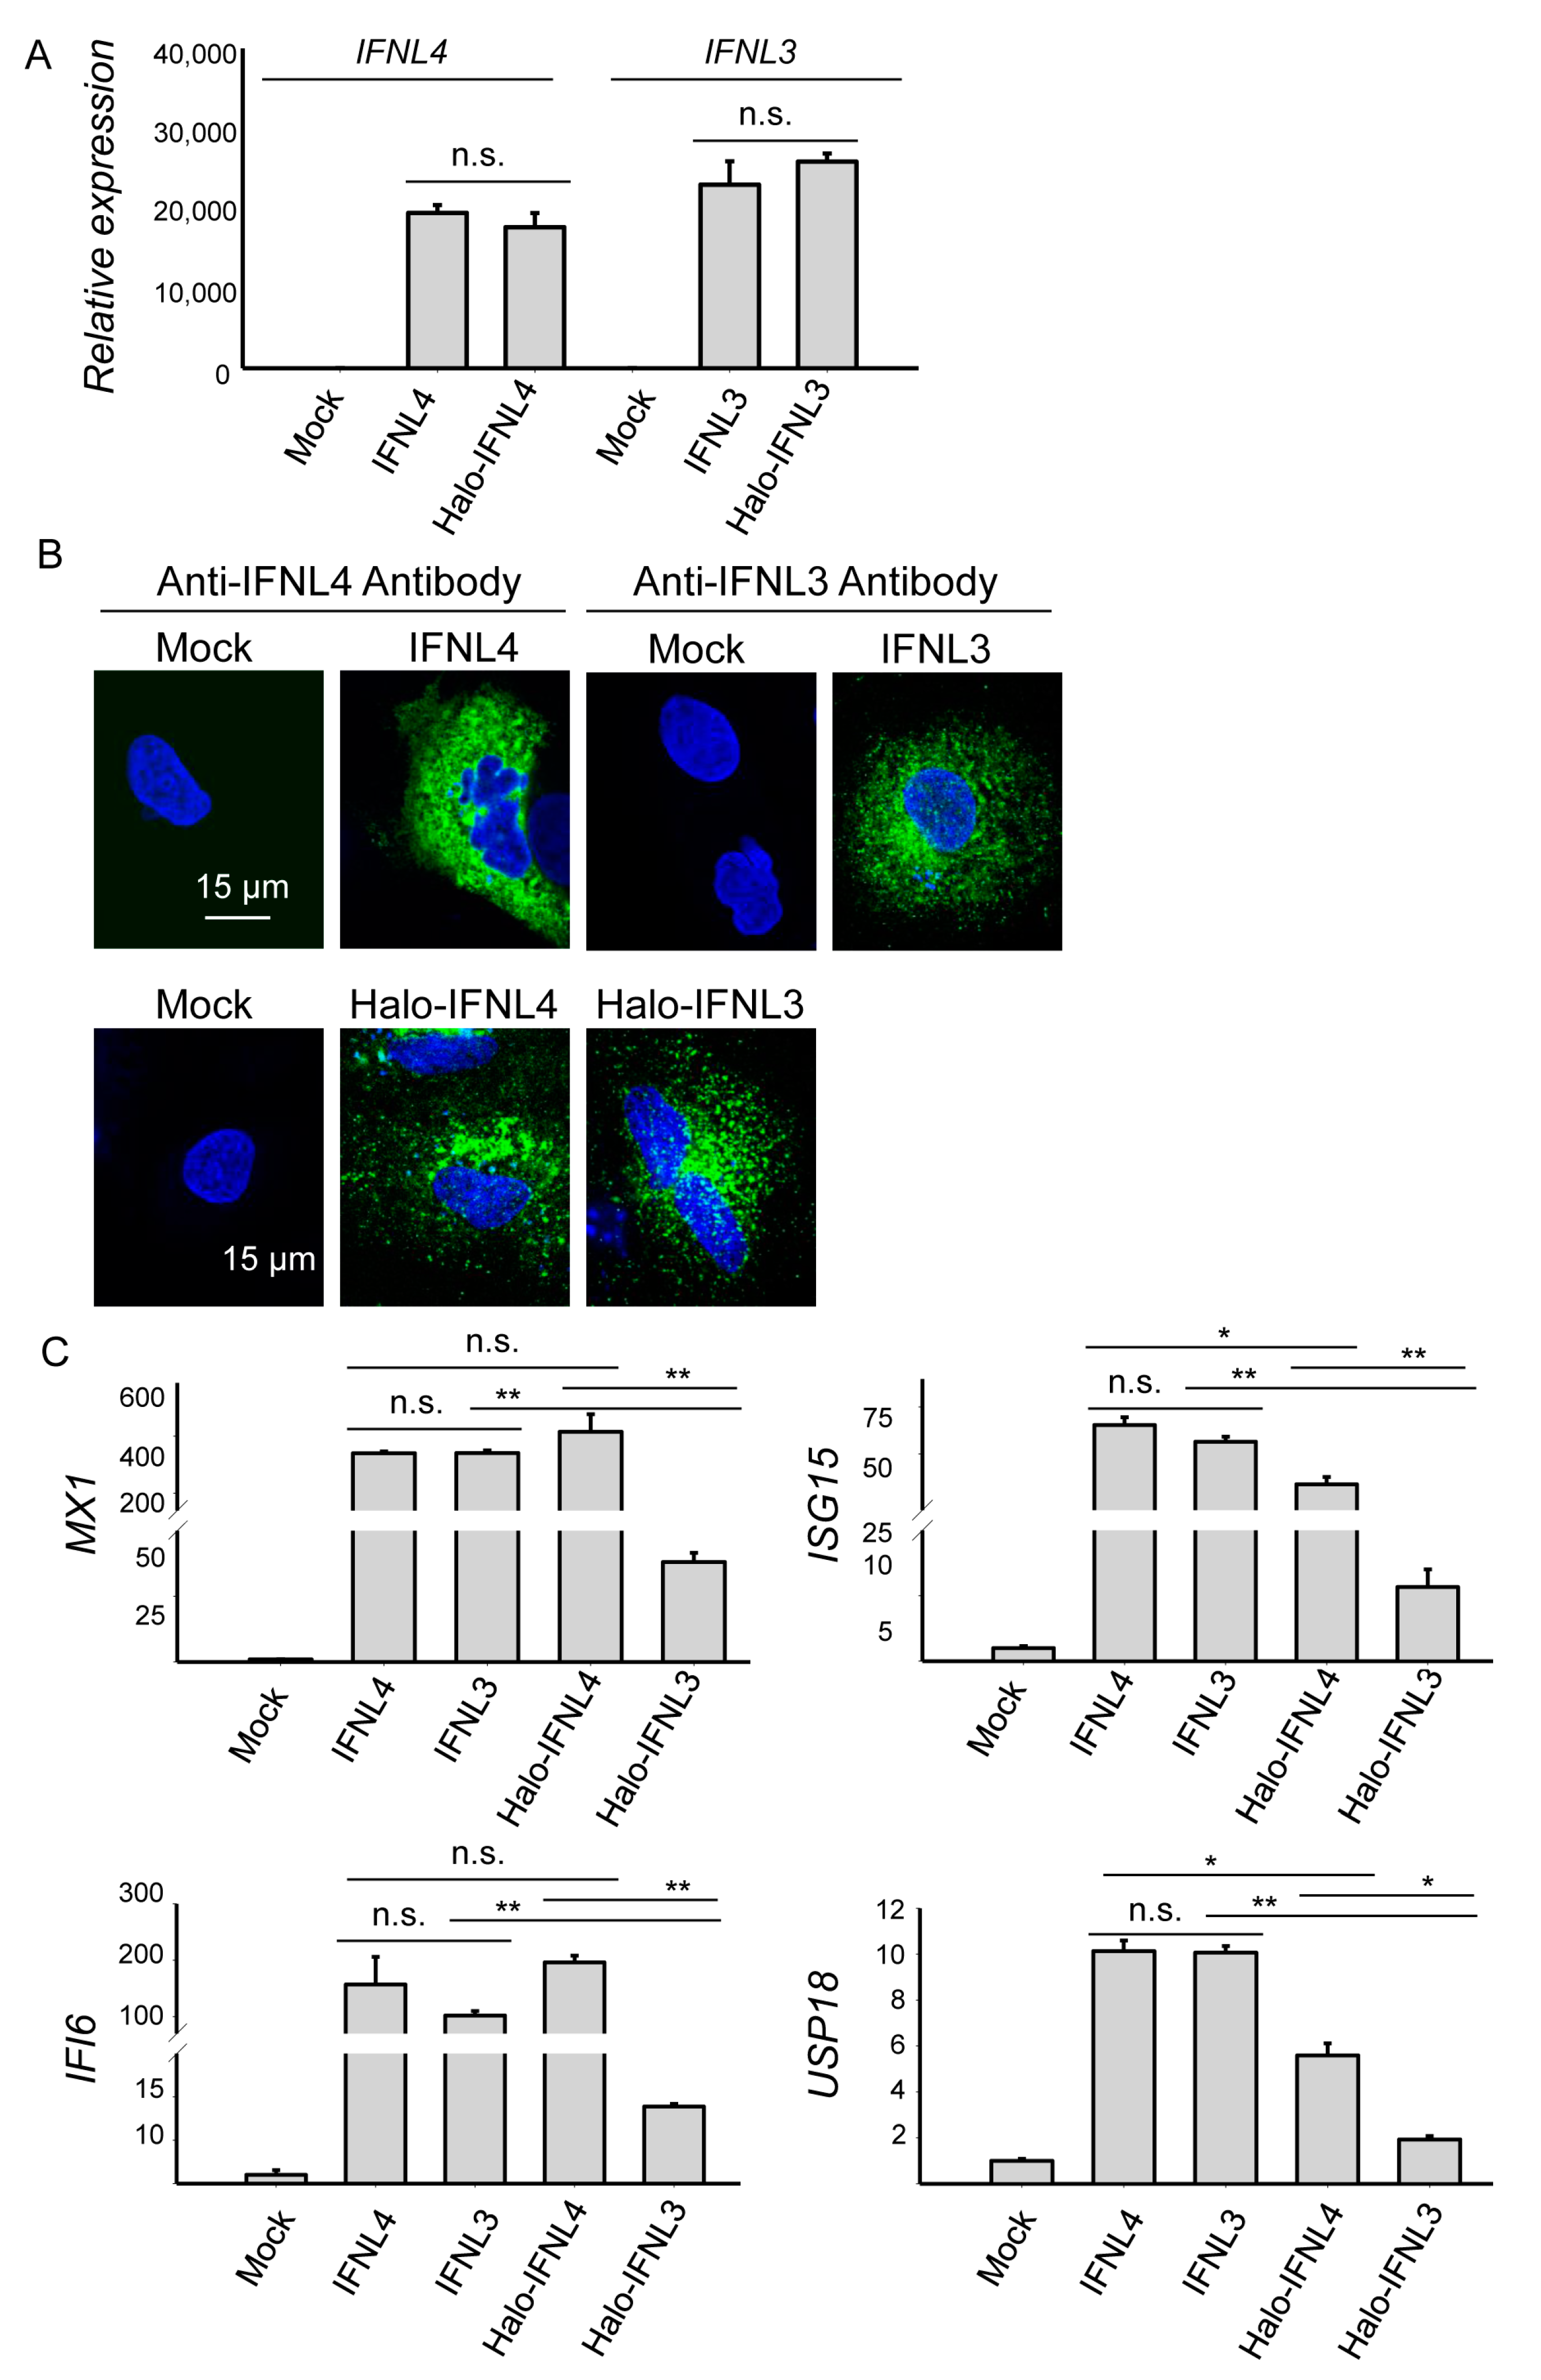
Abstract
1. Introduction
2. Results
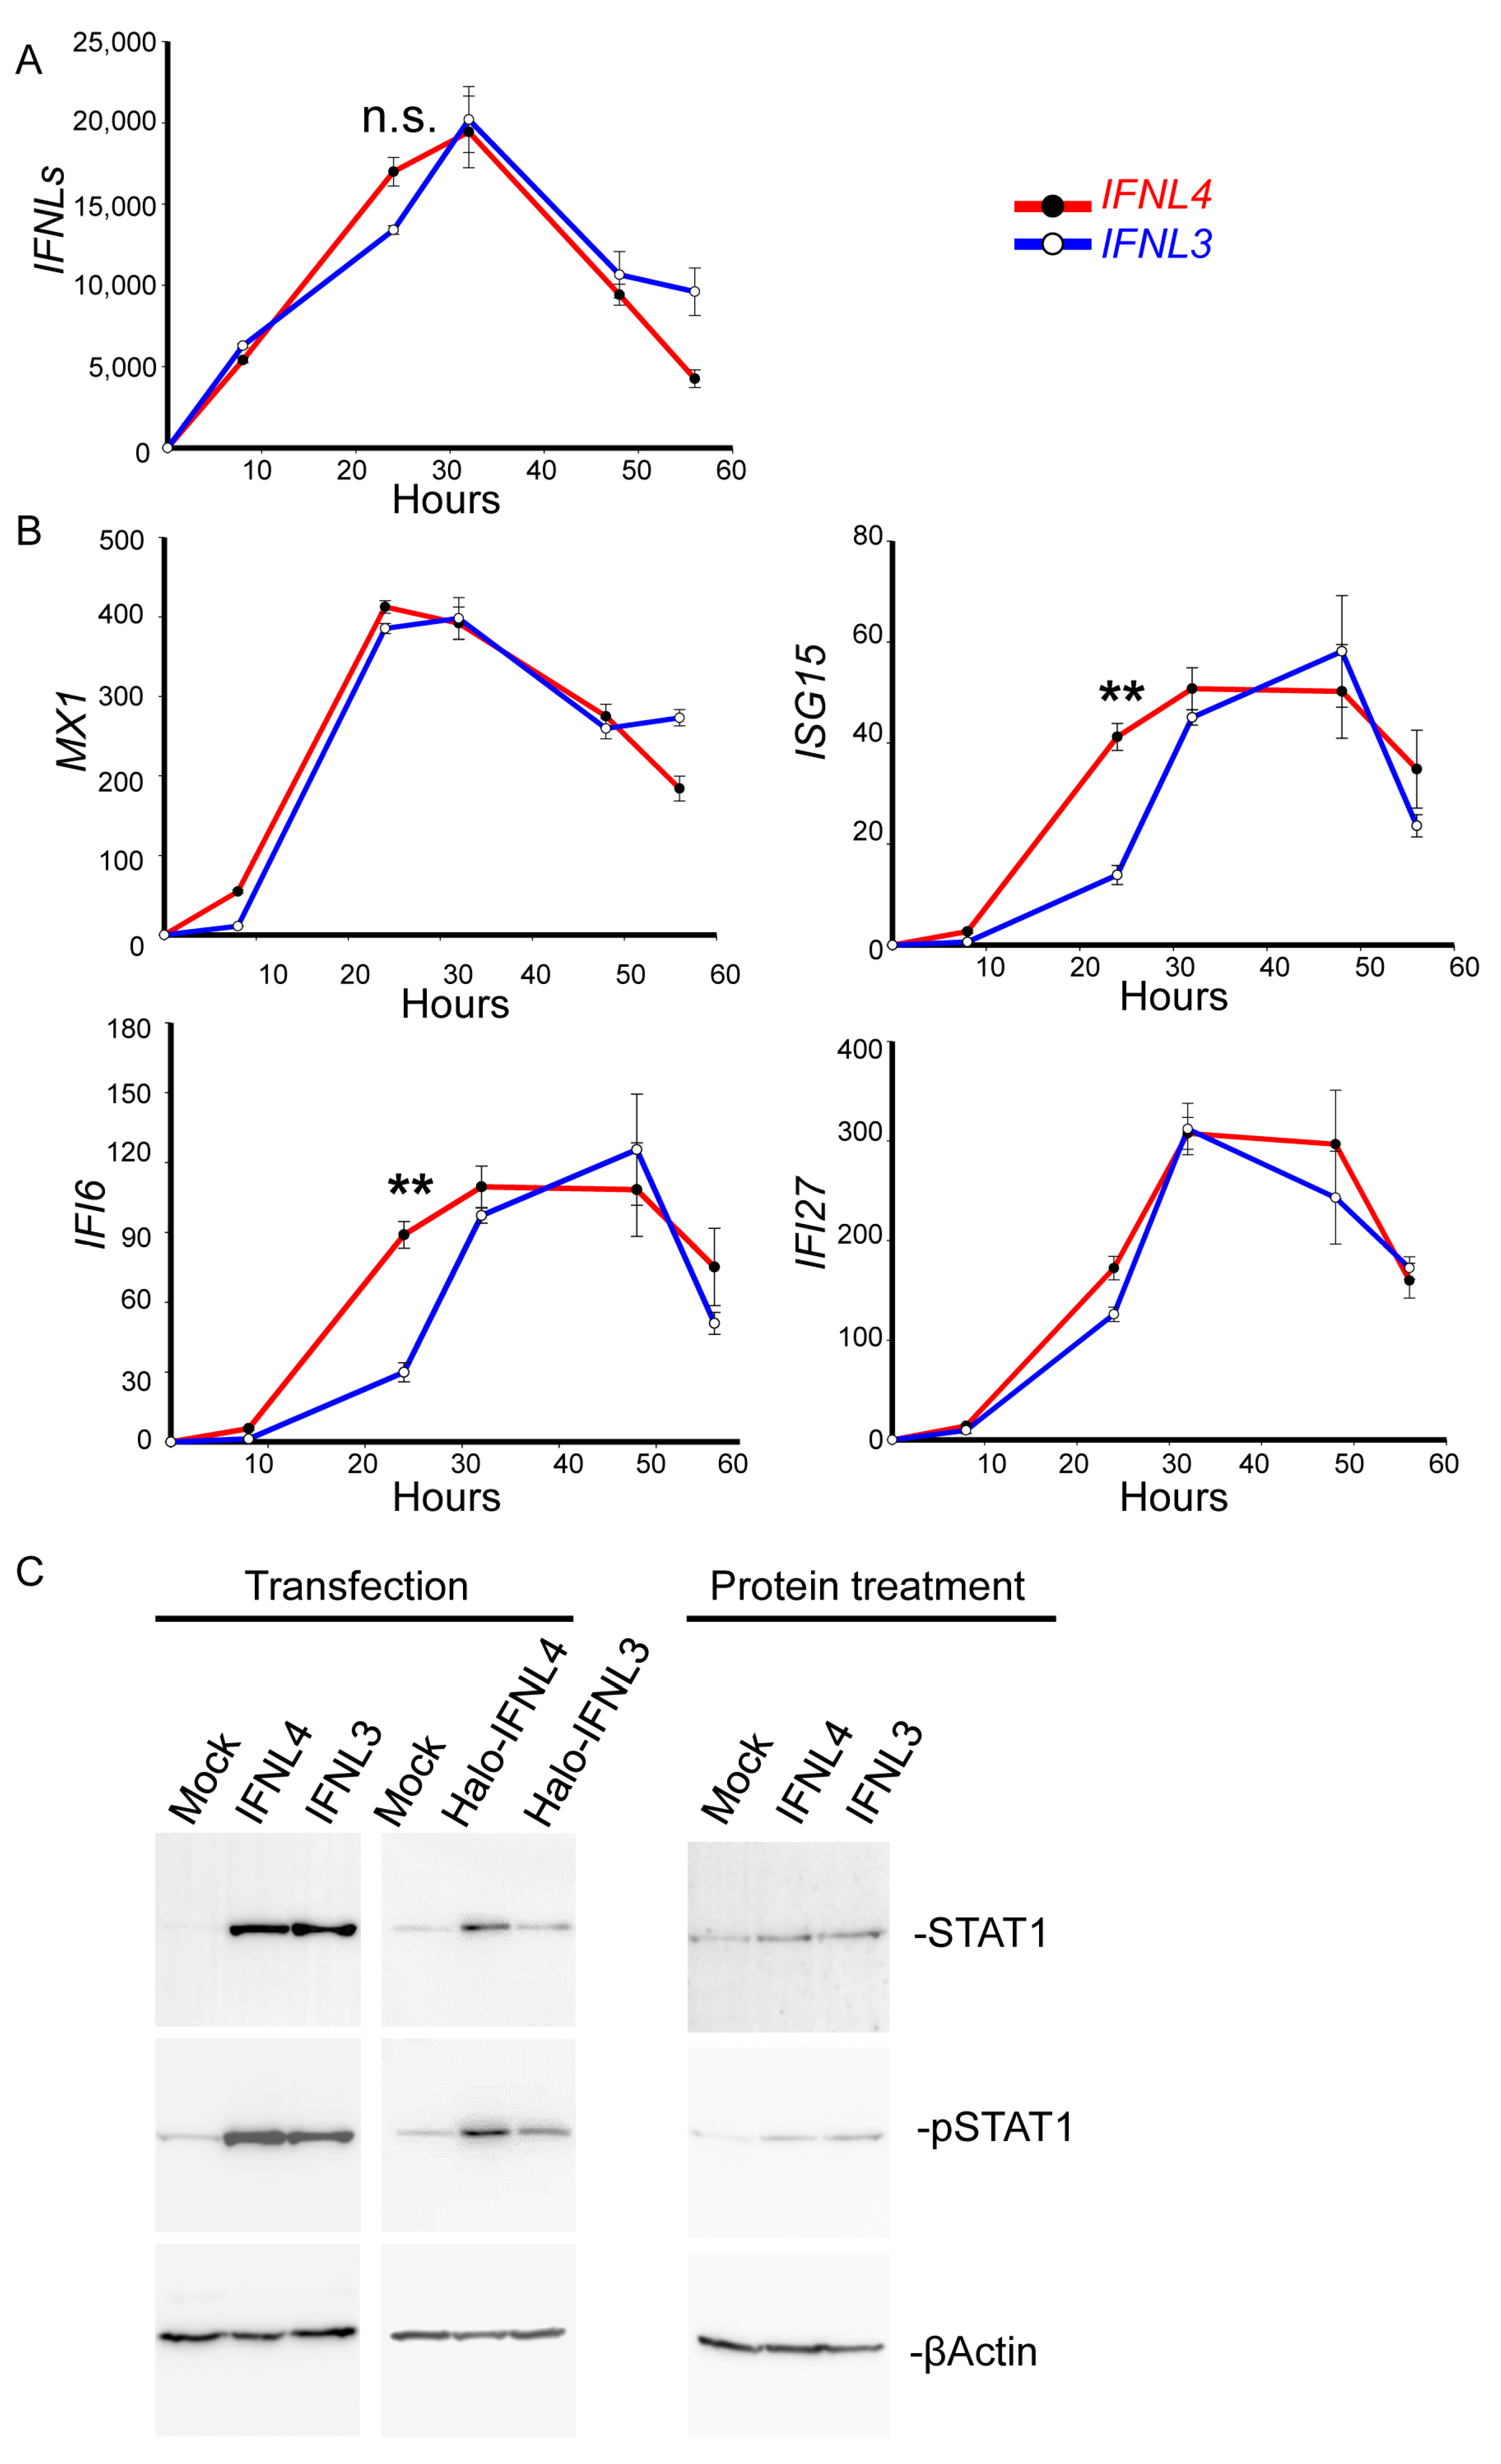
2.1. Transient Transfection with Tagged and Non-tagged IFNL3 and IFNL4 Induced Similar mRNA Levels of Interferons but Different Levels of Interferon-Stimulated Genes
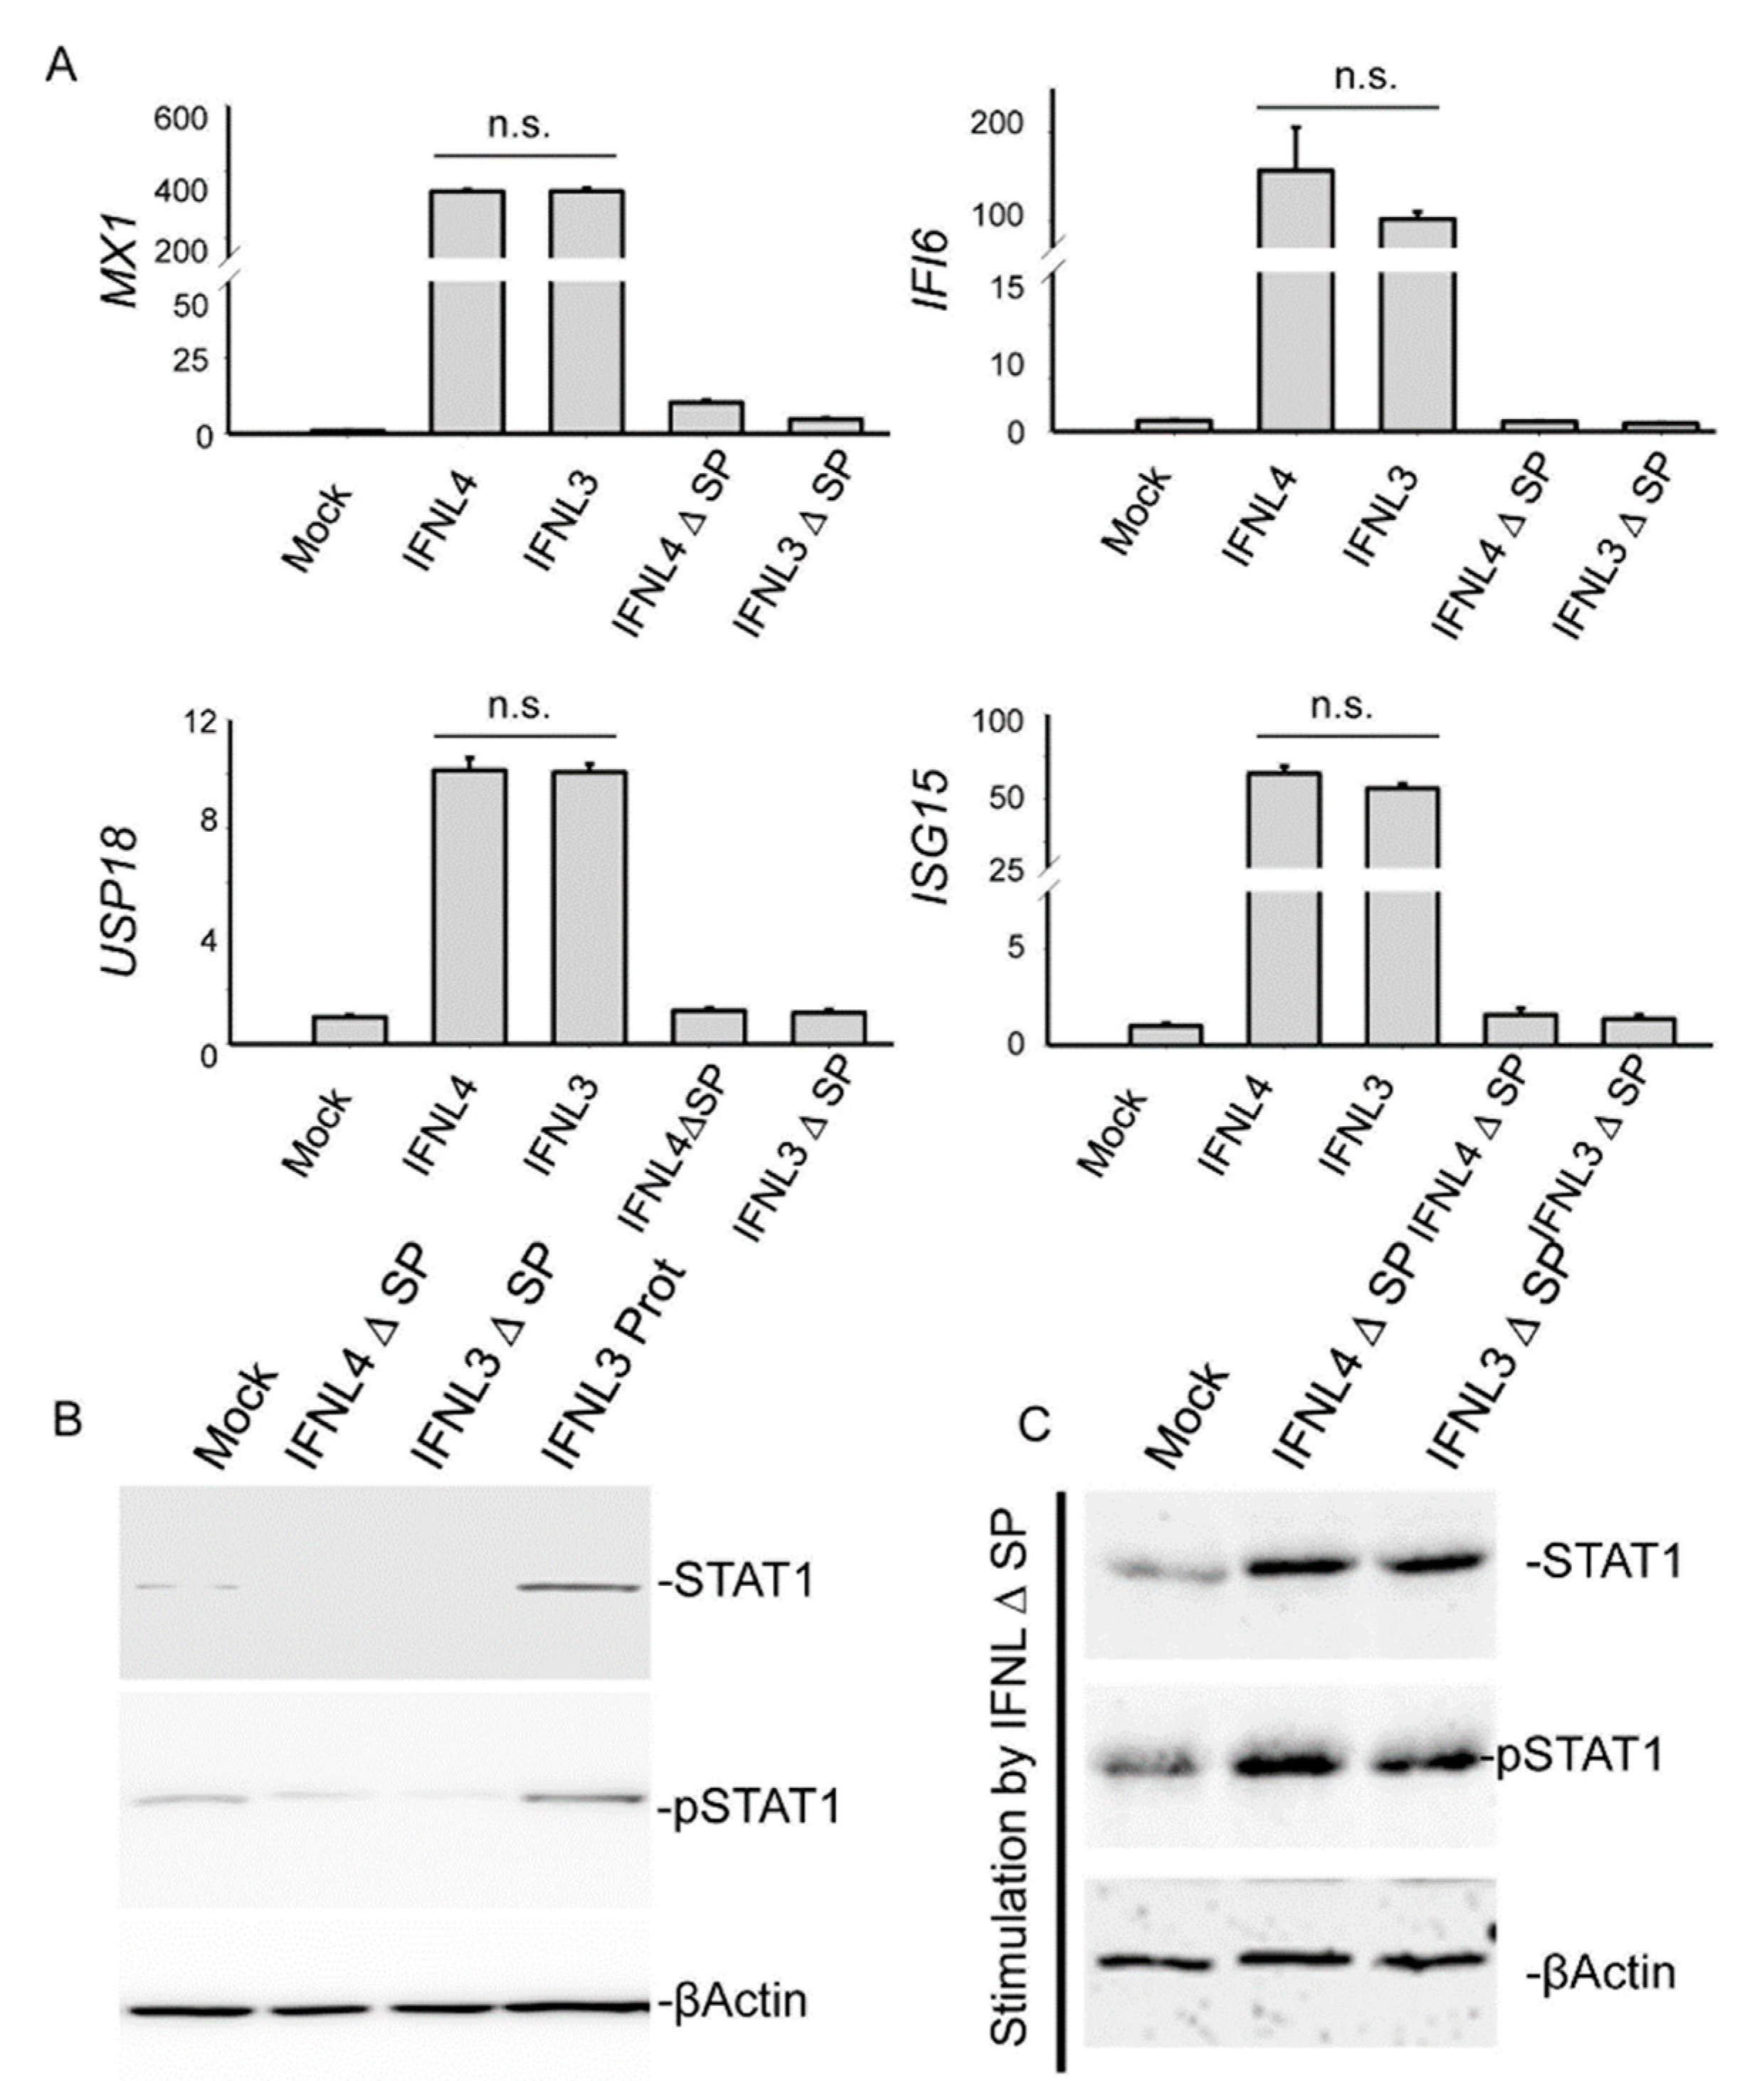
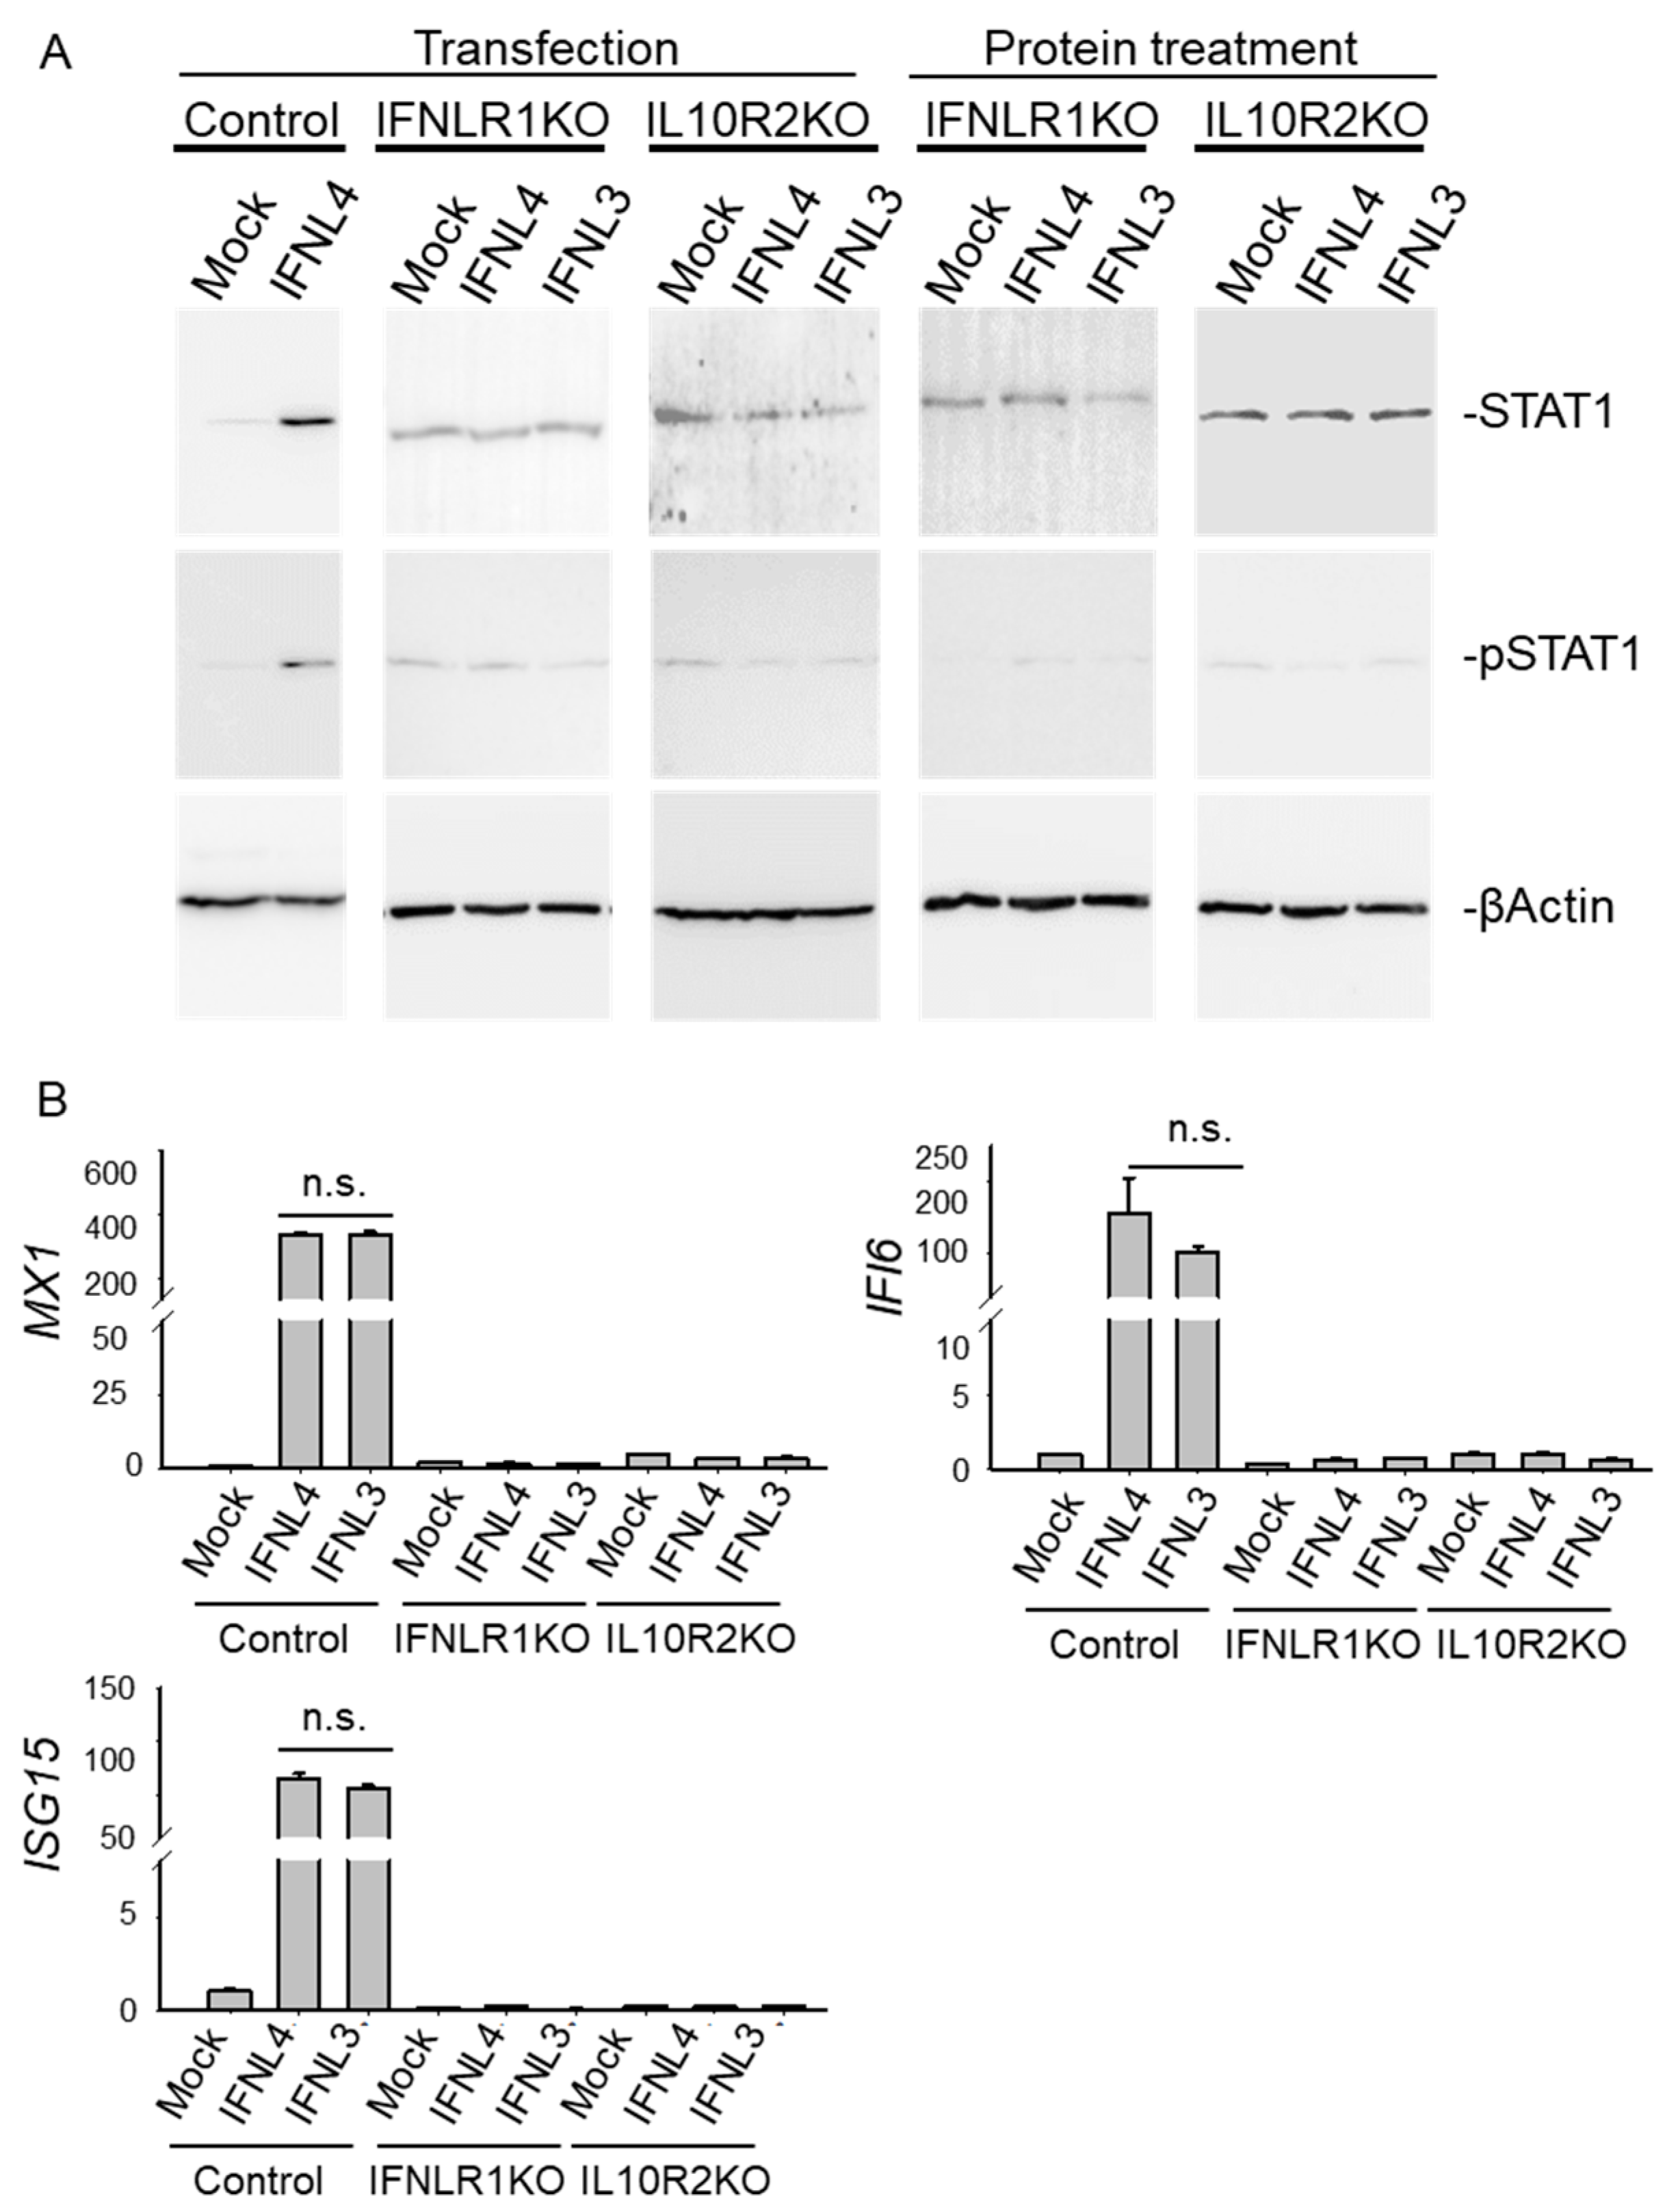
2.2. Cytosolic Expression of IFNL3 or IFNL4 Did Not Modify JAK-STAT Signaling
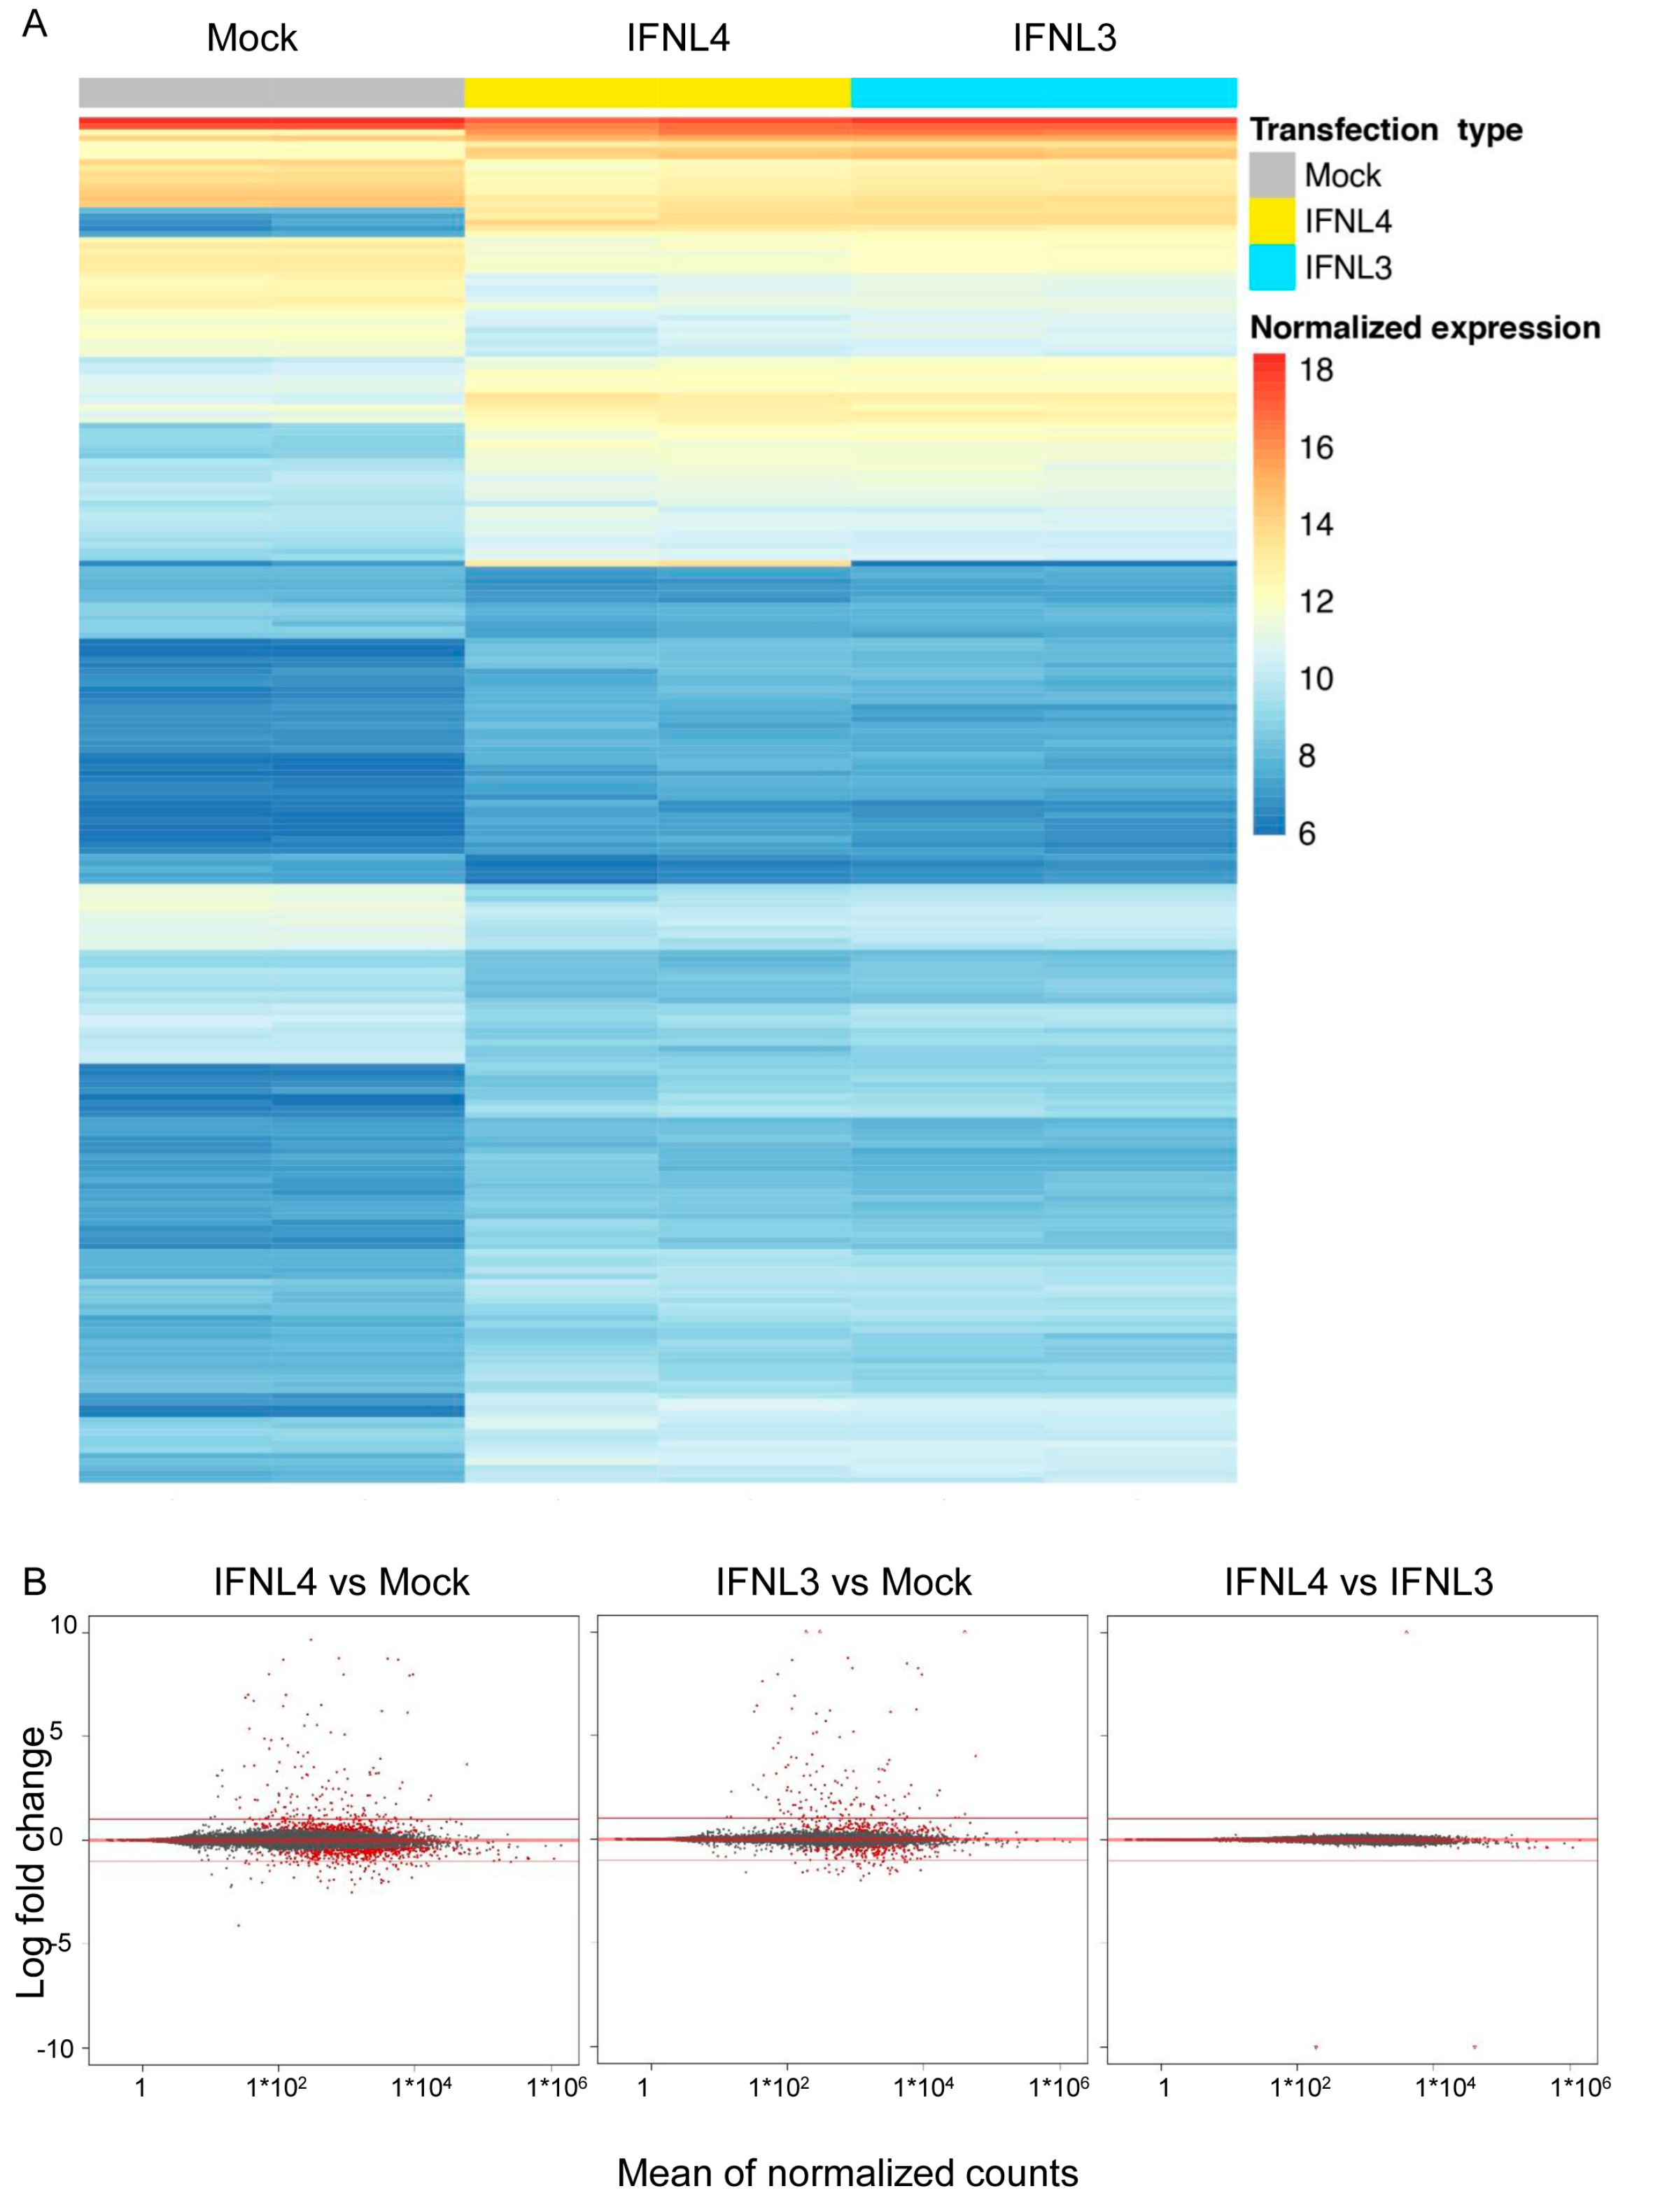
2.3. IFNL3 and IFNL4 Induced Identical Transcriptome Response in Wild Type Cells
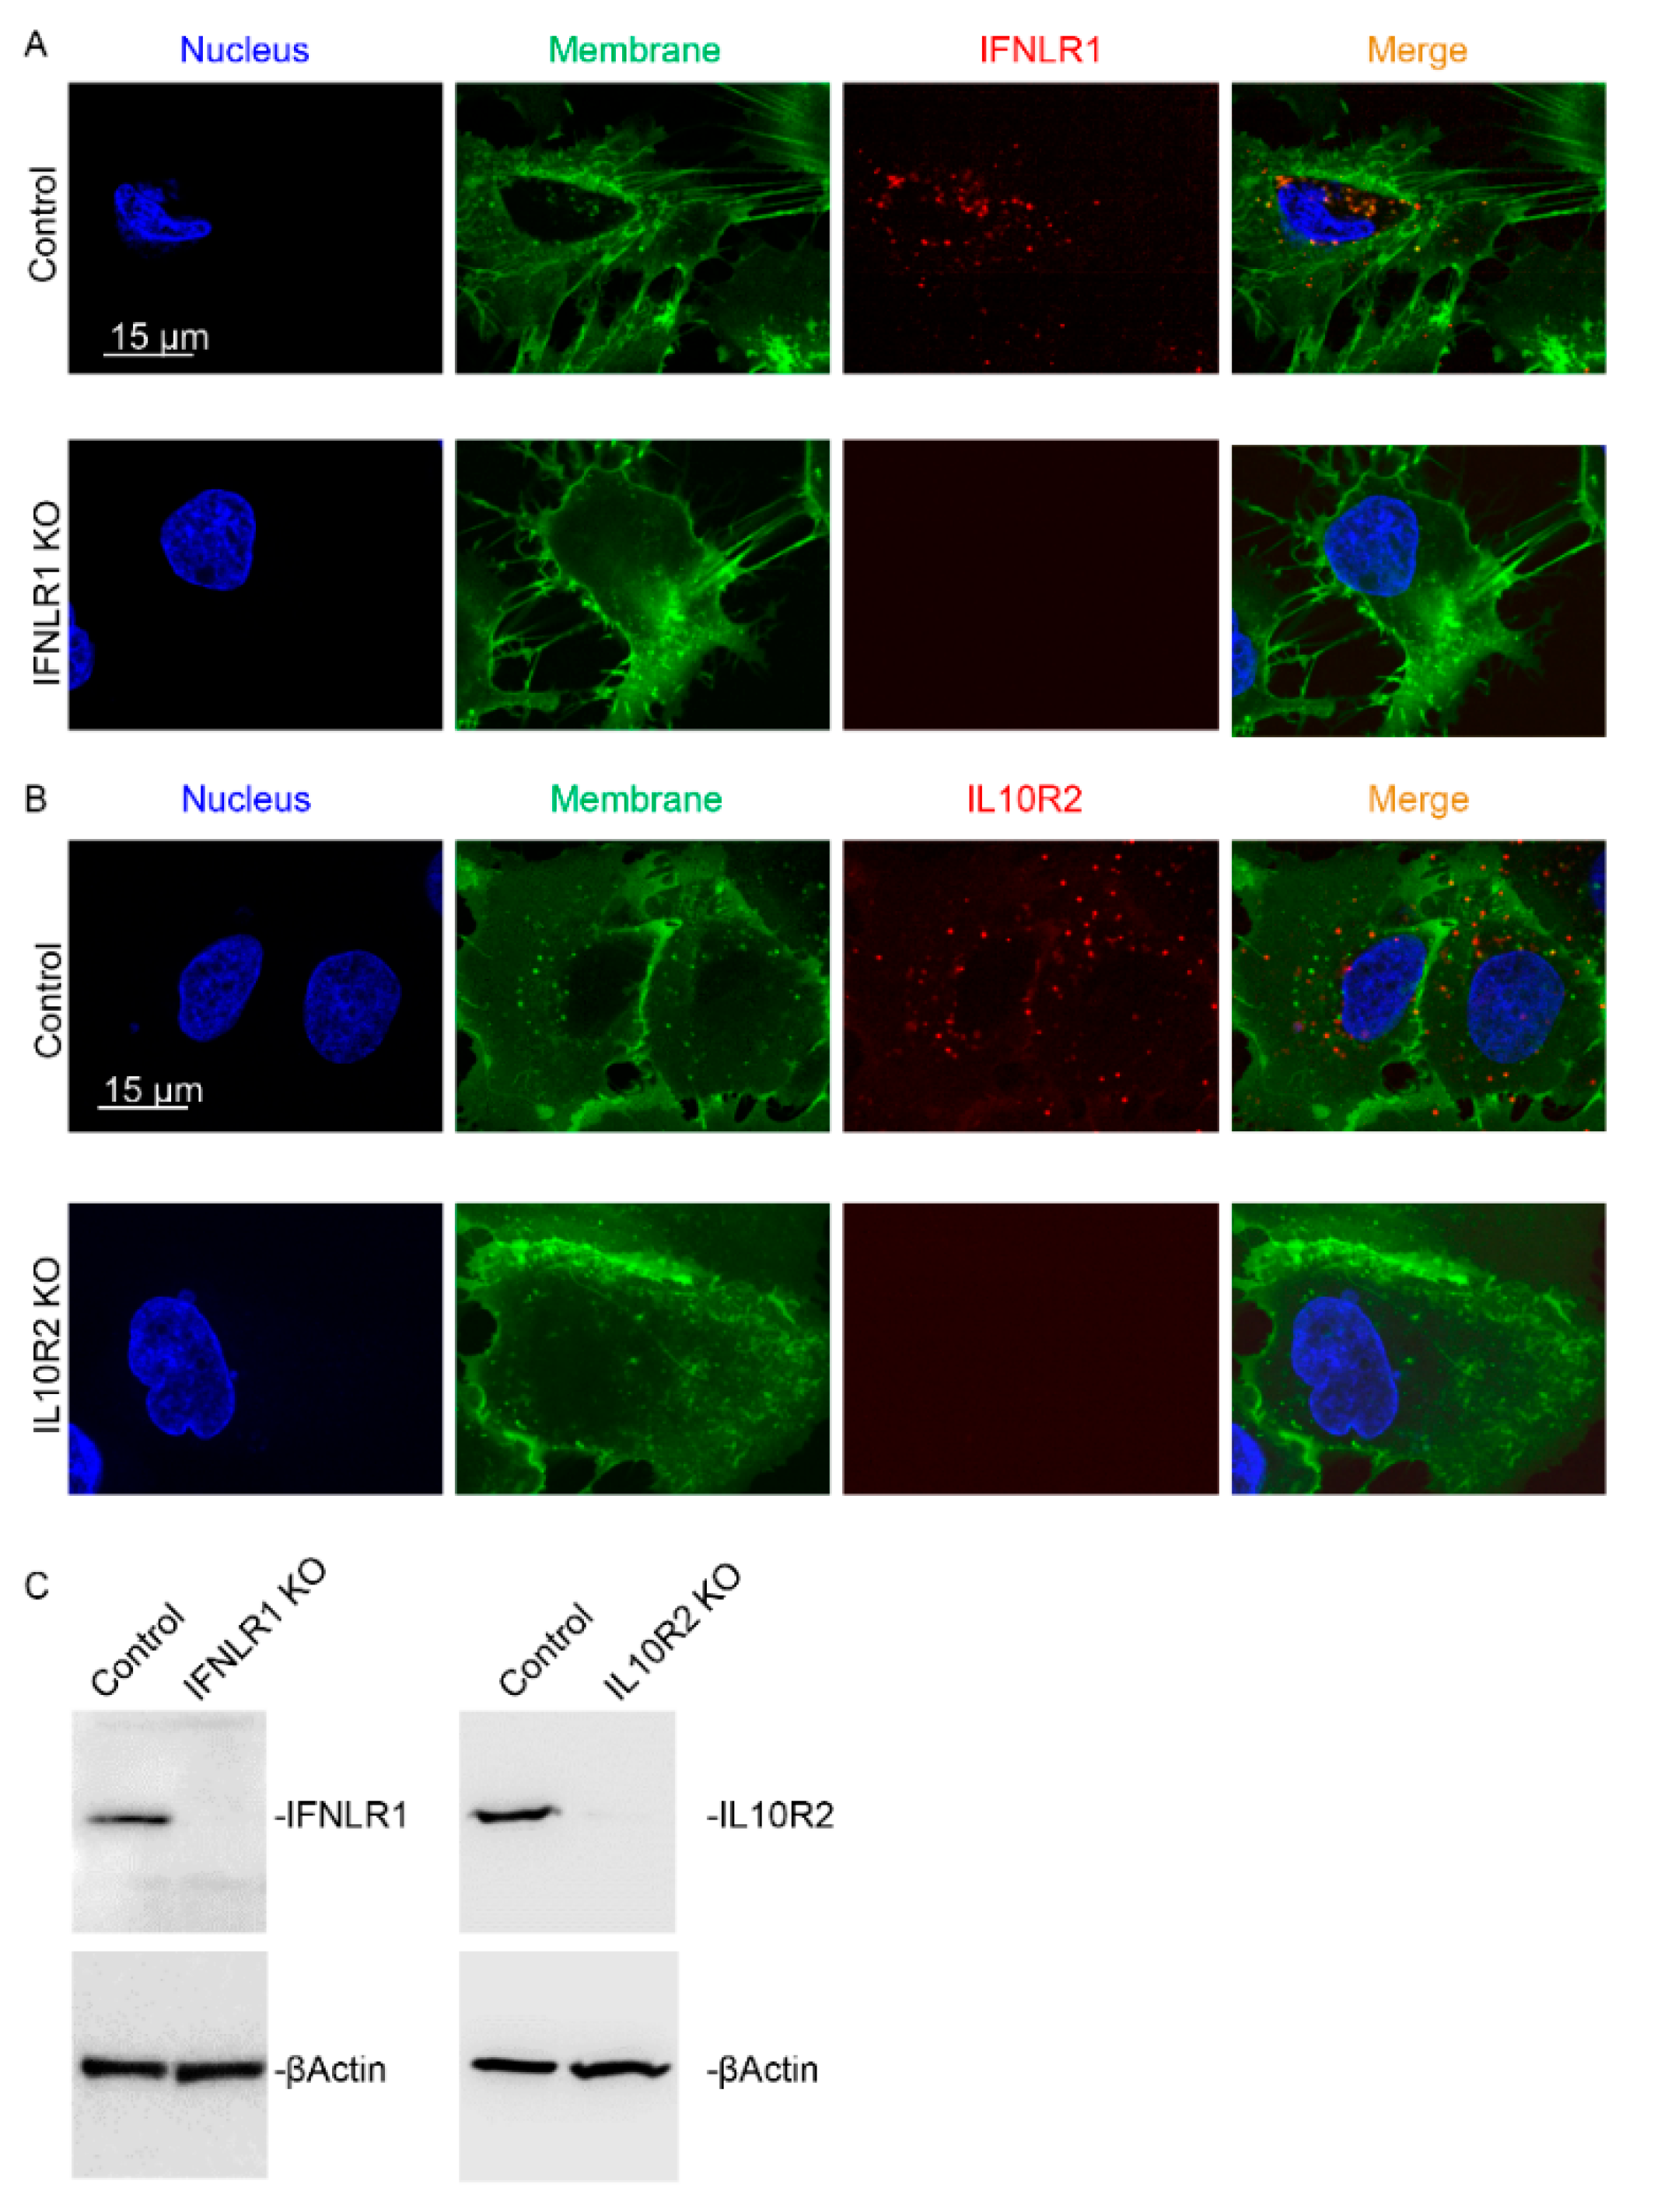
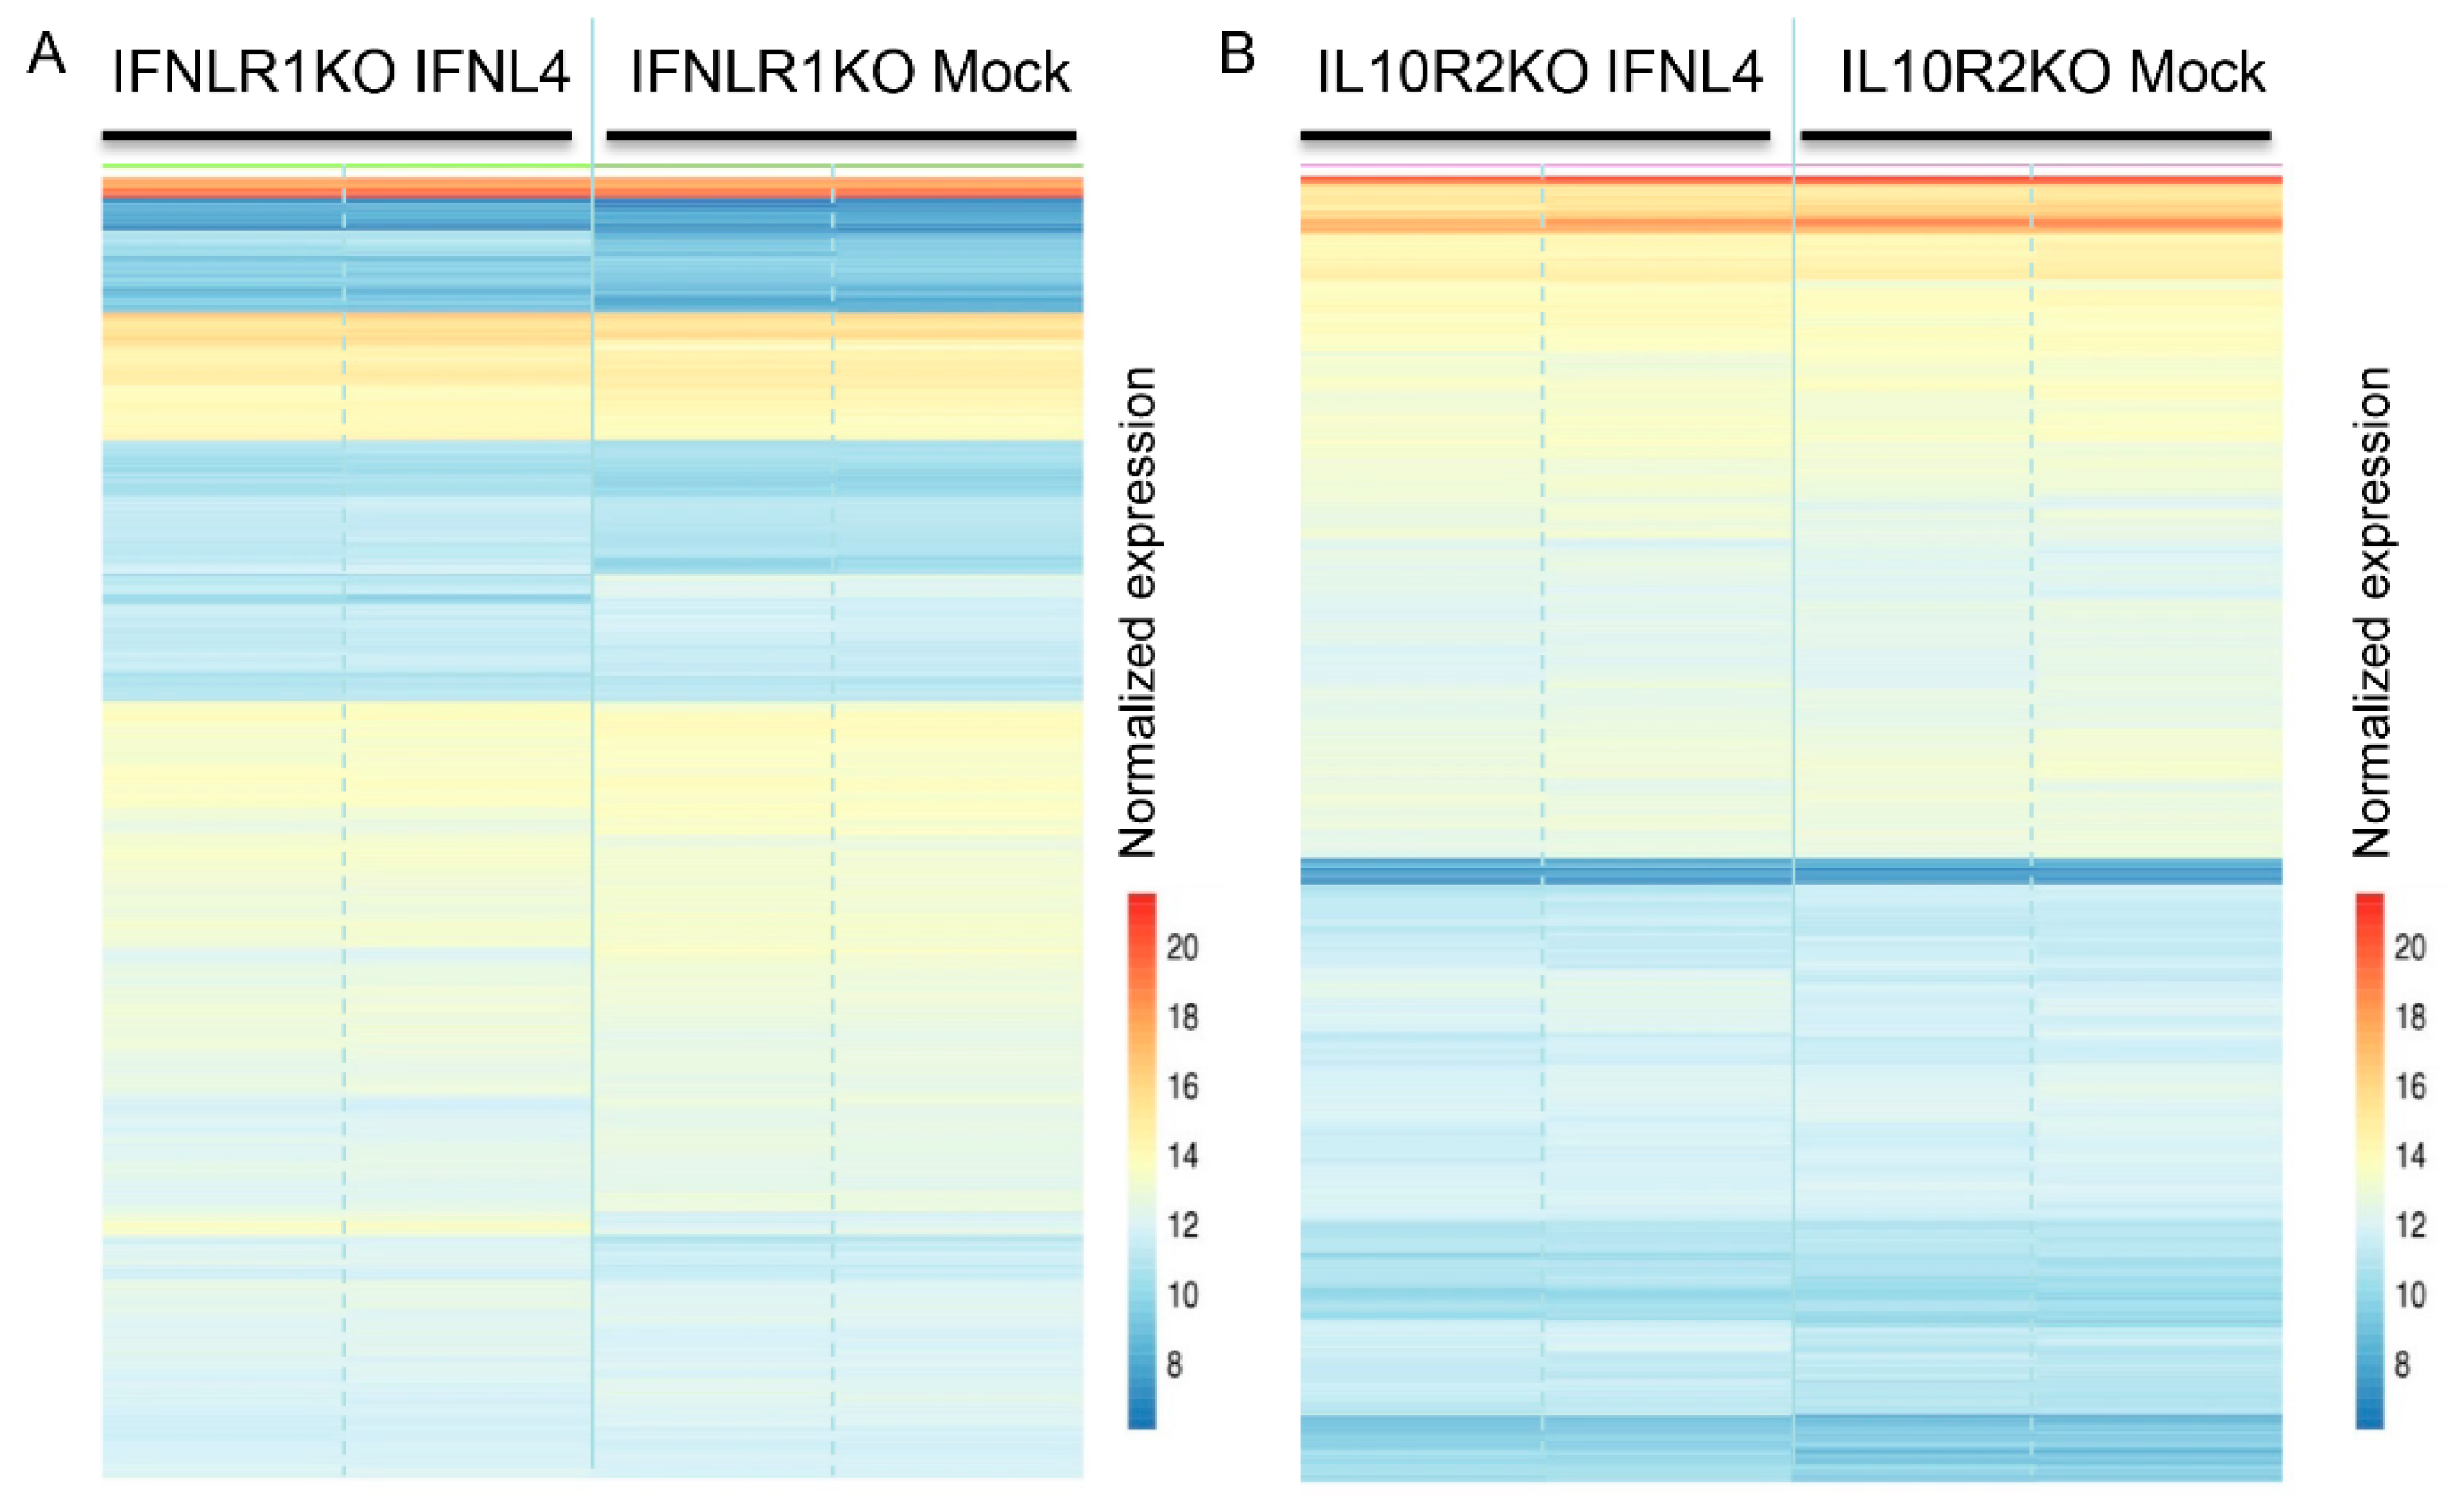
2.4. IFNLR1 and IL10R2 Deficiency Abolished JAK-STAT Signaling by Both IFNL3 and IFNL4
3. Discussion
4. Materials and Methods
4.1. Chemicals and Antibodies
4.2. Cell Culture
4.3. Generation of Knockout Cell Lines
4.4. Expression Constructs
4.5. Transient Transfection
4.6. Interferon Treatment
4.7. Real time PCR Analysis
4.8. RNA Sequencing and Transcriptome Analysis
4.9. Immunoblotting
4.10. Immunofluorescence Studies
4.11. Quantification of IFNLs
4.12. Statistical Analysis
Supplementary Materials
Author Contributions
Funding
Acknowledgments
Conflicts of Interest
Abbreviations
| ISGs | Interferon stimulated genes |
| IFNL3 | Interferons lambda 3 |
| IFNL4 | Interferons lambda 4 |
| IFNLR1 | Interferon lambda receptor 1 |
| IL10R2 | Interleukin 10 receptor 2 |
| JAK1 | Tyrosine-protein kinase JAK1 |
| JAK2 | Tyrosine-protein kinase JAK2 |
| TYK2 | Non-receptor tyrosine-protein kinase TYK2 |
| STAT | Signal transducer and activator of transcription |
| IRF-9 | Interferon regulatory factor 9 |
| ISGF-3 | Interferon Stimulated Gene Factor 3 |
| HCV | Hepatitis C virus |
| MYC | Myc proto-oncogene protein |
| CRISPR | Clustered regularly interspaced short palindromic repeats |
References
- Donnelly, R.P.; Kotenko, S.V. Interferon-lambda: A new addition to an old family. J. Interferon Cytokine Res. 2010, 30, 555–564. [Google Scholar] [CrossRef] [PubMed]
- Kotenko, S.V.; Gallagher, G.; Baurin, V.V.; Lewis-Antes, A.; Shen, M.; Shah, N.K.; Langer, J.A.; Sheikh, F.; Dickensheets, H.; Donnelly, R.P. IFN-lambdas mediate antiviral protection through a distinct class II cytokine receptor complex. Nat. Immunol. 2003, 4, 69–77. [Google Scholar] [CrossRef] [PubMed]
- Sheppard, P.; Kindsvogel, W.; Xu, W.; Henderson, K.; Schlutsmeyer, S.; Whitmore, T.E.; Kuestner, R.; Garrigues, U.; Birks, C.; Roraback, J.; et al. IL-28, IL-29 and their class II cytokine receptor IL-28R. Nat. Immunol. 2003, 4, 63–68. [Google Scholar] [CrossRef] [PubMed]
- Sommereyns, C.; Paul, S.; Staeheli, P.; Michiels, T. IFN-lambda (IFN-lambda) is expressed in a tissue-dependent fashion and primarily acts on epithelial cells in vivo. PLoS Pathog. 2008, 4, e1000017. [Google Scholar] [CrossRef] [PubMed]
- Mordstein, M.; Neugebauer, E.; Ditt, V.; Jessen, B.; Rieger, T.; Falcone, V.; Sorgeloos, F.; Ehl, S.; Mayer, D.; Kochs, G.; et al. Lambda interferon renders epithelial cells of the respiratory and gastrointestinal tracts resistant to viral infections. J. Virol. 2010, 84, 5670–5677. [Google Scholar] [CrossRef]
- Ge, D.; Fellay, J.; Thompson, A.J.; Simon, J.S.; Shianna, K.V.; Urban, T.J.; Heinzen, E.L.; Qiu, P.; Bertelsen, A.H.; Muir, A.J.; et al. Genetic variation in IL28B predicts hepatitis C treatment-induced viral clearance. Nature 2009, 461, 399–401. [Google Scholar] [CrossRef]
- Suppiah, V.; Moldovan, M.; Ahlenstiel, G.; Berg, T.; Weltman, M.; Abate, M.L.; Bassendine, M.; Spengler, U.; Dore, G.J.; Powell, E.; et al. IL28B is associated with response to chronic hepatitis C interferon-alpha and ribavirin therapy. Nat. Genet. 2009, 41, 1100–1104. [Google Scholar] [CrossRef]
- Tanaka, Y.; Nishida, N.; Sugiyama, M.; Kurosaki, M.; Matsuura, K.; Sakamoto, N.; Nakagawa, M.; Korenaga, M.; Hino, K.; Hige, S.; et al. Genome-wide association of IL28B with response to pegylated interferon-alpha and ribavirin therapy for chronic hepatitis C. Nat. Genet. 2009, 41, 1105–1109. [Google Scholar] [CrossRef]
- Thomas, D.L.; Thio, C.L.; Martin, M.P.; Qi, Y.; Ge, D.; O’Huigin, C.; Kidd, J.; Kidd, K.; Khakoo, S.I.; Alexander, G.; et al. Genetic variation in IL28B and spontaneous clearance of hepatitis C virus. Nature 2009, 461, 798–801. [Google Scholar] [CrossRef] [PubMed]
- Prokunina-Olsson, L.; Muchmore, B.; Tang, W.; Pfeiffer, R.M.; Park, H.; Dickensheets, H.; Hergott, D.; Porter-Gill, P.; Mumy, A.; Kohaar, I.; et al. A variant upstream of IFNL3 (IL28B) creating a new interferon gene IFNL4 is associated with impaired clearance of hepatitis C virus. Nat. Genet. 2013, 45, 164–171. [Google Scholar] [CrossRef]
- Honda, M.; Sakai, A.; Yamashita, T.; Nakamoto, Y.; Mizukoshi, E.; Sakai, Y.; Yamashita, T.; Nakamura, M.; Shirasaki, T.; Horimoto, K.; et al. Hepatic ISG expression is associated with genetic variation in interleukin 28B and the outcome of IFN therapy for chronic hepatitis C. Gastroenterology 2010, 139, 499–509. [Google Scholar] [CrossRef] [PubMed]
- Urban, T.J.; Thompson, A.J.; Bradrick, S.S.; Fellay, J.; Schuppan, D.; Cronin, K.D.; Hong, L.; McKenzie, A.; Patel, K.; Shianna, K.V.; et al. IL28B genotype is associated with differential expression of intrahepatic interferon-stimulated genes in patients with chronic hepatitis C. Hepatology 2010, 52, 1888–1896. [Google Scholar] [CrossRef] [PubMed]
- Sheahan, T.; Imanaka, N.; Marukian, S.; Dorner, M.; Liu, P.; Ploss, A.; Rice, C.M. Interferon lambda alleles predict innate antiviral immune responses and hepatitis C virus permissiveness. Cell Host Microbe 2014, 15, 190–202. [Google Scholar] [CrossRef]
- Hamming, O.J.; Terczynska-Dyla, E.; Vieyres, G.; Dijkman, R.; Jorgensen, S.E.; Akhtar, H.; Siupka, P.; Pietschmann, T.; Thiel, V.; Hartmann, R. Interferon lambda 4 signals via the IFNlambda receptor to regulate antiviral activity against HCV and coronaviruses. EMBO J. 2013, 32, 3055–3065. [Google Scholar] [CrossRef] [PubMed]
- Booth, D.; George, J. Loss of function of the new interferon IFN-lambda4 may confer protection from hepatitis C. Nat. Genet. 2013, 45, 119–120. [Google Scholar] [CrossRef] [PubMed]
- Ray, K. Hepatitis: New gene IFNL4 is associated with impaired clearance of HCV. Nat. Rev. Gastroenterol. Hepatol. 2013, 10, 63. [Google Scholar] [CrossRef] [PubMed]
- O'Brien, T.R.; Prokunina-Olsson, L.; Donnelly, R.P. IFN-lambda4: The paradoxical new member of the interferon lambda family. J. Interferon Cytokine Res. 2014, 34, 829–838. [Google Scholar] [CrossRef] [PubMed]
- Hong, M.; Schwerk, J.; Lim, C.; Kell, A.; Jarret, A.; Pangallo, J.; Loo, Y.M.; Liu, S.; Hagedorn, C.H.; Gale, M., Jr.; et al. Interferon lambda 4 expression is suppressed by the host during viral infection. J. Exp Med. 2016, 213, 2539–2552. [Google Scholar] [CrossRef] [PubMed]
- Lauber, C.; Vieyres, G.; Terczynska-Dyla, E.; Anggakusuma; Dijkman, R.; Gad, H.H.; Akhtar, H.; Geffers, R.; Vondran, F.W.; Thiel, V.; et al. Transcriptome analysis reveals a classical interferon signature induced by IFNlambda4 in human primary cells. Genes Immun. 2015, 16, 414–421. [Google Scholar] [CrossRef]
- Zhou, H.; Mohlenberg, M.; Terczynska-Dyla, E.; Winther, K.G.; Hansen, N.H.; Vad-Nielsen, J.; Laloli, L.; Dijkman, R.; Nielsen, A.L.; Gad, H.H.; et al. The IFNL4 gene is a noncanonical interferon gene with a unique but evolutionarily conserved regulation. J. Virol. 2020, 94, e01535. [Google Scholar] [CrossRef]
- Ansari, M.A.; Pedergnana, V.; IP, C.L.C.; Magri, A.; Von Delft, A.; Bonsall, D.; Chaturvedi, N.; Bartha, I.; Smith, D.; Nicholson, G.; et al. Genome-to-genome analysis highlights the effect of the human innate and adaptive immune systems on the hepatitis C virus. Nat. Genet. 2017, 49, 666–673. [Google Scholar] [CrossRef]
- Rosenberg, B.R.; Freije, C.A.; Imanaka, N.; Chen, S.T.; Eitson, J.L.; Caron, R.; Uhl, S.A.; Zeremski, M.; Talal, A.; Jacobson, I.M.; et al. Genetic Variation at IFNL4 influences extrahepatic interferon-stimulated gene expression in chronic HCV patients. J. Infect. Dis. 2017, 217, 650–655. [Google Scholar] [CrossRef]
- Obajemu, A.A.; Rao, N.; Dilley, K.A.; Vargas, J.M.; Sheikh, F.; Donnelly, R.P.; Shabman, R.S.; Meissner, E.G.; Prokunina-Olsson, L.; Onabajo, O.O. IFN-lambda4 attenuates antiviral responses by enhancing negative regulation of IFN signaling. J. Immunol. 2017, 199, 3808–3820. [Google Scholar] [CrossRef] [PubMed]
- Kisseleva, T.; Brenner, D. Molecular and cellular mechanisms of liver fibrosis and its regression. Nat. Rev. Gastroenterol. Hepatol. 2020. [Google Scholar] [CrossRef]
- Cubero, F.J.; Woitok, M.M.; Zoubek, M.E.; de Bruin, A.; Hatting, M.; Trautwein, C. Disruption of the FasL/Fas axis protects against inflammation-derived tumorigenesis in chronic liver disease. Cell Death Dis. 2019, 10, 115. [Google Scholar] [CrossRef]
- Andreakos, E.; Zanoni, I.; Galani, I.E. Lambda interferons come to light: Dual function cytokines mediating antiviral immunity and damage control. Curr. Opin. Immunol. 2019, 56, 67–75. [Google Scholar] [CrossRef] [PubMed]
- Onabajo, O.O.; Porter-Gill, P.; Paquin, A.; Rao, N.; Liu, L.; Tang, W.; Brand, N.; Prokunina-Olsson, L. Expression of interferon lambda 4 is associated with reduced proliferation and increased cell death in human hepatic cells. J. Interferon Cytokine Res. 2015, 35, 888–900. [Google Scholar] [CrossRef] [PubMed]
- Fonda, I.; Kenig, M.; Gaberc-Porekar, V.; Pristovaek, P.; Menart, V. Attachment of histidine tags to recombinant tumor necrosis factor-alpha drastically changes its properties. Sci. World J. 2002, 2, 1312–1325. [Google Scholar] [CrossRef]
- Perron-Savard, P.; De Crescenzo, G.; Moual, H.L. Dimerization and DNA binding of the Salmonella enterica PhoP response regulator are phosphorylation independent. Microbiology 2005, 151, 3979–3987. [Google Scholar] [CrossRef] [PubMed]
- Chant, A.; Kraemer-Pecore, C.M.; Watkin, R.; Kneale, G.G. Attachment of a histidine tag to the minimal zinc finger protein of the Aspergillus nidulans gene regulatory protein AreA causes a conformational change at the DNA-binding site. Protein Expr. Purif. 2005, 39, 152–159. [Google Scholar] [CrossRef]
- Smyth, D.R.; Mrozkiewicz, M.K.; McGrath, W.J.; Listwan, P.; Kobe, B. Crystal structures of fusion proteins with large-affinity tags. Protein Sci. 2003, 12, 1313–1322. [Google Scholar] [CrossRef] [PubMed]
- de Vries, E.G.; de Hooge, M.N.; Gietema, J.A.; de Jong, S. Correspondence re: C. G. Ferreira et al., Apoptosis: Target of cancer therapy. Clin. Cancer Res., 8: 2024-2034, 2002. Clin. Cancer Res. 2003, 9, 912, author reply 913. [Google Scholar]
- Ke, N.; Landgraf, D.; Paulsson, J.; Berkmen, M. Visualization of Periplasmic and Cytoplasmic Proteins with a Self-Labeling Protein Tag. J. Bacteriol. 2016, 198, 1035–1043. [Google Scholar] [CrossRef]
- Wang, Z.; Gerstein, M.; Snyder, M. RNA-Seq: A revolutionary tool for transcriptomics. Nat. Rev. Genet. 2009, 10, 57–63. [Google Scholar] [CrossRef] [PubMed]
- Cunningham, F.; Achuthan, P.; Akanni, W.; Allen, J.; Amode, M.R.; Armean, I.M.; Bennett, R.; Bhai, J.; Billis, K.; Boddu, S.; et al. Ensembl 2019. Nucleic Acids Res. 2019, 47, D745–D751. [Google Scholar] [CrossRef]
- Kim, D.; Langmead, B.; Salzberg, S.L. HISAT: A fast spliced aligner with low memory requirements. Nat. Methods 2015, 12, 357–360. [Google Scholar] [CrossRef] [PubMed]
- Liao, Y.; Smyth, G.K.; Shi, W. featureCounts: An efficient general purpose program for assigning sequence reads to genomic features. Bioinformatics 2014, 30, 923–930. [Google Scholar] [CrossRef]
- Smolkova, B.; Lunova, M.; Lynnyk, A.; Uzhytchak, M.; Churpita, O.; Jirsa, M.; Kubinova, S.; Lunov, O.; Dejneka, A. Non-thermal plasma, as a new physicochemical source, to induce redox imbalance and subsequent cell death in liver cancer cell lines. Cell. Physiol. Biochem. 2019, 52, 119–140. [Google Scholar]
- Lunova, M.; Smolkova, B.; Uzhytchak, M.; Janouskova, K.Z.; Jirsa, M.; Egorova, D.; Kulikov, A.; Kubinova, S.; Dejneka, A.; Lunov, O. Light-induced modulation of the mitochondrial respiratory chain activity: Possibilities and limitations. Cell. Mol. Life Sci. 2020, 77, 2815–2838. [Google Scholar] [CrossRef] [PubMed]
- Lunova, M.; Prokhorov, A.; Jirsa, M.; Hof, M.; Olzynska, A.; Jurkiewicz, P.; Kubinova, S.; Lunov, O.; Dejneka, A. Nanoparticle core stability and surface functionalization drive the mTOR signaling pathway in hepatocellular cell lines. Sci. Rep. 2017, 7, 16049. [Google Scholar] [CrossRef] [PubMed]


Publisher’s Note: MDPI stays neutral with regard to jurisdictional claims in published maps and institutional affiliations. |
© 2021 by the authors. Licensee MDPI, Basel, Switzerland. This article is an open access article distributed under the terms and conditions of the Creative Commons Attribution (CC BY) license (http://creativecommons.org/licenses/by/4.0/).
Share and Cite
Lunova, M.; Kubovciak, J.; Smolková, B.; Uzhytchak, M.; Michalova, K.; Dejneka, A.; Strnad, P.; Lunov, O.; Jirsa, M. Expression of Interferons Lambda 3 and 4 Induces Identical Response in Human Liver Cell Lines Depending Exclusively on Canonical Signaling. Int. J. Mol. Sci. 2021, 22, 2560. https://doi.org/10.3390/ijms22052560
Lunova M, Kubovciak J, Smolková B, Uzhytchak M, Michalova K, Dejneka A, Strnad P, Lunov O, Jirsa M. Expression of Interferons Lambda 3 and 4 Induces Identical Response in Human Liver Cell Lines Depending Exclusively on Canonical Signaling. International Journal of Molecular Sciences. 2021; 22(5):2560. https://doi.org/10.3390/ijms22052560
Chicago/Turabian StyleLunova, Mariia, Jan Kubovciak, Barbora Smolková, Mariia Uzhytchak, Kyra Michalova, Alexandr Dejneka, Pavel Strnad, Oleg Lunov, and Milan Jirsa. 2021. "Expression of Interferons Lambda 3 and 4 Induces Identical Response in Human Liver Cell Lines Depending Exclusively on Canonical Signaling" International Journal of Molecular Sciences 22, no. 5: 2560. https://doi.org/10.3390/ijms22052560
APA StyleLunova, M., Kubovciak, J., Smolková, B., Uzhytchak, M., Michalova, K., Dejneka, A., Strnad, P., Lunov, O., & Jirsa, M. (2021). Expression of Interferons Lambda 3 and 4 Induces Identical Response in Human Liver Cell Lines Depending Exclusively on Canonical Signaling. International Journal of Molecular Sciences, 22(5), 2560. https://doi.org/10.3390/ijms22052560