
A Systems Biology Approach to Investigating the Interaction between Serotonin Synthesis by Tryptophan Hydroxylase and the Metabolic Homeostasis


 ,
,  and
and 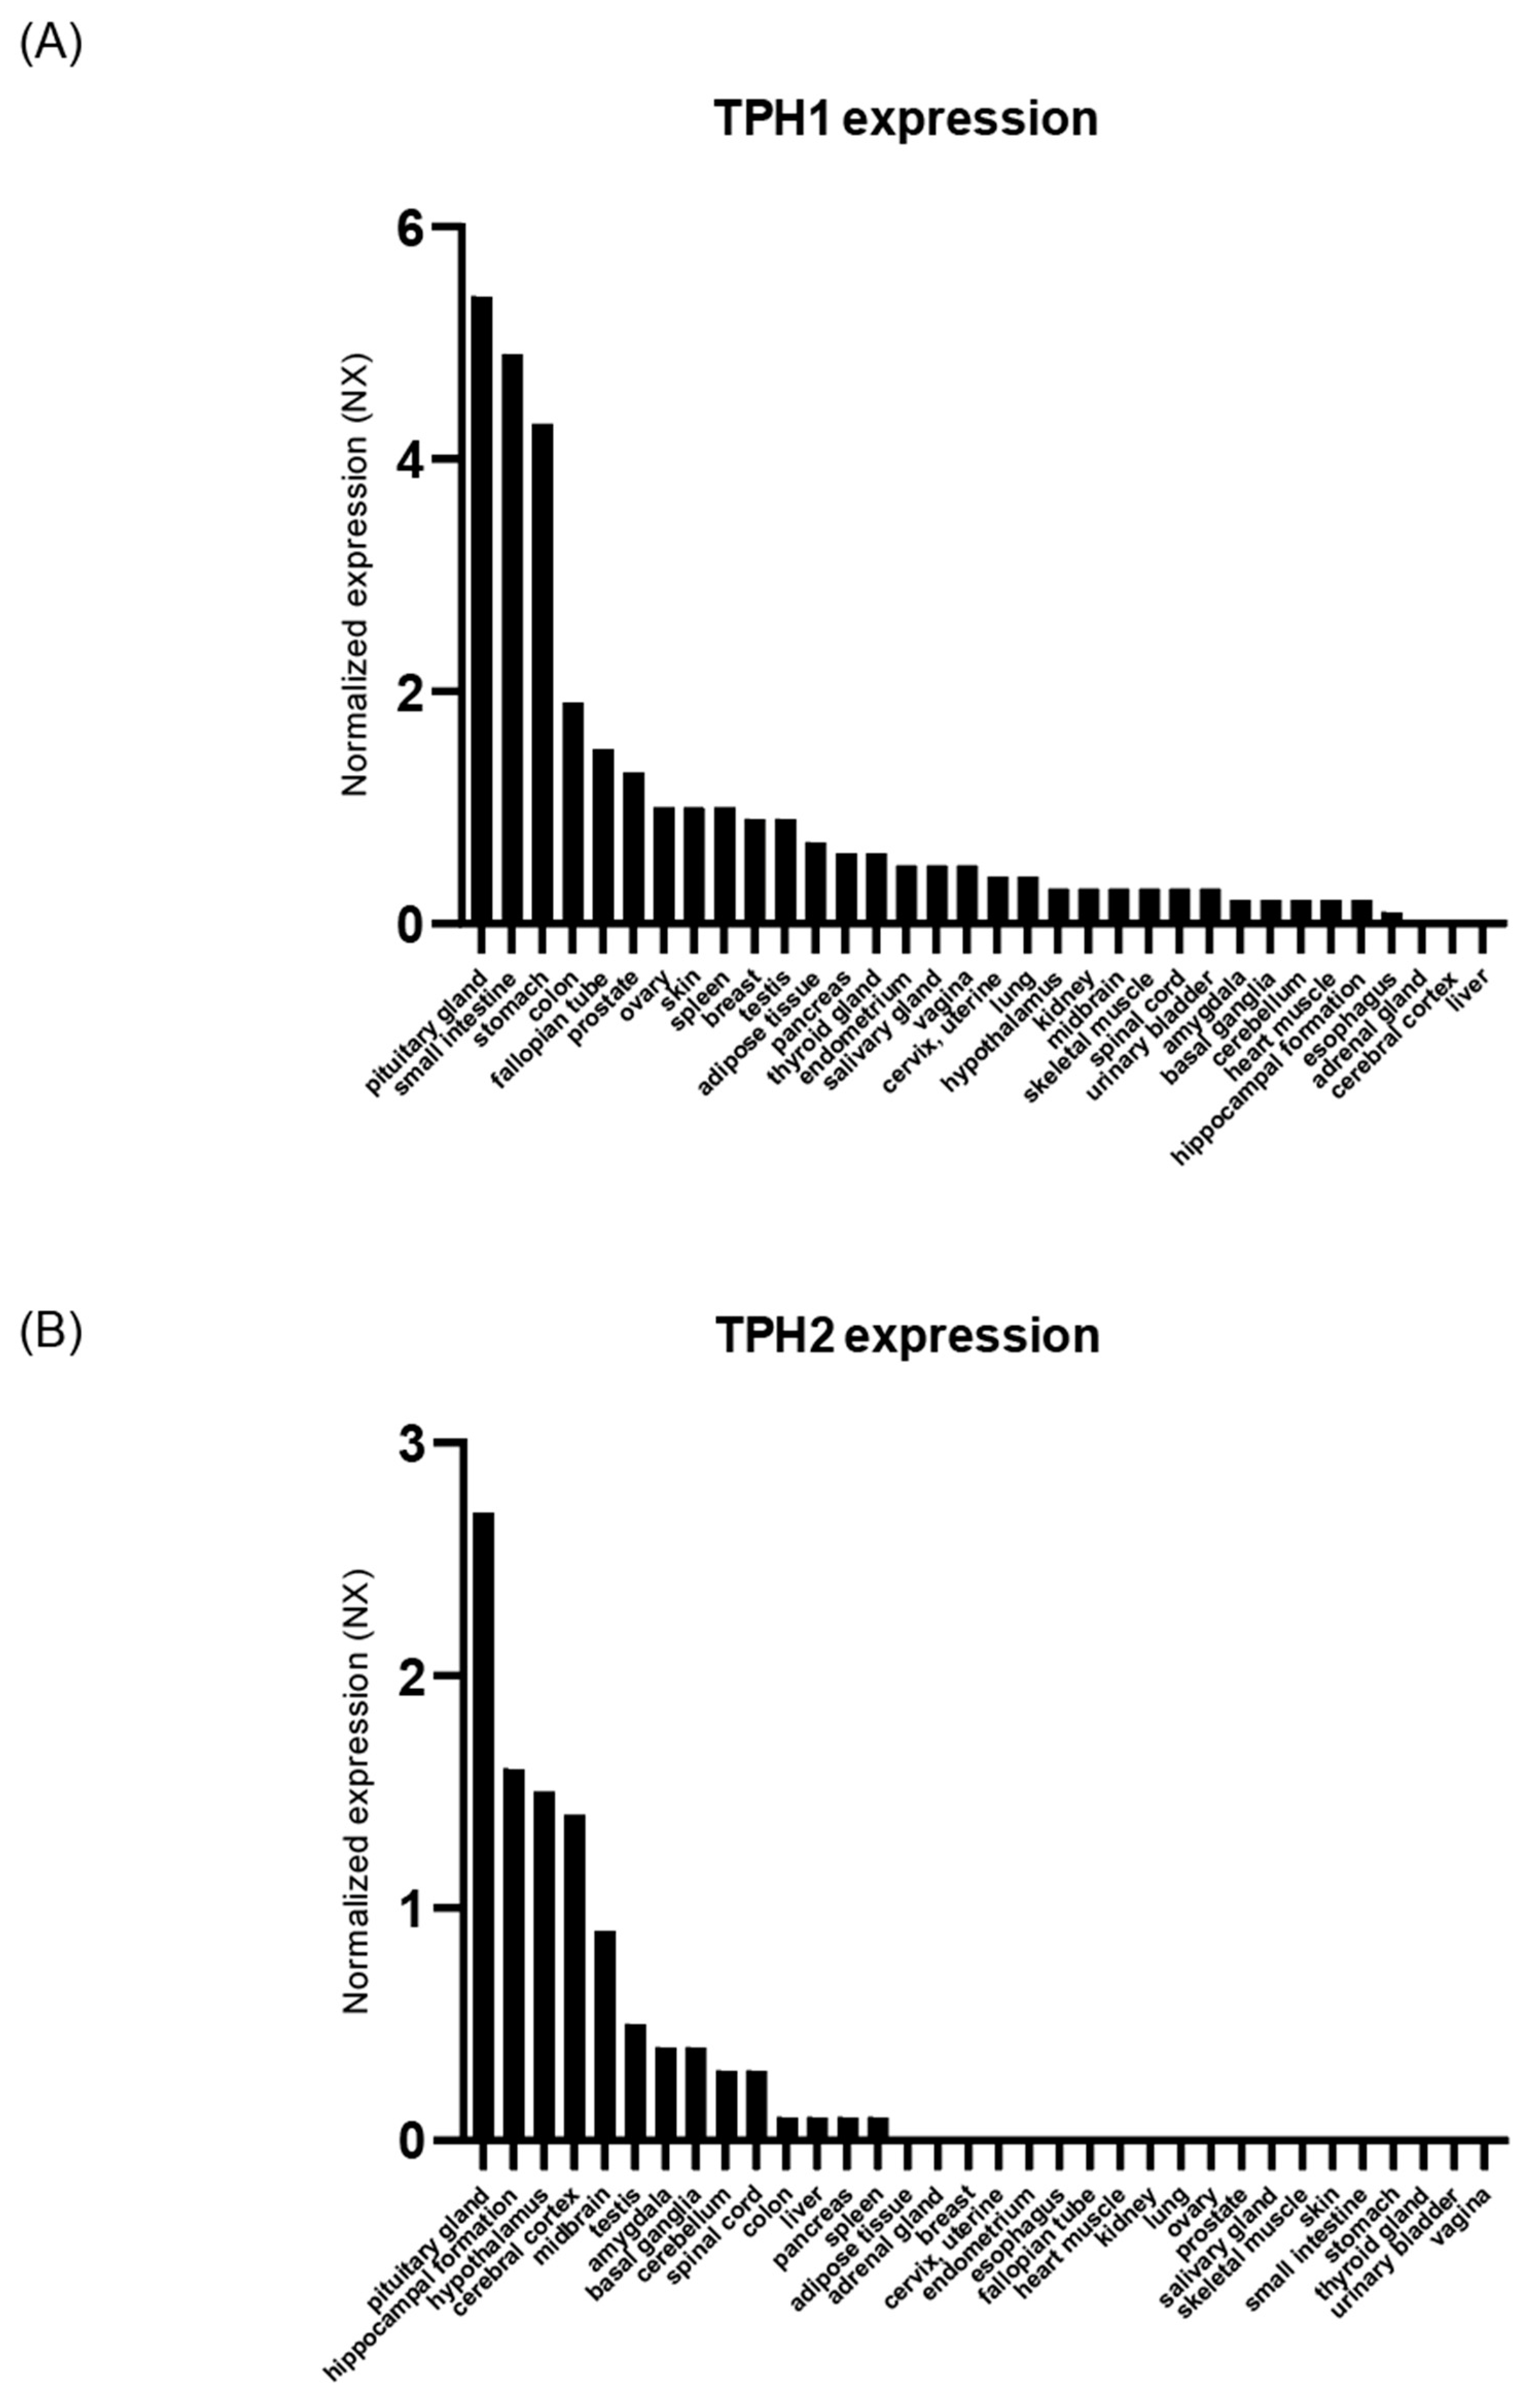
Abstract
1. Introduction
2. Results
2.1. TPH Expression in Human Tissue
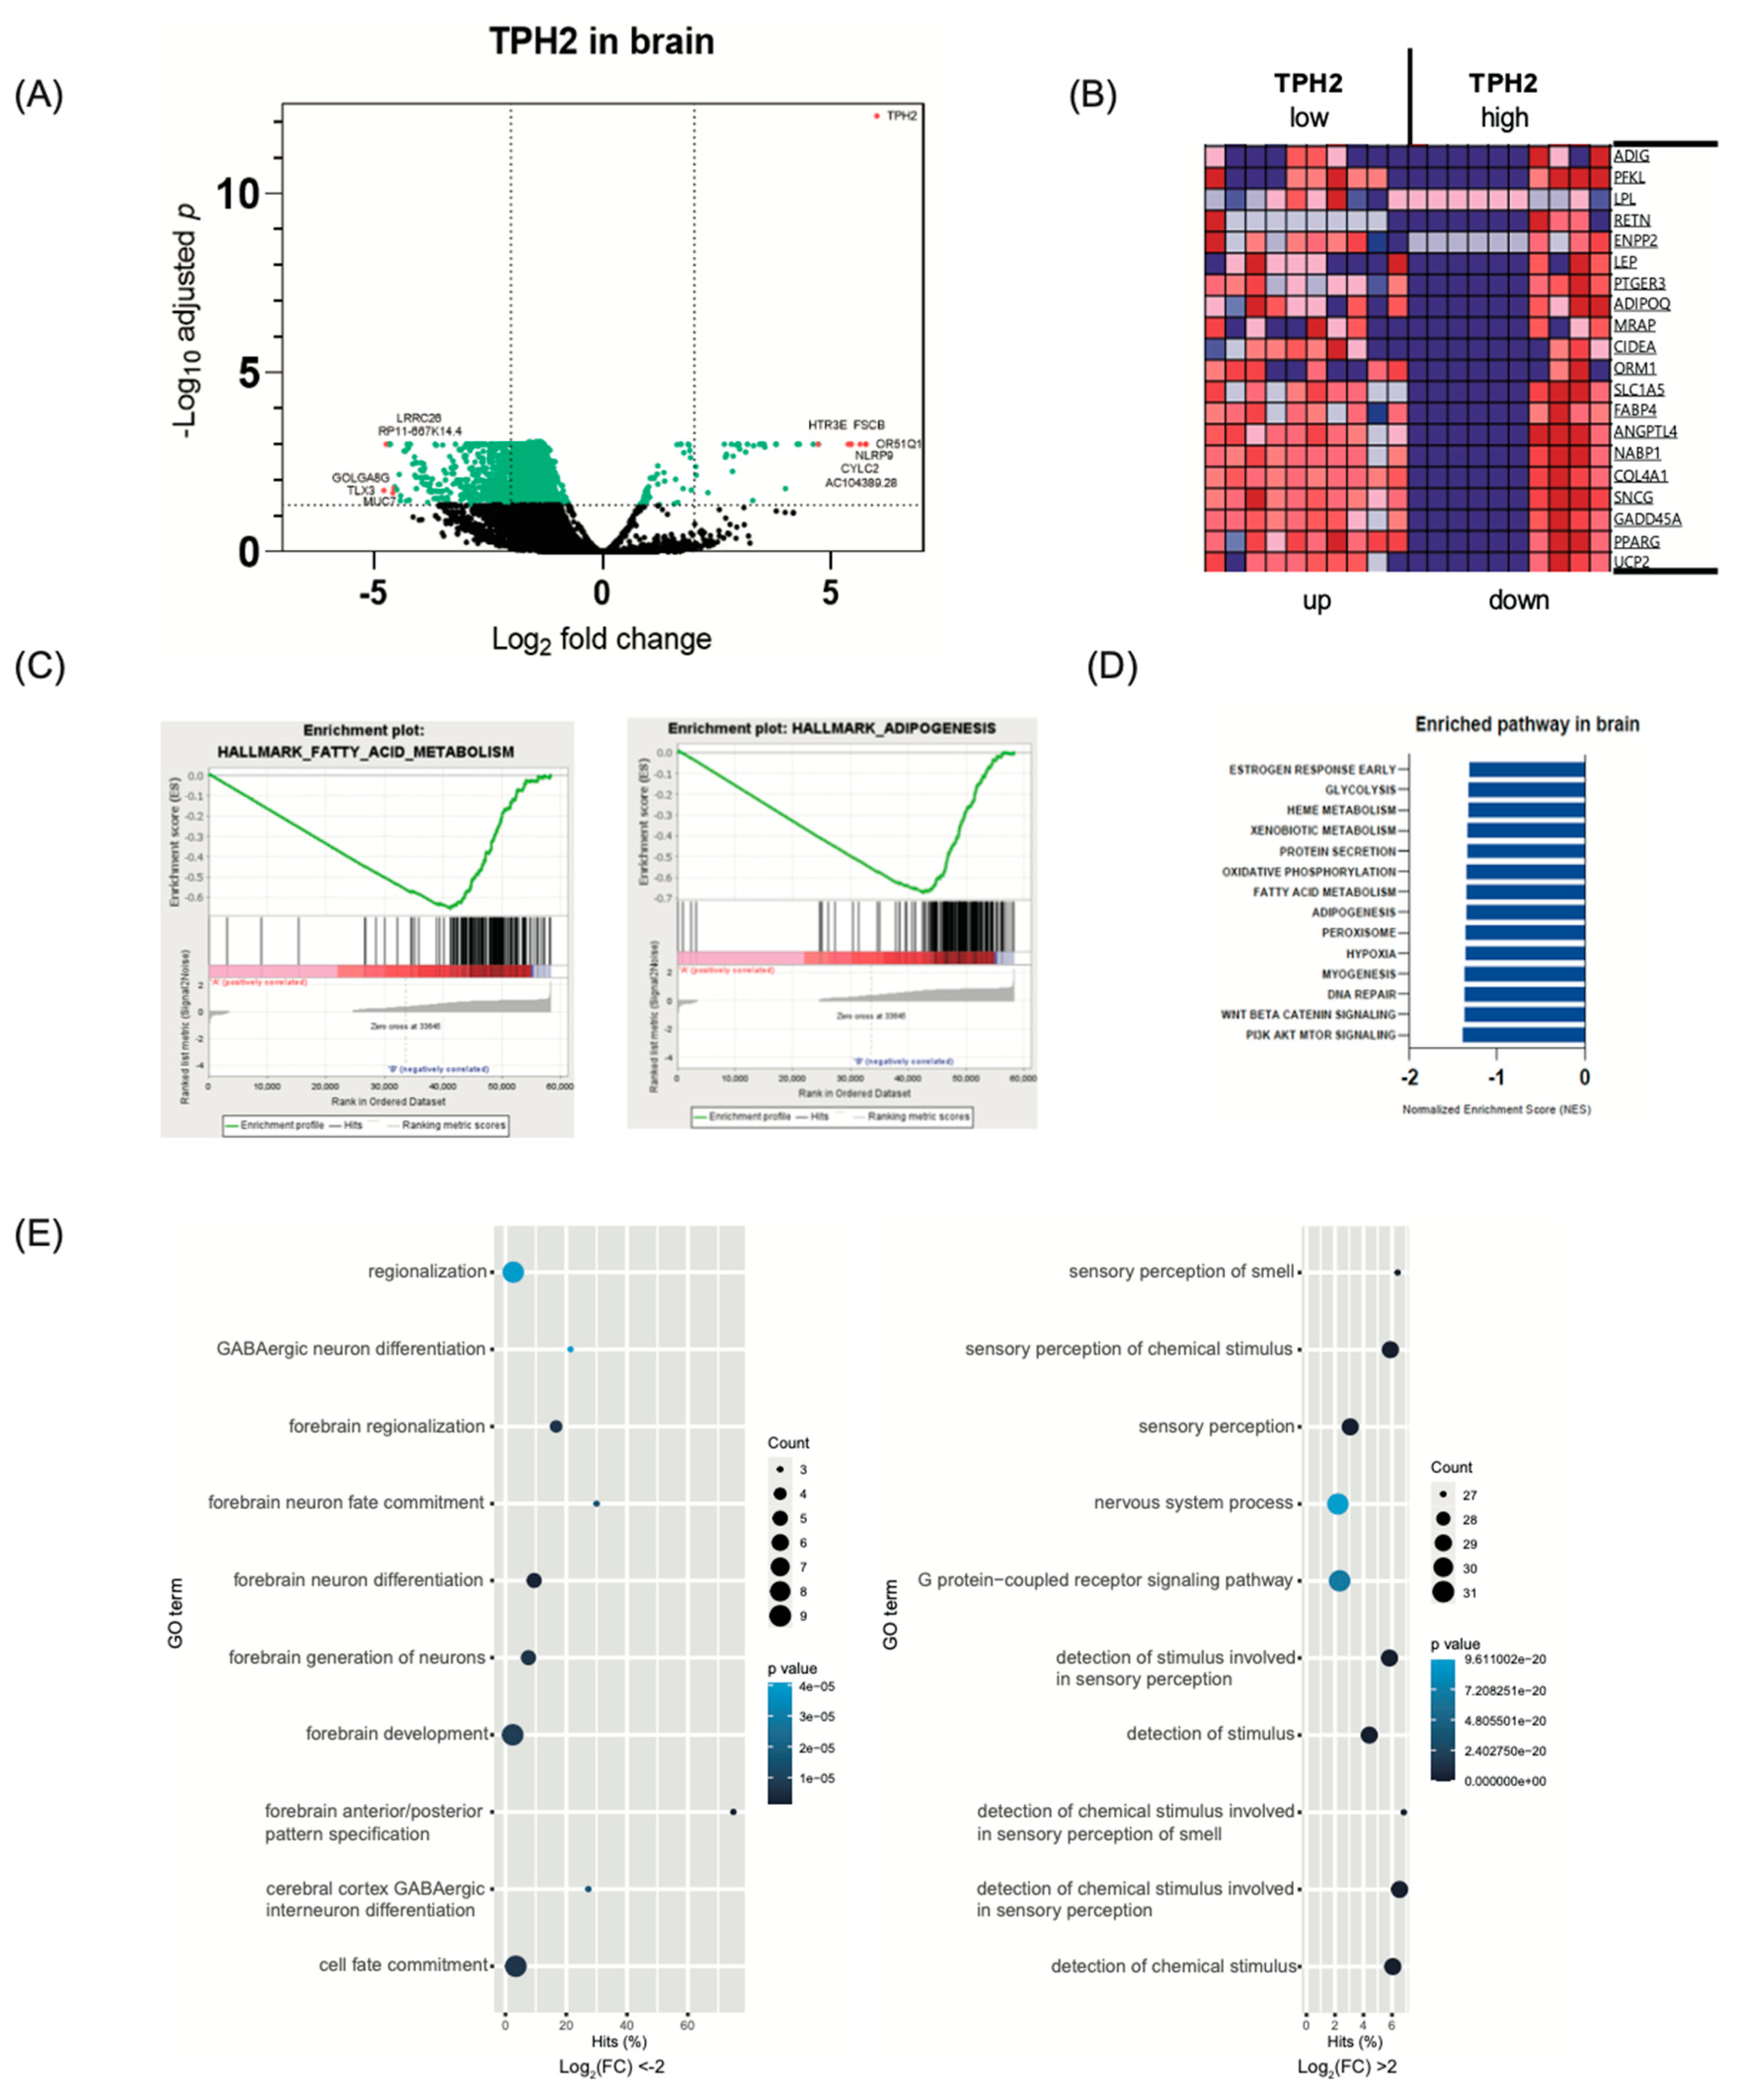
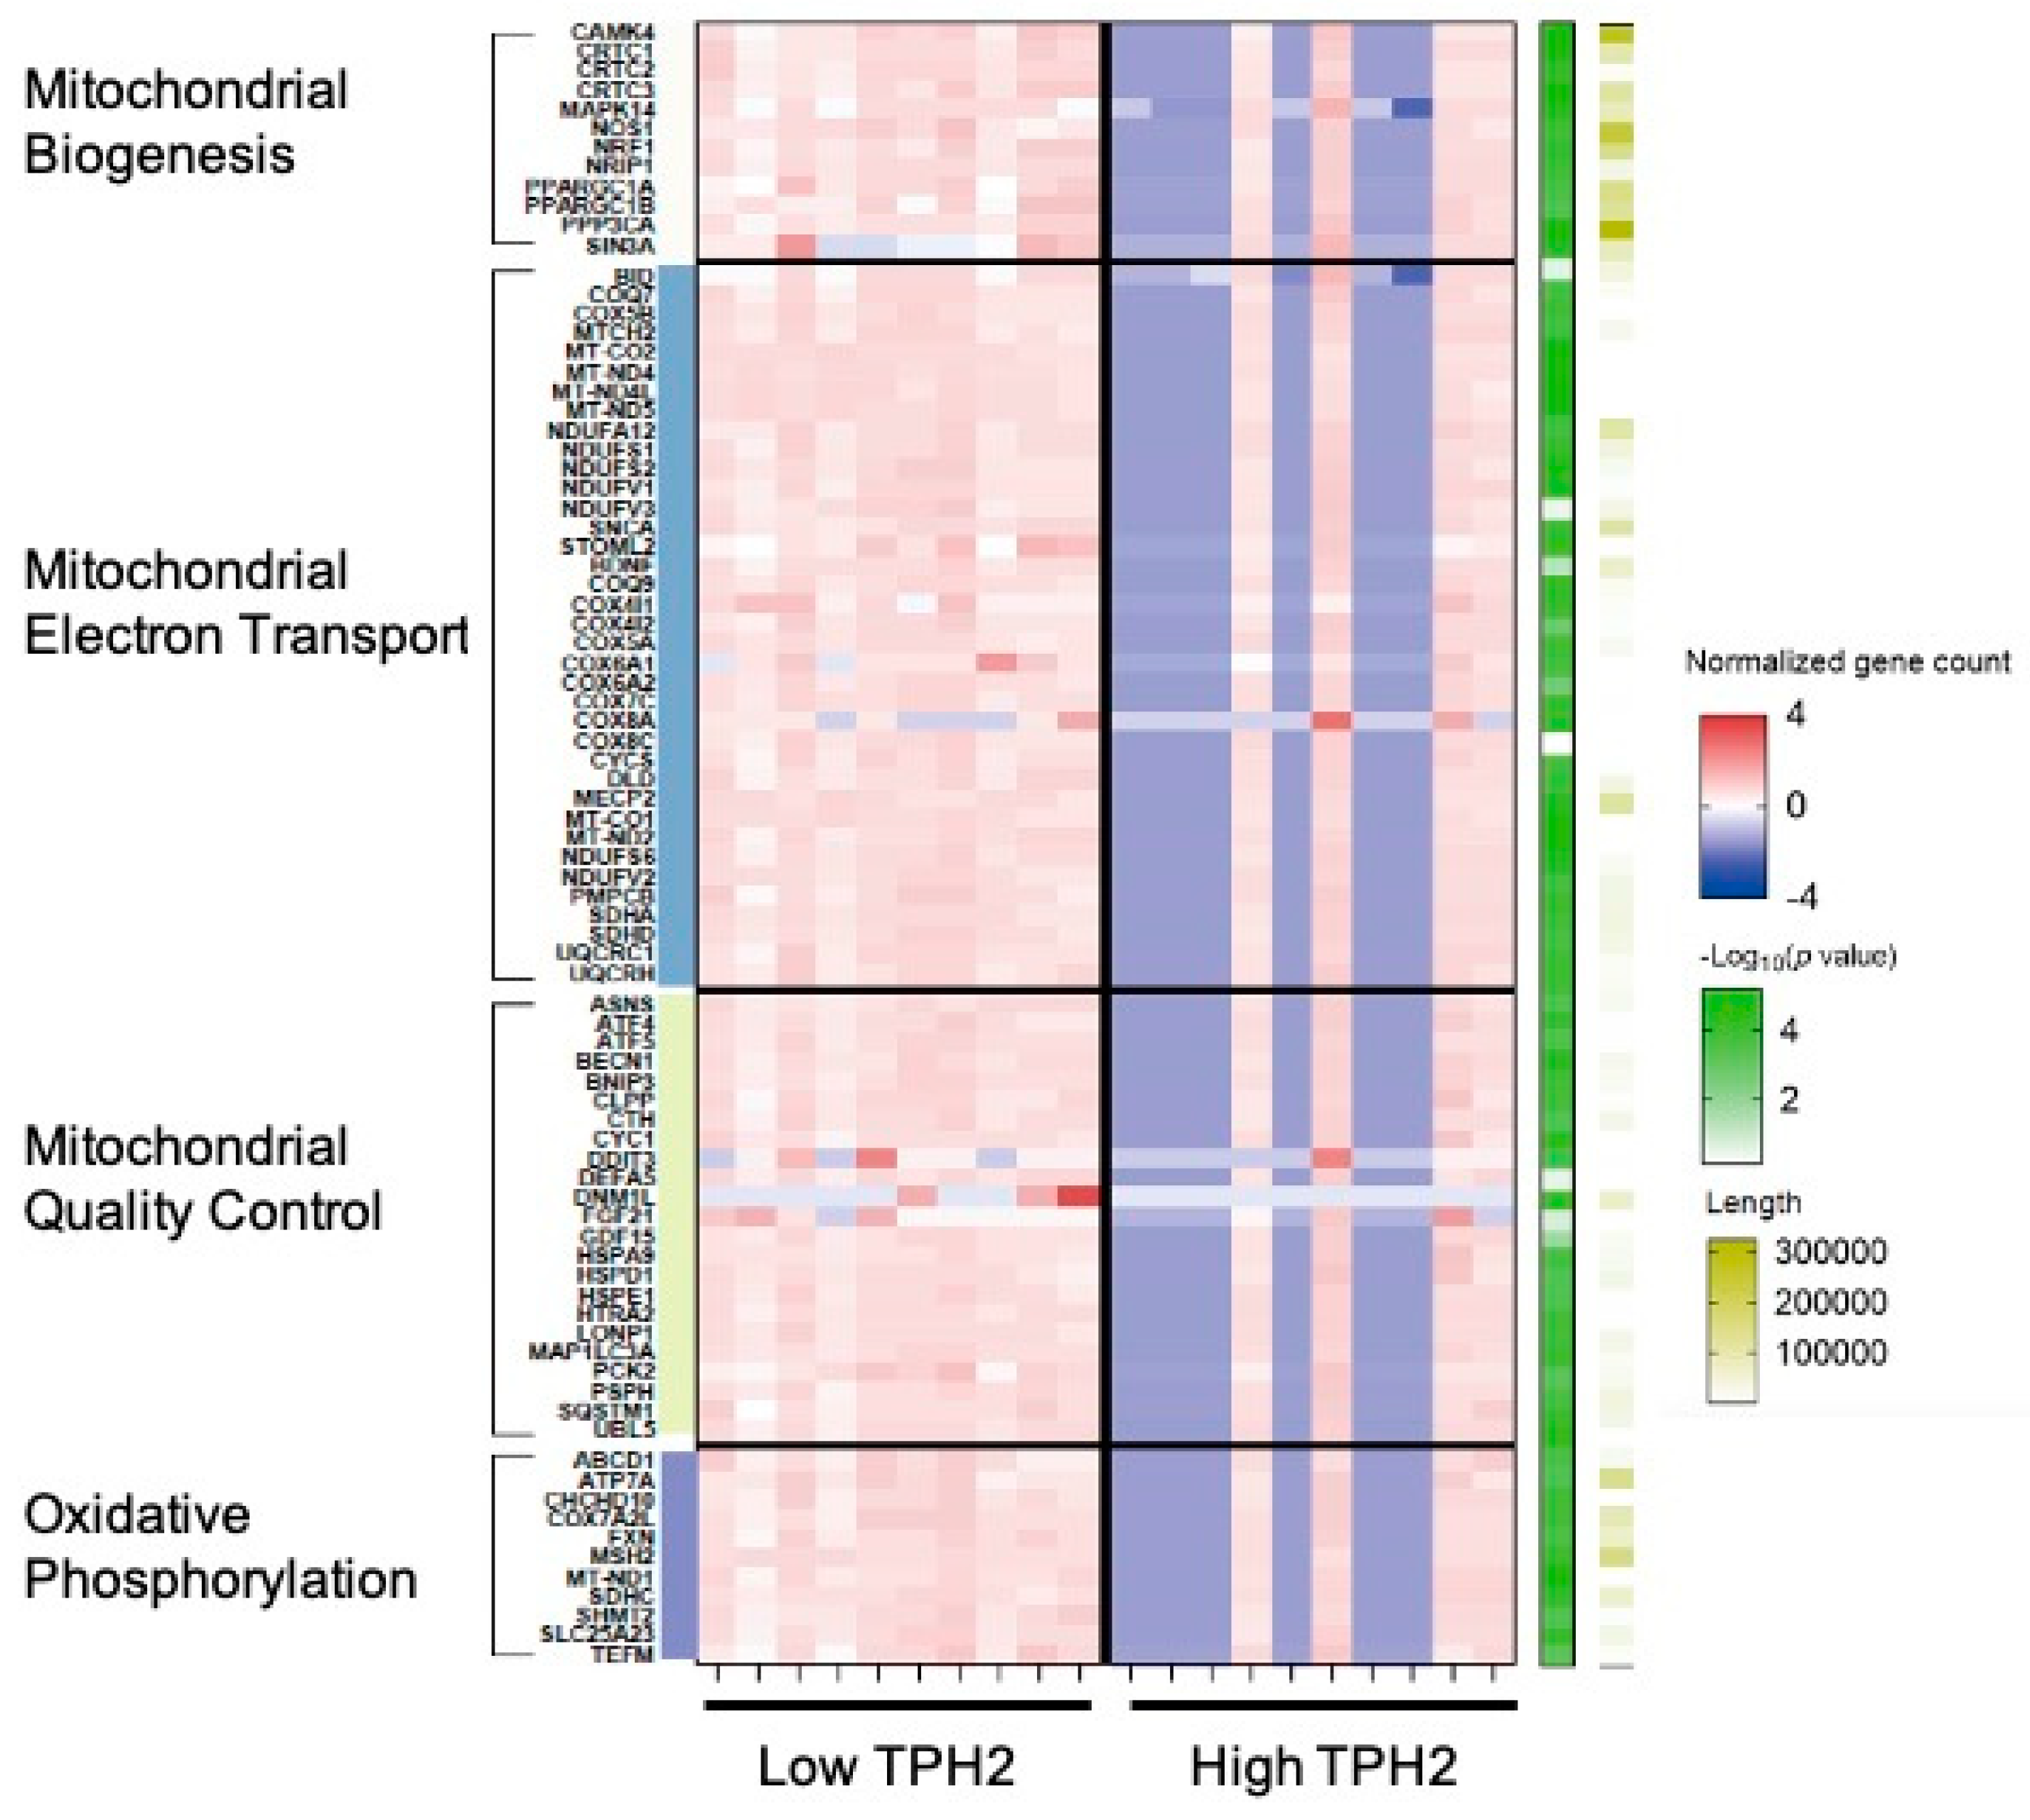
2.2. Transcriptome Analysis in Brain According to TPH2 Expression
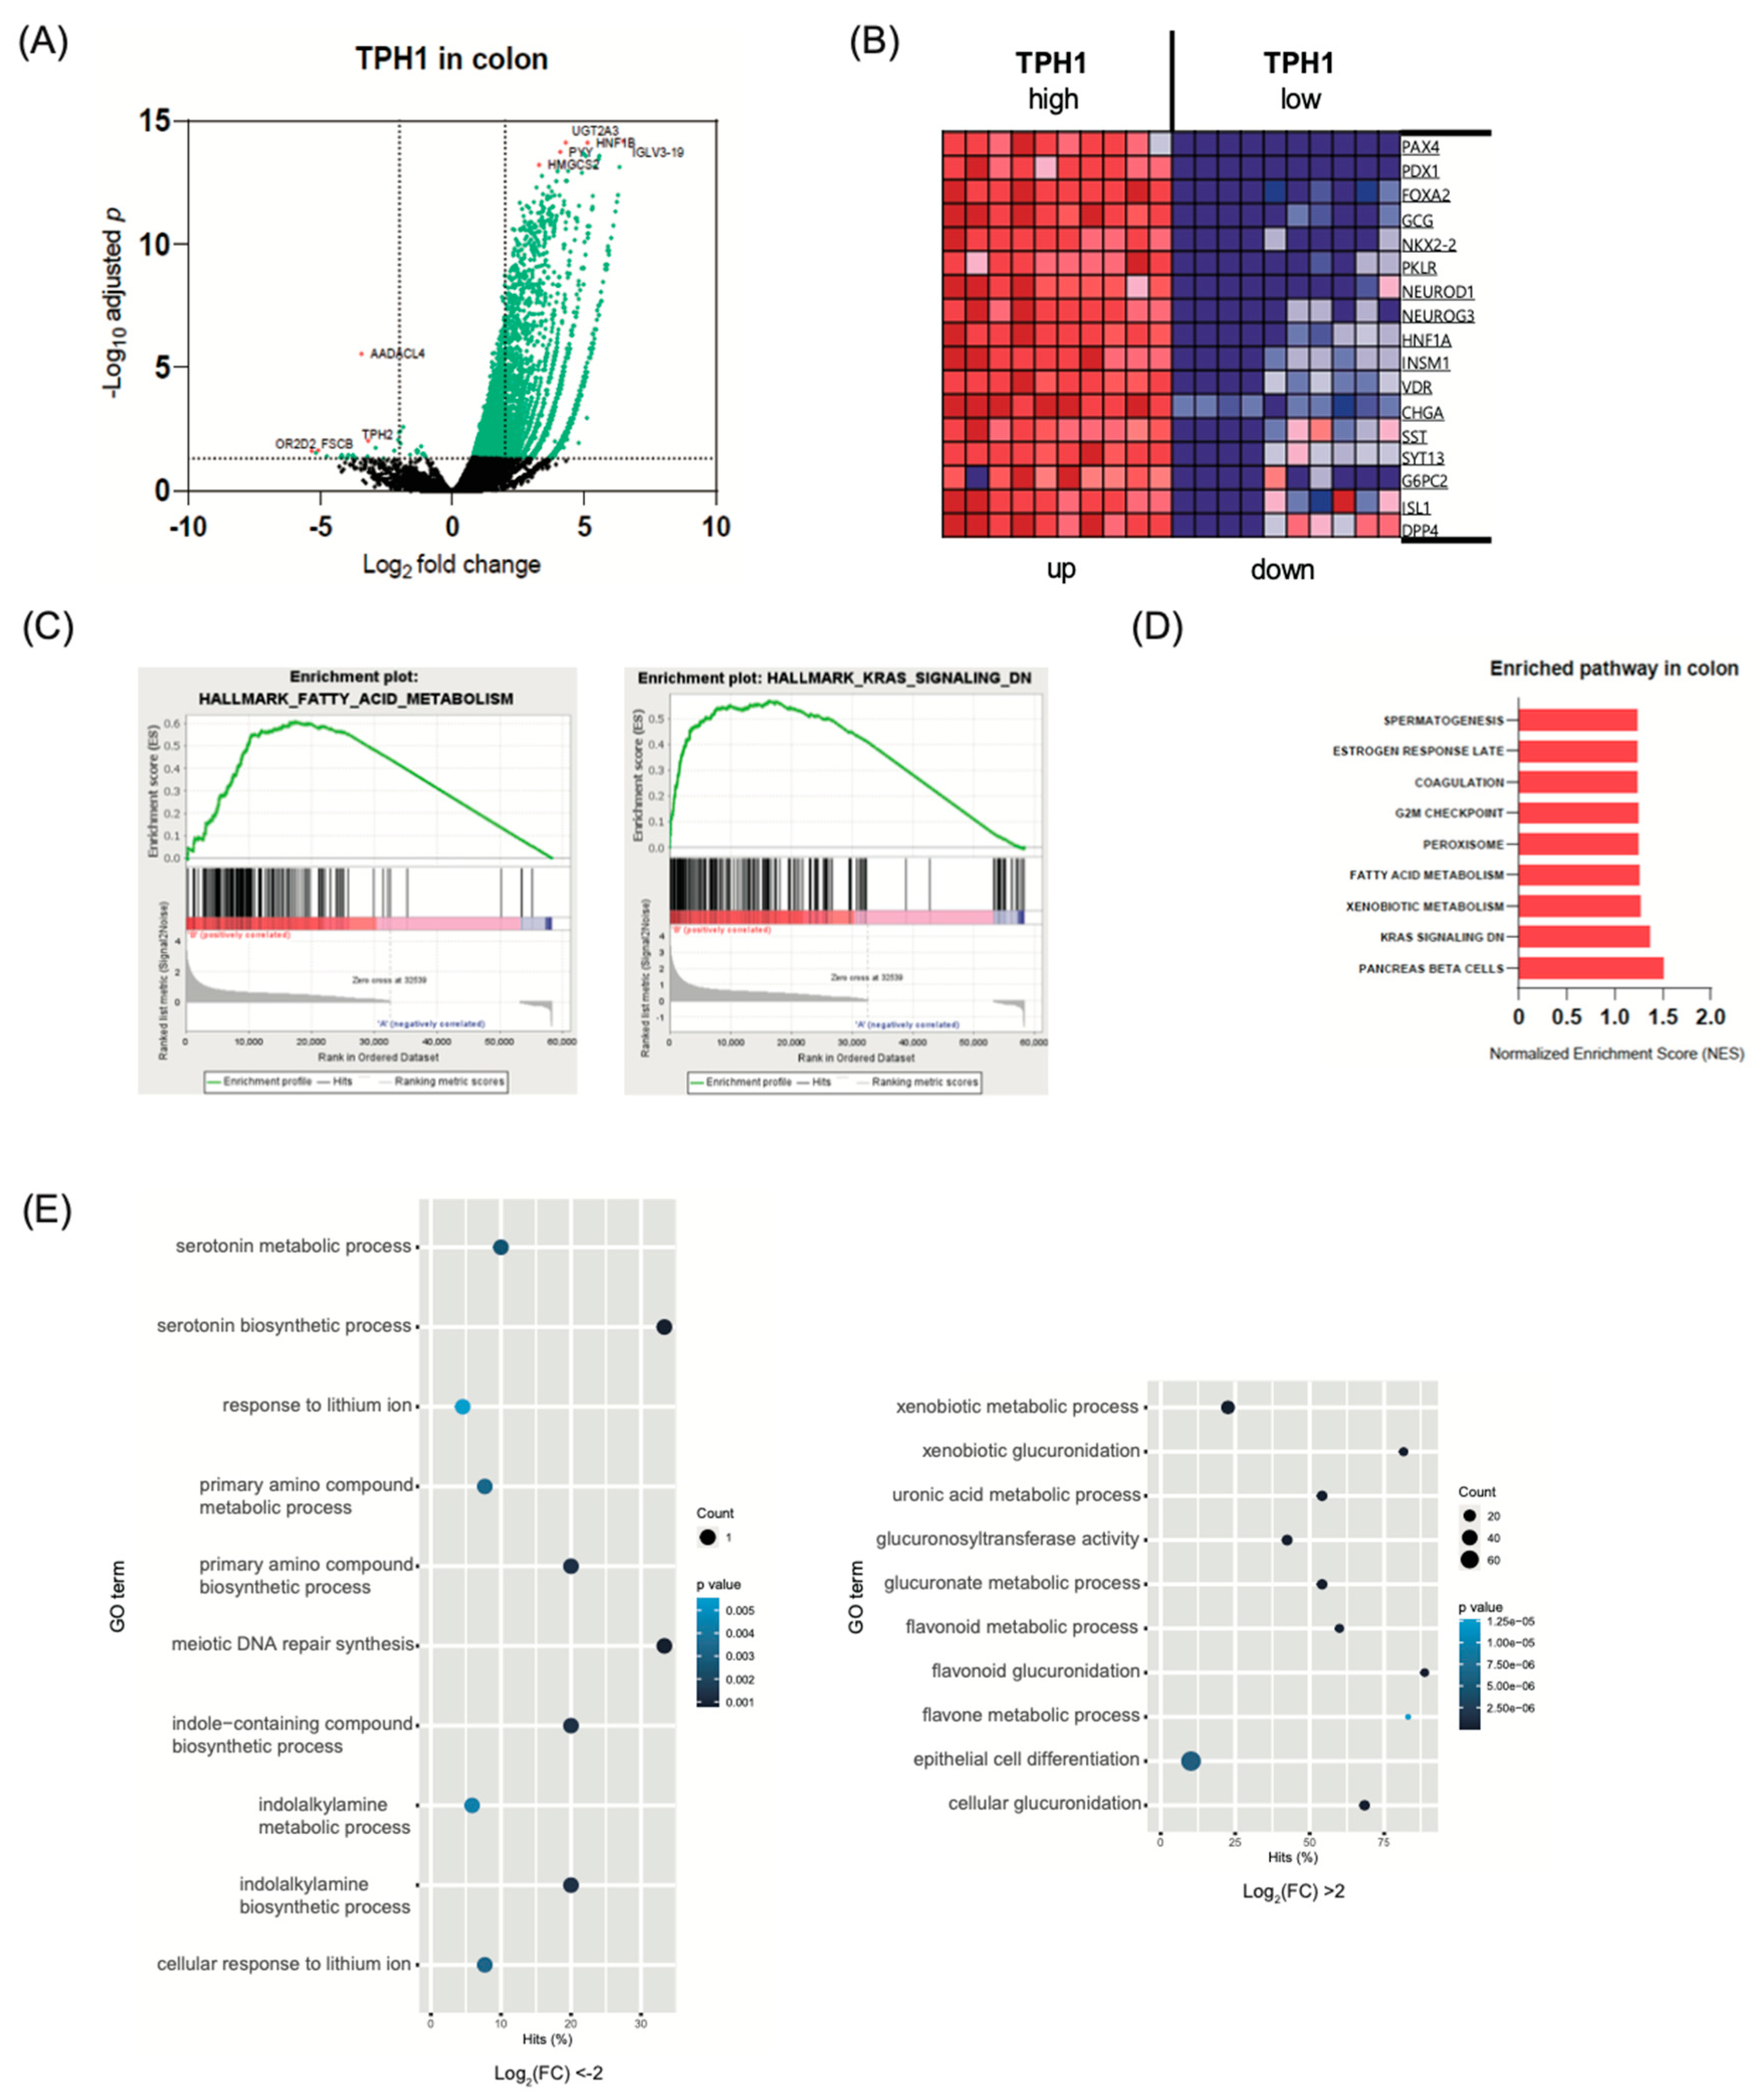
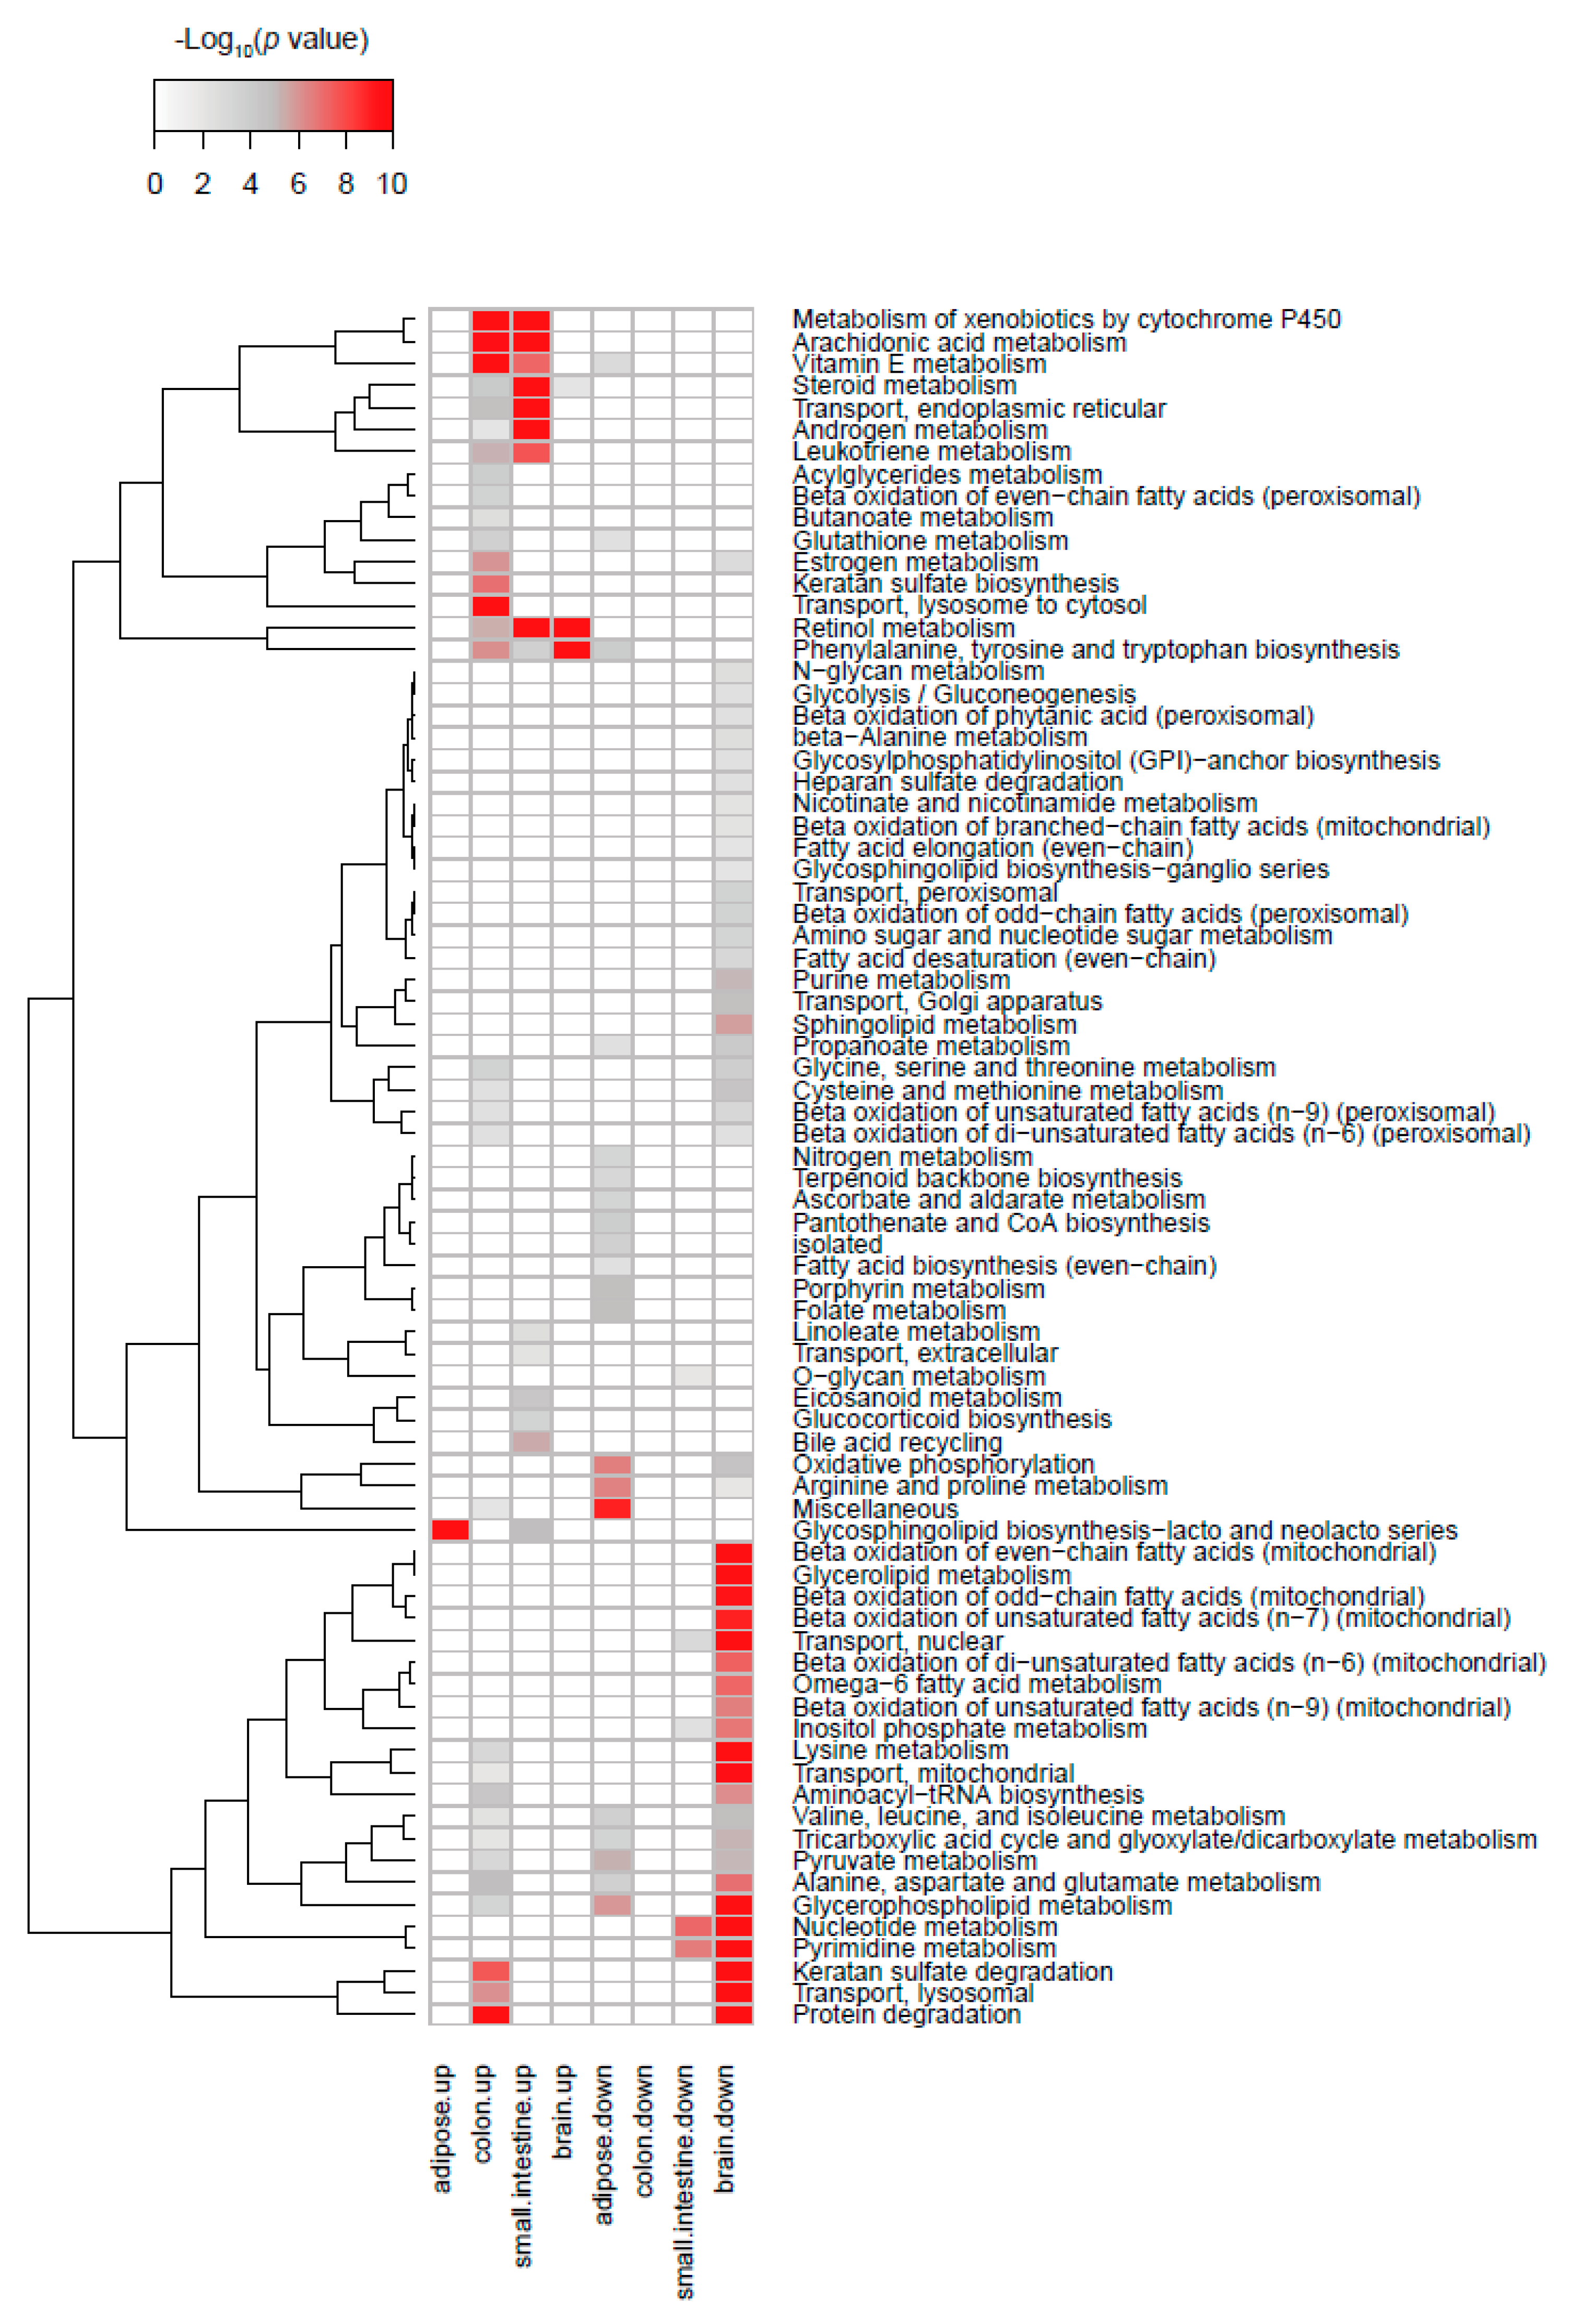
2.3. Transcriptome Analysis in Intestine and Adipose Tissue According to TPH1 Expression
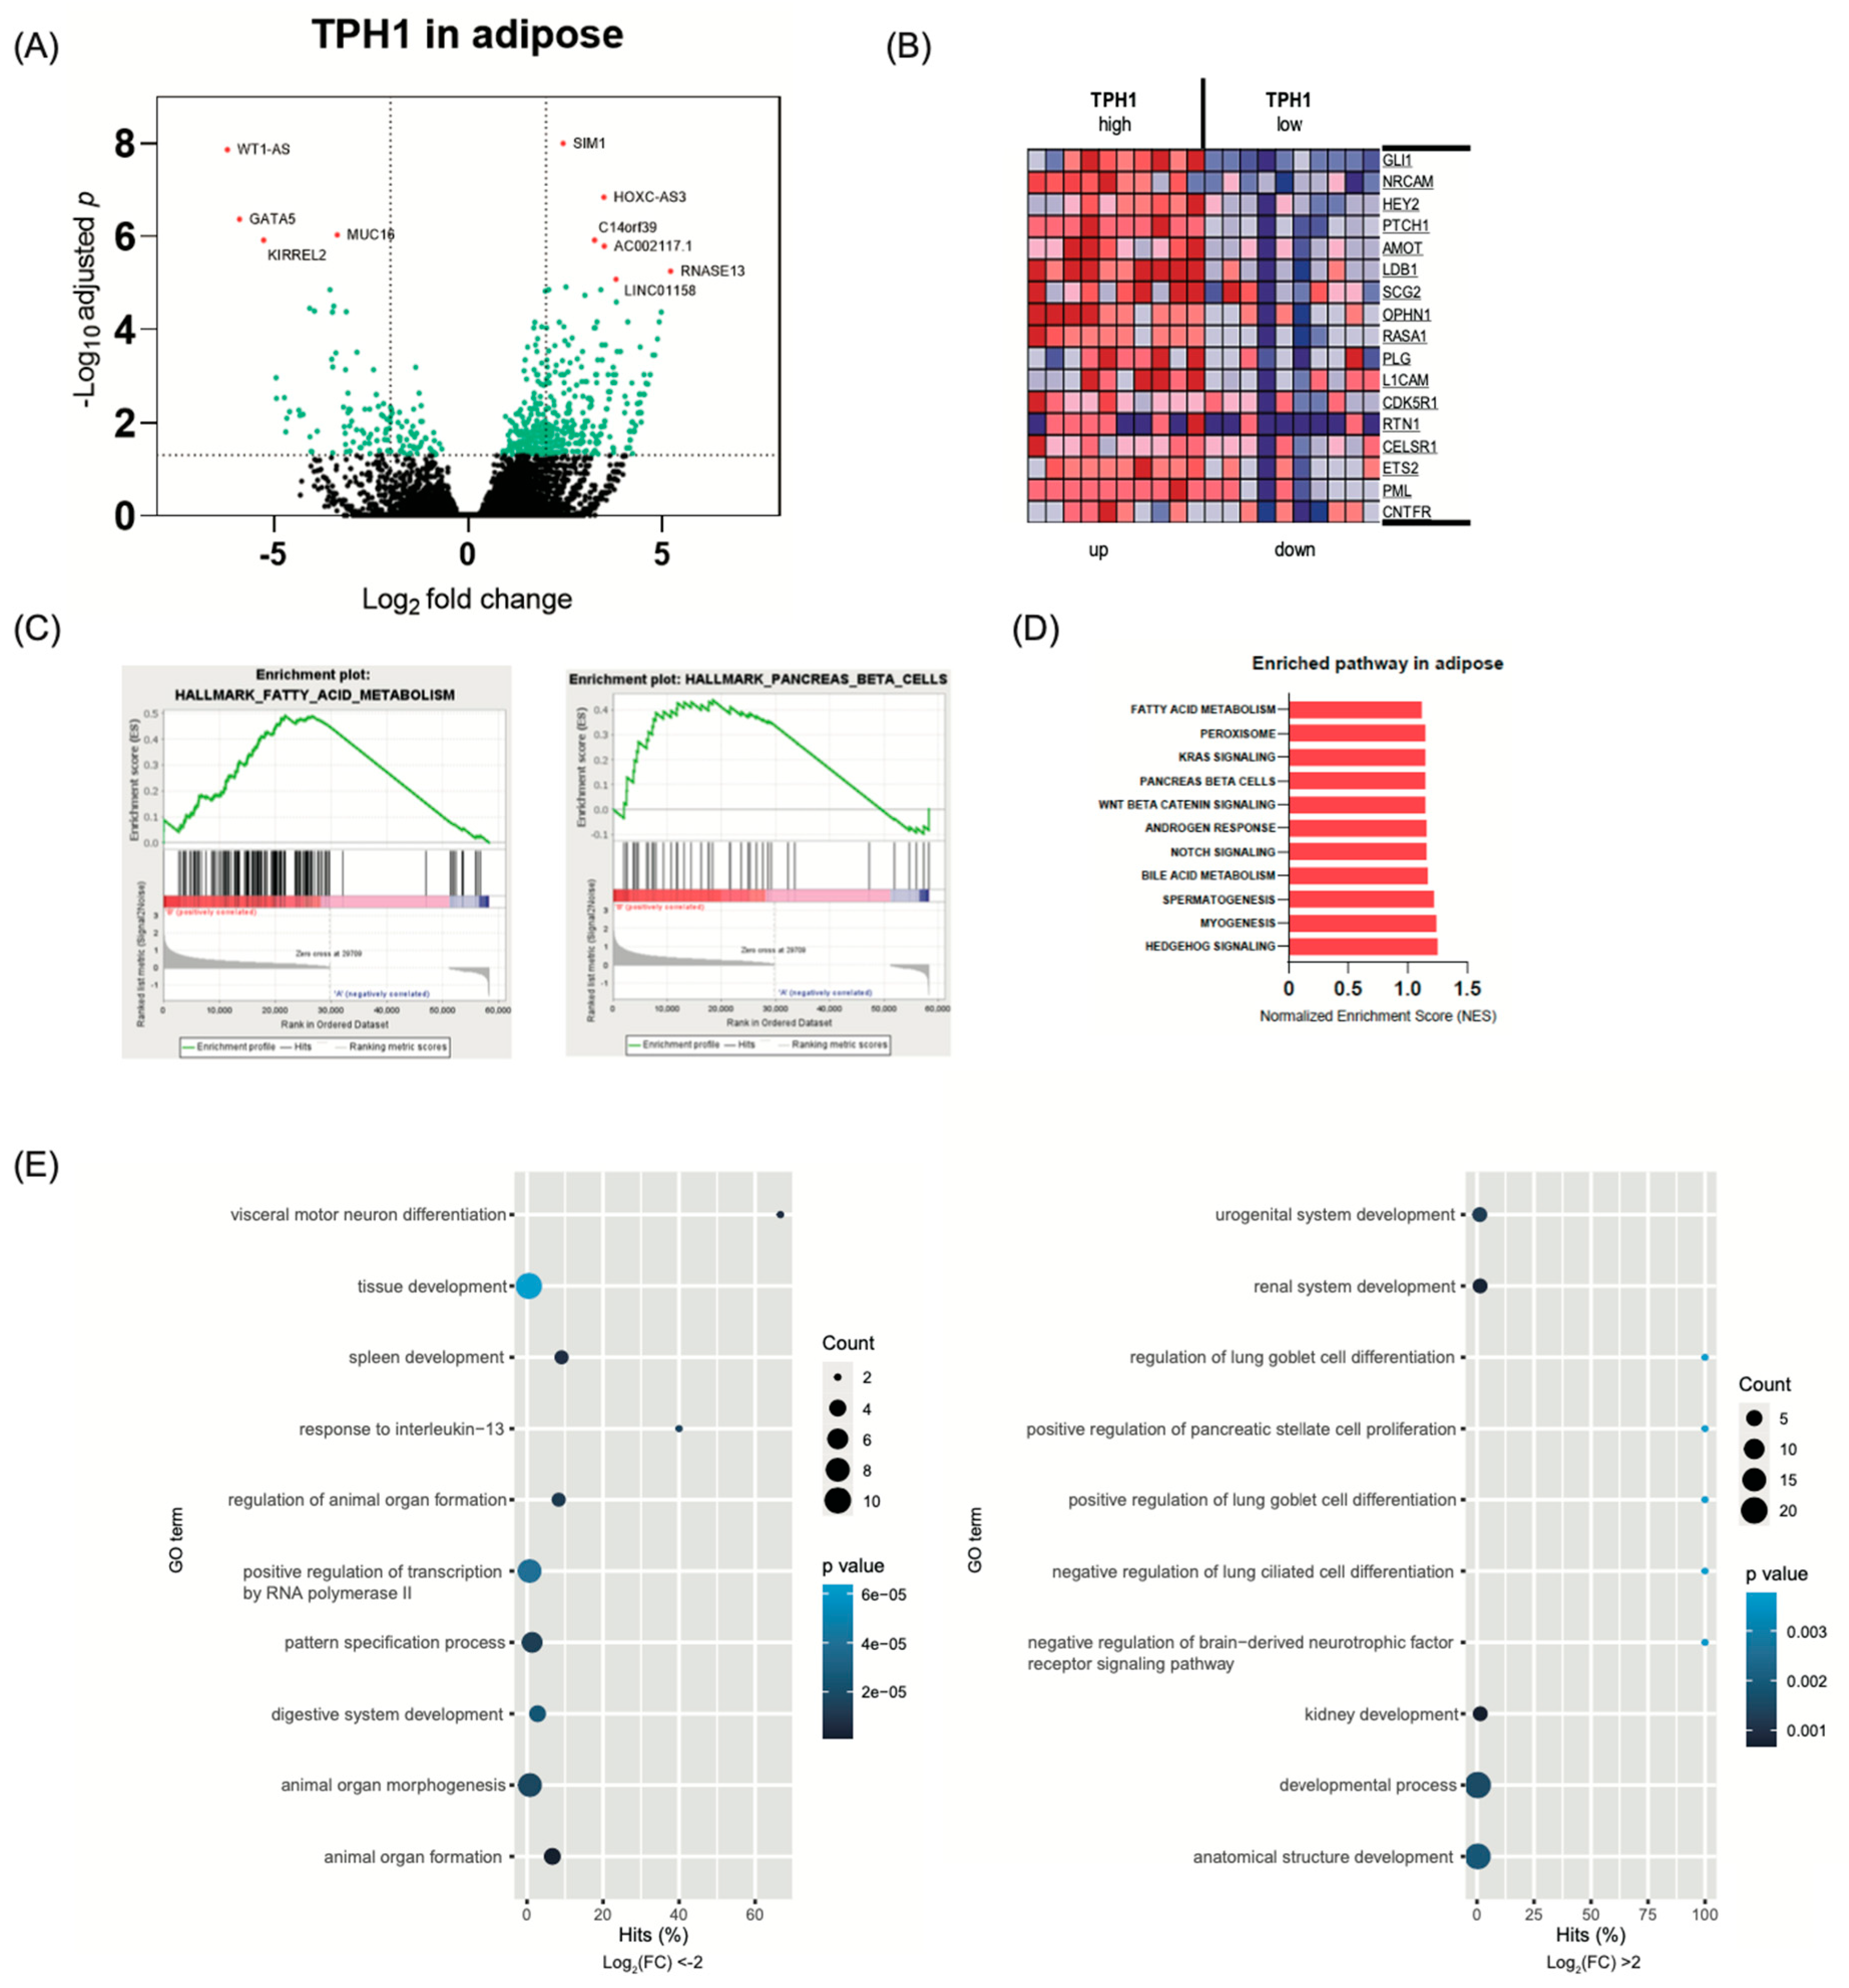
2.4. Transcriptome Analysis in White Adipose Tissue According to TPH1 Expression
2.5. The Role of Serotonin in Mitochondria
2.6. Metabolite Changes According to TPH Expression
3. Discussion
4. Material and Methods
4.1. Data Collection
4.2. Data Analysis
Supplementary Materials
Author Contributions
Funding
Institutional Review Board Statement
Informed Consent Statement
Data Availability Statement
Conflicts of Interest
References
- Purnell, J.Q. Definitions, classification, and epidemiology of obesity. In Endotext [Internet]; MDText. com, Inc.: South Dartmouth, MA, USA, 2018. [Google Scholar]
- Kinlen, D.; Cody, D.; O’Shea, D. Complications of obesity. Qjm Int. J. Med. 2018, 111, 437–443. [Google Scholar]
- Kyle, T.K.; Dhurandhar, E.J.; Allison, D.B. Regarding obesity as a disease: Evolving policies and their implications. Endocrinol. Metab. Clin. 2016, 45, 511–520. [Google Scholar] [CrossRef]
- Spiegelman, B.M.; Flier, J.S. Obesity and the regulation of energy balance. Cell 2001, 104, 531–543. [Google Scholar] [CrossRef]
- Crowley, V.E. Overview of human obesity and central mechanisms regulating energy homeostasis. Ann. Clin. Biochem. 2008, 45, 245–255. [Google Scholar] [CrossRef]
- Curran, K.P.; Chalasani, S.H. Serotonin circuits and anxiety: What can invertebrates teach us? Invertebr. Neurosci. 2012, 12, 81–92. [Google Scholar] [CrossRef] [PubMed]
- Oh, C.-M.; Park, S.; Kim, H. Serotonin as a new therapeutic target for diabetes mellitus and obesity. Diabetes Metab. J. 2016, 40, 89–98. [Google Scholar] [CrossRef]
- Sakowski, S.A.; Geddes, T.J.; Thomas, D.M.; Levi, E.; Hatfield, J.S.; Kuhn, D.M. Differential tissue distribution of tryptophan hydroxylase isoforms 1 and 2 as revealed with monospecific antibodies. Brain Res. 2006, 1085, 11–18. [Google Scholar] [CrossRef]
- Del Colle, A.; Israelyan, N.; Gross Margolis, K. Novel aspects of enteric serotonergic signaling in health and brain-gut disease. Am. J. Physiol. -Gastrointest. Liver Physiol. 2020, 318, G130–G143. [Google Scholar] [CrossRef] [PubMed]
- Berger, M.; Gray, J.A.; Roth, B.L. The expanded biology of serotonin. Annu. Rev. Med. 2009, 60, 355–366. [Google Scholar] [CrossRef] [PubMed]
- Yabut, J.M.; Crane, J.D.; Green, A.E.; Keating, D.J.; Khan, W.I.; Steinberg, G.R. Emerging roles for serotonin in regulating metabolism: New implications for an ancient molecule. Endocr. Rev. 2019, 40, 1092–1107. [Google Scholar] [CrossRef]
- Berglund, E.D.; Liu, C.; Sohn, J.-W.; Liu, T.; Kim, M.H.; Lee, C.E.; Vianna, C.R.; Williams, K.W.; Xu, Y.; Elmquist, J.K. Serotonin 2C receptors in pro-opiomelanocortin neurons regulate energy and glucose homeostasis. J. Clin. Investig. 2013, 123, 5061–5070. [Google Scholar] [CrossRef]
- Mulder, H.; Franke, B.; Arends, J.; Wilmink, F.; Egberts, A.; Scheffer, H. The association between HTR2C polymorphisms and obesity in psychiatric patients using antipsychotics: A cross-sectional study. Pharm. J. 2007, 7, 318–324. [Google Scholar] [CrossRef] [PubMed]
- Garfield, A.S.; Davies, J.R.; Burke, L.K.; Furby, H.V.; Wilkinson, L.S.; Heisler, L.K.; Isles, A.R. Increased alternate splicing of Htr2c in a mouse model for Prader-Willi syndrome leads disruption of 5HT 2C receptor mediated appetite. Mol. Brain 2016, 9, 95. [Google Scholar] [CrossRef]
- Higgins, G.A.; Fletcher, P.J.; Shanahan, W.R. Lorcaserin: A review of its preclinical and clinical pharmacology and therapeutic potential. Pharmacol. Ther. 2020, 205, 107417. [Google Scholar] [CrossRef]
- Mercado, C.P.; Kilic, F. Molecular mechanisms of SERT in platelets: Regulation of plasma serotonin levels. Mol. Interv. 2010, 10, 231. [Google Scholar] [CrossRef]
- Eisinger, F.; Patzelt, J.; Langer, H.F. The platelet response to tissue injury. Front. Med. 2018, 5, 317. [Google Scholar] [CrossRef]
- Sumara, G.; Sumara, O.; Kim, J.K.; Karsenty, G. Gut-derived serotonin is a multifunctional determinant to fasting adaptation. Cell Metab. 2012, 16, 588–600. [Google Scholar] [CrossRef] [PubMed]
- Choi, W.; Namkung, J.; Hwang, I.; Kim, H.; Lim, A.; Park, H.J.; Lee, H.W.; Han, K.-H.; Park, S.; Jeong, J.-S. Serotonin signals through a gut-liver axis to regulate hepatic steatosis. Nat. Commun. 2018, 9, 1–9. [Google Scholar]
- Kim, H.; Toyofuku, Y.; Lynn, F.C.; Chak, E.; Uchida, T.; Mizukami, H.; Fujitani, Y.; Kawamori, R.; Miyatsuka, T.; Kosaka, Y. Serotonin regulates pancreatic beta cell mass during pregnancy. Nat. Med. 2010, 16, 804. [Google Scholar] [CrossRef] [PubMed]
- Ohara-Imaizumi, M.; Kim, H.; Yoshida, M.; Fujiwara, T.; Aoyagi, K.; Toyofuku, Y.; Nakamichi, Y.; Nishiwaki, C.; Okamura, T.; Uchida, T. Serotonin regulates glucose-stimulated insulin secretion from pancreatic β cells during pregnancy. Proc. Natl. Acad. Sci. 2013, 110, 19420–19425. [Google Scholar] [CrossRef] [PubMed]
- Oh, C.-M.; Namkung, J.; Go, Y.; Shong, K.E.; Kim, K.; Kim, H.; Park, B.-Y.; Lee, H.W.; Jeon, Y.H.; Song, J. Regulation of systemic energy homeostasis by serotonin in adipose tissues. Nat. Commun. 2015, 6, 1–12. [Google Scholar] [CrossRef] [PubMed]
- Shong, K.E.; Oh, C.-M.; Namkung, J.; Park, S.; Kim, H. Serotonin regulates de novo lipogenesis in adipose tissues through serotonin receptor 2A. Endocrinol. Metab. 2020, 35, 470–479. [Google Scholar] [CrossRef] [PubMed]
- Martin, A.M.; Yabut, J.M.; Choo, J.M.; Page, A.J.; Sun, E.W.; Jessup, C.F.; Wesselingh, S.L.; Khan, W.I.; Rogers, G.B.; Steinberg, G.R. The gut microbiome regulates host glucose homeostasis via peripheral serotonin. Proc. Natl. Acad. Sci. USA 2019, 116, 19802–19804. [Google Scholar] [CrossRef]
- Kaur, H.; Bose, C.; Mande, S.S. Tryptophan metabolism by gut microbiome and gut-brain-axis: An in silico Analysis. Front. Neurosci. 2019, 13, 1365. [Google Scholar] [CrossRef]
- Zhao, J.; Goldberg, J.; Vaccarino, V. Promoter methylation of serotonin transporter gene is associated with obesity measures: A monozygotic twin study. Int. J. Obes. 2013, 37, 140–145. [Google Scholar] [CrossRef]
- Perez-Cornago, A.; Mansego, M.L.; Zulet, M.A.; Martinez, J.A. DNA hypermethylation of the serotonin receptor type-2A gene is associated with a worse response to a weight loss intervention in subjects with metabolic syndrome. Nutrients 2014, 6, 2387–2403. [Google Scholar] [CrossRef] [PubMed]
- Kring, S.I.; Werge, T.; Holst, C.; Toubro, S.; Astrup, A.; Hansen, T.; Pedersen, O.; Sørensen, T.I. Polymorphisms of serotonin receptor 2A and 2C genes and COMT in relation to obesity and type 2 diabetes. PLoS ONE 2009, 4, e6696. [Google Scholar] [CrossRef] [PubMed]
- Kwak, S.H.; Park, B.L.; Kim, H.; German, M.S.; Go, M.J.; Jung, H.S.; Koo, B.K.; Cho, Y.M.; Choi, S.H.; Cho, Y.S. Association of variations in TPH1 and HTR2B with gestational weight gain and measures of obesity. Obesity 2012, 20, 233–238. [Google Scholar] [CrossRef] [PubMed]
- Young, R.L.; Lumsden, A.L.; Martin, A.M.; Schober, G.; Pezos, N.; Thazhath, S.S.; Isaacs, N.J.; Cvijanovic, N.; Sun, E.W.; Wu, T. Augmented capacity for peripheral serotonin release in human obesity. Int. J. Obes. 2018, 42, 1880–1889. [Google Scholar] [CrossRef]
- Lumsden, A.L.; Martin, A.M.; Sun, E.W.; Schober, G.; Isaacs, N.J.; Pezos, N.; Wattchow, D.A.; de Fontgalland, D.; Rabbitt, P.; Hollington, P. Sugar responses of human enterochromaffin cells depend on gut region, sex, and body mass. Nutrients 2019, 11, 234. [Google Scholar] [CrossRef]
- Consortium, G. Genetic effects on gene expression across human tissues. Nature 2017, 550, 204–213. [Google Scholar] [CrossRef]
- Joh, T. Tryptophan hydroxylase: Molecular biology and regulation. In Serotoninergic Neurons and 5-HT Receptors in the CNS; Springer: Berlin/Heidelberg, Germany, 2000; pp. 117–129. [Google Scholar]
- Matthes, S.; Bader, M. Peripheral serotonin synthesis as a new drug target. Trends Pharmacol. Sci. 2018, 39, 560–572. [Google Scholar] [CrossRef] [PubMed]
- Bach-Mizrachi, H.; Underwood, M.D.; Kassir, S.A.; Bakalian, M.J.; Sibille, E.; Tamir, H.; Mann, J.J.; Arango, V. Neuronal tryptophan hydroxylase mRNA expression in the human dorsal and median raphe nuclei: Major depression and suicide. Neuropsychopharmacology 2006, 31, 814–824. [Google Scholar] [CrossRef]
- Chen, G.L.; Miller, G.M. Advances in tryptophan hydroxylase-2 gene expression regulation: New insights into serotonin–stress interaction and clinical implications. Am. J. Med Genet. Part B Neuropsychiatr. Genet. 2012, 159, 152–171. [Google Scholar] [CrossRef] [PubMed]
- Zill, P.; Büttner, A.; Eisenmenger, W.; Müller, J.; Möller, H.-J.; Bondy, B. Predominant expression of tryptophan hydroxylase 1 mRNA in the pituitary: A postmortem study in human brain. Neuroscience 2009, 159, 1274–1282. [Google Scholar] [CrossRef]
- Zill, P.; Büttner, A.; Eisenmenger, W.; Möller, H.-J.; Ackenheil, M.; Bondy, B. Analysis of tryptophan hydroxylase I and II mRNA expression in the human brain: A post-mortem study. J. Psychiatr. Res. 2007, 41, 168–173. [Google Scholar] [CrossRef]
- Kawabata-Sakata, Y.; Nishiike, Y.; Fleming, T.; Kikuchi, Y.; Okubo, K. Androgen-dependent sexual dimorphism in pituitary tryptophan hydroxylase expression: Relevance to sex differences in pituitary hormones. Proc. R. Soc. B 2020, 287, 20200713. [Google Scholar] [CrossRef] [PubMed]
- Ali, A.T.; Hochfeld, W.E.; Myburgh, R.; Pepper, M.S. Adipocyte and adipogenesis. Eur. J. Cell Biol. 2013, 92, 229–236. [Google Scholar] [CrossRef] [PubMed]
- Yang, J.; Li, X.; Xu, D. Research Progress on the Involvement of ANGPTL4 and Loss-of-Function Variants in Lipid Metabolism and Coronary Heart Disease: Is the “Prime Time” of ANGPTL4-Targeted Therapy for Coronary Heart Disease Approaching? Cardiovasc. Drugs Ther. 2020, 1–11. [Google Scholar] [CrossRef]
- Bruce, K.D.; Zsombok, A.; Eckel, R.H. Lipid processing in the brain: A key regulator of systemic metabolism. Front. Endocrinol. 2017, 8, 60. [Google Scholar] [CrossRef]
- Terry, N.; Margolis, K.G. Serotonergic mechanisms regulating the GI tract: Experimental evidence and therapeutic relevance. In Gastrointestinal Pharmacology; Springer: Berlin/Heidelberg, Germany, 2016; pp. 319–342. [Google Scholar]
- Yadav, V.K.; Balaji, S.; Suresh, P.S.; Liu, X.S.; Lu, X.; Li, Z.; Guo, X.E.; Mann, J.J.; Balapure, A.K.; Gershon, M.D. Pharmacological inhibition of gut-derived serotonin synthesis is a potential bone anabolic treatment for osteoporosis. Nat. Med. 2010, 16, 308. [Google Scholar] [CrossRef]
- Kim, K.; Oh, C.-M.; Ohara-Imaizumi, M.; Park, S.; Namkung, J.; Yadav, V.K.; Tamarina, N.A.; Roe, M.W.; Philipson, L.H.; Karsenty, G. Functional role of serotonin in insulin secretion in a diet-induced insulin-resistant state. Endocrinology 2015, 156, 444–452. [Google Scholar] [CrossRef] [PubMed]
- Ahlman, H.; Nilsson, O. The gut as the largest endocrine organ in the body. Ann. Oncol. 2001, 12, S63–S68. [Google Scholar] [CrossRef]
- Chen, C.; Fang, R.; Davis, C.; Maravelias, C.; Sibley, E. Pdx1 inactivation restricted to the intestinal epithelium in mice alters duodenal gene expression in enterocytes and enteroendocrine cells. Am. J. Physiol. -Gastrointest. Liver Physiol. 2009, 297, G1126–G1137. [Google Scholar] [CrossRef] [PubMed]
- Jenny, M.; Uhl, C.; Roche, C.; Duluc, I.; Guillermin, V.; Guillemot, F.; Jensen, J.; Kedinger, M.; Gradwohl, G. Neurogenin3 is differentially required for endocrine cell fate specification in the intestinal and gastric epithelium. EMBO J. 2002, 21, 6338–6347. [Google Scholar] [CrossRef] [PubMed]
- Jančík, S.; Drábek, J.; Radzioch, D.; Hajdúch, M. Clinical relevance of KRAS in human cancers. J. Biomed. Biotechnol. 2010, 2010, 150960. [Google Scholar] [CrossRef]
- Carvalho, P.D.; Guimarães, C.F.; Cardoso, A.P.; Mendonça, S.; Costa, Â.M.; Oliveira, M.J.; Velho, S. KRAS oncogenic signaling extends beyond cancer cells to orchestrate the microenvironment. Cancer Res. 2018, 78, 7–14. [Google Scholar] [CrossRef] [PubMed]
- Wan, X.-B.; Wang, A.-Q.; Cao, J.; Dong, Z.-C.; Li, N.; Yang, S.; Sun, M.-M.; Li, Z.; Luo, S.-X. Relationships among KRAS mutation status, expression of RAS pathway signaling molecules, and clinicopathological features and prognosis of patients with colorectal cancer. World J. Gastroenterol. 2019, 25, 808. [Google Scholar] [CrossRef] [PubMed]
- Kannen, V.; Bader, M.; Sakita, J.Y.; Uyemura, S.A.; Squire, J.A. The dual role of serotonin in colorectal cancer. Trends Endocrinol. Metab. 2020. [Google Scholar] [CrossRef] [PubMed]
- Tutton, P.; Barkla, D. The influence of serotonin on the mitotic rate in the colonic crypt epithelium and in colonic adenocarcinoma in rats. Clin. Exp. Pharmacol. Physiol. 1978, 5, 91–94. [Google Scholar] [CrossRef]
- Ballou, Y.; Rivas, A.; Belmont, A.; Patel, L.; Amaya, C.N.; Lipson, S.; Khayou, T.; Dickerson, E.B.; Nahleh, Z.; Bryan, B.A. 5-HT serotonin receptors modulate mitogenic signaling and impact tumor cell viability. Mol. Clin. Oncol. 2018, 9, 243–254. [Google Scholar] [CrossRef]
- Ono, K.; Horie, T.; Abe, Y.; Kawamura, T.; Shimatsu, A.; Hasegawa, K.; Kita, T. Adipocyte-derived Serotonin Regulates Adipocyte Differentiation Via an Autocrine/Paracrine Mechanism. J. Card. Fail. 2006, 12, S171. [Google Scholar] [CrossRef]
- Oguri, M.; Kato, K.; Horibe, H.; Fujimaki, T.; Sakuma, J.; Takeuchi, I.; Murohara, T.; Yasukochi, Y.; Yamada, Y. Identification of two genes as novel susceptibility loci for type 2 diabetes mellitus in Japanese. Eur. Heart J. 2020, 41, ehaa946. 2813. [Google Scholar] [CrossRef]
- Zegers, D.; Beckers, S.; Hendrickx, R.; Van Camp, J.; De Craemer, V.; Verrijken, A.; Van Hoorenbeeck, K.; Verhulst, S.; Rooman, R.; Desager, K. Mutation screen of the SIM1 gene in pediatric patients with early-onset obesity. Int. J. Obes. 2014, 38, 1000–1004. [Google Scholar] [CrossRef] [PubMed]
- Moon, J.H.; Kim, H.; Kim, H.; Park, J.; Choi, W.; Choi, W.; Hong, H.J.; Ro, H.-J.; Jun, S.; Choi, S.H. Lactation improves pancreatic β cell mass and function through serotonin production. Sci. Transl. Med. 2020, 12, eaay0455. [Google Scholar] [CrossRef]
- Sun, C.; Kilburn, D.; Lukashin, A.; Crowell, T.; Gardner, H.; Brundiers, R.; Diefenbach, B.; Carulli, J.P. Kirrel2, a novel immunoglobulin superfamily gene expressed primarily in β cells of the pancreatic islets☆. Genomics 2003, 82, 130–142. [Google Scholar] [CrossRef]
- Yesildag, B.; Bock, T.; Herrmanns, K.; Wollscheid, B.; Stoffel, M. Kin of IRRE-like protein 2 is a phosphorylated glycoprotein that regulates basal insulin secretion. J. Biol. Chem. 2015, 290, 25891–25906. [Google Scholar] [CrossRef] [PubMed]
- Fanibunda, S.E.; Deb, S.; Maniyadath, B.; Tiwari, P.; Ghai, U.; Gupta, S.; Figueiredo, D.; Weisstaub, N.; Gingrich, J.A.; Vaidya, A.D. Serotonin regulates mitochondrial biogenesis and function in rodent cortical neurons via the 5-HT2A receptor and SIRT1–PGC-1α axis. Proc. Natl. Acad. Sci. USA 2019, 116, 11028–11037. [Google Scholar] [CrossRef]
- Sola-Penna, M.; Paixão, L.P.; Branco, J.R.; Ochioni, A.C.; Albanese, J.M.; Mundim, D.M.; Baptista-de-Souza, D.; Figueiredo, C.P.; Coelho, W.S.; Marcondes, M.C. Serotonin activates glycolysis and mitochondria biogenesis in human breast cancer cells through activation of the Jak1/STAT3/ERK1/2 and adenylate cyclase/PKA, respectively. Br. J. Cancer 2020, 122, 194–208. [Google Scholar] [CrossRef]
- Wang, Q.; Zhang, H.; Xu, H.; Guo, D.; Shi, H.; Li, Y.; Zhang, W.; Gu, Y. 5-HTR3 and 5-HTR4 located on the mitochondrial membrane and functionally regulated mitochondrial functions. Sci. Rep. 2016, 6, 37336. [Google Scholar] [CrossRef] [PubMed]
- Yang, Y.; Huang, H.; Xu, Z.; Duan, J.-k. Serotonin and its receptor as a new antioxidant therapeutic target for diabetic kidney disease. J. Diabetes Res. 2017, 2017, 7680576. [Google Scholar] [CrossRef]
- Muñoz-Castañeda, J.R.; Montilla, P.; Padillo, F.J.; Bujalance, I.; Muñoz, M.C.; Muntané, J.; Túnez, I. Role of serotonin in cerebral oxidative stress in rats. Acta Neurobiol. Exp. 2006, 66, 1–6. [Google Scholar]
- Berendzen, K.M.; Durieux, J.; Shao, L.-W.; Tian, Y.; Kim, H.-e.; Wolff, S.; Liu, Y.; Dillin, A. Neuroendocrine coordination of mitochondrial stress signaling and proteostasis. Cell 2016, 166, 1553–1563. e1510. [Google Scholar] [CrossRef]
- Zhang, Q.; Wu, X.; Chen, P.; Liu, L.; Xin, N.; Tian, Y.; Dillin, A. The mitochondrial unfolded protein response is mediated cell-non-autonomously by retromer-dependent Wnt signaling. Cell 2018, 174, 870–883. e817. [Google Scholar] [CrossRef]
- Yano, J.M.; Yu, K.; Donaldson, G.P.; Shastri, G.G.; Ann, P.; Ma, L.; Nagler, C.R.; Ismagilov, R.F.; Mazmanian, S.K.; Hsiao, E.Y. Indigenous bacteria from the gut microbiota regulate host serotonin biosynthesis. Cell 2015, 161, 264–276. [Google Scholar] [CrossRef] [PubMed]
- Kwon, Y.H.; Wang, H.; Denou, E.; Ghia, J.-E.; Rossi, L.; Fontes, M.E.; Bernier, S.P.; Shajib, M.S.; Banskota, S.; Collins, S.M. Modulation of gut microbiota composition by serotonin signaling influences intestinal immune response and susceptibility to colitis. Cell. Mol. Gastroenterol. Hepatol. 2019, 7, 709–728. [Google Scholar] [CrossRef] [PubMed]
- Väremo, L.; Nielsen, J.; Nookaew, I. Enriching the gene set analysis of genome-wide data by incorporating directionality of gene expression and combining statistical hypotheses and methods. Nucleic Acids Res. 2013, 41, 4378–4391. [Google Scholar] [CrossRef] [PubMed]
- Malandrino, M.I.; Fucho, R.; Weber, M.; Calderon-Dominguez, M.; Mir, J.F.; Valcarcel, L.; Escoté, X.; Gómez-Serrano, M.; Peral, B.; Salvadó, L. Enhanced fatty acid oxidation in adipocytes and macrophages reduces lipid-induced triglyceride accumulation and inflammation. Am. J. Physiol. Endocrinol. Metab. 2015, 308, E756–E769. [Google Scholar] [CrossRef] [PubMed]
- Serra, D.; Mera, P.; Malandrino, M.I.; Mir, J.F.; Herrero, L. Mitochondrial fatty acid oxidation in obesity. Antioxid. Redox Signal. 2013, 19, 269–284. [Google Scholar] [CrossRef] [PubMed]
- Bruce, C.R.; Thrush, A.B.; Mertz, V.A.; Bezaire, V.; Chabowski, A.; Heigenhauser, G.J.; Dyck, D.J. Endurance training in obese humans improves glucose tolerance and mitochondrial fatty acid oxidation and alters muscle lipid content. Am. J. Physiol. Endocrinol. Metab. 2006, 291, E99–E107. [Google Scholar] [CrossRef]
- Fumagalli, M.; Lecca, D.; Abbracchio, M.P.; Ceruti, S. Pathophysiological role of purines and pyrimidines in neurodevelopment: Unveiling new pharmacological approaches to congenital brain diseases. Front. Pharmacol. 2017, 8, 941. [Google Scholar] [CrossRef]
- Ipata, P.L. Origin, utilization, and recycling of nucleosides in the central nervous system. Adv. Physiol. Educ. 2011, 35, 342–346. [Google Scholar] [CrossRef] [PubMed]
- Shah, R.; Courtiol, E.; Castellanos, F.X.; Teixeira, C.M. Abnormal serotonin levels during perinatal development lead to behavioral deficits in adulthood. Front. Behav. Neurosci. 2018, 12, 114. [Google Scholar] [CrossRef] [PubMed]
- Brummelte, S.; Mc Glanaghy, E.; Bonnin, A.; Oberlander, T. Developmental changes in serotonin signaling: Implications for early brain function, behavior and adaptation. Neuroscience 2017, 342, 212–231. [Google Scholar] [CrossRef]
- Fitzgerald, L.W.; Kaplinsky, L.; Kimelberg, H.K. Serotonin metabolism by monoamine oxidase in rat primary astrocyte cultures. J. Neurochem. 1990, 55, 2008–2014. [Google Scholar] [CrossRef] [PubMed]
- Visser, A.K.; van Waarde, A.; Willemsen, A.T.; Bosker, F.J.; Luiten, P.G.; den Boer, J.A.; Kema, I.P.; Dierckx, R.A. Measuring serotonin synthesis: From conventional methods to PET tracers and their (pre) clinical implications. Eur. J. Nucl. Med. Mol. Imaging 2011, 38, 576–591. [Google Scholar] [CrossRef]
- Lee, G.S.; Simpson, C.; Sun, B.H.; Yao, C.; Foer, D.; Sullivan, B.; Matthes, S.; Alenina, N.; Belsky, J.; Bader, M. Measurement of plasma, serum, and platelet serotonin in individuals with high bone mass and mutations in LRP5. J. Bone Miner. Res. 2014, 29, 976–981. [Google Scholar] [CrossRef] [PubMed]
- Kwok, K.H.; Lam, K.S.; Xu, A. Heterogeneity of white adipose tissue: Molecular basis and clinical implications. Exp. Mol. Med. 2016, 48, e215. [Google Scholar] [CrossRef]
- Goldman, M.J.; Craft, B.; Hastie, M.; Repečka, K.; McDade, F.; Kamath, A.; Banerjee, A.; Luo, Y.; Rogers, D.; Brooks, A.N. Visualizing and interpreting cancer genomics data via the Xena platform. Nat. Biotechnol. 2020, 38, 675–678. [Google Scholar] [CrossRef]
- Subramanian, A.; Tamayo, P.; Mootha, V.K.; Mukherjee, S.; Ebert, B.L.; Gillette, M.A.; Paulovich, A.; Pomeroy, S.L.; Golub, T.R.; Lander, E.S. Gene set enrichment analysis: A knowledge-based approach for interpreting genome-wide expression profiles. Proc. Natl. Acad. Sci. USA 2005, 102, 15545–15550. [Google Scholar] [CrossRef] [PubMed]
- Sherman, B.T.; Tan, Q.; Collins, J.R.; Alvord, W.G.; Roayaei, J.; Stephens, R.; Baseler, M.W.; Lane, H.C.; Lempicki, R.A. The DAVID Gene Functional Classification Tool: A novel biological module-centric algorithm to functionally analyze large gene lists. Genome Biol. 2007, 8, R183. [Google Scholar]


Publisher’s Note: MDPI stays neutral with regard to jurisdictional claims in published maps and institutional affiliations. |
© 2021 by the authors. Licensee MDPI, Basel, Switzerland. This article is an open access article distributed under the terms and conditions of the Creative Commons Attribution (CC BY) license (http://creativecommons.org/licenses/by/4.0/).
Share and Cite
Park, S.; Kim, Y.; Lee, J.; Lee, J.Y.; Kim, H.; Lee, S.; Oh, C.-M. A Systems Biology Approach to Investigating the Interaction between Serotonin Synthesis by Tryptophan Hydroxylase and the Metabolic Homeostasis. Int. J. Mol. Sci. 2021, 22, 2452. https://doi.org/10.3390/ijms22052452
Park S, Kim Y, Lee J, Lee JY, Kim H, Lee S, Oh C-M. A Systems Biology Approach to Investigating the Interaction between Serotonin Synthesis by Tryptophan Hydroxylase and the Metabolic Homeostasis. International Journal of Molecular Sciences. 2021; 22(5):2452. https://doi.org/10.3390/ijms22052452
Chicago/Turabian StylePark, Suhyeon, Yumin Kim, Jibeom Lee, Jeong Yun Lee, Hail Kim, Sunjae Lee, and Chang-Myung Oh. 2021. "A Systems Biology Approach to Investigating the Interaction between Serotonin Synthesis by Tryptophan Hydroxylase and the Metabolic Homeostasis" International Journal of Molecular Sciences 22, no. 5: 2452. https://doi.org/10.3390/ijms22052452
APA StylePark, S., Kim, Y., Lee, J., Lee, J. Y., Kim, H., Lee, S., & Oh, C.-M. (2021). A Systems Biology Approach to Investigating the Interaction between Serotonin Synthesis by Tryptophan Hydroxylase and the Metabolic Homeostasis. International Journal of Molecular Sciences, 22(5), 2452. https://doi.org/10.3390/ijms22052452