
Gene Correction Recovers Phagocytosis in Retinal Pigment Epithelium Derived from Retinitis Pigmentosa-Human-Induced Pluripotent Stem Cells

 , ,
, ,  , and
, and 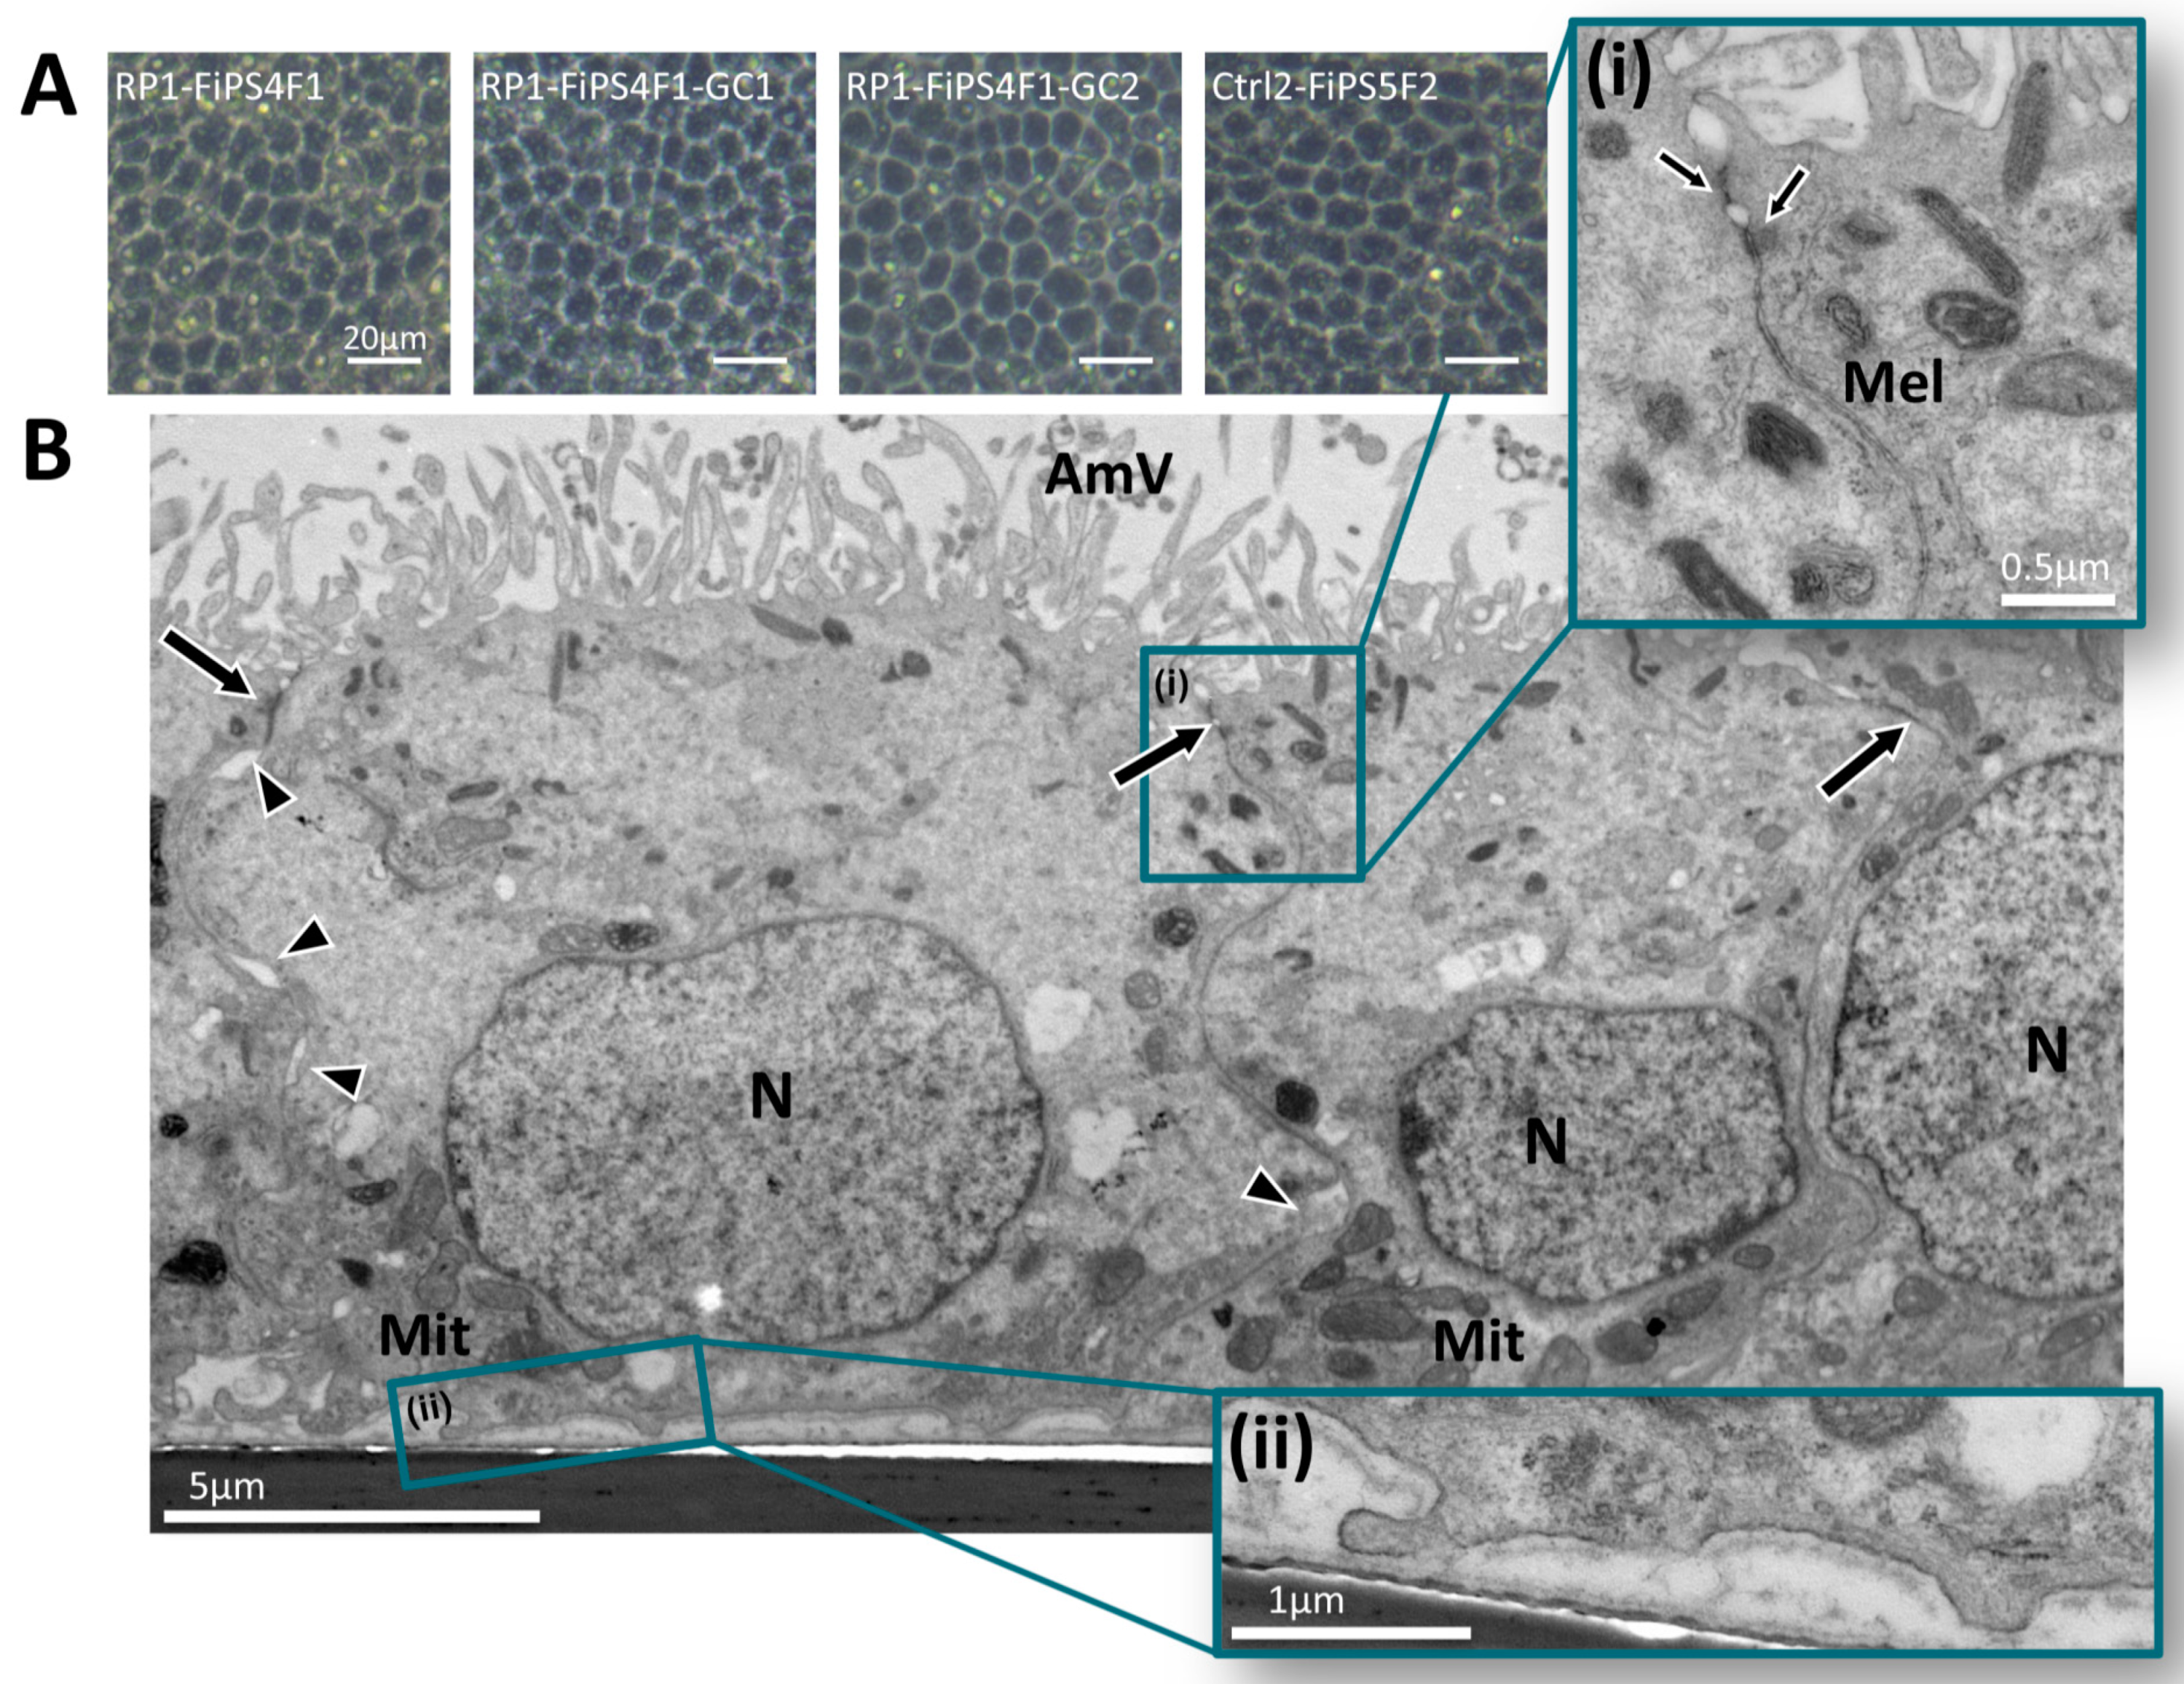
Abstract
1. Introduction
2. Results
2.1. Correction of RP-associated MERTK Gene Mutation
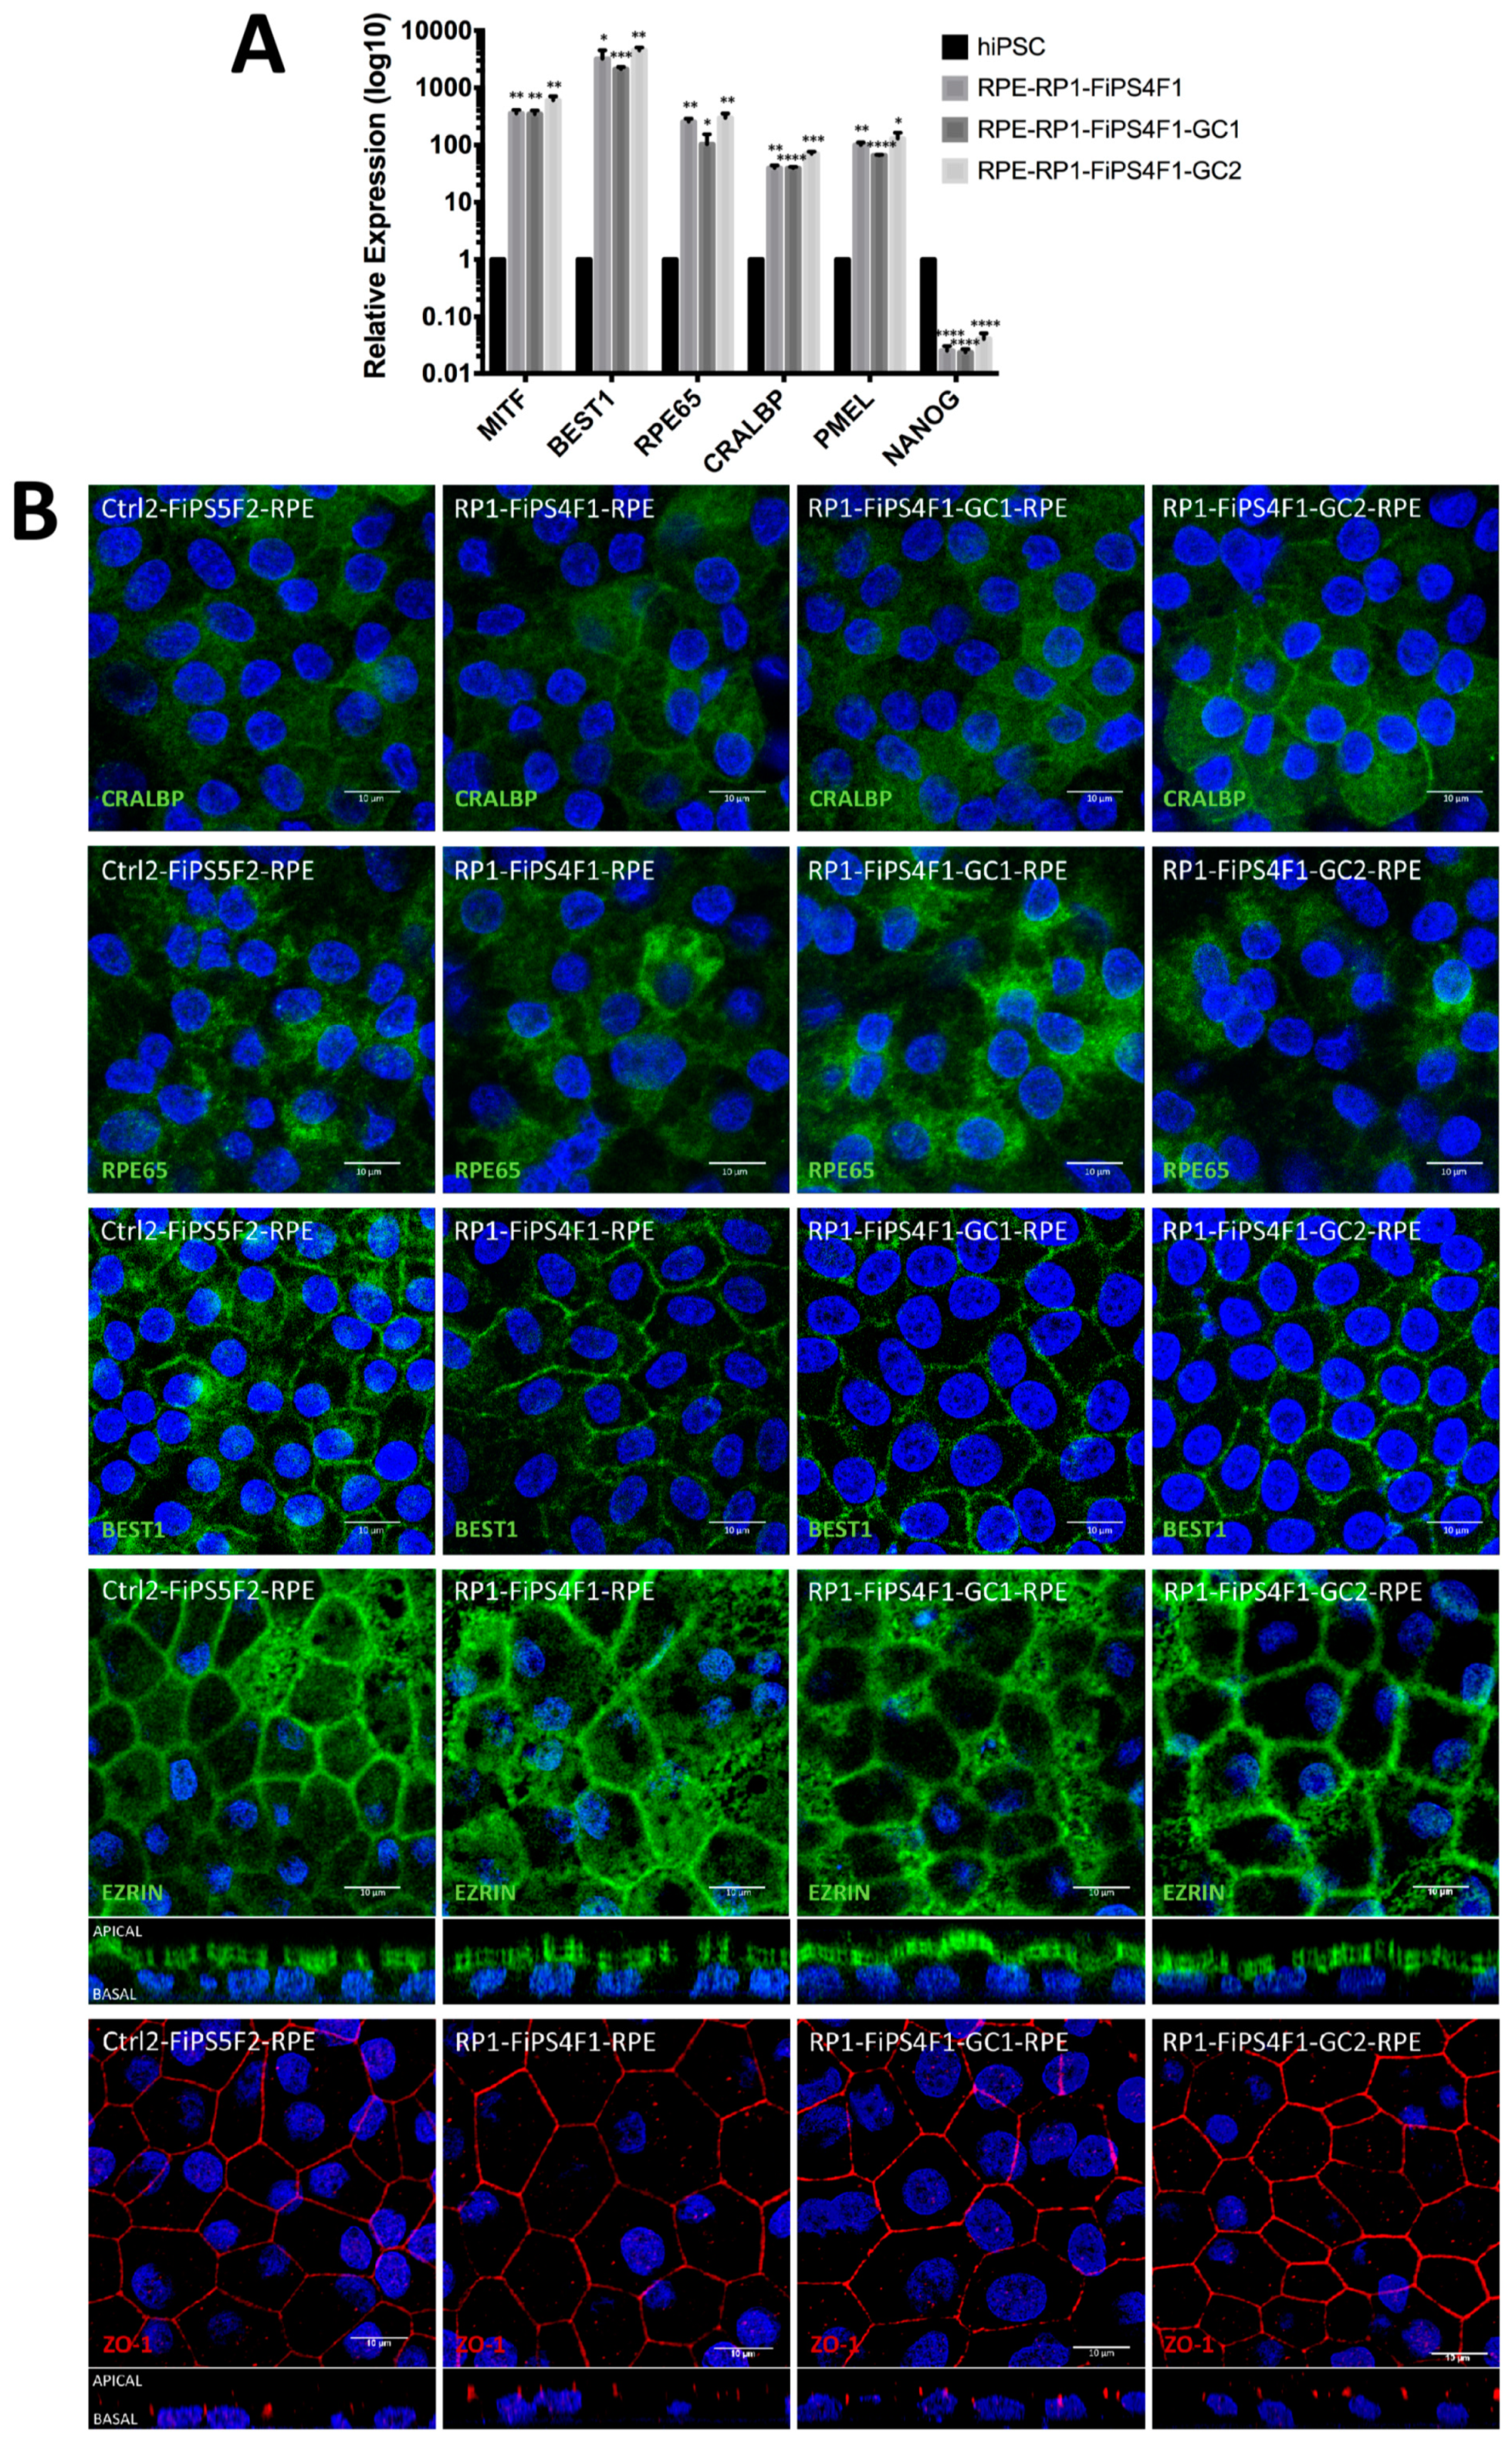
2.2. Differentiation of hiPSCs into RPE
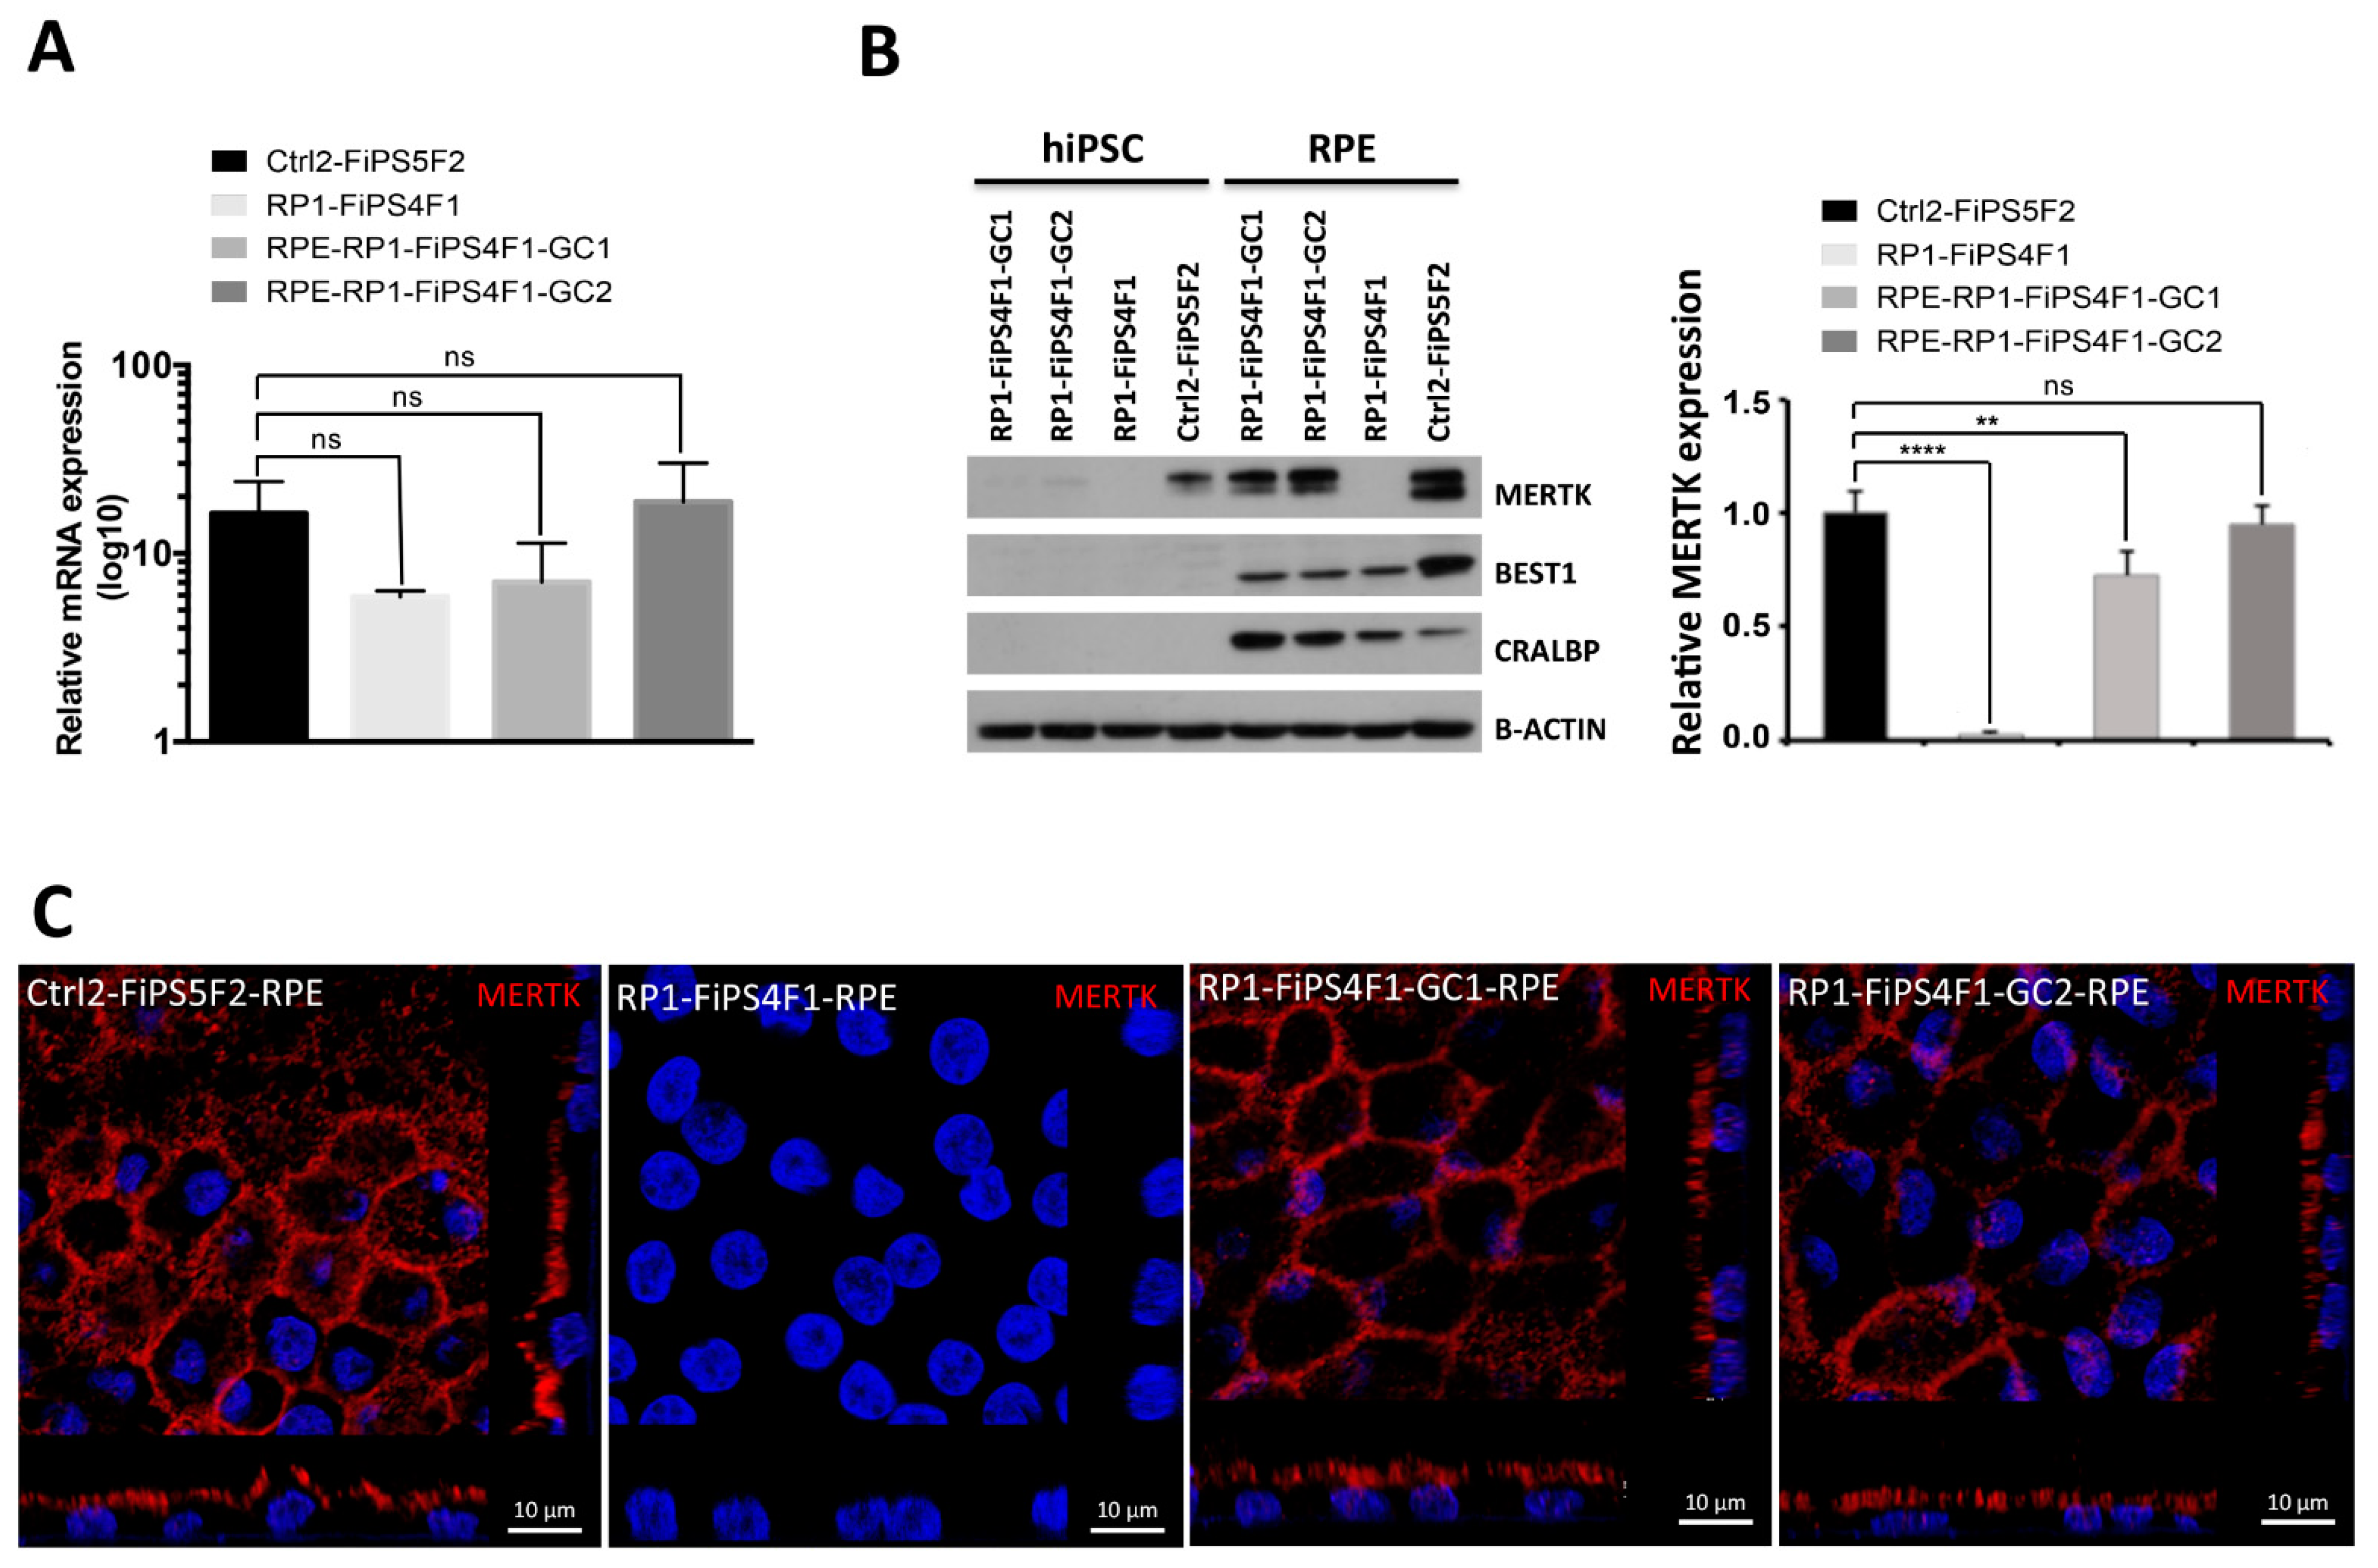
2.3. MERTK Expression in hiPSC-RPE
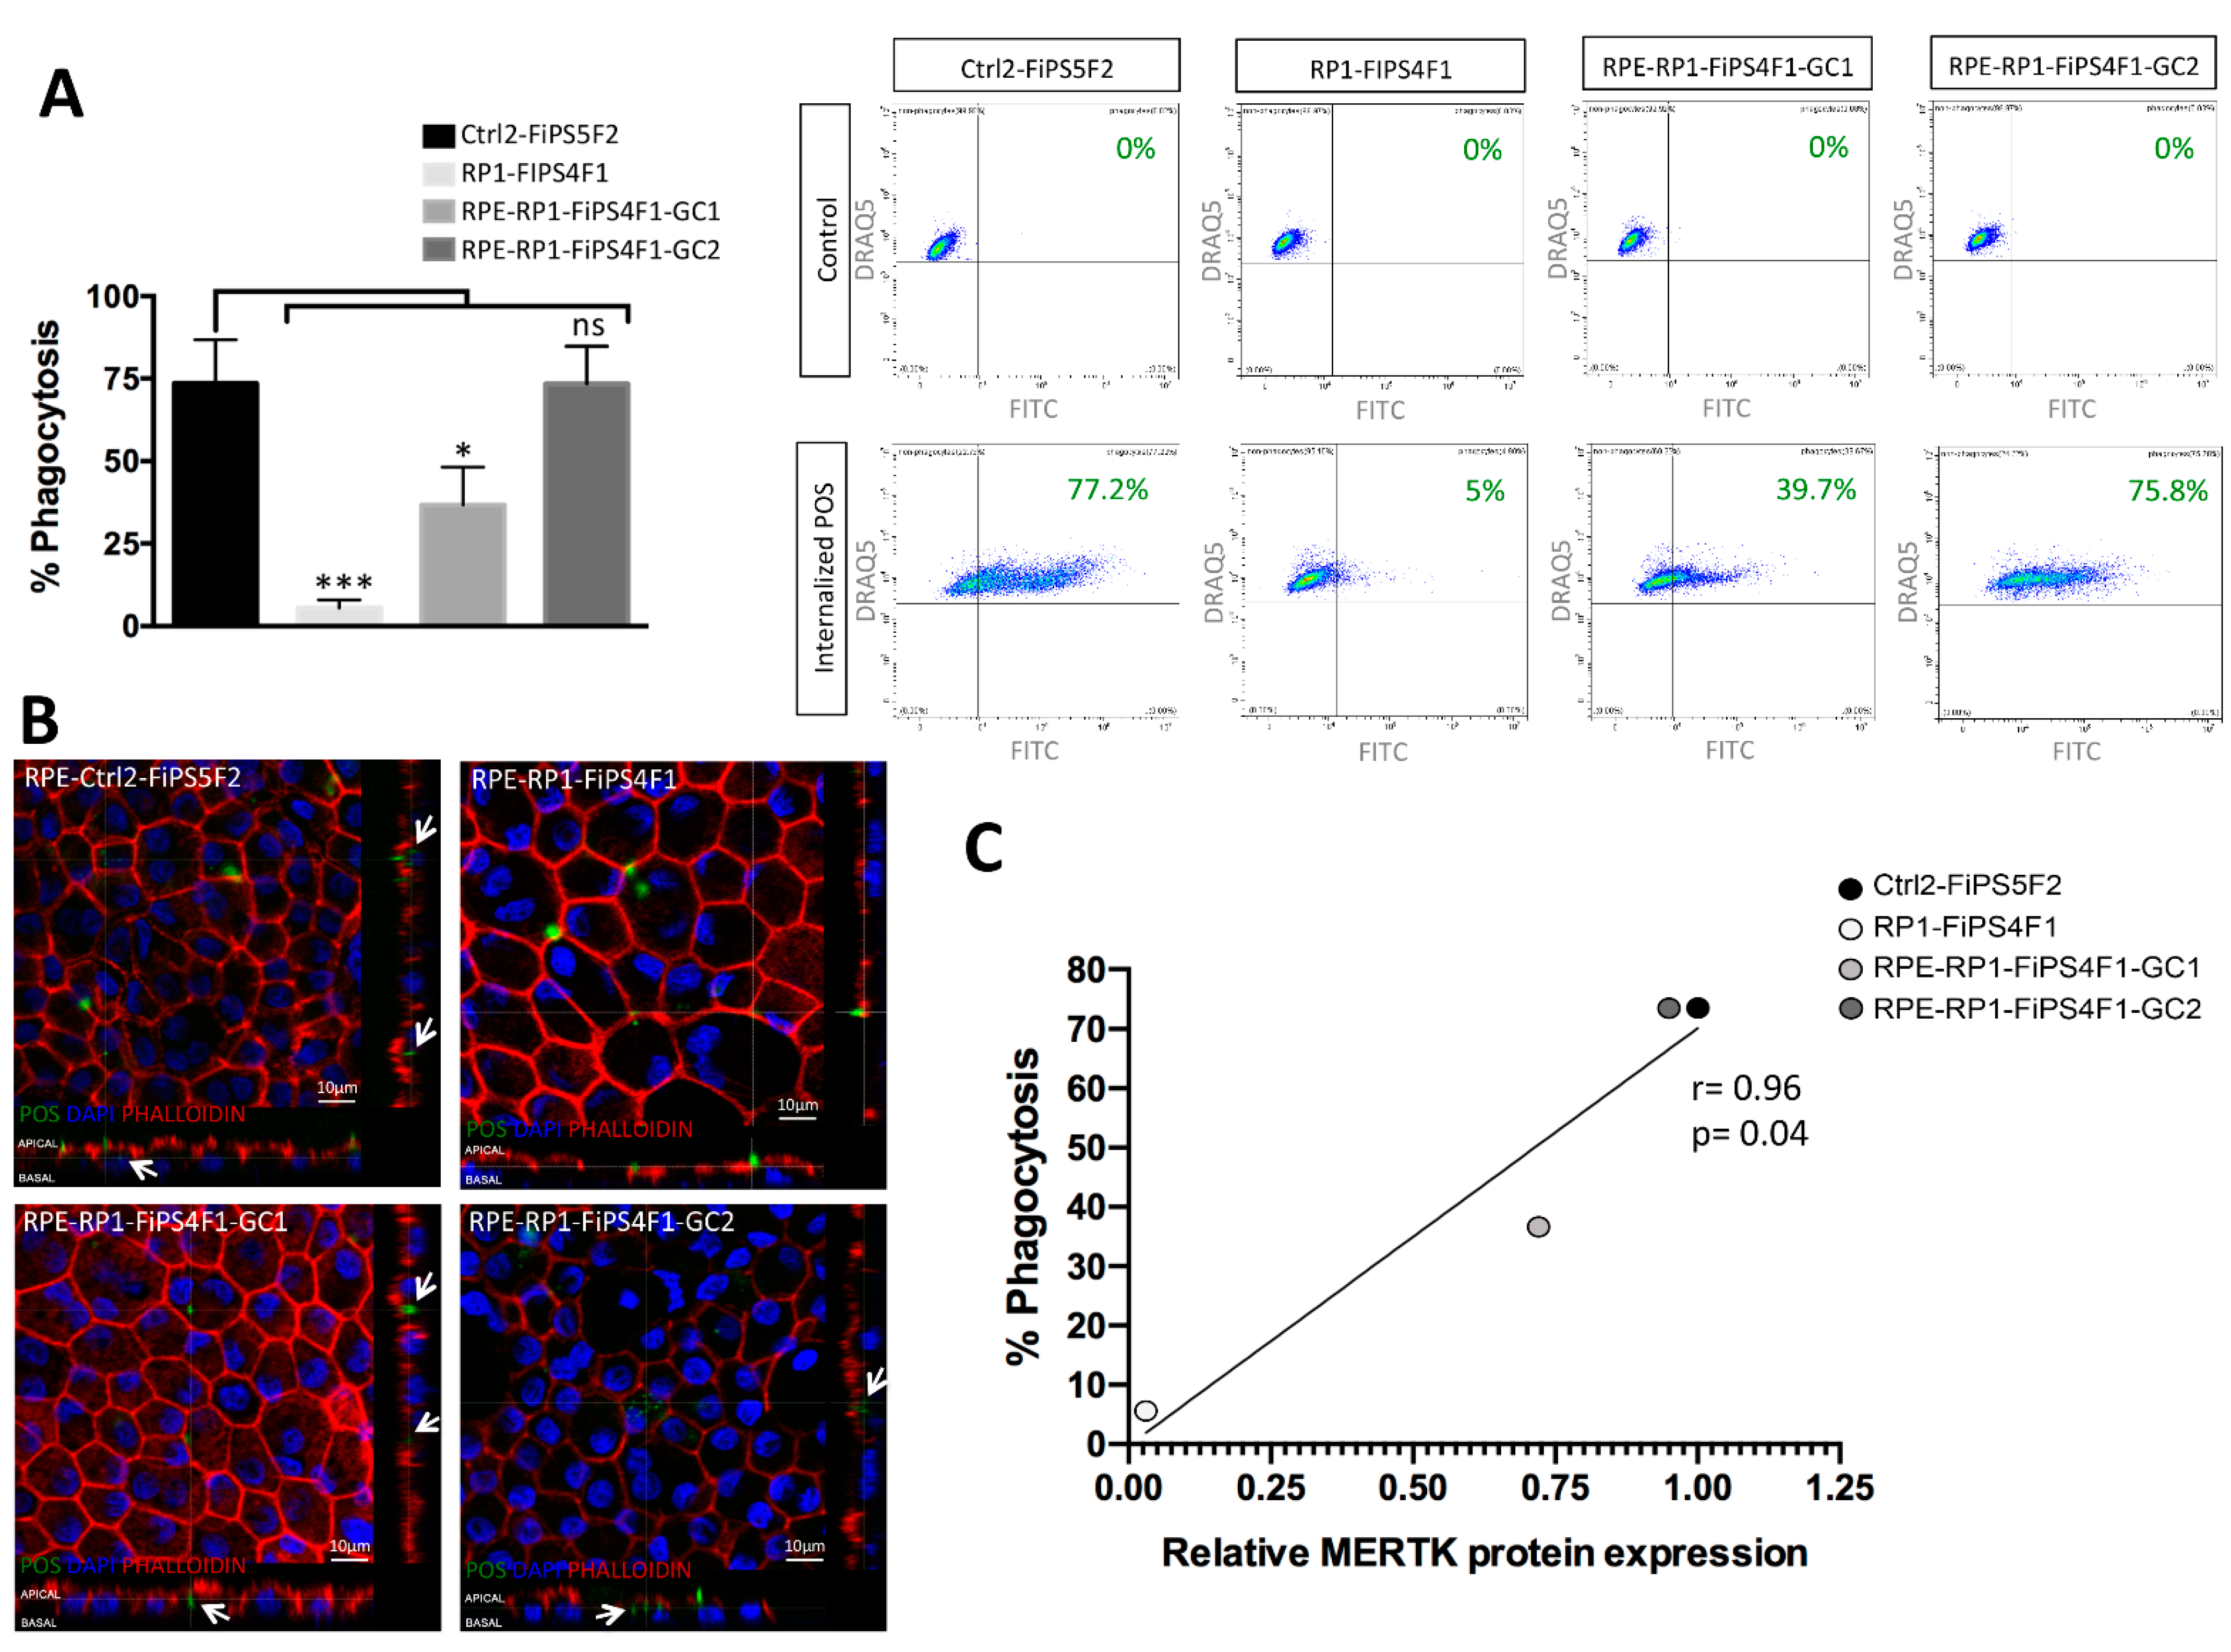
2.4. Recovery of Phagocytosis in RPE Derived from Gene-Corrected RP-hiPSCs
3. Discussion
4. Conclusions
5. Material and Methods
5.1. Maintenance of hiPSCs
5.2. Mutation Sequencing
5.3. Differentiation toward RPE
5.4. Phagocytosis Assays
5.5. Transmission Electron Microscopy
5.6. RNA Extraction and Quantitative Real-Time PCR (qRT-PCR)
5.7. Immunocytochemistry
5.8. Western Blot Analysis
5.9. Statistical Methods
Supplementary Materials
Author Contributions
Funding
Institutional Review Board Statement
Informed Consent Statement
Data Availability Statement
Conflicts of Interest
References
- Hartong, D.T.; Berson, E.L.; Dryja, T.P. Retinitis pigmentosa. Lancet 2006, 368, 1795–1809. [Google Scholar] [CrossRef]
- Thompson, D.A.; Li, Y.; McHenry, C.L.; Carlson, T.J.; Ding, X.; Sieving, P.A.; Gal, A. Mutations in the gene encoding lecithin retinol acyltransferase are associated with early-onset severe retinal dystrophy. Nat. Genet. 2001, 28, 123–124. [Google Scholar] [CrossRef] [PubMed]
- Gu, S.M.; Thompson, D.A.; Srikumari, C.S.; Lorenz, B.; Finckh, U.; Nicoletti, A.; Murthy, K.R.; Rathmann, M.; Kumaramanickavel, G.; Denton, M.J.; et al. Mutations in RPE65 cause autosomal recessive childhood-onset severe retinal dystrophy. Nat. Genet. 1997, 17, 194–197. [Google Scholar] [CrossRef]
- Sun, H.; Tsunenari, T.; Yau, K.W.; Nathans, J. The vitelliform macular dystrophy protein defines a new family of chloride channels. Proc. Natl. Acad. Sci. USA 2002, 99, 4008–4013. [Google Scholar] [CrossRef]
- Duncan, J.L.; LaVail, M.M.; Yasumura, D.; Matthes, M.T.; Yang, H.; Trautmann, N.; Chappelow, A.V.; Feng, W.; Earp, H.S.; Matsushima, G.K.; et al. An RCS-like retinal dystrophy phenotype in mer knockout mice. Investig. Ophthalmol. Vis. Sci. 2003, 44, 826–838. [Google Scholar] [CrossRef] [PubMed]
- Johnson, A.A.; Guziewicz, K.E.; Lee, C.J.; Kalathur, R.C.; Pulido, J.S.; Marmorstein, L.Y.; Marmorstein, A.D. Bestrophin 1 and retinal disease. Prog. Retin. Eye Res. 2017, 58, 45–69. [Google Scholar] [CrossRef]
- Takahashi, K.; Tanabe, K.; Ohnuki, M.; Narita, M.; Ichisaka, T.; Tomoda, K.; Yamanaka, S. Induction of pluripotent stem cells from adult human fibroblasts by defined factors. Cell 2007, 131, 861–872. [Google Scholar] [CrossRef]
- Artero Castro, A.; Lukovic, D.; Jendelova, P.; Erceg, S. Concise Review: Human Induced Pluripotent Stem Cell Models of Retinitis Pigmentosa. Stem Cells 2018, 36, 474–481. [Google Scholar] [CrossRef] [PubMed]
- Yang, L.; Yang, J.L.; Byrne, S.; Pan, J.; Church, G.M. CRISPR/Cas9-Directed Genome Editing of Cultured Cells. Curr. Protoc. Mol. Biol. 2014, 107, 31.1.1–31.1.17. [Google Scholar] [CrossRef] [PubMed]
- Bassuk, A.G.; Zheng, A.; Li, Y.; Tsang, S.H.; Mahajan, V.B. Precision Medicine: Genetic Repair of Retinitis Pigmentosa in Patient-Derived Stem Cells. Sci. Rep. 2016, 6, 19969. [Google Scholar] [CrossRef]
- D’Cruz, P.M.; Yasumura, D.; Weir, J.; Matthes, M.T.; Abderrahim, H.; LaVail, M.M.; Vollrath, D. Mutation of the receptor tyrosine kinase gene Mertk in the retinal dystrophic RCS rat. Hum. Mol. Genet. 2000, 9, 645–651. [Google Scholar] [CrossRef]
- Lukovic, D.; Castro, A.A.; Delgado, A.B.G.; Bernal, M.D.L.A.M.; Pelaez, N.L.; Lloret, A.D.; Espejo, R.P.; Kamenarova, K.; Sánchez, L.F.; Cuenca, N.; et al. Human iPSC derived disease model of MERTK-associated retinitis pigmentosa. Sci. Rep. 2015, 5, 12910. [Google Scholar] [CrossRef]
- Gal, A.; Li, Y.; Thompson, D.A.; Weir, J.; Orth, U.; Jacobson, S.G.; Apfelstedt-Sylla, E.; Vollrath, D. Mutations in MERTK, the human orthologue of the RCS rat retinal dystrophy gene, cause retinitis pigmentosa. Nat. Genet. 2000, 26, 270–271. [Google Scholar] [CrossRef] [PubMed]
- Castro, A.A.; Long, K.; Bassett, A.; Machuca, C.; Leon, M.; Avila-Fernandez, A.; Cortón, M.; Vidal-Puig, T.; Ayuso, C.; Lukovic, D.; et al. Generation of gene-corrected human induced pluripotent stem cell lines derived from retinitis pigmentosa patient with Ser331Cysfs*5 mutation in MERTK. Stem Cell Res. 2018, 34, 101341. [Google Scholar] [CrossRef] [PubMed]
- Brandl, C.; Zimmermann, S.J.; Milenkovic, V.M.; Rosendahl, S.M.; Grassmann, F.; Milenkovic, A.; Hehr, U.; Federlin, M.; Wetzel, C.H.; Helbig, H.; et al. In-depth characterisation of Retinal Pigment Epithelium (RPE) cells derived from human induced pluripotent stem cells (hiPSC). Neuromol. Med. 2014, 16, 551–564. [Google Scholar] [CrossRef]
- Khajavi, M.; Inoue, K.; Lupski, J.R. Nonsense-mediated mRNA decay modulates clinical outcome of genetic disease. Eur. J. Hum. Genet. EJHG 2006, 14, 1074–1081. [Google Scholar] [CrossRef]
- Carr, A.J.; Vugler, A.; Lawrence, J.; Chen, L.L.; Ahmado, A.; Chen, F.K.; Semo, M.; Gias, C.; da Cruz, L.; Moore, H.D.; et al. Molecular characterization and functional analysis of phagocytosis by human embryonic stem cell-derived RPE cells using a novel human retinal assay. Mol. Vis. 2009, 15, 283–295. [Google Scholar] [PubMed]
- Carr, A.J.; Vugler, A.A.; Hikita, S.T.; Lawrence, J.M.; Gias, C.; Chen, L.L.; Buchholz, D.E.; Ahmado, A.; Semo, M.; Smart, M.J.K.; et al. Protective effects of human iPS-derived retinal pigment epithelium cell transplantation in the retinal dystrophic rat. PLoS ONE 2009, 4, e8152. [Google Scholar] [CrossRef]
- Westenskow, P.D.; Moreno, S.K.; Krohne, T.U.; Kurihara, T.; Zhu, S.; Zhang, Z.N.; Zhao, T.; Xu, Y.; Ding, S.; Friedlander, M. Using flow cytometry to compare the dynamics of photoreceptor outer segment phagocytosis in iPS-derived RPE cells. Investig. Ophthalmol. Vis. Sci. 2012, 53, 6282–6290. [Google Scholar] [CrossRef]
- Mehat, M.S.; Sundaram, V.; Ripamonti, C.; Robson, A.G.; Smith, A.J.; Borooah, S.; Robinson, M.; Rosenthal, A.N.; Innes, W.; Weleber, R.G.; et al. Transplantation of Human Embryonic Stem Cell-Derived Retinal Pigment Epithelial Cells in Macular Degeneration. Ophthalmology 2018, 125, 1765–1775. [Google Scholar] [CrossRef]
- Mandai, M.; Kurimoto, Y.; Takahashi, M. Autologous Induced Stem-Cell-Derived Retinal Cells for Macular Degeneration. N. Engl. J. Med. 2017, 377, 792–793. [Google Scholar] [CrossRef]
- Cho, G.Y.; Abdulla, Y.; Sengillo, J.D.; Justus, S.; Schaefer, K.A.; Bassuk, A.G.; Tsang, S.H.; Mahajan, V.B. CRISPR-mediated Ophthalmic Genome Surgery. Curr. Ophthalmol. Rep. 2017, 5, 199–206. [Google Scholar] [CrossRef]
- Ghazi, N.G.; Abboud, E.B.; Nowilaty, S.R.; Alkuraya, H.; Alhommadi, A.; Cai, H.; Hou, R.; Deng, W.-T.; Boye, S.L.; Almaghamsi, A.; et al. Treatment of retinitis pigmentosa due to MERTK mutations by ocular subretinal injection of adeno-associated virus gene vector: Results of a phase I trial. Hum. Genet. 2016, 135, 327–343. [Google Scholar] [CrossRef] [PubMed]
- Ramsden, C.M.; Nommiste, B.; Lane, A.R.; Carr, A.J.F.; Powner, M.B.; Smart, M.J.; Chen, L.L.; Muthiah, M.N.; Webster, A.R.; Moore, A.T.; et al. Rescue of the MERTK phagocytic defect in a human iPSC disease model using translational read-through inducing drugs. Sci. Rep. 2017, 7, 51. [Google Scholar] [CrossRef] [PubMed]
- Suzuki, K.; Tsunekawa, Y.; Hernandez-Benitez, R.; Wu, J.; Zhu, J.; Kim, E.J.; Hatanaka, F.; Yamamoto, M.; Araoka, T.; Li, Z.; et al. In vivo genome editing via CRISPR/Cas9 mediated homology-independent targeted integration. Nature 2016, 540, 144–149. [Google Scholar] [CrossRef]
- Artero Castro, A.; Leon, M.; Del Buey Furio, V.; Erceg, S.; Lukovic, D. Generation of a human iPSC line by mRNA reprogramming. Stem Cell Res. 2018, 28, 157–160. [Google Scholar] [CrossRef] [PubMed]


Publisher’s Note: MDPI stays neutral with regard to jurisdictional claims in published maps and institutional affiliations. |
© 2021 by the authors. Licensee MDPI, Basel, Switzerland. This article is an open access article distributed under the terms and conditions of the Creative Commons Attribution (CC BY) license (http://creativecommons.org/licenses/by/4.0/).
Share and Cite
Artero-Castro, A.; Long, K.; Bassett, A.; Ávila-Fernandez, A.; Cortón, M.; Vidal-Puig, A.; Jendelova, P.; Rodriguez-Jimenez, F.J.; Clemente, E.; Ayuso, C.; et al. Gene Correction Recovers Phagocytosis in Retinal Pigment Epithelium Derived from Retinitis Pigmentosa-Human-Induced Pluripotent Stem Cells. Int. J. Mol. Sci. 2021, 22, 2092. https://doi.org/10.3390/ijms22042092
Artero-Castro A, Long K, Bassett A, Ávila-Fernandez A, Cortón M, Vidal-Puig A, Jendelova P, Rodriguez-Jimenez FJ, Clemente E, Ayuso C, et al. Gene Correction Recovers Phagocytosis in Retinal Pigment Epithelium Derived from Retinitis Pigmentosa-Human-Induced Pluripotent Stem Cells. International Journal of Molecular Sciences. 2021; 22(4):2092. https://doi.org/10.3390/ijms22042092
Chicago/Turabian StyleArtero-Castro, Ana, Kathleen Long, Andrew Bassett, Almudena Ávila-Fernandez, Marta Cortón, Antonio Vidal-Puig, Pavla Jendelova, Francisco Javier Rodriguez-Jimenez, Eleonora Clemente, Carmen Ayuso, and et al. 2021. "Gene Correction Recovers Phagocytosis in Retinal Pigment Epithelium Derived from Retinitis Pigmentosa-Human-Induced Pluripotent Stem Cells" International Journal of Molecular Sciences 22, no. 4: 2092. https://doi.org/10.3390/ijms22042092
APA StyleArtero-Castro, A., Long, K., Bassett, A., Ávila-Fernandez, A., Cortón, M., Vidal-Puig, A., Jendelova, P., Rodriguez-Jimenez, F. J., Clemente, E., Ayuso, C., & Erceg, S. (2021). Gene Correction Recovers Phagocytosis in Retinal Pigment Epithelium Derived from Retinitis Pigmentosa-Human-Induced Pluripotent Stem Cells. International Journal of Molecular Sciences, 22(4), 2092. https://doi.org/10.3390/ijms22042092