Article

De Novo Transcriptome Assembly of Two Microsorum Fern Species Identifies Enzymes Required for Two Upstream Pathways of Phytoecdysteroids

1
Department of Botany, Faculty of Liberal Arts and Science, Kasetsart University Kamphaeng Saen Campus, Nakhon Pathom 73140, Thailand
2
Department of Plant Medicals, Andong National University, Andong 36729, Korea
3
Research Institute of Agriculture and Life Sciences, College of Agriculture and Life Sciences, Seoul National University, Seoul 08826, Korea
4
Department of Integrative Biotechnology, Sungkyunkwan University, Suwon 16419, Korea
*
Authors to whom correspondence should be addressed.
These authors contributed equally to this work.
Int. J. Mol. Sci. 2021, 22(4), 2085; https://doi.org/10.3390/ijms22042085
Submission received: 21 January 2021 / Revised: 14 February 2021 / Accepted: 15 February 2021 / Published: 19 February 2021
(This article belongs to the Section Molecular Plant Sciences)

Abstract

:
Microsorum species produce a high amount of phytoecdysteroids (PEs), which are widely used in traditional medicine in the Pacific islands. The PEs in two different Microsorum species, M. punctatum (MP) and M. scolopendria (MS), were examined using high-performance liquid chromatography (HPLC). In particular, MS produces a high amount of 20-hydroxyecdysone, which is the main active compound in PEs. To identify genes for PE biosynthesis, we generated reference transcriptomes from sterile frond tissues using the NovaSeq 6000 system. De novo transcriptome assembly after deleting contaminants resulted in 57,252 and 54,618 clean transcripts for MP and MS, respectively. The clean Microsorum transcripts for each species were annotated according to gene ontology terms, UniProt pathways, and the clusters of the orthologous group protein database using the MEGAN6 and Sma3s programs. In total, 1852 and 1980 transcription factors were identified for MP and MS, respectively. We obtained transcripts encoding for 38 and 32 enzymes for MP and MS, respectively, potentially involved in mevalonate and sterol biosynthetic pathways, which produce precursors for PE biosynthesis. Phylogenetic analyses revealed many redundant and unique enzymes between the two species. Overall, this study provides two Microsorum reference transcriptomes that might be useful for further studies regarding PE biosynthesis in Microsorum species.

1. Introduction

Species in the fern genus Microsorum in the family Polypodiaceae are major medicinal plants in Polynesian cultures [1]. In particular, the fronds and the rhizomes of Microsorum have been widely used as traditional remedies for pneumonia, gonorrhea, dislocations, and fractures and have antibacterial, analgesic, and anti-inflammatory properties [2,3,4,5].
Microsorum species produce a huge amount of phytoecdysteroids (PEs), which are bioactive compounds composed of 20-hydroxyecdysone, ecdysone, inokosterone, 2-deoxyecdysone, 2-deoxy-20-hydroxyecdysone, makisterone A, and makisterone C [6]. PEs control arthropod development and reproduction [7,8]. In addition, PEs resemble the brassinosteroids of plants in chemical structure, which are weak ecdysteroid antagonists in insects [9,10]. For example, plant-parasitic nematodes showed abnormal molting, immobility, reduced invasion, impaired development, and ultimately death after treatment with 20-hydroxyecdysone [11,12]. Furthermore, PE ingestion has been shown to promote growth in sheep and quail [13,14] and to stimulate carbohydrate metabolism and reduce rat hypoglycemia [15]. In addition, PEs are consumed as pseudosteroidal muscle enhancers by weightlifters and bodybuilders [5,16,17]. Currently, there are more than 140 dietary supplements containing PEs [6].
Previous studies demonstrated that the number of accumulated PEs was different among different Microsorum species [6,18,19]. It seems that the difference in the production of PEs in different Microsorum species might be caused by different genetic backgrounds. Although PEs are applied in diverse areas such as agriculture, food, and the pharmaceutical industry, knowledge of PE biosynthesis and regulatory mechanisms is limited due to the lack of genomic information in plants producing PEs [18].
Ferns are a type of vascular plant that produce spores in alternating gametophyte and sporophyte generations [20]. Although ferns are an important plant group, along with bryophytes, lycophytes, and gymnosperms, the available genomic information for ferns is limited because of their large genome, with an average size of 12 GB [21]. Recently, the genomes of two fern species, Azolla filiculoides and Salvinia cucullata, with relatively small genome sizes, were sequenced to elucidate land-plant evolution [22]. De novo transcriptome assembly based on RNA sequencing (RNA-Seq) allows us to generate reference transcriptomes for nonmodel plants, which facilitate the identification of new genes involved in various biological processes [23,24].
To date, many fern transcriptomes are currently available. For example, gene expression profiles between gametophyte and sporophyte phases in the Polypodium amorphum [25], transcriptomes for different developmental stages of sporangia in Dryopteris fragrans, and the root transcriptome of Pteris vittata, which is a hyperaccumulator of arsenic (As), have all been examined. In addition, many transcriptome studies have revealed the phylogeny and evolution of ferns [26,27,28].
In the present study, we examined PE compounds in two different Microsorum species based on high-performance liquid chromatography (HPLC). To identify genes for PE biosynthesis, we generated reference transcriptomes for the two Microsorum species using the NovaSeq 6000 system. Moreover, we identified several transcripts encoding for enzymes in MP and MS that were potentially involved in the mevalonate (MVA) and sterol biosynthetic pathways, which produce precursors for PE biosynthesis. In summary, we provided two Microsorum reference transcriptomes, which can be applied for the identification of genes or enzymes involved in PE biosynthesis.

2. Results

2.1. Phenotypes of Two Microsorum Species

We used two different Microsorum species, M. punctatum (L.) Copel (2n = 72) and M. scolopendria (Burm. f.) Copel (2n = 72), which are abbreviated as MP and MS, respectively. MP has pale light green, leathery long fronds (leaf and stalk of fern), which are narrowly oblong to lanceolate (Figure 1a), while MS has deeply lobed leathery fronds with up to six lateral lobes that are light green in color (Figure 1b). In general, two different types of fronds can be found in Microsorum species. The sterile fronds of MP and MS do not bear sporangia, which are the cells in which spores are formed (Figure 1c,d), while the fertile fronds contain sporangia as shown in Figure 1e. In order to investigate the phylogeny of MP and MS, we generated a phylogenetic tree using chloroplast rbcL gene sequences (Figure 1f). MP and MS were in the same Microsoroid genera.

2.2. Examination of PE Compounds from Two Microsorum Species

We examined compounds of PEs in two different Microsorum species based on HPLC analysis using a crude sample (2 mg dry weight) of Microsorum sterile fronds. The HPLC results of MP extract showed peaks with the retention times of 3.283, 6.167, and 9.167 min, which indicated three major PE compounds, namely ecdysone (0.32 mg/g), 20-hydroxyecdysone (0.17 mg/g), and makisterone (0.1 mg/g), respectively (Figure 2a). By contrast, MS extract had detected peaks with the retention times of 2.733, 3.267, 5.177, and 9.283 min, which were corresponding to 2-deoxy-20-hydroxyecdysone (0.18 mg/g), ecdysone (0.06 mg/g), 20-hydroxyecdysone (1.6 mg/g), and makisterone (0.09 mg/g), respectively (Figure 2b). Except for 2-deoxy-20-hydroxyecdysone, which was only identified in MS, the other three metabolites were commonly identified in both MP and MS (Figure 2c). However, the concentration of identified metabolites was different between MP and MS. For example, ecdysone was highly enriched in MP while MS contained a large amount of 20-hydrxyecdysone (Figure 2c).

2.3. Library Preparation and RNA-Seq for the Generation of Two Microsorum Transcriptomes

The HPLC results demonstrated that the metabolites and the quantity of accumulated PEs in the two Microsorum species were different, indicating possible differences in the gene regulatory network associated with PE biosynthesis between the two species. We conducted transcriptome analyses for each species (Figure S1) to identify genes involved in PE biosynthesis in the two different Microsorum species. Frond samples from MP and MS were used for library preparation (Figure S1a) and HPLC analysis (Figure S1b). We generated a total of six libraries from the sterile frond tissues of MP and MS with three biological replicates, which were further paired-end sequenced using the NovaSeq 6000 system and resulted in 14.5 gigabytes of data (Figure S1c). The number of sequenced reads ranged from 22 to 25 million (Table 1). The GC content ranged from 47.87% to 48.9%, and the Q20 percentage ranged from 98.05% to 98.24%.

2.4. De Novo Transcriptome Assembly and Taxonomy Classification

We conducted de novo transcriptome assembly for each Microsorum species using Trinity v2.4.0 [29] with a default k-mer value of 25. Data from the three libraries for each species were subjected to de novo transcriptome assembly generating a total of 131,351 and 106,153 transcripts for MP and MS, respectively (Table 2). To remove contaminated sequences, the two assembled transcriptomes were subjected to a BLASTX search against the National Center for Biotechnology Information (NCBI) nonredundant (NR) protein database using DIAMOND [30]. Based on the BLASTX results, we deleted transcripts assigned to microorganisms and animals. Finally, we obtained 57,252 and 54,618 clean transcripts for MP and MS, respectively (Table 2). The N50 and average contig length increased after removing contaminants. For example, the average contig length for MP increased from 846 bp in the preprocessed transcriptome to 1361 bp in the postprocessed transcriptome (Table 2).
We evaluated the transcriptome completeness for two Microsorum species using BUSCO program (v2/v3) against the plant OrthoDB gene dataset. Of 1440 core plant genes, the number of core genes detected (Complete + Partial) was 1023 (71.04%) and 1037 (72.01%) for the postprocessing transcripts of MP and MS, respectively (Table 3). By contrast, the BUSCO scores were 95.7% and 94.9% for the preprocessed transcripts of MP and MS, respectively. We examined the size distribution of assembled transcripts (Figure 3a,b). Transcripts between 200 and 300 bp were dominant in both transcriptomes. The number of transcripts between 200 and 300 bp was much higher in MP (37,900 transcripts) than in MS (24,960 transcripts), and the number of transcripts that were more than 3 kb was higher in MS (6264 transcripts) compared to MP (4672 transcripts).
We analyzed the taxonomic classification for identified transcripts using the MEGAN6 program [31]. In total, 57,252 and 54,618 transcripts from MP and MS, respectively, were used for taxonomic classification. Of the 14 plant species identified, the top five plant species that accounted for more than 50% of the identified transcripts are shown in Figure 3c,d. A large number of transcripts were homologous to basal land plants including Selaginella moellendorffii (spikemoss), Marchantia polymorpha (liverwort), and Physcomitrella patens (moss). In MP, the transcripts assigned to S. moellendorffii (33%) were dominant followed by Physcomitrella patens (31%), Marchantia polymorpha (13%), and Picea sitchensis (12%) (Figure 3c). In MS, transcripts assigned to S. moellendorffii (29%) were dominant followed by Marchantia polymorpha (28%), P. patens (24%), and P. sitchensis (9%) (Figure 3d). We identified transcripts assigned to ferns including Marsilea vestita (waterclover), Dryopteris fragrans (woodfern), Ceratopteris richardii (triangle waterfern), Adiantum capillus-veneris (maidenhair fern), Pteris vittata (ladder brake fern), and Pteridium aquilinum (bracken). There were only 64 transcripts (0.1%) with no blast hits.

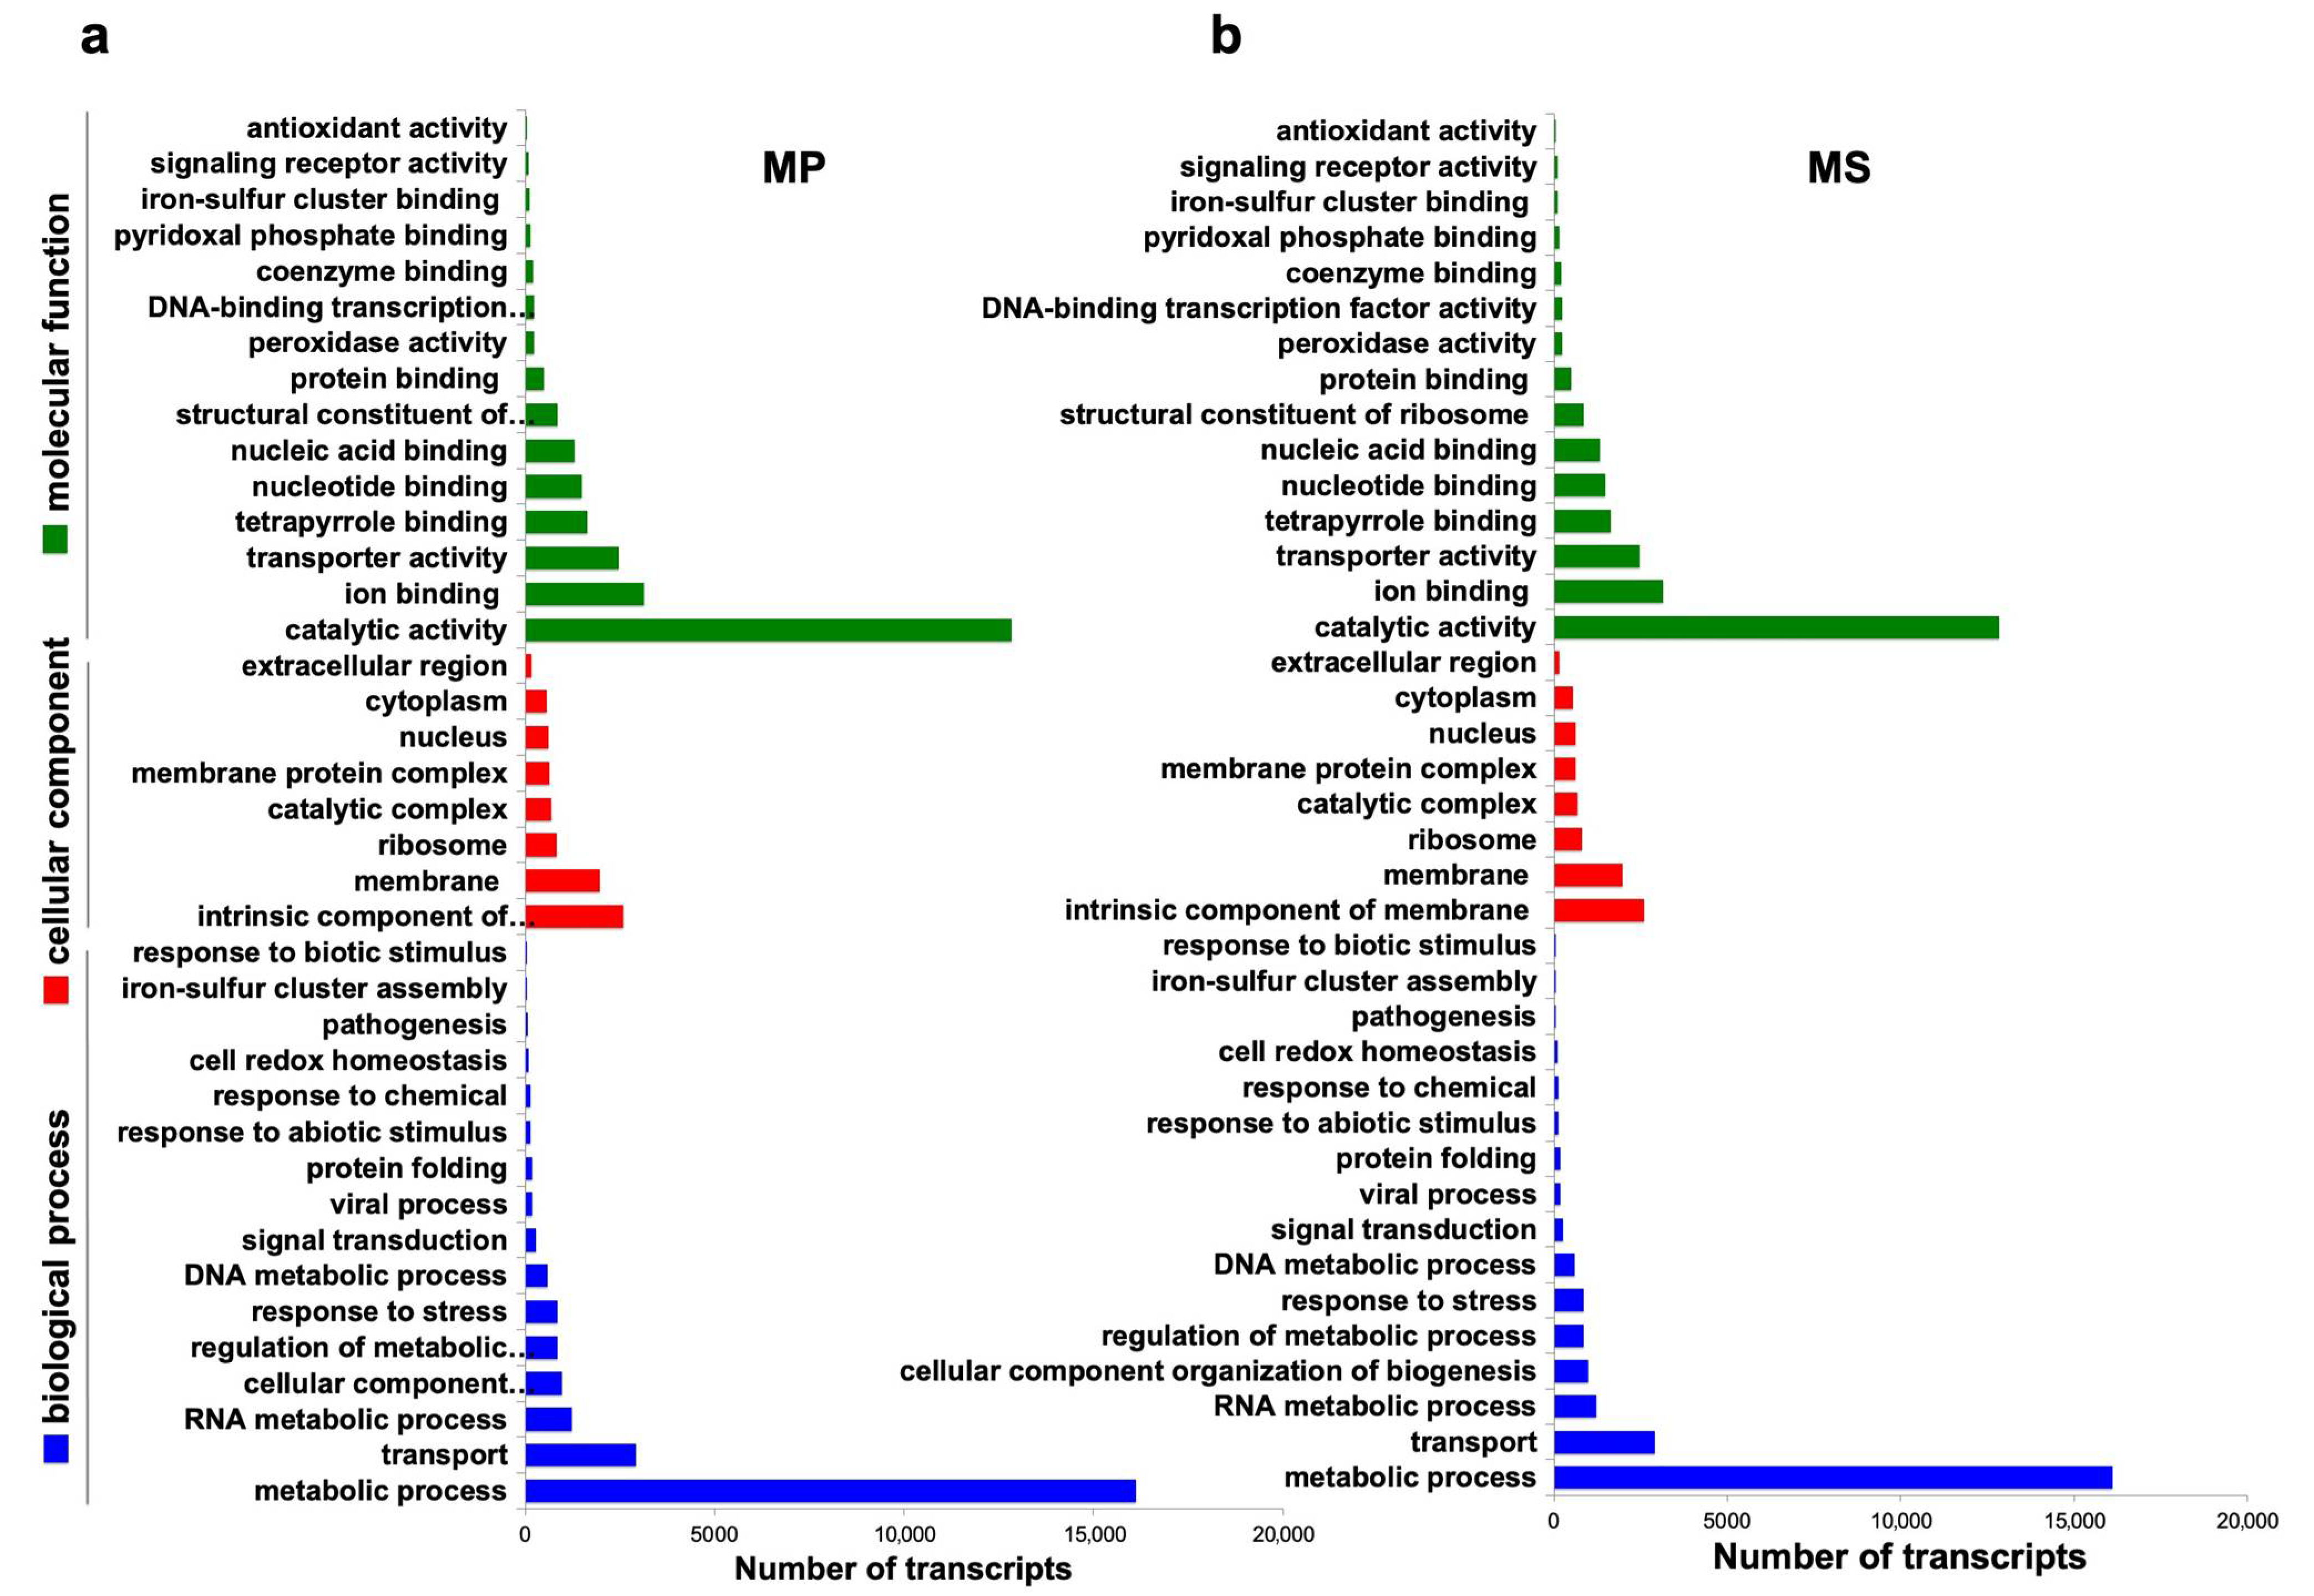
2.5. Functional Annotation of Microsorum Transcripts

In order to annotate Microsorum transcripts, two Microsorum transcriptomes were subjected to a BLASTX search against the Uniref90 database the using Sma3s program with an E-value threshold of 10−6. Of 57,252 MP and 54,618 MS transcripts, 38,794 (67.96%) and 38,909 (71%), respectively, were annotated (https://doi.org/10.6084/m9.figshare.7856717 (accessed on 1 January 2021)). According to the molecular function, many transcripts in the two Microsorum species were assigned to gene ontology (GO) terms associated with catalytic activity, ion binding, and transporter activity (Figure 4). According to the cellular-component category, the intrinsic components of membrane and ribosome-associated were frequently identified. Among identified biological processes, transcripts assigned to metabolic process, transport, and RNA metabolic process were substantially enriched in both MP and MS. We compared two Microsorum transcriptomes using a TBLASTX search with E-value of 1e−5 as a cutoff. We found that 85% (46,152 transcripts) of total transcripts were commonly identified in both MP and MS. In total, 8466 transcripts were specific to MS.
In addition, we identified enzymes assigned to 64 major metabolic pathways according to UniProt pathways. The three most abundant metabolic pathways were protein modification, lipid metabolism, and amino acid biosynthesis (Figure 5). In detail, the number of transcripts assigned to specific metabolic pathways varied between MP and MS. For example, the number of transcripts assigned to cofactor biosynthesis was 305 for MP and 327 for MS, whereas the number of transcripts assigned to carbohydrate degradation was 246 for MP and 294 for MS.
The annotation of Microsorum transcripts was performed based on clusters of orthologous groups in the COG protein database using MEGAN6 [31,32]. In total, 20,359 (35.56%) MP and 19,846 (36.34%) MS transcripts were classified into 25 COG categories with abbreviated terms, A to Z (Figure 6). The largest COG category was signal-transduction mechanisms (T) followed by post-translational modification, protein turnover, chaperones (O), and transcription (K). In contrast, only a few transcripts were assigned to COG categories associated with cell motility (N), extracellular and nuclear structures (W), and nuclear structure (Y). Interestingly, 937 (4.6%) and 798 (4%) transcripts for MP and MS, respectively, were assigned to secondary metabolite biosynthesis, transport and catabolism (Q) whereas 861 (4.23%) and 787 (3.94%) transcripts for MP and MS, respectively, were assigned to lipid transport and metabolism (I). In addition, we conducted differential gene-expression analysis by comparing MP to MS. The transcriptome similarity of two Microsorum species was very high (85%), and the MP contains a higher number of transcripts as compared to the MS. Therefore, we used the MP as a reference transcriptome for differential expression analysis. As a result, we identified 4516 up-regulated and 8081 down-regulated genes, respectively, by comparing MP to MS (Table S1).

2.6. Identification of Microsorum Transcription Factors

Plant transcription factors (TFs) play important roles not only in gene expression but also in numerous biological processes. We identified TFs in Microsorum based on the BLASTP search against the PlantTFDB [33] as well as annotation results using Sma3s. We identified a total of 1852 and 1980 TFs for MP and MS, respectively, which were further assigned to 15 and 16 TF families (Figure 7). Among the TF families identified, ethylene response factor (ERF) was the dominant TF family followed by C2H2-type zinc finger (C2H2) and ligand-binding domain (LBD) families. In general, the number of identified TFs for each family between MP and MS was similar in general. However, the number of TFs for the GATA family was very high in MP (42 TFs) compared to MS (7 TFs), whereas the number of TFs for four TF families including WRKY, G2-like, NAC, and C3H families was substantially higher in MP than MS. According to Fisher’s exact test, five TF families such as GATA, TCP, G2-like, NAC, and C3H showed that the number of TFs was significantly different between MP and MS. By comparing MP to MS, we identified 54 up-regulated and 81 down-regulated TF genes, respectively (Table S2).

2.7. Identification of Putative Microsorum Enzymes Involved in PE Biosynthesis

PEs are triterpenoid compounds derived from isopentenyl diphosphate (IPP) and dimethylallyl diphosphate (DMAPP), that are mainly synthesized via the mevalonate (MVA) pathway and sterol-biosynthetic pathway [18]. Based on previous studies, the PE biosynthetic pathway can be divided into three phases (Figure 8). The first phase consists of the MVA pathway generating the triterpenoid building units (IPP and DMAPP) (Figure 8a). The second phase is to generate lanosterol and cholesterol from squalene. The final phase is to produce ecdysone and 2-deoxy-20-hydroxyecdysone from lathosterol and cholesterol, respectively (Figure 8a). From the MP and MS transcriptomes, we identified putative enzymes involved in the PE-biosynthetic pathway (Table 4 and Table S3). With regard to the MVA pathway, we identified 14 and 9 enzymes for MP and MS, respectively. In addition, 24 and 23 enzymes for MP and MS, respectively, were identified for the sterol biosynthetic pathway (Table 4). The number of identified enzymes in each step was different between MP and MS. For example, five MP and three MS enzymes encoding acetoacetyl-CoA transferase (AACT) were identified, whereas only a single enzyme encoding 3-hydroxy-3-methyglutaryl-CoA synthase (HMGS) was identified from both MP and MS.

2.8. Expression Analysis of Genes Involved in the MVA and Sterol-Biosynthetic Pathway

The production of PE compounds in two different Microsorum species might be dependent on the expression of genes involved in upstream PE biosynthesis. Therefore, we examined the expression of individual genes based on transcripts per million (TPM) values (Tables S2 and S3). Interestingly, several functionally redundant transcripts involved in PE biosynthesis were identified in each Microsorum transcriptome. For example, there were at least five transcripts encoding AACT protein, and their expression levels were varied (Table 4), and the TPM values of these five transcripts encoding AACT from MP ranged from 1.32 to 23.74, whereas the TPM values of the three transcripts encoding AACT from MS ranged from 3.06 to 75.44. Several transcripts encoding HMGS, HMGR, SQS, and EBP were highly expressed, while expression for the transcripts encoding MVK, PMK, SQE, CAS, ERG24, ERG26, DHCR24, and ERG3 were low. We compared the expression of individual transcripts required for MVA and sterol-biosynthetic pathways between the two species (Figure 8b and Table 4). Among functional redundant transcripts, we selected the transcript showing the highest expression. When compared to MP, seven transcripts encoding AACT1, HMGS1, IDI, FDS, DHCR24, EBP, and ERG3 in MS were up-regulated, while another 12 transcripts in MS were down-regulated (Figure 8b and Table 4). In order to confirm the RNA-Seq results, we carried out real-time RT-PCR for 11 transcripts encoding HMGS1, MVK, PMK, CAS, DHCR7, EBP, ERG-1, ERG-2, IDI, MVD, and SQS (Figure S2). All 11 real-time RT-PCR primer pairs in this study showed the clean melting curves indicating that real-time RT-PCR efficiency was in the range of 90–100%. Real-time RT-PCR showed that the expression of 10 transcripts, except the transcript encoding EBP, was up-regulated in MP compared to MS. The expression results for nine transcripts, except HMGS1 and IDI, were consistent between the real-time RT-PCR and RNA-Seq results.

2.9. Phylogenetic Analyses of Enzymes Involved in MVA Pathway

In order to elucidate the evolutionary relationship between Microsorum and other plant species, we generated six phylogenetic trees for the enzymes involved in the MVA pathway. To generate phylogenetic trees, we collected available protein sequences for the MVA pathway from the protein database in NCBI. For AACT, there were at least six enzymes (MP_AACT1 to MP_AACT6) in MP and seven enzymes (MS_AACT1 to MS_AACT7) in MS (Figure 9a). Protein sequences for the AACT enzymes were highly conserved. Two HMGS enzymes in MP and a single HMGS enzyme in MS were grouped together in the same clade with those from S. moellendorffii and Mesostigma viride (Figure 9b). Four HMGR enzymes from MP and two HMGR enzymes from MS were in the same clade as other plant species, except for an HMGR enzyme from Zea mays (Figure 9c). With regard to mevalonate kinase (MVK), the phylogenetic tree showed that MP_MVK1 and MS_MVK1 were closely related to MVK from S. moellendorffii; however, MS_MVK2 from MS was very distantly related to other plant species (Figure 9d). In the phylogenetic tree of PMK, two PMK enzymes from MP with strong homology were closely related to other plant species in the same clade; however, two PMK enzymes from MS were very distantly related to other plant species (Figure 9e). There was only a single enzyme for MVD1 in both MP and MS, which was closely related to other plant species except for an MVD from Triticum urartu (Figure 9f).
We identified 146 and 141 cytochrome P450 (CYPs) genes from two Microsorum transcriptomes using the BLASTX and HMMER programs (Tables S4 and S5). To reveal the phylogenetic relationship of the identified CYP proteins, we generated phylogenetic trees of CYP proteins from MP and MS, respectively, by including the 31 known Drosophila CYP proteins. The phylogenetic tree for CYP proteins of MP and MS showed several groups of CYP proteins (Figures S3 and S4). The most MP_CYP proteins were similar within the same clade, except for the MP_CYP25 protein (Figure S3). Interestingly, five MS_CYP proteins (MS_CYP63, MS_CYP70, MS_CYP34, MS_CYP67, and MS_CYP35) were in the same clade with other drosophila CYP proteins. Next, we generated a phylogenetic tree including all CYP proteins from these two Microsorum and Drosophila (Figure S5). As we expected, the Microsorum CYP proteins were phylogenetically different from the drosophila CYP proteins. The phylogenetic tree revealed that the number of identified CYP proteins in each subfamily was different between MP and MS.

3. Discussion

Ferns are different from other seed plants in various biological features. For example, they have large leaves (known as fronds) and a cluster of sporangia (known as sori), and they grow rhizomes instead of roots [34]. Although ferns are not of major economic importance and are typically used as ornamental plants, some fern species are beneficial for humans and have been used since ancient times [35]. In particular, secondary metabolites produced from some ferns have antioxidant, antibiotic, antitumor, and anti-inflammatory properties [36].
Currently, the genus Microsorum can be divided into at least 98 species [37]. At present, a limited number of studies associated with the members in the genus Microsorum has been reported. For example, some Microsorum species, including M. fortunei and M. pteropus, are cadmium (Cd) hyperaccumulators with Cd-accumulation capacities and Cd-resistance mechanisms [38,39]. Like other known ferns species, extracts of fronds and rhizomes in Microsorum species have been used as traditional medicines [4]. In addition, a previous study demonstrated that extracts of M. grossum could protect human skin against UV, suggesting its possible implications in cosmetic ingredients [2]. Furthermore, the phytochemical compounds of Microsorum extracts have been examined [5,40]. Similarly, we examined the phytochemical compounds of the two Microsorum species using HPLC, revealing that MP and MS were enriched with ecdysone and 20-hydroxyecdysone, respectively [41]. In particular, the amount of 20-hydroxyecdysone in MS was 9.4 times higher than in MP, which was consistent with an earlier study showing a high level of 20-hydroxyecdysone (0.2% of dry weight) in MS [5]. Our results suggested that there might be a strong difference in the regulation of PE biosynthesis among different Microsorum species.
Although the compounds of PEs in Microsorum and their effects as medicines are well known, nothing is known about the key enzymes required for PE biosynthesis in Microsorum species. As an initial step in identifying enzymes involved in PE biosynthesis, we generated reference transcriptomes for two Microsorum species. Due to the large chromosome number and genome size of Microsorum species (2n = 72), we examined transcriptomes instead of genomes. Our de novo transcriptome assembly resulted in a high number of transcripts for the two Microsorum species. However, after deleting transcripts assigned to other organisms such as bacteria, fungi, and viruses, the proportion of clean transcripts associated with the plants was only 43.5% and 51.4% for MP and MS, respectively. This result suggested that under natural conditions plant samples can also be used as good material to investigate microorganisms present in the target plant. For example, several previous studies reported that plant transcriptomes sometimes contain sequences of plant viruses [42], fungi [43,44], and guest insects [45]. It is likely that RNA sequencing using oligo-d(T) could amplify mRNAs with poly(A) tails for eukaryotic cells as well as the virus genome with poly(A) tails.
In contrast to other fern-related transcriptomes, our study focused on the identification of the key enzymes involved in the upstream pathways of PE biosynthesis involving the MVA and sterol-biosynthetic pathways. One interesting result was that there were many functionally redundant enzymes in the two Microsorum species, which might have been caused by whole-genome duplication events in fern genomes, as suggested in a recent study [22]. It is also possible that those functionally redundant enzymes were transcript isoforms that were predicted by the Trinity assembler. Moreover, gene-expression analyses indicated that functional redundant enzymes were differentially expressed suggesting a difference in their functional roles as enzymes. For example, flavonol synthase (FLS) plays a central role in flavonoid metabolism. Multiple isoforms encoding FLS might have different substrate specifications for the production of the flavonols, quercetin, and kaempferol. Of the examined genes involved in PE biosynthesis, the expression of many genes in MP was higher than that of the genes in MS. This result might be related with high level of a specific metabolite, for example, high concentration of ecdysone in MP. Interestingly, the expression of several genes such as AACT1, HMGS1, and FDS involved in the MVA pathway was higher in MS compared to those in MP. This result suggested that the activities of the several enzymes associated with MVA pathway might be higher in MS compared to MP. Again, two genes encoding DHCR24 and EBP were up-regulated in MS compared to MP. DHCR24 and EBP are required to synthesize lathosterol, which is a precursor of ecdysone. It is also likely that a transcript with a high level of expression plays a more important role than a transcript with a low level of expression. For instance, the content of 20-hydroxyecdysone (20E), which is the main active compound of PEs, in MS was 9.4-fold higher than that in MP. However, the amount of ecdysone in MP was five times higher than that in MS. We carefully suppose that the high amount of ecdysone in MP might be due to its nonconversion to 20-hydroxyecdysone. Thus, it is important to determine the genes or enzymatic processes associated with 20-hydroxyecdysone in the near future. Thus, gene-expression regulation associated with PE synthesis might be more complex than we thought.
In fact, we did not identify novel enzymes directly involved in PE biosynthesis including ecdysone, 20-hydroxyecdysone, and 2-deoxy-20-hydroxyecdysone, which are also synthesized in animals [46]. An earlier study revealed that the P450 enzyme mediates the hydroxylation of ecdysone to 20-hydroxyecdysone in Drosophila [47]. Based on sequence similarity using the BLASTX and HMMER programs, we identified many P450 proteins in the two Microsorum transcriptomes; however, we could not identify a key P450 enzyme involved in PE biosynthesis due to the high number of P450 transcripts in the two Microsorum species. Possibly, the metabolic pathways in ferns are different from those in animal species. In addition, we also found that the enzymes in the same metabolic pathway varied between the two Microsorum species, although the majority of enzymes were shared between species. For example, both species had the PMK and MVK enzymes. However, two PMK enzymes in MP shared a strong similarity to other higher plants, whereas two PMK enzymes in MS were substantially different from other PMK enzymes in plants. In addition, MP had a single MVK enzyme, whereas MS had two MVK enzymes. MVK1 in MS might have the same functions as those in other plants; however, MVK2 in MS was distantly related in phylogenetic analyses. This result suggested a difference in the function of MVK2 compared to the MVK enzymes in other plants. A difference in the enzymes of the MVA pathway between different organisms has been demonstrated previously [48]. Transcriptome assembly tends to include alternative splicing and different fragments of the same transcript. Alternative splicing, producing several transcripts isoforms from a single gene, leads to protein diversity. Thus, the difference in the number of specific enzymes might be caused by the difference of alternatively spliced transcript numbers between these two species. It could regulate the secondary metabolism and quality of plants [49]. In our study, there were multiple genes for the same enzymes. Without the reference genome, it was difficult to get full-length transcripts using RNA-seq. Thus, it is important to confirm their sequences using PCR and Sanger-sequencing in the near future.
As shown in the phylogenetic analyses and gen-expression analyses, not only the number of enzymes but also their gene expression might contribute to the production of PEs between the two Microsorum species. It would suggest that the up-regulation of genes encoding AACT1, HMGS1, IDI, ERG24, and DHCR24 in MS compared to MP might be related to PE production. Similarly, an early study showed the positive effect of mevalonic acid and cholesterol on the synthesis of PEs in the fern Polypodium [50].
The classification of taxonomy showed that only about 10% of annotated Microsorum transcripts were homologous to those of ferns, indicating limited genetic information for fern species. In addition, a majority of Microsorum transcripts was homologous to S. moellendorffii (Lycopodiophyta), P. patens (Bryophyta), M. polymorpha (Marchantiophyta), and P. sitchensis (Pinophyta) suggesting there is a close evolutionary relationship between fern Microsorum species.
In this study, we identified a large number of TFs (at least 1852 TFs for MP and 1980 transcripts for MS), which were further assigned into 15 and 16 TF families, respectively. However, the number of TFs in Microsorum was much higher than that in S. moellendorffii (665 TFs); even though the number of TF families in Microsorum was much lower than for S. moellendorffii (54 families). Our results were consistent with a recent study that demonstrated the duplication of fern TF genes [51]. Interestingly, no TF in the C3H family was identified in MP whereas 46 TFs of the C3H family were identified in MS. This result indicated the possibility of a strong difference in TF genes or their gene expression between the two different Microsorum species. Of the TF families identified, three TF families, ERF, bHLH, and MYB, which are involved in Jasmonate (JA) signaling, were abundantly present in the Microsorum species. JA-responsive TFs play an important role in the regulation of plant secondary metabolism [49]. A recent transcriptome study showed that the TFs and enzymes required for secondary metabolism were differentially expressed upon methyl JA treatment [52]. In particular, a previous study demonstrated that methyl JA stimulated the production of 20-hydroxyecdysone in cell-suspension cultures of Achyranthes bidentate [53]. Therefore, it might be of interest to find TFs that regulate the expression of genes involved in PE production for Microsorum species.
In summary, we provided reference transcriptomes for two Microsorum species with different capacities for PE production. Our comparative transcriptome analyses suggested that multiple genes were involved in PE production and provided essential genetic information for Microsorum species as well as for the evolutionary study of ferns.

4. Materials and Methods

4.1. Plant Materials and Sample Collection

Two Microsorum species, M. punctatum (Linn.) Copel and M. scolopendria (Burm.f.) Copel, were grown in compost soil without fertilizer in the experimental plot at Kasetsart University Kamphaeng Saen Campus, Nakhon Pathom, Thailand. Two Microsorum species could be established in the same core Microsoroid. Mature sporophyte frond tissues of two-months-old Microsorum species were sampled independently. One sterile frond (a leaf lacking sporangia) was rinsed with distilled water and collected as a single biological replicate for RNA extraction. Frozen samples with liquid nitrogen were stored at −80 °C.

4.2. Measurement of Phytoecdysteroids

The extraction of phytoecdysteroids was performed in accordance with a methodology described previously [5]. In brief, approximately 50 mg sterile fronds were dried in an oven at 55 °C for 16 h and grinded by mortar and pestle, 2 mg samples were extracted in 95% ethanol in a soxhlet apparatus for 6 h. The ethanol extracts were evaporated by rotary evaporator at 60 °C. The residue was dissolved in methanol and vortexed with hexane. The methanol extracts were evaporated at 60 °C in a hot-air oven. The residue was dissolved in HPLC-grade methanol (1 mL). The supernatant was filtered through a 0.45 μM nylon membrane filter (Millipore, Darmstadt, Germany) and then dried at room temperature in laminar hood. The residues were re-dissolved in HPLC-grade methanol and analyzed by an HPLC system (Water Corporation, Miford, MA, USA) equipped with an ultraviolet (UV) detector set at wavelength of 245 nm. The separation was achieved on a Waters Spherisorb C18 ODS2 column (4.6 mm × 250 mm i.d., 5 μm) with Spherisorb S5 ODS2 guard column (4.6 mm × 10 mm C18 ODS2 i.d., 5 μm) at 40 °C. The mobile phase consisted of either a mixture of HPLC grade 14% acetonitrile in 2% acetic acid at a flowrate of 1 mL/min. The volume of the injected samples was 20 μL, running for 20 min. The identification of each compound was based on a combination of retention time and spectral matching. Calibration of the system with known amounts of these compounds was performed using standard samples (Sigma-Aldrich, St. Louis, MO, USA). The stock solutions of standard were prepared and applied in triplicate onto the HPLC. The peaks areas were recorded, and the calibration curve were prepared by plotting peak areas against concentrations.

4.3. Total RNA Extraction and Transcriptome Sequencing

Total RNA was extracted using NucleoSpin RNA (Macherey-Nagel, Düren, Germany) according to the manufacturer’s instructions. The quality and quantity of extracted RNA were measured by gel electrophoresis, ND-1000 Nanodrop spectrophotometer (Thermo Scientific, Waltham, MA, USA), and Agilent 2100 Bioanalyzer (Aligent, Santa Clara, CA, USA). At least 20 μg of total RNA at a concentration of ≥ 400 ng/μL, OD260/280 = 1.8–2.2, RNA 28S: 18S ≥ 1.0, and RNA Integrity Number (RIN) ≥ 7.0 was used for library preparation. The high-quality total RNAs were used for library preparation using a TruSeq RNA Library Prep Kit v2 (Illumina, San Diego, USA) following the manufacturer’s instructions. A total of six libraries from three biological replications representing two Microsorum species were paired-end sequenced by the Illumina NovaSeq 6000 system at Macrogen in Seoul, Republic of Korea.

4.4. De Novo Transcriptome Assembly and Deletion of Contaminated Transcripts

All six fastq files derived from three different libraries for each species were subjected to de novo transcriptome assembly using a Trinity pipeline and the Trinity program (version 2.0.2, released 22nd January 2015) with default parameters (kmer size 25) (http://trinityrnaseq.github.io/ (accessed on 1 January 2021)) [29]. We used all transcript isoforms predicted by the Trinity assembler in our study. The transcriptome completeness for two Microsorum species was assessed using BUSCO (v2/v3) program implemented in gVolante (https://gvolante.riken.jp/ (accessed on 1 January 2021)) against the plant OrthoDB gene dataset. Assembled transcripts were used for the BLASTX search against the NR protein dataset of the NCBI using the DIAMOND program (https://ab.inf.uni-tuebingen.de/software/diamond (accessed on 1 January 2021)) [30] with default parameters (E-value 1e−5 as a cutoff). The output file in dmnd file format from DIAMOND was subjected to the MEGAN6 program, which is used for taxonomic analysis based on NCBI taxonomy (https://ab.inf.uni-tuebingen.de/software/megan6 (accessed on 1 January 2021)) [31]. Based on the taxonomy results by MEGAN6, we deleted contaminated transcripts such as sequences from animals, bacteria, fungi, and viruses. As a result, only plant assigned transcripts and unassigned transcripts were included in the annotation of the Microsorum transcriptome.

4.5. Annotation of Microsorum Transcripts and Prediction of Open Reading Frames (ORFs)

Clean Microsorum transcripts from the two different species were used for gene annotation. For annotation, we used two different methods. The first was a combination of BLASTX with E-value of 1e−5 as a cutoff against the NR database using DIAMOND followed by functional annotation using InterPro2GO, SEED, and eggNOG programs implemented in MEGAN6. The second was gene annotation using Sma3s using the following command (./sma3s.pl -i query_dataset.fasta -d uniref90.fasta -nucl –goslim) (https://github.com/UPOBioinfo/sma3s (accessed on 1 January 2021)) [54]. The Sma3s conducts a BLASTX against the UniProt database (uniref90.fasta) using the normal NCBI BLAST+ program. Based on the BLASTX result, transcripts were annotated according to GO terms (http://www.geneontology.org/ (accessed on 1 January 2021)), Swiss-Prot keywords, and metabolic pathways by Sma3s. Moreover, we further predicted coding regions within the assembled transcripts by the TransDecoder program using the following command (TransDecoder.LongOrfs -t target_transcripts.fasta) embedded in the Trinity software distribution. The longest transcripts in each isoform were used for the prediction of open reading frames (ORFs).

4.6. Gene-Expression Analysis of the Selected Microsorum Genes

To evaluate the expression level of the selected Microsorum genes, we calculated transcripts per million (TPM) values. For that, we combined fastq files from three different libraries according to Microsorum species. The combined raw sequence reads were mapped on the assembled transcriptome for MP and MS, respectively, using Burrows–Wheeler aligner (BWA) (http://bio-bwa.sourceforge.net/ (accessed on 1 January 2021)) program using the following command: (bwa mem ref.fa reads.fq > aln-se.sam) with default parameters. The two mapped sam files were subjected to eXpress program (https://pachterlab.github.io/eXpress/ (accessed on 1 January 2021)) with the following command (express target_seqs.fasta aligned_reads.sam) to calculate TPM values. The calculated transcript abundance for identified transcripts in MP and MS can be found in Tables S4 and S5.
For differentially expressed gene (DEG) analysis, all six raw data were aligned on the transcriptome for MP by BWA aligner. The aligned read numbers for each transcript were calculated by eXpress program. The numbers of aligned reads were subjected to DEG analysis using DESeq2 program (https://bioconductor.org/packages/release/bioc/html/DESeq2.html (accessed on 1 January 2021)). DEGs were identified based on fold changes more than two times and p-values less than 0.01 by comparing MP to MS. The calculated fold changes and adjusted p-values can be found in Table S1.

4.7. Real-Time RT-PCR Analysis

In order to validate the results of RNA-Seq, we conducted real-time RT-PCR for the 11 selected Microsorum genes encoding HMGS1, MVK, PMK, MVD, IDI, SQS, CAS, ERG-1, ERG-2, EBP, and DHCR7. The experiment was performed on the same set of RNA samples used for RNA-Seq. We designed primers for all the transcripts that were annotated for the same gene. Quantitative reverse transcription polymerase chain reaction (qRT-PCR) was employed using iQ SYBR Green Supermix (Bio-Rad, Hercules, CA, USA) and CFX96 (Bio-Rad). Data were analyzed using Rotor-Gene Q series software version 2.3.1 (Qiagen). To identify internal control genes of Microsorum, we carried out a BLASTN search using four Arabidopsis internal gene sequences (ACT11, ACT2, TUA, and UBQL) against MP and MS transcriptomes [55]. If there is more than one transcript for an enzyme, we selected the transcript with the highest TPM value for primer design. We designed primers and conducted real-time RT-PCR. Finally, primers amplifying a single amplicon were selected as the internal control gene sequence. The real-time RT-PCR results were normalized with ACT11 and UBQL genes. Real-time RT-PCR was conducted as follows: the first step at 95 °C for 3 min, followed by 40 cycles of denaturation at 95 °C for 10 s, annealing at 55 °C for 30 s, and elongation at 72 °C for 30 s. Fluorescence measurements were conducted once per cycle at the end of the annealing temperature. Primer sequences for real-time RT-PCR are shown in Table S6. The reactions were conducted in technical and biological triplicate.

4.8. Identification of Transcription Factors and P450 Genes

In order to identify TF in Microsorum, we carried out BLASTX search with E-value of 1e−5 as a cutoff against the database containing known TF proteins derived from PlantTFDB [33]. Based on BLASTX results and annotation results by Sma3s, we classified identified TFs according to TF families.
To find cytochrome P450 (CYPs) genes from two Microsorum transcriptomes, the obtained reference transcriptomes were used for BLASTX search with E-value of 1e−5 as a cutoff against P450 proteins of Drosophila melanogaster (Table S7). After that, only sequences containing p450 domain (PF00067) were identified based on HMMER (version 3.3.1) search (http://hmmer.org/ (accessed on 1 January 2021)). The identified CYP proteins from MP and MS were listed in Tables S8 and S9.

4.9. Phylogenetic Analysis

For phylogenetic analysis, we selected six proteins, AACT, HMGS, HMGR, MVK, PMK, and MVD, which are involved in the MVA pathway. First, we conducted a search using BLASTP and the six reference protein sequences against the two Microsorum reference proteomes, respectively. The obtained protein sequences were aligned by ClustalW implemented in the MEGA7 program [56]. The aligned sequences were subjected to phylogenetic tree construction with the maximum likelihood (ML) method and 1000 bootstrap values using MEGA7.
For the construction of phylogenetic trees of CYP proteins, the identified Microsorum CYP proteins and drosophila CYP proteins were aligned together using MAFFT program with G-INS-1 option (https://mafft.cbrc.jp/ (accessed on 1 January 2021)). The aligned protein sequences were trimmed by Trimal program with automated1 option (http://trimal.cgenomics.org/ (accessed on 1 January 2021)). The trimmed protein sequences were subjected to IQ-Tree program for the phylogenetic tree construction with maximum-likelihood method (http://www.iqtree.org/ (accessed on 1 January 2021)). The LG + I + G4 substitution model was used for all CYP phylogenetic tree construction. The generated phylogenetic trees were visualized by Figtree version 1.4.4 (https://github.com/rambaut/figtree/releases (accessed on 1 January 2021)).

Supplementary Materials

The following are available online at https://www.mdpi.com/1422-0067/22/4/2085/s1.

Author Contributions

S.S. is the main author of this paper. S.S. and S.P. harvested samples. S.S. performed the RNA extraction, library preparation, and sequencing. H.C. conducted real-time RT-PCR. S.S., Y.J., H.C. and W.K.C. performed bioinformatics analyses. S.S., E.-J.K., S.P., Y.J., H.C., W.K.C. and S.L. interpreted the data and discussed the results. This project was conceived and designed by S.S., W.K.C. and S.L. S.S., E.-J.K., W.K.C. and S.L. wrote the manuscript. All authors have read and agreed to the published version of the manuscript.

Funding

This research was funded by grants from Kasetsart University Kamphaeng Saen Campus (Grant number KPS-RDI 2019-010), the Faculty of Liberal Arts and Science, Kasetsart University Kamphaeng Saen Campus, Thailand, the National Research Foundation of Korea (NRF-2018K2A9A1A09073028), and the National Research Foundation of Korea (Ministry of Science and ICT) (NRF-2017R1A2B2005117) through the Korean government under the framework of international cooperation program.

Institutional Review Board Statement

Not applicable.

Informed Consent Statement

Not applicable.

Data Availability Statement

The raw dataset in this study will be available, upon publication, in the Sequence Read Archive (SRA) repository with accession numbers SRR8480531, SRR8480553, SRR8480612, SRR8480631, SRR8480739, and SRR8480744. The assembled clean transcripts, gene annotation, and predicted protein sequences are freely available in figshare (https://doi.org/10.6084/m9.figshare.7856717).

Conflicts of Interest

The authors declare no conflict of interest.

References

  1. Ho, R.; Teai, T.; Girault, J.; Meybeck, A.; Lafont, R.; Raharivelomanana, P. From traditional uses to phytochemical study of a Polynesian healing plant: Constituents and properties of “Metuapua’a”. Planta Medica. 2016, 81, S1–S381. [Google Scholar] [CrossRef]
  2. Ho, R.; Girault, J.P.; Cousteau, P.Y.; Bianchini, J.P.; Raharivelomanana, P.; Lafont, R. Isolation of a new class of ecdysteroid conjugates (Glucosyl-ferulates) using a combination of liquid chromatographic methods. J. Chromatogr. Sci. 2008, 46, 102–110. [Google Scholar] [CrossRef] [PubMed] [Green Version]
  3. Ho, R.; Teai, T.; Meybeck, A.; Raharivelomanana, P. UV-protective Effects of Phytoecdysteroids from Microsorum grossum Extracts on Human Dermal Fibroblasts. Nat. Prod. Commun. 2015, 10, 33–36. [Google Scholar] [CrossRef] [Green Version]
  4. Girardi, C.; Butaud, J.F.; Ollier, C.; Ingert, N.; Weniger, B.; Raharivelomanana, P.; Moretti, C. Herbal medicine in the Marquesas Islands. J. Ethnopharmacol. 2015, 161, 200–213. [Google Scholar] [CrossRef] [PubMed]
  5. Snogan, E.; Vahirua-Lechat, I.; Ho, R.; Bertho, G.; Girault, J.P.; Ortiga, S.; Maria, A.; Lafont, R. Ecdysteroids from the Medicinal Fern Microsorum Scolopendria (Burm. F.). Phytochem. Anal. 2007, 18, 441–450. [Google Scholar] [CrossRef]
  6. Zibareva, L.; Volodin, V.; Saatov, Z.; Savchenko, T.; Whiting, P.; Lafont, R.; Dinan, L. Distribution of phytoecdysteroids in the Caryophyllaceae. Phytochemistry 2003, 64, 499–517. [Google Scholar] [CrossRef]
  7. Calas, D.; Thiéry, D.; Marion-Poll, F. 20-Hydroxyecdysone Deters Oviposition and Larval Feeding in the European Grapevine Moth, Lobesia botrana. J. Chem. Ecol. 2006, 32, 2443–2454. [Google Scholar] [CrossRef] [PubMed]
  8. Moskalev, A.A.; Shaposhnikov, M.V.; Zainullin, V.G.; Punegov, V.V. The influence of ecdysone-containing phyto-preparations on life span of Drosophila melanogaster strains depending on the genotype. Adv. Gerontol. 2006, 19, 33–35. [Google Scholar]
  9. Voigt, B.; Whiting, P.; Dinan, L. The ecdysteroid agonist/antagonist and brassinosteroid-like activities of synthetic brassinosteroid/ecdysteroid hybrid molecules. Cell. Mol. Life Sci. 2001, 58, 1133–1140. [Google Scholar] [CrossRef]
  10. Tarkowská, D.; Strnad, M. Isoprenoid-derived plant signaling molecules: Biosynthesis and biological importance. Planta 2018, 247, 1051–1066. [Google Scholar] [CrossRef]
  11. Soriano, I.R.; Riley, I.T.; Potter, M.J.; Bowers, W.S. Phytoecdysteroids: A novel defense against plant-parasitic nematodes. J. Chem. Ecol. 2004, 30, 1885–1899. [Google Scholar] [CrossRef]
  12. Jurenka, R.; Russell, K.; O’Neal, M. Phytoecdysteroids as antifeedants towards several beetles that include polyphagous and monophagous feeding guilds. Pest Manag. Sci. 2017, 73, 1633–1637. [Google Scholar] [CrossRef] [PubMed]
  13. Gorelick-Feldman, J.; Cohick, W.; Raskin, I. Ecdysteroids elicit a rapid Ca2+ flux leading to Akt activation and increased protein synthesis in skeletal muscle cells. Steroids 2010, 75, 632–637. [Google Scholar] [CrossRef] [Green Version]
  14. Gorelick-Feldman, J.; MacLean, D.; Ilic, N.; Poulev, A.; Lila, M.A.; Cheng, D.; Raskin, I. Phytoecdysteroids increase protein synthesis in skeletal muscle cells. J. Agric. Food Chem. 2008, 56, 3532–3537. [Google Scholar] [CrossRef]
  15. Bathori, M.; Pongracz, Z. Phytoecdysteroids from isolation to their effects on humans. Curr. Med. Chem. 2005, 12, 153–172. [Google Scholar] [CrossRef]
  16. Graf, B.L.; Rojo, L.E.; Delatorre-Herrera, J.; Poulev, A.; Calfio, C.; Raskin, I. Phytoecdysteroids and flavonoid glycosides among chilean and commercial sources of Chenopodium quinoa: Variation and correlation to physico-chemical characteristics. J. Sci. Food Agric. 2016, 96, 633–643. [Google Scholar] [CrossRef] [PubMed] [Green Version]
  17. Rharrabe, K.; Sayan, F.; Lafont, R. Dietary Effects of Four Phytoecdysteroids on Growth and Development of the Indian Meal Moth, Plodia interpunctella. J. Insect Sci. 2010, 10, 1–12. [Google Scholar] [CrossRef]
  18. Dinan, L.; Savchenko, T.; Whiting, P. On the distribution of phytoecdysteroids in plants. Cell. Mol. Life Sci. 2001, 58, 1121–1132. [Google Scholar] [CrossRef] [PubMed]
  19. Zibareva, L.; Yeriomina, V.I.; Munkhjargal, N.; Girault, J.-P.; Dinan, L.; Lafont, R. The phytoecdysteroid profiles of 7 species of Silene(Caryophyllaceae). Arch. Insect Biochem. Physiol. 2009, 72, 234–248. [Google Scholar] [CrossRef]
  20. Christenhusz, M.J.M.; Chase, M.W. Trends and concepts in fern classification. Ann. Bot. 2014, 113, 571–594. [Google Scholar] [CrossRef] [PubMed] [Green Version]
  21. Sessa, E.; Der, J. Evolutionary Genomics of Ferns and Lycophytes. In Advances in Botanical Research; Elsevier BV: Amsterdam, The Netherlands, 2016; pp. 215–254. [Google Scholar]
  22. Li, F.-W.; Brouwer, P.; Carretero-Paulet, L.; Cheng, S.; De Vries, J.; Delaux, P.-M.; Eily, A.; Koppers, N.; Kuo, L.-Y.; Li, Z.; et al. Fern genomes elucidate land plant evolution and cyanobacterial symbioses. Nat. Plants 2018, 4, 460–472. [Google Scholar] [CrossRef] [Green Version]
  23. Varshney, R.K.; Nayak, S.N.; May, G.D.; Jackson, S.A. Next-generation sequencing technologies and their implications for crop genetics and breeding. Trends Biotechnol. 2009, 27, 522–530. [Google Scholar] [CrossRef] [PubMed] [Green Version]
  24. Ward, J.A.; Ponnala, L.; Weber, C.A. Strategies for transcriptome analysis in nonmodel plants. Am. J. Bot. 2012, 99, 267–276. [Google Scholar] [CrossRef]
  25. Sigel, E.M.; Schuettpelz, E.; Pryer, K.M.; Der, J.P. Overlapping patterns of gene expression between gametophyte and sporophyte phases in the fern Polypodium Amorphum (Polypodiales). Front. Plant Sci. 2018, 9, 1450. [Google Scholar] [CrossRef]
  26. Zhang, Z.; He, Z.; Xu, S.; Li, X.; Guo, W.; Yang, Y.; Zhong, C.; Zhou, R.; Shi, S. Transcriptome analyses provide insights into the phylogeny and adaptive evolution of the mangrove fern genus Acrostichum. Sci. Rep. 2016, 6, 35634. [Google Scholar] [CrossRef] [PubMed] [Green Version]
  27. Shen, H.; Hong-Jin, W.; Shu, J.-P.; Zhou, X.-L.; Lei, M.; Wei, R.; Shang, H.; Wei, H.-J.; Zhang, R.; Liu, L.; et al. Large-scale phylogenomic analysis resolves a backbone phylogeny in ferns. GigaScience 2018, 7, 1–11. [Google Scholar] [CrossRef] [Green Version]
  28. Grusz, A.L.; Rothfels, C.J.; Schuettpelz, E. Transcriptome sequencing reveals genome-wide variation in molecular evolutionary rate among ferns. BMC Genom. 2016, 17, 692. [Google Scholar] [CrossRef] [Green Version]
  29. Grabherr, M.G.; Haas, B.J.; Yassour, M.; Levin, J.Z.; Thompson, D.A.; Amit, I.; Adiconis, X.; Fan, L.; Raychowdhury, R.; Zeng, Q. Full-length transcriptome assembly from RNA-Seq data without a reference genome. Nat. Biotechnol. 2011, 29, 644. [Google Scholar] [CrossRef] [Green Version]
  30. Buchfink, B.; Xie, C.; Huson, D.H. Fast and sensitive protein alignment using DIAMOND. Nat. Methods 2015, 12, 59–60. [Google Scholar] [CrossRef]
  31. Huson, D.H.; Auch, A.F.; Qi, J.; Schuster, S.C. MEGAN analysis of metagenomic data. Genome Res. 2007, 17, 377–386. [Google Scholar] [CrossRef] [PubMed] [Green Version]
  32. Tatusov, R.L.; Koonin, E.V.; Lipman, D.J. A Genomic Perspective on Protein Families. Science 1997, 278, 631–637. [Google Scholar] [CrossRef] [PubMed] [Green Version]
  33. Jin, J.; Tian, F.; Yang, D.-C.; Meng, Y.-Q.; Kong, L.; Luo, J.; Gao, G. PlantTFDB 4.0: Toward a central hub for transcription factors and regulatory interactions in plants. Nucleic Acids Res. 2017, 45, D1040–D1045. [Google Scholar] [CrossRef] [PubMed] [Green Version]
  34. Watkins, J.E., Jr.; Churchill, A.C.; Holbrook, N.M. A site for sori: Ecophysiology of fertile-sterile leaf dimorphy in ferns. Am. J. Bot. 2016, 103, 845–855. [Google Scholar] [CrossRef]
  35. Lee, C.H.; Shin, S.L. Functional Activities of Ferns for Human Health. In Working with Ferns; Springer International Publishing: New York, NY, USA, 2010; pp. 347–359. [Google Scholar]
  36. Ho, R.; Teai, T.; Bianchini, J.-P.; Lafont, R.; Raharivelomanana, P. Ferns: From Traditional Uses to Pharmaceutical Development, Chemical Identification of Active Principles. In Working with Ferns; Springer International Publishing: New York, NY, USA, 2011; pp. 321–346. [Google Scholar]
  37. Chen, C.-C.; Liu, H.-Y.; Chen, C.-W.; Schneider, H.; Hyvönen, J. On the spore ornamentation of the microsoroid ferns (microsoroideae, polypodiaceae). J. Plant Res. 2020, 134, 55–76. [Google Scholar] [CrossRef] [PubMed]
  38. Yan, Y.-Y.; Yang, B.; Lan, X.-Y.; Li, X.-Y.; Xu, F.-Y. Cadmium accumulation capacity and resistance strategies of a cadmium-hypertolerant fern—Microsorum fortunei. Sci. Total Environ. 2019, 649, 1209–1223. [Google Scholar] [CrossRef]
  39. Lan, X.-Y.; Yan, Y.-Y.; Yang, B.; Li, X.-Y.; Xu, F.-L. Differential expression of proteins in the leaves and roots of cadmium-stressed Microsorum pteropus, a novel potential aquatic cadmium hyperaccumulator. Sci. Total. Environ. 2018, 642, 1369–1377. [Google Scholar] [CrossRef]
  40. Ho, R.; Girault, J.P.; Raharivelomanana, P.; Lafont, R.E. E- and Z-isomers of new phytoecdysteroid conjugates from French Polynesian Microsorum membranifolium (Polypodiaceae) fronds. Molecules 2012, 17, 11598–11606. [Google Scholar] [CrossRef] [PubMed]
  41. Bosman, M.T. Maria. A monograph of the fern genus Microsorum (Polypodiaceae) including an attempt towards a reconstruction of the phylogenetic history of the Microsoroids. Leiden Bot. Ser. 1991, 14, 1–161. [Google Scholar]
  42. Jo, Y.; Choi, H.; Cho, J.K.; Yoon, J.-Y.; Choi, S.-K.; Cho, W.K. In silico approach to reveal viral populations in grapevine cultivar Tannat using transcriptome data. Sci. Rep. 2015, 5, 15841. [Google Scholar] [CrossRef] [PubMed] [Green Version]
  43. Garnica, D.P.; Upadhyaya, N.M.; Dodds, P.N.; Rathjen, J.P. Strategies for wheat stripe rust pathogenicity identified by transcriptome sequencing. PLoS ONE 2013, 8, e67150. [Google Scholar] [CrossRef] [Green Version]
  44. Kawahara, Y.; Oono, Y.; Kanamori, H.; Matsumoto, T.; Itoh, T.; Minami, E. Simultaneous RNA-seq analysis of a mixed transcriptome of rice and blast fungus interaction. PLoS ONE 2012, 7, e49423. [Google Scholar] [CrossRef] [Green Version]
  45. Zhu, J.; Wang, G.; Pelosi, P. Plant transcriptomes reveal hidden guests. Biochem. Biophys. Res. Commun. 2016, 474, 497–502. [Google Scholar] [CrossRef] [PubMed]
  46. Lafont, R.; Beydon, P.; Blais, C.; Garcia, M.; Lachaise, F.; Riera, F.; Somme, G.; Girault, J.P. Ecdysteroid metabolism: A comparative study. Ecdysone 1986, 11–16. [Google Scholar] [CrossRef]
  47. Petryk, A.; Warren, J.T.; Marqués, G.; Jarcho, M.P.; Gilbert, L.I.; Kahler, J.; Parvy, J.P.; Li, Y.; Dauphin-Villemant, C.; O’Connor, M.B. Shade is the Drosophila P450 enzyme that mediates the hydroxylation of ecdysone to the steroid insect molting hormone 20-hydroxyecdysone. Proc. Natl. Acad. Sci. USA 2003, 100, 13773–13778. [Google Scholar] [CrossRef] [Green Version]
  48. Miziorko, H.M. Enzymes of the mevalonate pathway of isoprenoid biosynthesis. Arch. Biochem. Biophys. 2011, 505, 131–143. [Google Scholar] [CrossRef] [PubMed] [Green Version]
  49. Zhou, M.; Memelink, J. Jasmonate-responsive transcription factors regulating plant secondary metabolism. Biotechnol. Adv. 2016, 34, 441–449. [Google Scholar] [CrossRef]
  50. Reixach, N.; Irurre-Santillari, J.; Camps, F.; Melé, E.; Messeguer, J.; Casas, J. Phytoecdysteroid overproduction in Polypodium vulgare prothalli. Phytochemistry 1997, 46, 1183–1187. [Google Scholar] [CrossRef]
  51. Qi, X.; Kuo, L.Y.; Guo, C.; Li, H.; Li, Z.; Qi, J.; Wang, L.; Hu, Y.; Xiang, J.; Zhang, C.; et al. A well-resolved fern nuclear phylogeny reveals the evolution history of numerous transcription factor families. Mol. Phylogenet. Evol. 2018, 127, 961–977. [Google Scholar] [CrossRef]
  52. Wang, R.; Xu, S.; Wang, N.; Xia, B.; Jiang, Y.; Wang, R. Transcriptome Analysis of Secondary Metabolism Pathway, Transcription Factors, and Transporters in Response to Methyl Jasmonate in Lycoris aurea. Front. Plant Sci. 2017, 7. [Google Scholar] [CrossRef] [Green Version]
  53. Wang, Q.J.; Li, P.Z.; Sima, Y.H.; Yuan, H.Y.; Wang, J.W. Methyl jasmonate stimulates 20-hydroxyecdysone production in cell suspension cultures of Achyranthes Bidentata. Plant Omics. 2013, 6, 116. [Google Scholar]
  54. Casimiro-Soriguer, C.S.; Muñoz-Mérida, A.; Pérez-Pulido, A.J. Sma3s: A universal tool for easy functional annotation of proteomes and transcriptomes. Proteomics 2017, 17, 1700071. [Google Scholar] [CrossRef] [Green Version]
  55. Brunner, A.M.; Yakovlev, I.A.; Strauss, S.H. Validating internal controls for quantitative plant gene expression studies. BMC Plant Biol. 2004, 4, 14. [Google Scholar] [CrossRef] [PubMed] [Green Version]
  56. Kumar, S.; Stecher, G.; Tamura, K. MEGA7: Molecular Evolutionary Genetics Analysis Version 7.0 for Bigger Datasets. Mol. Biol. Evol. 2016, 33, 1870–1874. [Google Scholar] [CrossRef] [Green Version]
Figure 1. Frond images of M. punctatum (MP) (a) and M. scolopendria (MS) (b). A largely developed sterile frond of MP (c). Two types of fully developed fronds, sterile (d) and fertile fronds (e) for MS. Scale bar indicates 1 cm. (f) Phylogenetic tree using rbcL gene sequences showing the phylogenetic relationship of the two Microsorum species in this study with three other Microsorum species.
Ijms 22 02085 g001
Figure 2. High-performance liquid chromatography (HPLC) analysis of phytoecdysteroids (PEs) extracted from sterile frond tissues of two different Microsorum species, M. punctatum (MP), and M. scolopendria (MS). Most significant PEs for MP (a) and MS (b) were indicated by the name of the respective metabolite. Quantification of phytoecdysteroids compounds (c) in sterile fronds of MP and MS. Error bars represent mean values with standard errors (n = 3).
Ijms 22 02085 g002
Figure 3. Bar graph visualizing the sequence length distribution of identified transcripts for M. punctatum (MP) (a) and M. scolopendria (MS) (b). Assembled transcripts of more than 200 bp were subjected to BLASTX search against the nonredundant (NR) database in National Center for Biotechnology Information (NCBI) using DIAMOND. Of the transcripts assigned to plant species, the major plant species were visualized with the respective proportion of MP (c) and MS (d). Transcripts assigned to ferns were further classified in detail.
Ijms 22 02085 g003
Figure 4. Gene ontology distribution of the identified Microsorum transcripts according to biological process (blue), cellular component (red), and molecular function (green) for M. punctatum (MP) (a) and M. scolopendria (MS) (b).
Ijms 22 02085 g004
Figure 5. Functional annotation of Microsorum transcripts according to UniProt pathways. Top 50 UniProt pathways for M. punctatum (MP) (a) and M. scolopendria (MS) (b) based on the number of assigned transcripts. Each transcript was annotated according to the UniProt pathway using the Sma3s program.
Ijms 22 02085 g005
Figure 6. Clusters of orthologous group classification of Microsorum transcripts. Microsorum transcripts were assigned to clusters of orthologous groups for M. punctatum (MP) and M. scolopendria (MS) using MEGAN6.
Ijms 22 02085 g006
Figure 7. Bar graph showing the number of transcription factors according to individual transcription factor family for M. punctatum (MP) and M. scolopendria (MS). Microsorum transcription factors were identified using the functional annotation of the Sma3s program and BLASTX search against a plant transcription factor database. * indicates statistical significance less than 0.001 according to Fisher’s exact test at p < 0.05.
Ijms 22 02085 g007
Figure 8. Putative enzymes involved in the phytoecdysteroids (PEs) biosynthetic pathway. (a) Proposed PEs biosynthetic pathway in Microsorum species. Orange, yellow, and green boxes represented proteins involved in the MVA, sterol biosynthesis, and 20E biosynthetic pathways, respectively. Expression level of individual genes was indicated by + sign; < 5 (+), 5–20 (++), 20–50 (+++), >50 (++++) based on average transcripts per million (TPM) values, and the highest TPM value for each enzyme was used. (b) The heatmap of the TPM distribution of all transcripts involved in the PEs biosynthesis was visualized by red and green, indicating up-regulated and down-regulated genes, respectively. Detailed information for enzymes identified is provided in Table 4.
Ijms 22 02085 g008
Figure 9. Phylogenetic trees of six putative enzymes involved in mevalonate (MVA) pathway; AACT (a), HMGS (b), HMGR (c), MVK (d), PMK (e), and MVD (f). Their protein sequences were identified from two Microsorum species and other plant species from NCBI protein database. Using available protein sequences for the six enzymes, BLASTP was conducted against two Microsorum proteomes. We also selected highly homologous proteins from the protein database for individual enzymes based on BLASTP results. The obtained protein sequences were aligned using ClustalW. The phylogenetic trees were constructed using the maximum-likelihood (ML) method with MEGA ver.7.0 software and 1000 bootstraps. The Microsorum protein sequences for individual enzymes are provided in Table S4. Red and blue colors represent proteins identified from MP and MS, respectively. Proteins from Selaginella moellendorffii are represented in green. MS_MVD1, MS_PMK1, MS_MVK1, MS_HMGR1, MS_MVK1, and MS_HMGS1 were used as an outgroup for the phylogenetic trees of AACT, HMGS, HMGR, MVK, PMK, and MVD, respectively.
Ijms 22 02085 g009
Table 1. Summary of paired-end sequencing for two Microsorum species.
Name of
Library
Size of Raw Data (bp)Total Number
of Reads
GC Content (%)Q20
(%)
Accession Number in SRA Database
MP_R12,423,192,80823,992,00848.9098.05SRR8480531
MP_R22,275,984,70222,534,50247.8798.17SRR8480553
MP_R32,567,004,68825,415,88847.9498.22SRR8480612
MS_R12,547,634,10025,224,10048.4398.18SRR8480631
MS_R22,340,604,90623,174,30648.3698.22SRR8480739
MS_R32,432,464,81024,083,81048.1898.24SRR8480744
A total of six libraries were prepared for M. punctatum (MP) and M. scolopendria (MS). For each species, three different libraries were paired-end sequenced by the NovaSeq 6000 system. Raw sequence data were deposited in the SRA database of NCBI with respective accession numbers.
Table 2. Summary of de novo assembled transcriptomes for two Microsorum species.
Read StatisticsM. punctatumM. scolopendria
PreprocessingPostprocessingPreprocessingPostprocessing
Total assembled bases111,129,16477,952,463115,715,16390,302,902
Number of transcripts131,35157,252106,15354,618
N501493193418822148
Median transcript length45310996601459
Average transcript length846136110901653
Total number of genes80,02627,24364,09823,175
GC content (%)45.6445.7945.5245.71
Preprocessing indicates de novo assembled transcriptome by Trinity without any filtering whereas post-processing indicates Microsorum transcriptome after contaminants are deleted. The number of transcripts indicates the number of whole transcripts while the number of genes indicates the number of representative genes.
Table 3. Summary of transcriptome completeness for two Microsorum species using BUSCO (v2/v3) program against the plant OrthoDB gene dataset.
M. punctatumM. scolopendria
Total number of core genes queried 14401440
Number of core genes detected (complete)952 (66.11%)986 (68.47%)
Number of core genes detected (complete + partial)1023 (71.04%)1037 (72.01%)
Number of missing core genes417 (28.96%)403 (27.99%)
Average number of orthologs per core genes1.771.99
% of detected core genes that have more than
1 ortholog
52.7368.97
Table 4. List of identified Microsorum enzymes involved in the mevalonate (MVA) pathway and sterol biosynthetic pathway, which might be responsible for PE biosynthesis.
PathwayEnzymesEnzyme no.No. of
Proteins
MPMS
MPMSUnigene IDSizeTPMUnigene IDSizeTPM
MVA Acetoacetyl-CoA
transferase (AACT)
2.3.1.953MP_TRINITY_
DN32725_c0_g1_i1
12548.97MS_TRINITY_
DN30309_c0_g1_i1
200113.79
MP_TRINITY_
DN33165_c0_g2_i2
7391.32MS_TRINITY_
DN32401_c0_g2_i1
179275.44
MP_TRINITY_
DN34009_c1_g1_i1
17741.53MS_TRINITY_
DN36240_c0_g1_i2
15233.06
MP_TRINITY_
DN38258_c0_g1_i2
75523.74
MP_TRINITY_
DN42159_c0_g1_i1
185121.94
3-Hydroxy-3-methyglutaryl-CoA synthase (HMGS)2.3.3.1011MP_TRINITY_
DN41084_c1_g4_i2
175122.11MS_TRINITY_
DN32809_c0_g1_i1
1969108.60
3-Hydroxy-3-methyglutaryl-CoA reductase (HMGR)1.1.1.3442MP_TRINITY_
DN38567_c1_g2_i1
23226.24MS_TRINITY_
DN12064_c0_g2_i1
24989.16
MP_TRINITY_
DN40805_c0_g1_i1
24297.49MS_TRINITY_
DN35244_c0_g1_i1
270884.46
MP_TRINITY_
DN43604_c0_g1_i1
6364.87
MP_TRINITY_
DN44231_c0_g4_i1
2196245.25
Mevalonate
kinase (MVK)
2.7.1.3611MP_TRINITY_
DN35569_c0_g1_i1
150328.41MS_TRINITY_
DN31620_c0_g1_i1
162210.26
Phosphomevalonate kinase (PMK)2.7.4.211MP_TRINITY_
DN40957_c0_g1_i3
210813.19MS_TRINITY_
DN31249_c0_g1_i1
221210.26
Diphospho
mevalonate
decarboxylase (MVD)
4.1.1.3321MP_TRINITY_
DN18033_c0_g1_i1
4711.09MS_TRINITY_
DN32042_c0_g1_i1
160429.62
MP_TRINITY_
DN38695_c0_g1_i1
171037.22
Sterol
biosynthesis
isopentenyl
diphosphate isomerase (IDI)
5.3.3.211MP_TRINITY_
DN40402_c1_g1_i3
129721.93MS_TRINITY_
DN30481_c0_g1_i3
124448.19
farnesyl
diphosphate synthase (FDS)
2.5.1.1012MP_TRINITY_
DN38904_c0_g1_i1
166240.55MS_TRINITY_
DN30957_c0_g1_i2
13827.46
MS_TRINITY_
DN31472_c0_g1_i3
24263.08
squalene
synthase (SQS)
2.5.1.2112MP_TRINITY_
DN38844_c0_g1_i1
1521119.78MS_TRINITY_
DN31427_c0_g1_i1
145646.17
MS_TRINITY_
DN45369_c0_g1_i1
5581.09
Sterol
biosyn-thesis
squalene monooxygenase (SQE)1.14.13.13222MP_TRINITY_
DN39062_c0_g1_i1
201918.31MS_TRINITY_
DN31999_c0_g1_i2
10563.06
MP_TRINITY_
DN43491_c0_g1_i3
22736.95MS_TRINITY_
DN33834_c0_g1_i2
19264.83
lanosterol synthase (LAS)5.4.99.732MP_TRINITY_
DN23554_c0_g1_i1
6801.44MS_TRINITY_
DN248_c0_g1_i1
7713.14
MP_TRINITY_
DN32916_c0_g1_i1
56046.28MS_TRINITY_
DN31641_c0_g1_i1
77832.32
MP_TRINITY_
DN37953_c0_g1_i2
29661.35
cycloartenol synthase (CAS)5.4.99.811MP_TRINITY_
DN37919_c0_g1_i1
293724.17MS_TRINITY_
DN35135_c0_g1_i1
297012.96
sterol 14-
demethylase (CYP51)
1.14.13.7033MP_TRINITY_
DN38602_c0_g2_i1
199836.73MS_TRINITY_
DN31074_c0_g2_i1
20472.19
MP_TRINITY_
DN39045_c0_g2_i1
15552.98MS_TRINITY_
DN33684_c0_g1_i1
183522.62
MP_TRINITY_
DN39045_c0_g2_i3
5291.80MS_TRINITY_
DN45802_c0_g1_i1
2661.09
δ14-sterol
reductase (ERG24)
1.3.1.7011MP_TRINITY_
DN37114_c0_g1_i1
16286.47MS_TRINITY_
DN36333_c2_g1_i1
15914.45
sterol-4α-
carboxylate 3-dehydrogenase (ERG26)
1.1.1.17022MP_TRINITY_
DN42534_c0_g2_i1
185726.34MS_TRINITY_
DN34567_c0_g1_i1
132510.97
MP_TRINITY_
DN44751_c0_g2_i1
154016.40MS_TRINITY_
DN35016_c1_g1_i1
23663.25
δ24-sterol
reductase (DHCR24)
1.3.1.7252MP_TRINITY_
DN31959_c0_g1_i1
21114.07MS_TRINITY_
DN28185_c0_g1_i1
19323.69
MP_TRINITY_
DN32815_c0_g1_i2
7332.94MS_TRINITY_
DN34498_c0_g1_i1
230913.39
MP_TRINITY_
DN48554_c0_g1_i1
2103.11
MP_TRINITY_
DN51472_c0_g1_i1
2580.45
MP_TRINITY_
DN58603_c0_g1_i1
2202.04
cholestenol δ-isomerase (EBP)5.3.3.512MP_TRINITY_
DN33408_c1_g1_i1
97381.36MS_TRINITY_
DN24433_c0_g1_i1
8685.80
MS_TRINITY_
DN27664_c0_g1_i1
941113.34
δ7-sterol 5-
desaturase (ERG3)
1.14.19.2011MP_TRINITY_
DN34658_c0_g1_i1
7917.50MS_TRINITY_
DN26674_c0_g1_i1
13309.39
7-dehydro
cholesterol
reductase (DHCR7)
1.3.1.2122MP_TRINITY_
DN37028_c0_g1_i1
93722.02MS_TRINITY_
DN27356_c0_g1_i1
8179.46
MP_TRINITY_
DN39419_c1_g1_i2
224753.09MS_TRINITY_
DN31977_c0_g1_i1
202330.49
The name of the enzyme (Abbreviation), enzyme commission (EC) number, number of enzymes in M. punctatum (MP) and M. scolopendria (MS), transcript ID, and TPM value are listed. TPM value for each transcript was the average value of three replicates.
Publisher’s Note: MDPI stays neutral with regard to jurisdictional claims in published maps and institutional affiliations.

