Article

Genetic Variants of ANGPT1, CD39, FGF2 and MMP9 Linked to Clinical Outcome of Bevacizumab Plus Chemotherapy for Metastatic Colorectal Cancer

1
Department of Health Sciences, Health Sciences Faculty, European University of Madrid, Villaviciosa de Odón, 28670 Madrid, Spain
2
Department of Medicine, Health Sciences Faculty, Universidad Europea de Madrid, Villaviciosa de Odón, 28670 Madrid, Spain
3
Department of Oncology, University Hospital of Fuenlabrada, Fuenlabrada, 28942 Madrid, Spain
4
Department of Pathological Anatomy, University Hospital of Fuenlabrada, Fuenlabrada, 28942 Madrid, Spain
5
Department of Pre-Clinical Dentistry, Health Sciences Faculty, Universidad Europea de Madrid, Villaviciosa de Odón, 28670 Madrid, Spain
*
Author to whom correspondence should be addressed.
Int. J. Mol. Sci. 2021, 22(3), 1381; https://doi.org/10.3390/ijms22031381
Submission received: 7 January 2021 / Revised: 25 January 2021 / Accepted: 26 January 2021 / Published: 30 January 2021
(This article belongs to the Special Issue Gender Medicine: Pharmacogenetics and Personalised Medicine 2.0)

Abstract

:
Angiogenesis pathway genes show substantial genetic variability causing inter-individual differences in responses to anti-angiogenic drugs. We examined 20 single nucleotide polymorphisms (SNPs) in 13 of these genes to predict tumour response and clinical outcome measured as progression free survival (PFS) and overall survival (OS) in 57 patients with metastatic colorectal cancer (mCRC) given bevacizumab plus chemotherapy. SNPs were detected (iPLEX® Assay) in genomic DNA extracted from formalin-fixed paraffin-embedded tumour specimens. The variant allele CD39 rs11188513 was associated with a good tumour response (p = 0.024). Patients homozygous for the wild-type allele FGF2 rs1960669 showed a median PFS of 10.95 months versus 5.44 months for those with at least one variant allele-A (HR 3.30; 95% CI: 1.52–7.14; p = 0.001). Patients homozygous for wild-type MMP9 rs2236416 and rs2274755 showed a median PFS of 9.48 months versus 6 and 6.62 months, respectively, for those with at least one variant allele (p = 0.022, p = 0.043, respectively). OS was also lengthened to 30.92 months (p = 0.034) in carriers of wild-type ANGPT1 rs2445365 versus 22.07 months for those carrying at least one variant allele-A. These gene variants were able to predict clinical outcome and tumour response in mCRC patients given bevacizumab-based therapy.

1. Introduction

Colorectal cancer (CRC) is the fourth most common cancer and the fifth leading cause of cancer death worldwide, with an estimated 1.85 million new cases and 861,663 deaths recorded in 2018 [1]. Metastasis is the most lethal characteristic of CRC and accounts for 90% of all deaths registered in colon cancer patients [2]. Metastatic CRC (mCRC) is a complex disease that is largely influenced by lifestyle and dietary factors, and is also linked to socioeconomic status. Thus, the management of this disease requires new-age practices in a predictive, preventive, and personalized medicine (PPPM) approach [1]. Recent studies have suggested that inter-individual genetic variations may significantly affect an individual’s predisposition to and risk of developing mCRC [3]. Further, there is also increasing evidence that single nucleotide polymorphisms (SNPs) may be used as biomarkers of the genetic background of mCRC patients to predict their individual therapeutic response and prognosis [4,5].
Bevacizumab (BVZ) is a humanized monoclonal antibody that targets vascular endothelial growth factor (VEGF). This agent is used in combination with chemotherapy (CT) to treat mCRC [6]. BVZ works by inhibiting the actions of VEGF, causing regression of existing tumour vasculature and preventing the development of new blood vessels, thereby inhibiting tumour growth. At the molecular level, VEGF and its receptor (VEGFR) play major roles in the angiogenesis that characterizes advanced cancer. Several authors have reported significant improvements in progression-free survival (PFS), overall survival (OS) and response rate (RR) in mCRC patients treated with CT + BVZ compared to CT alone [7,8,9,10,11,12]. However, not all patients respond in the same way to treatment probably through the development of treatment resistance mechanisms involving activation of proangiogenic pathways or tumour recruitment of cells that produce proangiogenic factors, recruitment of hematopoietic cells and inflammatory cells into the tumour, and heterogeneity of genetically unstable tumour cells [13,14].
Several clinical studies in patients with mCRC have shown a relationship between variation in the SNPs of genes involved directly or indirectly in the angiogenesis pathway and the response to BVZ. Variants of these genes have also been associated with the aetiology and clinical outcomes of mCRC [15,16,17,18,19,20]. However, while basic studies have revealed an essential role of VEGF-dependent and independent angiogenesis pathway genes in the aetiology and clinical outcome of mCRC, there is still scarce knowledge regarding differences the efficacy of BVZ treatment and resistance to this treatment observed among patients [21]. In the present study, we hypothesized that variations in genes directly or indirectly regulating angiogenesis processes, such as those coding for growth factors, cytokine signalling molecules, angiopoietin and components of the adenosine pathway, could help predict the efficacy of anti-VEGF drug-containing chemotherapy in patients with mCRC. To this end, we examined whether several single-nucleotide polymorphisms (SNPs) in the major VEGF-dependent and independent angiogenic pathway genes A2BR, ANGPT1, ANGPT-2, CCL5, CD39, EDN1, FGF2, IGF1, MKNK1, MMP9, NT5E, TOP1 and VEGF-A could correlate with treatment efficacy and clinical outcomes in mCRC patients receiving BVZ in combination with CT. Clinical outcomes were measured in terms of tumour response, PFS, OS and RR.

2. Results

The study cohort was comprised of 57 patients with mCRC. The primary tumour site was the proximal colon (left-sided) in 70% of patients (40/57) and the distal colon (right-sided) in 30% (17/57). In 55 of the patients, tumours were in advanced stages (96% stage III and IV) and with KRAS mutated (76%, 42/55) at diagnosis. The mean number of sites showing metastases was 2 (range 1 to 5). Mean age at the time of diagnosis was 61.8 years (range 27 to 81). Most patients were male (41/57; 72%) (Table 1).
Only 35% of the patients underwent surgical resection as the primary treatment option. All patients were given CT + BVZ. In more than half of the patients this regimen was the first-line option (58.9%, 33/57); the most frequently used first line associated CT was FOLFOX (47%, 27/57) (Table 1). A high percentage (79%) of patients did not require BVZ dose reduction. In only 11% of patients did treatment have to be withdrawn as deemed necessary by the responsible physician because of a lack of response or high toxicity of the drug. As secondary effects of BVZ treatment, only 13% (7/57) of patients experienced high toxicity (type III), while in 87% of patients, toxicity was classified as type I or II (50/57). Main side effects recorded were hypertension in 34% (19/57) of patients, intestinal perforation in 11% (6/57) and bleeding (18/57) in 32%, mainly epistaxis followed by rectal fistulas and haemorrhoids.
Median follow-up duration was 28.5 months. 61% of the patients were dead at the end of this study; median PFS and OS were 11.09 months and 34.79 months, respectively. Thirty patients (52.6%) showed a response to the treatment while tumour progression was recorded in 27 patients (47.4%) (Table 1).

2.1. Gene Variants

Genotyping quality control by direct DNA-sequencing provided a genotype agreement of 99%. Genotyping was successful in 97.98% of cases for each polymorphism examined, except for MMPA-rs17577 and CDKAL1- rs7453577, which were excluded from further analysis. Genotype frequencies of the 20 SNPs of the 13 genes investigated in this project are summarized in Table 2. Highest wild-type homozygosity rates were observed for ANGPT-2 rs10102851 (92.98%), VEGF-A rs3025039 (75.44%), FGF2 rs1960669 (82.14%), MMP9 rs2236416 (75.44%), MMP9 rs2274755 (76.78%), EDN1 rs5370 (60.71%), CCL5 rs2280789 (82.46%), TOP1 rs34282819 (77.19%), ANGPT1 rs2445365 (57.89%) and MKNK1 rs8602 (53.70%) (Table 2). For other genes, most patients were carriers of the variant allele in homozygosis or heterozygosis: CD39 rs11188513 (89.47%), NT5E rs2229523 (94.64%), ANGPT2 rs1375668 (89.29%), ANGPT2 rs2515462 (92.98%), VEGFA rs833061 (82.46%) and IGF1 rs6220 (92.86%). Further, around 50% of patients were heterozygous for the VEGFA polymorphisms rs833061, rs833068 and rs833069, and for TOP1 rs6072249 and A2BR rs2015353. At a glance classification of the genes analysed in this study according to their Gene Ontology-Biological processes are provided in Table 2. This classification revealed that all the SNPs analysed affect genes directly or indirectly related to angiogenesis, which is the main biological process blocked by BVZ.
All the allele frequencies of the genes examined showed good agreement with Hardy-Weinberg equilibrium. In the univariate analysis of SNP frequencies observed in the patients, only for the variant allele of CD39 rs11188513 were significant differences detected in the presence of the VV (TT) genotype (OR 3; 95% CI: 1.015–8.864; p = 0.047), versus WT homozygous or heterozygous (CT/CC) patients. None of the other tested polymorphisms or other characteristics analysed (Table 1) were significantly different in our cohort of patients. The genetic heterogeneity of tumours was addressed calculating the number of mutated genes according to tumour stage (Table 3). Patients in III and IV stage accumulated the highest number of genes with mutations. For more information about names of mutated genes and ID of SNPs investigated, see supplementary Table S1. Of interest, the variant ANGPT1 rs2445365 was present in 19 of 39 patients in stage IV.

2.2. Gene Variants and Tumour Response

To estimate the effects of the SNPs on the therapeutic efficacy of CT+BVZ, we determined whether there was a tumour response or not to 6 months of treatment according to the genotypes of the different polymorphisms. Thus, we compared the frequencies of each polymorphism in the two groups of patients responders (R) and non-responders (nR) by performing a univariate analysis between patients carrying: a) at least one variant allele (VV or W/V), and patients carrying two wild-type alleles (WW); and b) patients carrying two variant alleles (VV) and those carrying none or a single variant allele (W/V or WW). In this analysis, the variant CD39 rs11188513 was significantly associated with a good tumour response to treatment. Thus, patients with the CD39 rs11188513 variant genotype were more likely to belong to the group of patients responding to CT+BVZ treatment (62.07%) than the group of nR patients, who were heterozygous or homozygous for the wild-type (C) allele (67.86%) (p = 0.024). The frequencies of the different genotypes of the other polymorphisms did not differ significantly between responders and non-responders (data not shown).

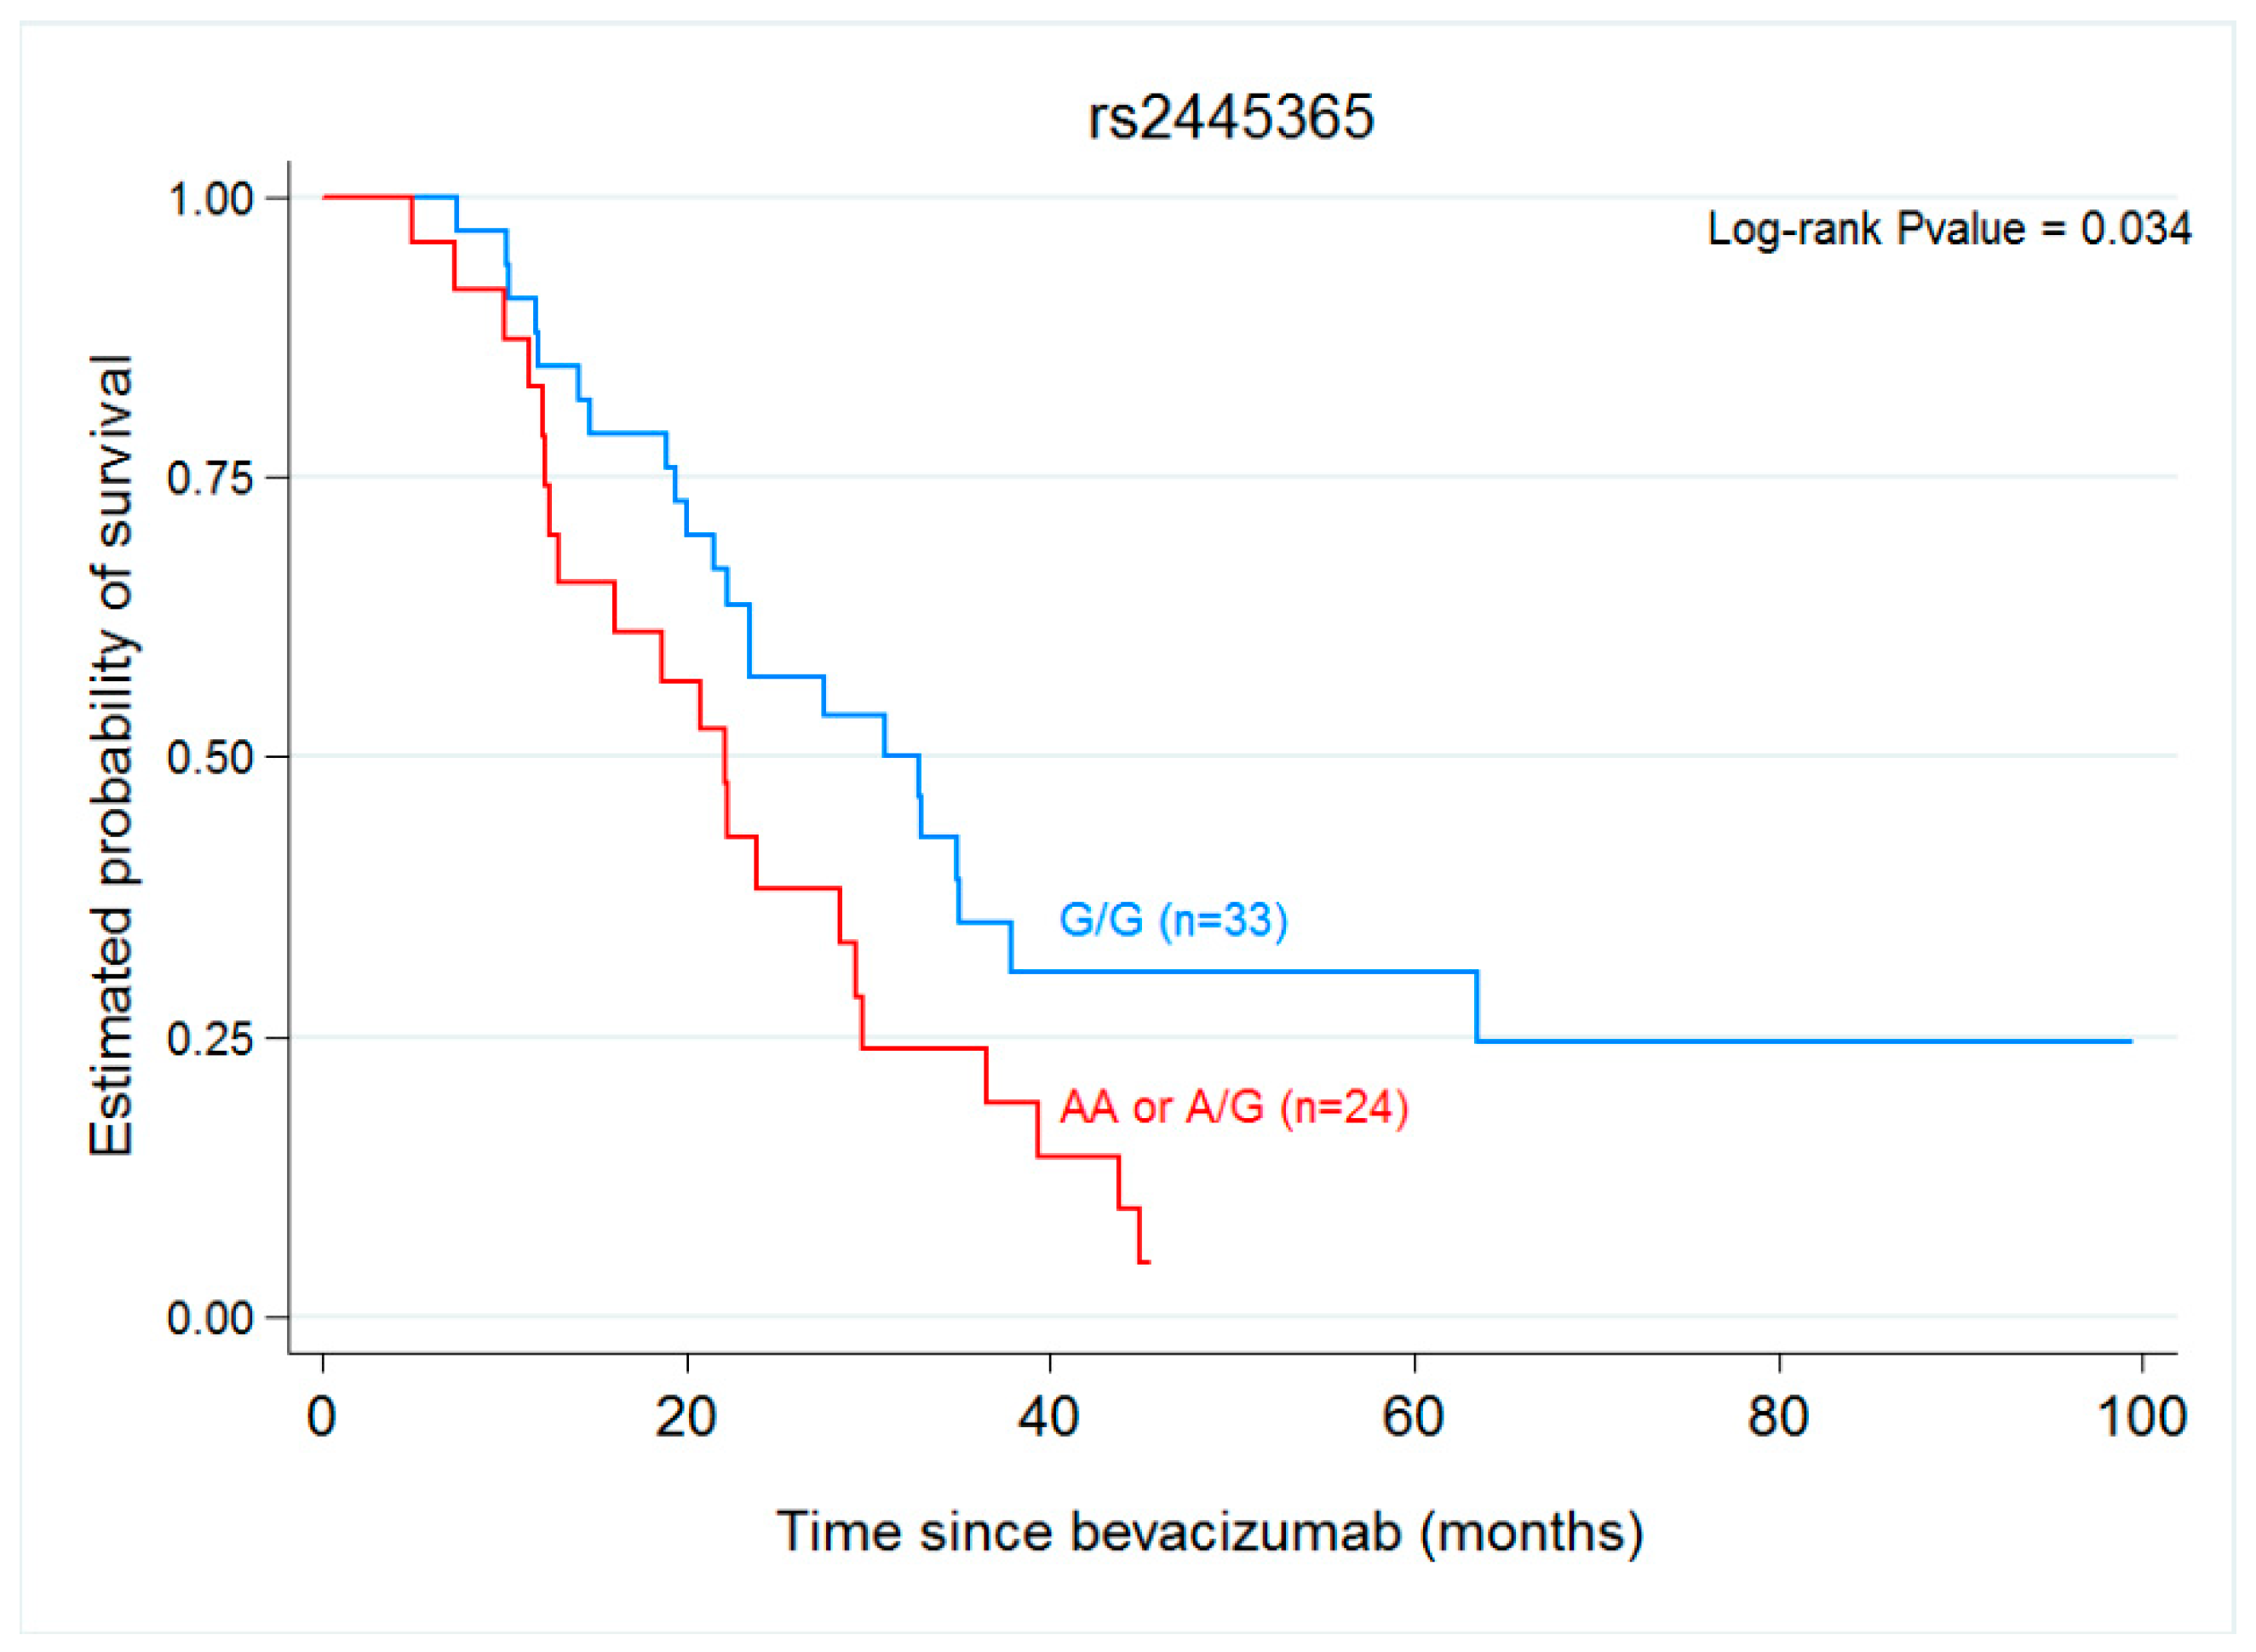
2.3. Gene Variants, Progression-Free Survival and Overall Survival

In the univariate analysis, the wild-type allele of FGF2 rs1960669, and wild-type alleles of MMP9 rs2236416 and MMP9 rs2274755 were found to be significantly associated with PFS. In the case of FGF2 rs1960669, CC homozygous patients showed a median PFS of 10.95 months compared to 5.44 months for patients carrying at least one variant allele-A (HR 3.30; 95% CI: 1.52–7.14; p = 0.001). For the MMP9 SNPs rs2236416 and rs2274755, patients homozygous for the wild-type allele showed a median PFS of 9.48 months versus 6 and 6.62 months, respectively, for patients carrying at least one variant allele (p = 0.022, p = 0.043, respectively) (see Table 4, Figure 1). No other significant correlations with PFS were observed for the other SNPs.
Overall survival was found to be significantly (p = 0.034) longer in carriers of the wild-type ANGPT1 rs2445365 allele (30.92 months) than in those carrying at least one variant allele-A (22.07 months) (Table 4 and Figure 2). None of the other variants were associated with OS (Table 4, Figure 2).

3. Discussion

In combination with chemotherapy, the widely used monoclonal antibody against VEGF, bevacizumab, shows differences in efficacy among cancer types and also among patients with the same cancer type [6,23,24,25]. Hence, following CT+BVZ, several studies have shown increases in the response rate, progression-free survival and overall survival in patients with mCRC compared to patients not treated with BVZ [7,8,9,11,12] and a significantly improved pCR (pathological complete response) in breast cancer patients [24]. Further, the findings of clinical studies indicate that the efficacy of BVZ as an antiangiogenic agent and its acquired resistance vary widely among mCRC patients [21]. This has prompted a search for biomarkers to validate the efficacy of this treatment and predict treatment outcomes.
In the past few decades, it has been suggested that some polymorphisms in VEGF-dependent and non-VEGF-dependent genes could be responsible for better clinical outcomes in patients with mCRC receiving CT+BVZ as first line treatment [24,26]. Further, studies in different cancer types (e.g., breast cancer) have also suggested that genetic variants affecting regulatory regions besides coding regions, could be of special interest in this context [24]. As angiogenic mechanisms are thought to play a role in resistance to BVZ, we explored a panel of SNPs with implications for tumour angiogenic pathways that could help predict an individual’s response to treatment. We selected 20 SNPs of 13 genes based on genetic variants described to affect a patient’s response to BVZ treatment in different type of cancers. These were SNPs located in regulatory regions able to modify gene expression (intron, 3´UTR, 5´UTR) and non-synonymous SNPs in coding regions (that modify the coded aminoacids). Overall allele frequencies of the 20 SNPs examined in our mCRC patients were comparable to frequencies reported for healthy European populations [22].
An interesting finding of our study was the relationship detected between the SNP CD39 rs11188513 and the tumour response to treatment. This gene plays a role in the adenosine pathway and it is well established that extracellular adenosine has a potent immunosuppressive and angiogenic effect in the tumour microenvironment. Extracellular adenosine is autonomously produced via CD39 and CD73, expressed mainly on the surface membrane of cancer cells, B cells or regulatory T cells (Tregs). This adenosine not only stimulates cancer cells through its receptor A2BR but also regulates tumour-infiltrating immune cells through A2AR and A2BR [27,28,29]. In our study, patients homozygous for the variant allele CD39 rs11188513 showed a good respond to treatment measured as non-tumour progression after 6 months of BVZ treatment. However, this response failed to impact PFS and OS. The effect of the CD39 rs11188513 variant on the outcome of BVZ treatment has been explored by other authors with results in agreement with those detected here. Thus, Tokunaga et al. showed that patients with any wild-type rs11188513 allele (C) showed a worse response to BVZ treatment in terms of PFS and OS compared to patients with the VV genotype [30]. In this study, 451 mCRC patients were divided into 3 groups: control group (treated with FOLFIRI + cetuximab), analysis group (treated with FOLFIRI + BVZ) and validation group (largest group of patients treated with FOLFIRI + BVZ). It emerged that CD39 rs11188513 was a strong predictor of BVZ treatment outcome in patients treated with FOLFIRI + BVZ. The CD39 rs11188513 SNP is located in the 3’-UTR region of the gene, which is considered a binding site for miR-155 that could regulate the function of CD39 [31,32]. Tokonuga et al. also proposed it could work as a tag SNP and thus affect functional effects through related polymorphisms at other loci of CD39 [30]. Although the effect of this SNP of CD39 on phenotypic change remains unknown, several authors have suggested CD39 could be a checkpoint inhibitor target in that it prevents adenosine’s immunosuppressive effects, thus playing an important role in tumour progression [33]. Recently, a new role was identified for this SNP as a prognostic and predictive biomarker of BVZ treatment outcome [30]. Further work focusing on this SNP is warranted.
The explanation of inter-individual differences in the efficacy of BVZ as an anti-angiogenic drug to treat mCRC has not been well established yet. In our study, the MMP9 polymorphisms rs2236416 and rs2274755 were related to PFS following CT+BVZ treatment. MMP9 mainly acts as a collagenase degrading type IV collagen, and is critical for tumour cell growth, migration, invasion, metastasis and angiogenesis [34,35]. Based on its broad functions, several studies and meta-analyses have identified MMP9 as a potential biomarker in various cancers [36,37,38]. Further, genetic variation influencing MMP9 expression could contribute to cancer susceptibility. Numerous MMP9 polymorphisms have been reported, of which several are considered functional. However, the roles of many of these SNPs remain unclear. In terms of genetic variability and clinical outcome of bevacizumab treatment, data for SNPs of genes encoding MMPs are scarce. In the present study, based on data from Makhoul et al. we explored the impact of the MMP9 polymorphisms rs2236416 and rs2274755 on the response to CT+BVZ shown by patients with mCRC. These authors showed that these two SNPs of the MMP9 gene and its protein could influence tumour susceptibility to BVZ [24]. In effect, patients with these genetic variants were found more likely to show a pathologic complete response (pCR) in a prospective phase II trial testing the use of BVZ as neoadjuvant to chemotherapy in breast cancer patients. Here, tumours homozygous for the wild-type alleles of MMP9 rs2236416 and rs2274755 showed a median PFS of 9.48 months, and carrying at least one variant allele led to a reduced median PFS of 6 and 6.62 months, respectively (p = 0.022, p = 0.043, respectively). The MMP9 rs2274755 locus is located in an intron (boundary) of the MMP9 gene and occurs at the third base of the fourth intron. It therefore shows the potential to influence RNA splicing. The functional relevance of this SNP needs to be further investigated. While this MMP9 rs2274755 has been investigated in several studies, none of these studies have examined its impact on the efficacy of BVZ treatment in mCRC patients, and available data suggest that this SNP might be involved in the development of asthma [39]. MMP9 rs2236416 is an intron variant, and a significantly lower frequency of its wild-type (A) allele has been reported among individuals with Henoch-Schönlein purpura nephritis (HSPN) [40]. No functional data are available for this polymorphism. Although the precise molecular mechanism underlying our observations is unclear, a possible explanation is that the two variants of the MMP9 gene may lead to the modified expression of this gene in mCRC patients with a negative impact on their response to BVZ treatment.
A further finding of our study was a significant association between FGF2 rs1960669, an intronic tag-SNP, and PFS detected in a univariate analysis. This finding is especially interesting given the functional role of fibroblast growth factor (FGF)-2 in tumour biology with important implications for cancer therapies and clinical outcomes. FGF2 is a potent angiogenic molecule involved in tumour progression, and is one of several growth factors with a central role in ovarian cancer [41]. FGF2 has been associated with the regulation of tumour angiogenesis and metastasis, and has been positively correlated with epidermal growth factor (EGF) and IGF in breast cancer [42]. Abnormally high concentrations of FGF2 have been found in the serum of patients with active metastatic cancers and these have been shown to correlate significantly with extent of disease, clinical status and mortality risk [43]. Makhoul et al. showed that FGF2 rs1960669 was associated with a pathologic complete response in their prospective phase II study of the use of BVZ as neoadjuvant to chemotherapy in breast cancer patients [24]. In future work, it will be interesting to address the role of FGF2 rs1960669 in mCRC cancer survival and prognosis. If the efficacy of BVZ can be predicted according to individual genotype this could help with novel approaches to risk stratification or the use of anti-angiogenic treatment strategies. We speculate that the FGF2 variant investigated here could influence the expression of specific isoforms, which might then uniquely influence tumour progression in response to BVZ.
VEGF-independent angiogenic signalling plays an important role in the development of colorectal cancer. A molecule involved in this pathway is ANGPT1. Our results indicate that OS is improved in patients carrying the wild-type ANGPT1 rs2445365 variant while none of the other SNPs examined had any impact on this clinical parameter. While this may appear a shortcoming of our study, it does support the fact that angiogenesis inhibitors targeting the VEGF signalling pathway, such as BVZ, show significant therapeutic efficacy in various cancers [23]. In cancer patients, the treatment response is frequently transient and this could be the consequence of resistance to angiogenesis inhibition, adaptive resistance or intrinsic non-responsiveness [14]. These modes of resistance could be attributed to the inherent heterogeneity of genetically unstable tumour cells, the presence of redundant angiogenic factors, and the recruitment of hematopoietic cells and inflammatory cells into the tumour mass [14]. Thus, genetic variations in ANGPT genes may lead to altered gene production and result in their activation/inactivation. SNPs of the ANGPT1 gene have been associated with the risk of autoimmune diseases, juvenile idiopathic arthritis, and portopulmonary hypertension [44,45], and also with the risk and clinical outcome of colorectal cancer (rs1954727) [46]. Makhoul et al. showed that ANGPT1 rs2445365 was linked to a pathologic complete response (pCR) in their prospective phase II study of the use of bevacizumab as neoadjuvant to chemotherapy in breast cancer patients [24]. In our study, we observed that the wild-type allele of ANGPT1 rs2445365, might improve the overall survival of mCRC patients treated with CT + BVZ. This SNP is located in the intron region of the ANGPT1 gene and while the impact of this SNP on phenotypic change is still unknown, this finding merit further investigation. There is evidence to suggest that the ANGPT-TIE (ANGPT-TEK receptor) pathway is crucial for angiogenesis and vascular homeostasis in a VEGF-independent manner, and also of a link between angiogenesis and inflammation pathways [47]. The up-regulation of ANGPT1 in many cancers suggests this gene is strongly associated with tumour malignancy [47], and this could mean that ANGPT1 rs2445365 affects the activity of this protein and that activation of angiopoietin-1/Tek signalling in the vasculature could induce metastasis. Further, several studies have reported an inhibiting effect of ANGPT1 on pathologic vascular expansion, suggesting its function as a tumour suppressor in several cancers, including CRC [48,49,50,51]. These findings suggest the effects of ANGPT1 on genetic tumour characteristics and prognosis might be cancer-specific and also dependent on other angiogenesis-related genes.
This study has limitations, as for instance, its rather small sample size and the heterogeneous nature of tumour tissue and clinical treatment. The potential clinical implications of these SNPs raise the need to perform larger studies with more patients and homogeneous clinical treatments. In case of further studies would sustain the usefulness of these SNPs as biomarkers, the genotyping would be very useful to select patients with probably good prognosis to treatment and to avoid side effects in those with more risks to suffer them. This personalized medicine would be a good and cheap strategy with easy implementation in the daily clinical to improve the treatment of mCRC with antiangiogenic drugs as BVZ.

4. Materials and Methods

4.1. Design and Patients

The study population comprised 57 patients with histologically confirmed mCRC who were treated at the Oncology Department of the University Fuenlabrada Hospital between 2009 and 2019. They received bevacizumab in combination with chemotherapy (FOLFOX or FOLFORIFI, Xeloda, 5-Fluoroacil, or Irinotecan). Patient data were collected retrospectively through chart review by a medical oncologist (Dr. D Malón). The tumour biopsy site (left-sided colon or right-sided colon) and the type of biopsy (surgical specimen (both excisional and incisional), core needle biopsy) were obtained from medical records. This study was conducted at the Department of Oncology, University Hospital of Fuenlabrada, Madrid, Spain, in accordance with the Declaration of Helsinki and the International Conference on Harmonisation (ICH) Good Clinical Practice. Approval was obtained from our Hospital’s Ethics Committee (identification code: APR 15/38, August 2015) and Research Committee of the European University (identification code: CIPI/18/106, April 2018). Written informed consent to participate in this study was obtained from all patients.
Baseline clinical examinations and staging CT-scans were performed each three weeks after starting treatment. Response Evaluation Criteria in Solid Tumors (RECIST) were used to determine the response rate. Patients’ responses were categorized as good (complete or partial response after 6 months of BVZ treatment, R group) or no response (stable or progressive disease after 6 months of BVZ treatment, nR group). Responsible physicians decided upon the maintenance of treatment. The study endpoints were progression-free survival (PFS), and overall survival (OS). PFS was calculated as the time from the first day of treatment until the first observation of disease progression or any-cause death. OS was defined as the time from the first day of treatment to any-cause death. If a patient remained alive and their cancer had not progressed, PFS and OS were censored at the time of last follow-up.

4.2. Candidate Polymorphisms

Genes and polymorphisms known to regulate VEGF-dependent and independent angiogenesis were selected based on published research and public databases. The predefined criteria used were: a) scientific information available to support the involvement of the gene in angiogenesis signalling pathways; b) polymorphisms published as biomarkers of a response to BVZ treatment in cancer, mainly CRC; and c) minor allele frequency > 5% in Caucasians. 20 SNPs of 13 genes were analysed: A2BR rs2015353, ANGPT1 rs2445365, ANGPT2 (rs10102851, rs1375668, rs2515462), CCL5 rs2280789, CD39 rs11188513, EDN1 rs5370, FGF2 rs1960669, IGF1 rs6220, MKNK1 rs8602, MMP9 (rs2236416, rs2274755), NT5E rs2229523, TOP1 (rs34282819, rs6072249), VEGF-A (rs3025039, rs833061, rs833068, rs833069). At a glance classification of the genes analysed in this study according to their Gene Ontology-Biological processes are provided in Table 2. This classification revealed that all the SNPs analysed affect genes directly or indirectly related to angiogenesis.

4.3. Tumour DNA Extraction and Genotyping

Surgical (i.e., either incisional or excisional biopsies that required a surgical procedure) and core needle biopsies were processed using standard techniques (fixation in 10% neutral buffered formalin and paraffin-embedding). Once a diagnosis was established in histologic and/or immunohistologic staining profiles, the residual materials in the formalin-fixed paraffin-embedded (FFPE) tissue blocks were used for molecular analysis. When multiple tissue blocks were available, the one with the highest tumour cellularity was chosen, without additional tumour microdissection or enrichment.
For each paraffin-embedded block, 3–5 slices of 5 μm were collected using an ultramicrotome (Leica EM UC7, Wetzlar, Germany), always discarding the first slices. DNA extraction from these samples was performed using a Maxwell R 16 FFPE plus Lev DNA Purification Kit (Promega, Madison, WI, USA) following the manufacturer’s recommendations. The DNA samples were re-suspended in DNAse-free water (50 μL). The concentration and quality of DNA samples were quantified with the Nanodrop 2000 (Thermo Fisher Scientific, Wilmington, DE, USA), and only samples with a DNA concentration of 50 ng/μL or more that met standard quality criteria were selected for genotyping. The DNA quality criterion used was the ratio of the absorbance at 260 nm divided by the reading at 280 nm. Good-quality DNA has a A260/A280 ratio of 1.8–2.0. Good quality samples were stored at −20 °C in 96 well plates.
Genotyping of 20 SNPs was conducted by the Spanish National Genotyping (CeGen-PRB2-ISCIII, www.cegen.org) using the iPlex® Gold chemistry and MassARRAY platform, according to manufacturer’s instructions (Agena Bioscience, San Diego, CA, USA). Genotyping assays were designed on GRCh38 version using the Agena Bioscience MassARRAY Assay Designer 4.0 software (Agena Bioscience, San Diego, CA, USA). The 20 SNPs were genotyped in 2 independent assays. PCR reactions were set up in a 5 µl volume and contained 20 ng of template DNA, 1× PCR buffer, 2 mM MgCl2, 500 µM dNTPs and 1 U/reaction of PCR enzyme. Reagents for PCR were for Agena Bioscience (San Diego, CA, USA). A pool of PCR primers was made at a final concentration of each primer of 100 nM. The thermal cycling conditions for the reaction consisted of an initial denaturation step at 94 °C for 2 min, followed by 45 cycles of 94 °C for 30 s, 56 °C for 30 s and 72 °C for 1 min, followed by a final extension step of 72 °C for 1 min. Unincorporated dTNPs were dephosphorylated using shrimp alkaline phosphatase (SAP), so PCR products were treated with 0.6 U shrimp alkaline phosphatase by incubation at 37 °C for 40 min, followed by enzyme inactivation by heating at 85 °C for 5 min.
The iPLEX Gold reactions were set up in a final 9 µl volume and contained 0.222x iPLEX buffer Plus, 0.5x iPLEX termination mix and 0.5x iPLEX enzyme. An extension primer mix was made to give a final concentration of each primer between 0.73 µM and 1.46 µM. The thermal cycling conditions for the reaction included an initial denaturation step at 94 °C for 30 s, followed by 40 cycles of 94 °C for 5 s, with an internal 5 cycles loop at 52 °C for 5 s and 80 °C for 5 s, followed by a final extension step of 72 °C for 3 min. The next step is to desalt the iPLEX Gold reaction products with Clean Resin (Agena Bioscience, San Diego, CA, USA) following the manufacturer’s protocol. The desalted products were dispensed onto a 384 Spectrochip II using an RS1000 Nanodispenser and spectra were acquired using the MA4 (Agena Bioscience, San Diego, CA, USA) mass spectrometer, followed by manual inspection of spectra by trained personnel using MassARRAY Typer software v4.0.26 (Agena Bioscience, San Diego, CA, USA). All assays were performed in 384-well plates, including negative controls and a trio of Coriell samples (Na10861, Na11994 and Na11995) for quality control. Two samples and two SNPs (MMPA-rs17577 and CDKAL1-rs7453577) were discarded because of low reproducibility, and not considered for further analysis. The SNP rs444903, that represent an intergenic region, was not considered for further analysis. Internal controls showed 100% reproducibility and genotyping success.
Allele and genotype frequencies for all the SNPs (13 genes and 20 SNPs, see Table 2) were estimated by direct counting; genotype and allele distributions were compared to those provided in 1000 Genomes European populations [22]. All the genes frequencies examined showed good agreement with Hardy–Weinberg equilibrium.

4.4. Statistical Analysis

Quantitative variables are given as medians with interquartile range (IQR) or as a mean ± standard deviation (SD), according to their distribution (Shapiro–Wilk test for normality). For qualitative variables, absolute and relative frequencies are given in percentages.
Associations between polymorphisms and baseline clinical characteristics (Table 1) and tumour response were examined using contingency tables and the Fisher’s exact test. Hazard ratio (HR) and 95% confidence interval (95% CI) were estimated using a Cox proportional hazards model. OS and PFS hazard ratios (HR) and their 95% confidence intervals were estimated for each class and polymorphism. Kaplan–Meier survival curves and long-rank tests were performed to test differences in OS and PFS between patients carrying at least one variant allele (VV and VW) and patients carrying two wild-type alleles as well as for patients carrying two variant alleles (VV) and those carrying none or a single variant allele (VW or WW) for each polymorphism. Kaplan–Meier graphs were generated using the Stata statistical package (STATA IC, software version 14, StataCorp LLC, Texas USA), which was also used for all statistical tests. Significance was set at p ≤ 0.05.

Supplementary Materials

The following are available online at https://www.mdpi.com/1422-0067/22/3/1381/s1

Author Contributions

A.N. conceived the project and managed the funding support. D.M., B.A. and A.M. were responsible for data collection. M.G. (María Gaibar) and M.G. (Miguel Galan) headed the experiments. A.R.-L. analysed the data. A.N. and A.F.-S. wrote and reviewed the manuscript. All authors have read, reviewed and agreed to the published version of the manuscript.

Funding

Supported by University Hospital of Fuenlabrada, Universidad Europea de Madrid (project 2018/UEM25 and 2017/UEM04) and the Foundation of the European University (project numbers FGUE001804 and FGUE001805).

Institutional Review Board Statement

The study was conducted according to the guidelines of the Declaration of Helsinki, and approved by the Ethics Committee of University Hospital of Fuenlabrada (protocol code APR 15/38, August 2015) and Research Committee of the European University (identification code: CIPI/18/106, April 2018).

Informed Consent Statement

Informed consent was obtained from all subjects involved in the study.

Acknowledgments

The genotyping was carried out at Spanish National Genotyping Centre (CeGen-PRB2-ISCIII, www.cegen.org). The authors thank C. Andreu-Vazquez for help with the statistical treatment of data.

Conflicts of Interest

The authors declare no conflict of interest.

Abbreviations

A2ARAdenosine A2a receptor
A2BRAdenosine A2b receptor
ANGPT1 Angiopoietin 1
ANGPT2 Angiopoietin 2
ANGP-TIEAngiopoietin receptor TEK
BVZBevacizumab
CCL5C-C motif chemokine ligand 5
CD39Ectonucleoside triphosphate diphosphohydrolase 1 (ENTPD1)
CRCColorectal cancer
CTChemotherapy
EDN1Endothelin 1
FGF2Fibroblast growth factor 2
IGF1Insulin like growth factor 1
mCRCMetastatic colorectal cancer
MKNK1MAPK interacting serine/threonine kinase 1
MMP9Matrix metallopeptidase 9
NT5E5′-Nucleotidase ecto
OSOverall survival
pCRPathological complete response
PFSProgression-free survival
RECISTResponse Evaluation Criteria in Solid Tumors
RRResponse rate
RResponders
nRNon-responders
SNPSingle nucleotide polymorphism
TOP1Topoisomerase
TregsRegulatory T cells
VEGFA Vascular endothelial growth factor A

References

  1. Sharma, R. An examination of colorectal cancer burden by socioeconomic status: Evidence from GLOBOCAN 2018. EPMA J. 2020, 11, 95–117. [Google Scholar] [CrossRef]
  2. Li, H.; Chen, Y.-X.; Wen, J.-G.; Zhou, H.-H. Metastasis-associated in colon cancer 1: A promising biomarker for the metastasis and prognosis of colorectal cancer. Oncol. Lett. 2017, 14, 3899–3908. [Google Scholar] [CrossRef] [PubMed] [Green Version]
  3. Valle, L.; Vilar, E.; Tavtigian, S.V.; Stoffel, E.M. Genetic predisposition to colorectal cancer: Syndromes, genes, classification of genetic variants and implications for precision medicine. J. Pathol. 2019, 247, 574–588. [Google Scholar] [CrossRef] [PubMed]
  4. Custodio, A.; Barriuso, J.; De Castro, J.; Martínez-Marín, V.; Moreno, V.; Rodríguez-Salas, N.; Feliu, J. Molecular markers to predict outcome to antiangiogenic therapies in colorectal cancer: Current evidence and future perspectives. Cancer Treat. Rev. 2013, 39, 908–924. [Google Scholar] [CrossRef] [PubMed]
  5. Eng, L.; Liu, G. VEGF pathway polymorphisms as prognostic and pharmacogenetic factors in cancer: A 2013 update. Pharmacogenomics 2013, 14, 1659–1667. [Google Scholar] [CrossRef]
  6. Rosen, L.S.; Jacobs, I.A.; Burkes, R.L. Bevacizumab in Colorectal Cancer: Current Role in Treatment and the Potential of Biosimilars. Target. Oncol. 2017, 12, 599–610. [Google Scholar] [CrossRef]
  7. Welch, S.; Spithoff, K.; Rumble, R.B.; Maroun, J. Bevacizumab combined with chemotherapy for patients with advanced colorectal cancer: A systematic review. Ann. Oncol. 2010, 21, 1152–1162. [Google Scholar] [CrossRef]
  8. Botrel, T.E.A.; De Clark, L.G.O.; Paladini, L.; Clark, O.A.C. Efficacy and safety of bevacizumab plus chemotherapy compared to chemotherapy alone in previously untreated advanced or metastatic colorectal cancer: A systematic review and meta-analysis. BMC Cancer 2016, 16, 677. [Google Scholar] [CrossRef] [Green Version]
  9. Tebbutt, N.C.; Wilson, K.; Gebski, V.J.; Cummins, M.M.; Zannino, D.; Van Hazel, G.A.; Robinson, B.; Broad, A.; Ganju, V.; Ackland, S.P.; et al. Capecitabine, bevacizumab, and mitomycin in first-line treatment of metastatic colorectal cancer: Results of the Australasian Gastrointestinal Trials Group Randomized Phase III MAX Study. J. Clin. Oncol. 2010, 28, 3191–3198. [Google Scholar] [CrossRef]
  10. Ruan, W.-C.; Che, Y.-P.; Ding, L.; Li, H.-F. Efficacy and Toxicity of Addition of Bevacizumab to Chemotherapy in Patients with Metastatic Colorectal Cancer. Comb. Chem. High Throughput Screen. 2018, 21, 718–724. [Google Scholar] [CrossRef]
  11. Cunningham, D.; Atkin, W.; Lenz, H.-J.; Lynch, H.T.; Minsky, B.; Nordlinger, B.; Starling, N. Colorectal cancer. Lancet 2010, 375, 1030–1047. [Google Scholar] [CrossRef]
  12. Dirican, A.; Varol, U.; Kucukzeybek, Y.; Alacacioglu, A.; Erten, C.; Somali, I.; Can, A.; Demir, L.; Bayoglu, I.V.; Akyol, M. Treatment of metastatic colorectal cancer with or without bevacizumab: Can the neutrophil/lymphocyte ratio predict the efficiency of bevacizumab. Asian Pac. J. Cancer Prev. 2014, 15, 4781–4786. [Google Scholar] [CrossRef] [PubMed] [Green Version]
  13. Shojaei, F.; Ferrara, N. Refractoriness to antivascular endothelial growth factor treatment: Role of myeloid cells. Cancer Res. 2008, 68, 5501–5504. [Google Scholar] [CrossRef] [PubMed] [Green Version]
  14. Bergers, G.; Hanahan, D. Modes of resistance to anti-angiogenic therapy. Nat. Rev. Cancer 2008, 8, 592–603. [Google Scholar] [CrossRef] [PubMed] [Green Version]
  15. Okazaki, S.; Loupakis, F.; Stintzing, S.; Cao, S.; Zhang, W.; Yang, D.; Ning, Y.; Sunakawa, Y.; Stremitzer, S.; Matsusaka, S.; et al. Clinical significance of tlr1 i602s polymorphism for patients with metastatic colorectal cancer treated with folfiri plus bevacizumab. Mol. Cancer Ther. 2016, 15, 1740–1745. [Google Scholar] [CrossRef] [Green Version]
  16. Di Salvatore, M.; Pietrantonio, F.; Orlandi, A.; Del Re, M.; Berenato, R.; Rossi, E.; Caporale, M.; Guarino, D.; Martinetti, A.; Basso, M.; et al. IL-8 and eNOS polymorphisms predict bevacizumab-based first line treatment outcomes in RAS mutant metastatic colorectal cancer patients. Oncotarget 2017, 8, 16887–16898. [Google Scholar] [CrossRef] [Green Version]
  17. Sunakawa, Y.; Stintzing, S.; Heinemann, V.; Cremolini, C.; Falcone, A.; Cao, S.; Yang, D.; Zhang, W.; Yamauchi, S.; Ning, Y.; et al. Variations in genes regulating tumor-associated macrophages (TAMs) to predict outcome of bevacizumab (bev)-based treatment in patients with metastatic colorectal cancer (mCRC): Results from TRIBE and FIRE3 trials. J. Clin. Oncol. 2015, 33, 3552. [Google Scholar] [CrossRef]
  18. Ulivi, P.; Scarpi, E.; Passardi, A.; Marisi, G.; Calistri, D.; Zoli, W.; Del Re, M.; Frassineti, G.L.; Tassinari, D.; Tamberi, S.; et al. eNOS polymorphisms as predictors of efficacy of bevacizumab-based chemotherapy in metastatic colorectal cancer: Data from a randomized clinical trial. J. Transl. Med. 2015, 13, 1–10. [Google Scholar] [CrossRef]
  19. Matsusaka, S.; Zhang, W.; Cao, S.; Hanna, D.L.; Sunakawa, Y.; Sebio, A.; Ueno, M.; Yang, D.; Ning, Y.; Parekh, A.; et al. TWIST1 Polymorphisms Predict Survival in Patients with Metastatic Colorectal Cancer Receiving First-Line Bevacizumab plus Oxaliplatin-Based Chemotherapy. Mol. Cancer Ther. 2016, 15, 1405–1411. [Google Scholar] [CrossRef] [Green Version]
  20. Loupakis, F.; Cremolini, C.; Yang, D.; Salvatore, L.; Zhang, W.; Wakatsuki, T.; Bohanes, P.; Schirripa, M.; Benhaim, L.; Lonardi, S.; et al. Prospective Validation of Candidate SNPs of VEGF/VEGFR Pathway in Metastatic Colorectal Cancer Patients Treated with First-Line FOLFIRI Plus Bevacizumab. PLoS ONE 2013, 8, e66774. [Google Scholar] [CrossRef]
  21. Novillo, A.; Gaibar, M.; Romero-Lorca, A.; Gilsanz, M.F.; Beltrán, L.; Galán, M.; Antón, B.; Malón, D.; Moreno, A.; Fernández-Santander, A. Efficacy of bevacizumab-containing chemotherapy in metastatic colorectal cancer and CXCL5 expression: Six case reports. World J. Gastroenterol. 2020, 26, 1979–1986. [Google Scholar] [CrossRef] [PubMed]
  22. Auton, A.; Abecasis, G.R.; Altshuler, D.M.; Durbin, R.M.; Bentley, D.R.; Chakravarti, A.; Clark, A.G.; Donnelly, P.; Eichler, E.E.; Flicek, P.; et al. A global reference for human genetic variation. Nature 2015, 526, 68–74. [Google Scholar] [PubMed] [Green Version]
  23. Raouf, S.; Bertelli, G.; Ograbek, A.; Field, P.; Tran, I. Real-world use of bevacizumab in metastatic colorectal, metastatic breast, advanced ovarian and cervical cancer: A systematic literature review. Future Oncol. 2019, 15, 543–561. [Google Scholar] [CrossRef] [PubMed]
  24. Makhoul, I.; Todorova, V.K.; Siegel, E.R.; Erickson, S.W.; Dhakal, I.; Raj, V.R.; Lee, J.Y.; Orloff, M.S.; Griffin, R.J.; Henry-Tillman, R.S.; et al. Germline genetic variants in TEK, ANGPT1, ANGPT2, MMP9, FGF2 and VEGFA are associated with pathologic complete response to bevacizumab in breast cancer patients. PLoS ONE 2017, 12, e0168550. [Google Scholar] [CrossRef] [Green Version]
  25. Aprile, G.; Ferrari, L.; Fontanella, C.; Puglisi, F. Bevacizumab in older patients with advanced colorectal or breast cancer. Crit. Rev. Oncol. Hematol. 2013, 87, 41–54. [Google Scholar] [CrossRef]
  26. Gerger, A.; El-Khoueiry, A.; Zhang, W.; Yang, D.; Singh, H.; Bohanes, P.; Ning, Y.; Winder, T.; Labonte, M.J.; Wilson, P.M.; et al. Pharmacogenetic angiogenesis profiling for first-line Bevacizumab plus oxaliplatin-based chemotherapy in patients with metastatic colorectal cancer. Clin. Cancer Res. 2011, 17, 5783–5792. [Google Scholar] [CrossRef] [Green Version]
  27. Yegutkin, G.G. Nucleotide- and nucleoside-converting ectoenzymes: Important modulators of purinergic signalling cascade. Biochim. Biophys. Acta 2008, 1783, 673–694. [Google Scholar] [CrossRef] [Green Version]
  28. Deaglio, S.; Dwyer, K.M.; Gao, W.; Friedman, D.; Usheva, A.; Erat, A.; Chen, J.-F.; Enjyoji, K.; Linden, J.; Oukka, M.; et al. Adenosine generation catalyzed by CD39 and CD73 expressed on regulatory T cells mediates immune suppression. J. Exp. Med. 2007, 204, 1257–1265. [Google Scholar] [CrossRef] [Green Version]
  29. Häusler, S.F.M.; Montalbán del Barrio, I.; Strohschein, J.; Chandran, P.A.; Engel, J.B.; Hönig, A.; Ossadnik, M.; Horn, E.; Fischer, B.; Krockenberger, M.; et al. Ectonucleotidases CD39 and CD73 on OvCA cells are potent adenosine-generating enzymes responsible for adenosine receptor 2A-dependent suppression of T cell function and NK cell cytotoxicity. Cancer Immunol. Immunother. 2011, 60, 1405–1418. [Google Scholar] [CrossRef]
  30. Tokunaga, R.; Cao, S.; Naseem, M.; Lo, J.H.; Battaglin, F.; Puccini, A.; Berger, M.D.; Soni, S.; Millstein, J.; Zhang, W.; et al. Prognostic Effect of Adenosine-related Genetic Variants in Metastatic Colorectal Cancer Treated With Bevacizumab-based Chemotherapy. Clin. Colorectal Cancer 2019, 18, e8–e19. [Google Scholar] [CrossRef]
  31. Liu, J.; Shi, K.; Chen, M.; Xu, L.; Hong, J.; Hu, B.; Yang, X.; Sun, R. Elevated miR-155 expression induces immunosuppression via CD39+ regulatory T-cells in sepsis patient. Int. J. Infect. Dis. 2015, 40, 135–141. [Google Scholar] [CrossRef] [PubMed] [Green Version]
  32. Zhao, J.; Cao, Y.; Lei, Z. Selective Depletion of CD4 + CD25 + Foxp3 + Regulatory T Cells by Low-Dose Cyclophosphamide Is Explained by Reduced Intracellular ATP Levels T Cells by Low-Dose Cyclophosphamide Is Explained. Cancer Res. 2010, 70. [Google Scholar] [CrossRef] [PubMed] [Green Version]
  33. Zhao, H.; Bo, C.; Kang, Y.; Li, H. What else can CD39 tell us? Front. Immunol. 2017, 8, 727. [Google Scholar] [CrossRef] [PubMed] [Green Version]
  34. Deryugina, E.I.; Quigley, J.P. Matrix metalloproteinases and tumor metastasis. Cancer Metastasis Rev. 2006, 25, 9–34. [Google Scholar] [CrossRef] [PubMed]
  35. Egeblad, M.; Werb, Z. New functions for the matrix metalloproteinases in cancer progression. Nat. Rev. Cancer 2002, 2, 161–174. [Google Scholar] [CrossRef] [PubMed]
  36. Beeghly-Fadiel, A.; Lu, W.; Shu, X.-O.; Long, J.; Cai, Q.; Xiang, Y.; Gao, Y.-T.; Zheng, W. MMP9 Polymorphisms and Breast Cancer Risk: A Report from the Shanghai Breast Cancer Genetics Study. Breast Cancer Res. Treat. 2011, 126, 507–513. [Google Scholar] [CrossRef] [PubMed] [Green Version]
  37. Quintero-Fabián, S.; Arreola, R.; Becerril-Villanueva, E.; Torres-Romero, J.C.; Arana-Argáez, V.; Lara-Riegos, J.; Ramírez-Camacho, M.A.; Alvarez-Sánchez, M.E. Role of Matrix Metalloproteinases in Angiogenesis and Cancer. Front. Oncol. 2019, 9, 1370. [Google Scholar] [CrossRef] [Green Version]
  38. Huang, H. Matrix Metalloproteinase-9 (MMP-9) as a Cancer Biomarker and MMP-9 Biosensors: Recent Advances. Sensors 2018, 18, 3249. [Google Scholar] [CrossRef] [Green Version]
  39. Jiménez-Morales, S.; Martínez-Aguilar, N.; Gamboa-Becerra, R.; Jiménez-Ruíz, J.L.; López-Ley, D.; Lou, H.; Saldaña-Alvarez, Y.; Dean, M.; Orozco, L. Polymorphisms in metalloproteinase-9 are associated with the risk for asthma in Mexican pediatric patients. Hum. Immunol. 2013, 74, 998–1002. [Google Scholar] [CrossRef]
  40. Xu, E.D.; Xiao, Y.F.; Wang, J.J.; Dong, L. Association study between matrix metalloproteinase-9 gene (MMP9) polymorphisms and the risk of Henoch-Schönlein purpura in children. Genet. Mol. Res. 2016, 15, 1–7. [Google Scholar] [CrossRef]
  41. Johnatty, S.E.; Beesley, J.; Chen, X.; Spurdle, A.B.; DeFazio, A.; Webb, P.M.; Goode, E.L.; Rider, D.N.; Vierkant, R.A.; Anderson, S.; et al. Polymorphisms in the FGF2 gene and risk of serous ovarian cancer: Results from the ovarian cancer association consortium. Twin Res. Hum. Genet. 2009, 12, 269–275. [Google Scholar] [CrossRef] [PubMed] [Green Version]
  42. Slattery, M.L.; John, E.M.; Stern, M.C.; Herrick, J.; Lundgreen, A.; Giuliano, A.R.; Hines, L.; Baumgartner, K.B.; Torres-Mejia, G.; Wolff, R.K. Associations with growth factor genes (FGF1, FGF2, PDGFB, FGFR2, NRG2, EGF, ERBB2) with breast cancer risk and survival: The Breast Cancer Health Disparities Study. Breast Cancer Res. Treat. 2013, 140, 587–601. [Google Scholar] [CrossRef] [PubMed] [Green Version]
  43. Nguyen, M.; Watanabe, H.; Budson, A.E.; Richie, J.P.; Hayes, D.F.; Folkman, J. Elevated levels of an angiogenic peptide, basic fibroblast growth factor, in the urine of patients with a wide spectrum of cancers. J. Natl. Cancer Inst. 1994, 86, 356–361. [Google Scholar] [CrossRef] [PubMed]
  44. Roberts, K.E.; Fallon, M.B.; Krowka, M.J.; Brown, R.S.; Trotter, J.F.; Peter, I.; Tighiouart, H.; Knowles, J.A.; Rabinowitz, D.; Benza, R.L.; et al. Genetic risk factors for portopulmonary hypertension in patients with advanced liver disease. Am. J. Respir. Crit. Care Med. 2009, 179, 835–842. [Google Scholar] [CrossRef]
  45. Thompson, S.D.; Sudman, M.; Ramos, P.S.; Marion, M.C.; Ryan, M.; Tsoras, M.; Weiler, T.; Wagner, M.; Keddache, M.; Haas, J.P.; et al. The susceptibility loci juvenile idiopathic arthritis shares with other autoimmune diseases extend to PTPN2, COG6, and ANGPT1. Arthritis Rheum. 2010, 62, 3265–3276. [Google Scholar] [CrossRef]
  46. Dai, J.; Wan, S.; Zhou, F.; Myers, R.E.; Guo, X.; Li, B.; Fu, X.; Palazzo, J.P.; Dou, K.; Yang, H.; et al. Genetic polymorphism in a VEGF-independent angiogenesis gene ANGPT1 and overall survival of colorectal cancer patients after surgical resection. PLoS ONE 2012, 7, e34758. [Google Scholar] [CrossRef] [Green Version]
  47. Huang, H.; Bhat, A.; Woodnutt, G.; Lappe, R. Targeting the ANGPT-TIE2 pathway in malignancy. Nat. Rev. Cancer 2010, 10, 575–585. [Google Scholar] [CrossRef]
  48. Yu, Q.; Stamenkovic, I. Angiopoietin-2 is implicated in the regulation of tumor angiogenesis. Am. J. Pathol. 2001, 158, 563–570. [Google Scholar] [CrossRef] [Green Version]
  49. Hawighorst, T.; Skobe, M.; Streit, M.; Hong, Y.-K.; Velasco, P.; Brown, L.F.; Riccardi, L.; Lange-Asschenfeldt, B.; Detmar, M. Activation of the tie2 receptor by angiopoietin-1 enhances tumor vessel maturation and impairs squamous cell carcinoma growth. Am. J. Pathol. 2002, 160, 1381–1392. [Google Scholar] [CrossRef] [Green Version]
  50. Hayes, A.J.; Huang, W.Q.; Yu, J.; Maisonpierre, P.C.; Liu, A.; Kern, F.G.; Lippman, M.E.; McLeskey, S.W.; Li, L.Y. Expression and function of angiopoietin-1 in breast cancer. Br. J. Cancer 2000, 83, 1154–1160. [Google Scholar] [CrossRef]
  51. Stoeltzing, O.; Ahmad, S.A.; Liu, W.; McCarty, M.F.; Wey, J.S.; Parikh, A.A.; Fan, F.; Reinmuth, N.; Kawaguchi, M.; Bucana, C.D.; et al. Angiopoietin-1 inhibits vascular permeability, angiogenesis, and growth of hepatic colon cancer tumors. Cancer Res. 2003, 63, 3370–3377. [Google Scholar] [PubMed]
Figure 1. (A) PFS in response to bevacizumab treatment in patients with MMP9 rs2236416 A/A vs. A/G /GG (9.48 vs. 6 months, p = 0.022). (B) PFS in response to bevacizumab treatment in patients with MMP9 rs2274755 G/G vs. G/T /TT (9.48 vs. 6.82 months, p = 0.043). (C) PFS in response to bevacizumab treatment in patients with FGF2 rs1960669 C/C vs. C/A /AA (10.95 vs. 5.44 months, p = 0.001).
Ijms 22 01381 g001
Figure 2. OS in response to bevacizumab treatment in patients with ANGPT1 rs2445365 G/G vs. G/A/AA (30.92 vs. 22.07 months, p = 0.034).
Ijms 22 01381 g002
Table 1. Patient characteristics (n = 57).
CharacteristicNumber (%)
Response to bevacizumab
R (responder)30 (52.6%)
nR (non responder)27 (47.4%)
Sex
Female16 (28%)
Male41 (72%)
Age (years)
<5513 (22.8%)
55–6520 (35.1%)
> 6524 (42.1%)
Metastases,
Liver, lung, peritoneum or other
116 (27.7%)
222 (38.6%)
>219 (33.3)
Primary tumour site
Right17 (30%)
Left40 (70%)
Tumour stage at diagnosis,
I0
II2 (3.5%)
III16 (28.1%)
IV39 (68.4%)
KRAS status,
Mutated42 (76%)
Normal13 (24%)
Chemotherapy backbone,
FOLFOX27 (47%)
FOLFORI21 (37%)
OTHER (Xeloda, 5-Fu, Irotecan)9 (16%)
BVZ-regimen
133 (58.9%)
215 (26.7%)
36 (10.7%)
41 (1.8%)
51 (1.8%)
Surgical resection
Yes20 (35%)
No37 (65%)
Table 2. Genotype frequencies of the SNPs examined and classification of genes according to their biological process (gene ontology). Indicated are allele frequencies of the SNPs analysed found in the 1000 Genomes database [22]. (W = wild-type allele, V = Variant allele).
Gene OntologyGenetic Variants
Type
Genotypes
WW
WV
VV
Treated Patients,
n (%)
Alleles (%)
W
V
1000 Genomes
Allele Frequency
European
Adenosine pathwayA2BR rs2015353 (ADORA2B)TT8 (15.09)T = 0.39
C = 0.60
T = 0.46
C = 0.53
T > CTC26 (49.05)
Coding variantCC19 (35.85)
ENTPD1 (CD39) rs11188513CC6 (10.53)C = 0.31
T = 0.68
C = 0.36
T = 0.63
C > TCT24 (42.10)
Intron variantTT27 (47.37)
NT5E (CD73) rs2229523AA3 (5.36)A = 0.29
G = 0.71
A = 0.29
G = 0.70
A > GAG26 (46.43)
Missense variantGG27 (48.21)
Direct angiogenesisANGPT1 rs2445365GG33 (57.89)G = 0.75
A = 0.25
G = 0.75
A = 0.25
G > A, CGA20 (35.09)
Intron variantAA4 (7.02)
ANGPT2 rs10102851AA53 (92.98)A = 0.97
G = 0.03
A = 0.97
G = 0.03
A > GAG4 (7.02)
Intron variantGG0
ANGPT2 rs1375668GG6 (10.71)G = 0.27
A = 0.73
G = 0.34
A = 0.66
G > A, CGA18 (32.14)
Intron variantAA32 (57.14)
ANGPT2 rs2515462AA4 (7.02)A = 0.29
G = 0.71
A = 0.32
G = 0.68
A > C, G, TAG25 (43.86)
Intron variantGG28 (49.12)
VEGFA rs833061CC10 (17.54)C = 0.42
T = 0.58
C = 0.50
T = 0.50
C > G, TCT28 (49.12)
Upstream transcript variantTT19 (33.33)
VEGFA rs833068GG17 (29.82)G = 0.54
A = 0.46
G = 0.69
A = 0.31
G > AGA28 (49.12)
Intron variantAA12 (21.05)
VEGFA rs833069TT16 (29.09)T = 0.54
C = 0.46
T = 0.69
C = 0.31
T > C, GTC27 (49.09)
Intron variantCC12 (21.82)
VEGFA rs3025039CC43 (75.44)C = 0.88
T = 0.12
C = 0.88
T = 0.12
C > TCT13 (22.81)
3 prime UTR variantTT1 (1.75)
FGF2 rs1960669CC46 (82.14)C = 0.90
A = 0.1
C = 0.84
A = 0.16
C > ACA9 (16.07)
Intron variantAA1 (1.79)
MMP9 rs2236416AA43 (75.44)A = 0.86
G = 0.14
A = 0.83
G = 0.17
A > GAG12 (21.05)
Intron variantGG2 (3.51)
MMP9 rs2274755GG43 (76.78)G = 0.87
T = 0.13
G = 0.83
T = 0.17
G > TGT12 (21.43)
Intron variantTT1 (1.79)
Cytokine signallingEDN1 rs5370GG34 (60.71)G = 0.79
T = 0.21
G = 0.78
T = 0.22
G > TGT20 (35.71)
Missense variantTT2 (3.57)
CCL5 rs2280789AA47 (82.46)A = 0.89
G = 0.11
A = 0.89
G = 0.11
A > G, C, TAG7 (12.28)
Intron variantGG3 (5.26)
DNA Topological changeTOP1 rs34282819CC44 (77.19)C = 0.89
A = 0.11
C = 0.92
A = 0.08
C > ACA13 (22.81)
5 prime transcript variantAA0
TOP1 rs6072249AA18 (31.58)A = 0.57
G = 0.43
A = 0.55
G = 0.45
A > GAG29 (50.88)
Upstream transcript variantGG10 (17.54)
Intracellular signal transductionMKNK1 rs8602CC29 (53.70)C = 0.74
A = 0.26
C = 0.72
A = 0.18
C > ACA22 (40.74)
Non coding transcript variantAA3 (5.56)
Growth factorIGF1 rs6220GG4 (7.14)G = 0.23
A = 0.77
G = 0.27
A = 0.73
G > AGA18 (32.14)
3 prime UTR variantAA34 (60.71)
Table 3. Genetic heterogeneity of mCRC tumours investigated in this study according to tumour stage. Patient and number of mutated genes according to tumour stage are depicted.
Number of Mutated Genes (of 13) Analyzed in This Study
Tumour Stage<7 genes7 genes8 genes9 genes10 genes11 genes
Number of patients with mutated genes (% of total patients in each stage)
II 1 (50)1 (50)
III 4 (25)5 (31)5 (31)2 (13)
IV6 (15,5)11 (28)6 (15,5)11 (28)3 (8)2 (5)
Table 4. Analysis of polymorphisms according to progression-free survival (PFS) and overall survival (OS).
Genetic VariantPFSOS
Median (Months)
(95% CI)
Hazard Ratio
p-Value
Median (Months)
(95% CI)
Hazard Ratio
p-Value
A2BR rs2015353
TT6.20 (2.89–16.56)0.57 (0.26–1.24)12.52 (4.89-...)0.70 (0.31–1.60)
TC/CC10.39 (7.05–15.64)0.14928.39 (21.48–34.89)0.397
ENTPD1(CD39) rs11188513
CC9.41 (2.43–…)1.71 (0.65–4.46)43.84 (12.52–…)2.32 (0.71–7.54)
CT/TT8.75 (7.05–13.18)0.27223.51 (19.38–30.92)0.150
NT5E (CD73) rs229523
AA9.48 (6.62–…)0.8 (0.25–5.59)27.54 (11.84-..)0.59 (0.18–1.95)
AG/GG9.41 (7.05–13.18)0.70823.87 (20.72–34.89)0.386
ANGPT1 rs2445365
GG9.48 (6.62–14.03)1.2 (0.689–2.06)30.92 (21.48–37.87)1.91 (1.04–3.5)
GA/AA8.75 (5.74–15.7)0.51922.07 (12.52–29.28)0.034
ANGPT2 rs10102851
AA8.75 (6,89–13.05)0.97 (0.30–3.15) --
AG/GG14.03 (12.43–…)0.953--
ANGPT2 rs1375668
GG10.43 (5.44–…)0.66 (0.27–1.58)21.48 (12.20–…)0.72 (0.24–2.08)
GA/AA9.41 (7.21–14.03)0.34323.87 (20–34.89)0.544
ANGPT2 rs2515462
AA10.39 (5.74–…)0.74 (0.26–2.09)21.48 (12.20–…)0.82 (0.19–3.51)
AG/GG8.75 (7.05–13.18)0.56827.54 (20–32.89)0.787
VEGFA rs833061
CC5.61 (2.79–15.64)0.71 (0.36–1.43)21.48 (4.89–32.89)0.77 (0.37–1.61)
CT/TT9.48 (7.21–13.18)0.33723.87 (18.85–35.02)0.481
VEGFA rs833068
GG9.48 (5.44–15.64)1 (0.56–1.80)22.2 (14.75–36.52)0.93 (0.48–1.78)
GA/AA9.41 (6.62–13.18)0.99923.87 (18.85–34.89)0.821
VEGFA rs833069
TT8.52 (5.44–15.48)0.98 (0.54–1.79)28.39 (14.75–36.52)1.03 (0.53–2.02)
TC/CC9.41 (6.62–13.18)0.94623.87 (18.62–34.89)0.926
VEGFA rs3025039
CC9.41 (6.89–13.18)1.10 (0.59–2.03)23.87 (19.38–32.89)0.84 (0.4–1.75)
CT/TT8.52 (5.74–16.56)0.76927.54(11.74–…)0.634
FGF2 rs1960669
CC10.95 (7.84–15.70)3.30 (1.52–7.14)27.54 (20–34.89)1.45 (0.69–3.05)
CA/AA5.44 (2.43–9.48) 0.00122.20 (9.97–32.89)0.324
MMP9 rs2236416
AA9.48 (7.84–15.64)2.04 (1.09–3.80)23.51 (19.38–29.74)0.91 (0.46–1.81)
AG/GG6 (2.79–10.95)0.02232.74 (12.20–43.84)0.786
MMP9 rs2274755
GG9.48 (7.84–15.64)1.91 (1.01–3.63)23.51 (19.38–29.74)0.9 (0.44–1.84)
GT/TT6.62 (2.89–10.95)0.04335.02 (12.20–43.84)0.780
EDN1 rs5370
GG10.43 (7.21–16.26)1.29 (0.74–2.26)23.51 (18.85–34.89)1.02 (0.55–1.88)
GT/TT7.84 (4.20–14.03)0.36727.54 (11.84–35.02)0.957
CCL5 rs2280789
AA9.48 (7.21–15.48)1.44 (0.7–2.98)27.54 (21.48–32.89)1.17 (0.49–2.79)
AG/GG7.44 (2.89–12.43)0.32316.03 (7.31-...)0.723
TOP1 rs34282819
CC8.52 (6.89–12.43)0.8 (0.42–1.54)23.87 (20.72–32.72)0.93 (0.46–1.91)
CA/AA16.26 (4.20–21.08)0.50127.54 (9.97–44.49)0.853
TOP1 rs6072249
AA11.34 (5.44–18.10)1.05 (0.58–1.91)23.51 (12.10–35.02)0.87 (0.45–1.65)
AG/GG8.75 (7.05–13.05)0.86223.87 (19.38–34.89)0.662
MKNK1 rs8602
CC8.75 (6.89–13.18)1.04 (0.59–1.83)23.51 (16.03–36.52)1.18 (0.63–2.20)
CA/AA11.34 (7.21–16.56)0.90428.39 (21.48–34.89)0.614
IGF1 rs6220
GG13.05 (12.43–…)1.09 (0.38–3.07)21.48 (4.89–32.89)1.7 (0.41–7.07)
GA/AA8.52 (6.62–11.34)0.87423.87 (18.85–35.02)0.457
Publisher’s Note: MDPI stays neutral with regard to jurisdictional claims in published maps and institutional affiliations.

