Article

Solution Structure, Dynamics, and New Antifungal Aspects of the Cysteine-Rich Miniprotein PAFC

1
Department of Organic Chemistry, Faculty of Science and Technology, University of Debrecen, H-4032 Debrecen, Hungary
2
Institute of Molecular Biology, Biocenter, Medical University of Innsbruck, A-6020 Innsbruck, Austria
3
Institute of Plant Biology, Biological Research Centre, Eötvös Loránd Research Network, H-6726 Szeged, Hungary
4
Department of Biotechnology, Faculty of Science and Informatics, University of Szeged, H-6726 Szeged, Hungary
5
Department of Plant Biology, Faculty of Sciences and Informatics, University of Szeged, H-6726 Szeged, Hungary
6
Department of Medical Chemistry, Faculty of Medicine, University of Szeged, H-6720 Szeged, Hungary
7
Institute of Biochemistry, Biological Research Centre, Eötvös Loránd Research Network, H-6726 Szeged, Hungary
8
MTA-SZTE Biomimetic Systems Research Group, University of Szeged, Dóm tér 8, H-6720 Szeged, Hungary
*
Authors to whom correspondence should be addressed.
These authors share first authorship.
Int. J. Mol. Sci. 2021, 22(3), 1183; https://doi.org/10.3390/ijms22031183
Submission received: 30 December 2020 / Revised: 18 January 2021 / Accepted: 20 January 2021 / Published: 25 January 2021
(This article belongs to the Section Macromolecules)

Abstract

:
The genome of Penicillium chrysogenum Q176 contains a gene coding for the 88-amino-acid (aa)-long glycine- and cysteine-rich P. chrysogenum antifungal protein C (PAFC). After maturation, the secreted antifungal miniprotein (MP) comprises 64 aa and shares 80% aa identity with the bubble protein (BP) from Penicillium brevicompactum, which has a published X-ray structure. Our team expressed isotope (15N, 13C)-labeled, recombinant PAFC in high yields, which allowed us to determine the solution structure and molecular dynamics by nuclear magnetic resonance (NMR) experiments. The primary structure of PAFC is dominated by 14 glycines, and therefore, whether the four disulfide bonds can stabilize the fold is challenging. Indeed, unlike the few published solution structures of other antifungal MPs from filamentous ascomycetes, the NMR data indicate that PAFC has shorter secondary structure elements and lacks the typical β-barrel structure, though it has a positively charged cavity and a hydrophobic core around the disulfide bonds. Some parts within the two putative γ-core motifs exhibited enhanced dynamics according to a new disorder index presentation of 15N-NMR relaxation data. Furthermore, we also provided a more detailed insight into the antifungal spectrum of PAFC, with specific emphasis on fungal plant pathogens. Our results suggest that PAFC could be an effective candidate for the development of new antifungal strategies in agriculture.

1. Introduction

Fungal infections of humans, animals, and plants have a severe impact on global health and jeopardize the food supply and wildlife biodiversity [1]. A major challenge in combating fungal diseases is the limited number of targets for effective antifungal therapy that is tolerated by the host. Therefore, the development of antifungal drug resistance poses a dangerous and fast-evolving risk, which strongly demands the search for new antifungal compounds with novel mechanisms of action and fungal-specific unique targets. Very promising candidates [2,3,4,5] for new antifungal strategies are represented by small, cysteine-rich, and cationic proteins from diverse organisms [6]. Filamentous ascomycetes are a rich source of secreted miniproteins (MPs) that exhibit high and exclusive efficacy against the growth of human, animal, and plant pathogenic fungi [7,8,9], and the first evidence promises antiviral efficacy as well [10]. These small and positively charged MPs have disulfide-stabilized β-barrel folds that render them tolerant toward high ion concentrations, extreme temperature, and proteolytic degradation [8,9,10,11,12,13,14]. Since no cytotoxic effects in mammalian cells have been described in vitro and in vivo so far [9,11,12,13], they are considered promising candidates for alternative antifungal strategies in clinics, veterinary science, agriculture, and food production.
Penicillium chrysogenum is unique among filamentous ascomycetes as its genome contains three genes coding for cysteine-rich, cationic MPs with reported antifungal activity: the P. chrysogenum antifungal protein (PAF), P. chrysogenum antifungal protein B (PAFB), and P. chrysogenum antifungal protein C (PAFC) [9,14]. It is known that P. chrysogenum MPs enter sensitive fungal cells without disrupting the plasma membrane, but they accumulate in the cytoplasm, induce the generation of intracellular reactive oxygen species (ROS), and ultimately trigger cell death [9,10,14,15]. The extensively studied PAF has a complex antifungal mode of action that is linked to cell signaling involving heterotrimeric G-protein [16] and protein kinase A [17], cation channels [18,19], and glucosylceramide synthesis [20] and is regulated by a specific protein motif that structurally resembles the Greek letter gamma (γ) [21]. This common, so-called γ-core motif with the consensus sequence GXCX3-9C (dextromeric form) or CX3-9CXGX1-3/CX3-9GXCX1-3 (levomeric forms) is found in many cysteine-stabilized MPs originating from organisms of diverse kingdoms [22,23].
The mature PAFC [14] is a unique example of antifungal MPs, since it has a molecular mass of 6.63 kDa and is slightly longer (64 amino acids (aa)) than the mature PAF (55 aa; 6.25 kDa) and PAFB (58 aa; 6.55 kDa) [10,11]. It shows 80% aa identity with the bubble protein (BP) of Penicillium brevicompactum [24] and 83% identity with the Penicillium expansum antifungal protein C (PeAfpC) [25] (Figure 1). Therefore, it phylogenetically belongs to the BP-clade of ascomycetous MPs, which is distinct from the PAF-clade that comprises the PAFC-related MPs PAF and PAFB [21]. PAFC contains an unusually high number of glycines (14) and has a net charge of +3.6 ± 0.1 at pH 4.5, as calculated considering the disulfide bonds, using in-house-written MATLAB code. This is due to a smaller number of cationic residues (6 arginines, 2 lysines, and 1 histidine) compared to PAF (13 lysines; net charge +6.7 ± 0.1; pH 4.5) and PAFB (8 lysines, 2 arginines, and 4 histidines; net charge +11.5 ± 0.2; pH 4.5). Furthermore, PAFC has two putative levomeric γ-core motifs (CX3-9CXGX1-3). One of them—positioned in the center of PAFC (CDRTGIVECKG)—is highly conserved among the MPs of the BP-clade, while the second, shorter one with lower homology resides near the C-terminus (CGGASCRG) (Figure 1) [14].
In previous studies, we acquired nuclear magnetic resonance (NMR) structure data of MPs of the filamentous ascomycetes Penicillium chrysogenum (PAF, 2mhv) [19,27], short form of PAFB, (sfPAFB, 2nc2) [9,10], and Neosartorya fischeri antifungal protein (NFAP, 5oqs) [28,29,30] that support a better understanding of the protein function and foster the improvement in antifungal efficacy by intentional modifications (protein engineering) [21].
So far, information about the three-dimensional structural data of MPs of the BP-clade is limited, as an X-ray structure was published only for the P. brevicompactum BP [24] and an in silico structure prediction exists for PAFC [14]. As the aa sequence of PAFC shows special features, our emphasis in this study was to experimentally verify that this MP has a folded structure, since the glycine-rich sequence requires four disulfide bonds to achieve folding. By acquiring the solution structure of PAFC, we disclosed its structural similarity to and differences from other antifungal MPs from ascomycetes. An overall low positive net charge, a short helix besides the five β-strands, and a positively charged cavity distinguish PAFC from the other two P. chrysogenum antifungal proteins PAF and PAFB. NMR relaxation-based dynamics was used to verify the monomeric and mostly rigid structure of PAFC. Dynamical peculiarities of the γ-core motif are important observations, since these regions are reported to contribute to the antimicrobial impact and spectrum of defensins and cationic MPs [22]. Finally, we provide an extended insight into the antimicrobial potential of PAFC and prove its specific antifungal but not antibacterial efficacy. As a proof-of-principle, we show the applicability of PAFC as a bio-fungicide in agriculture, as it protects tomato plant leaves against infection by the necrotrophic plant pathogen Botrytis cinerea.

2. Results

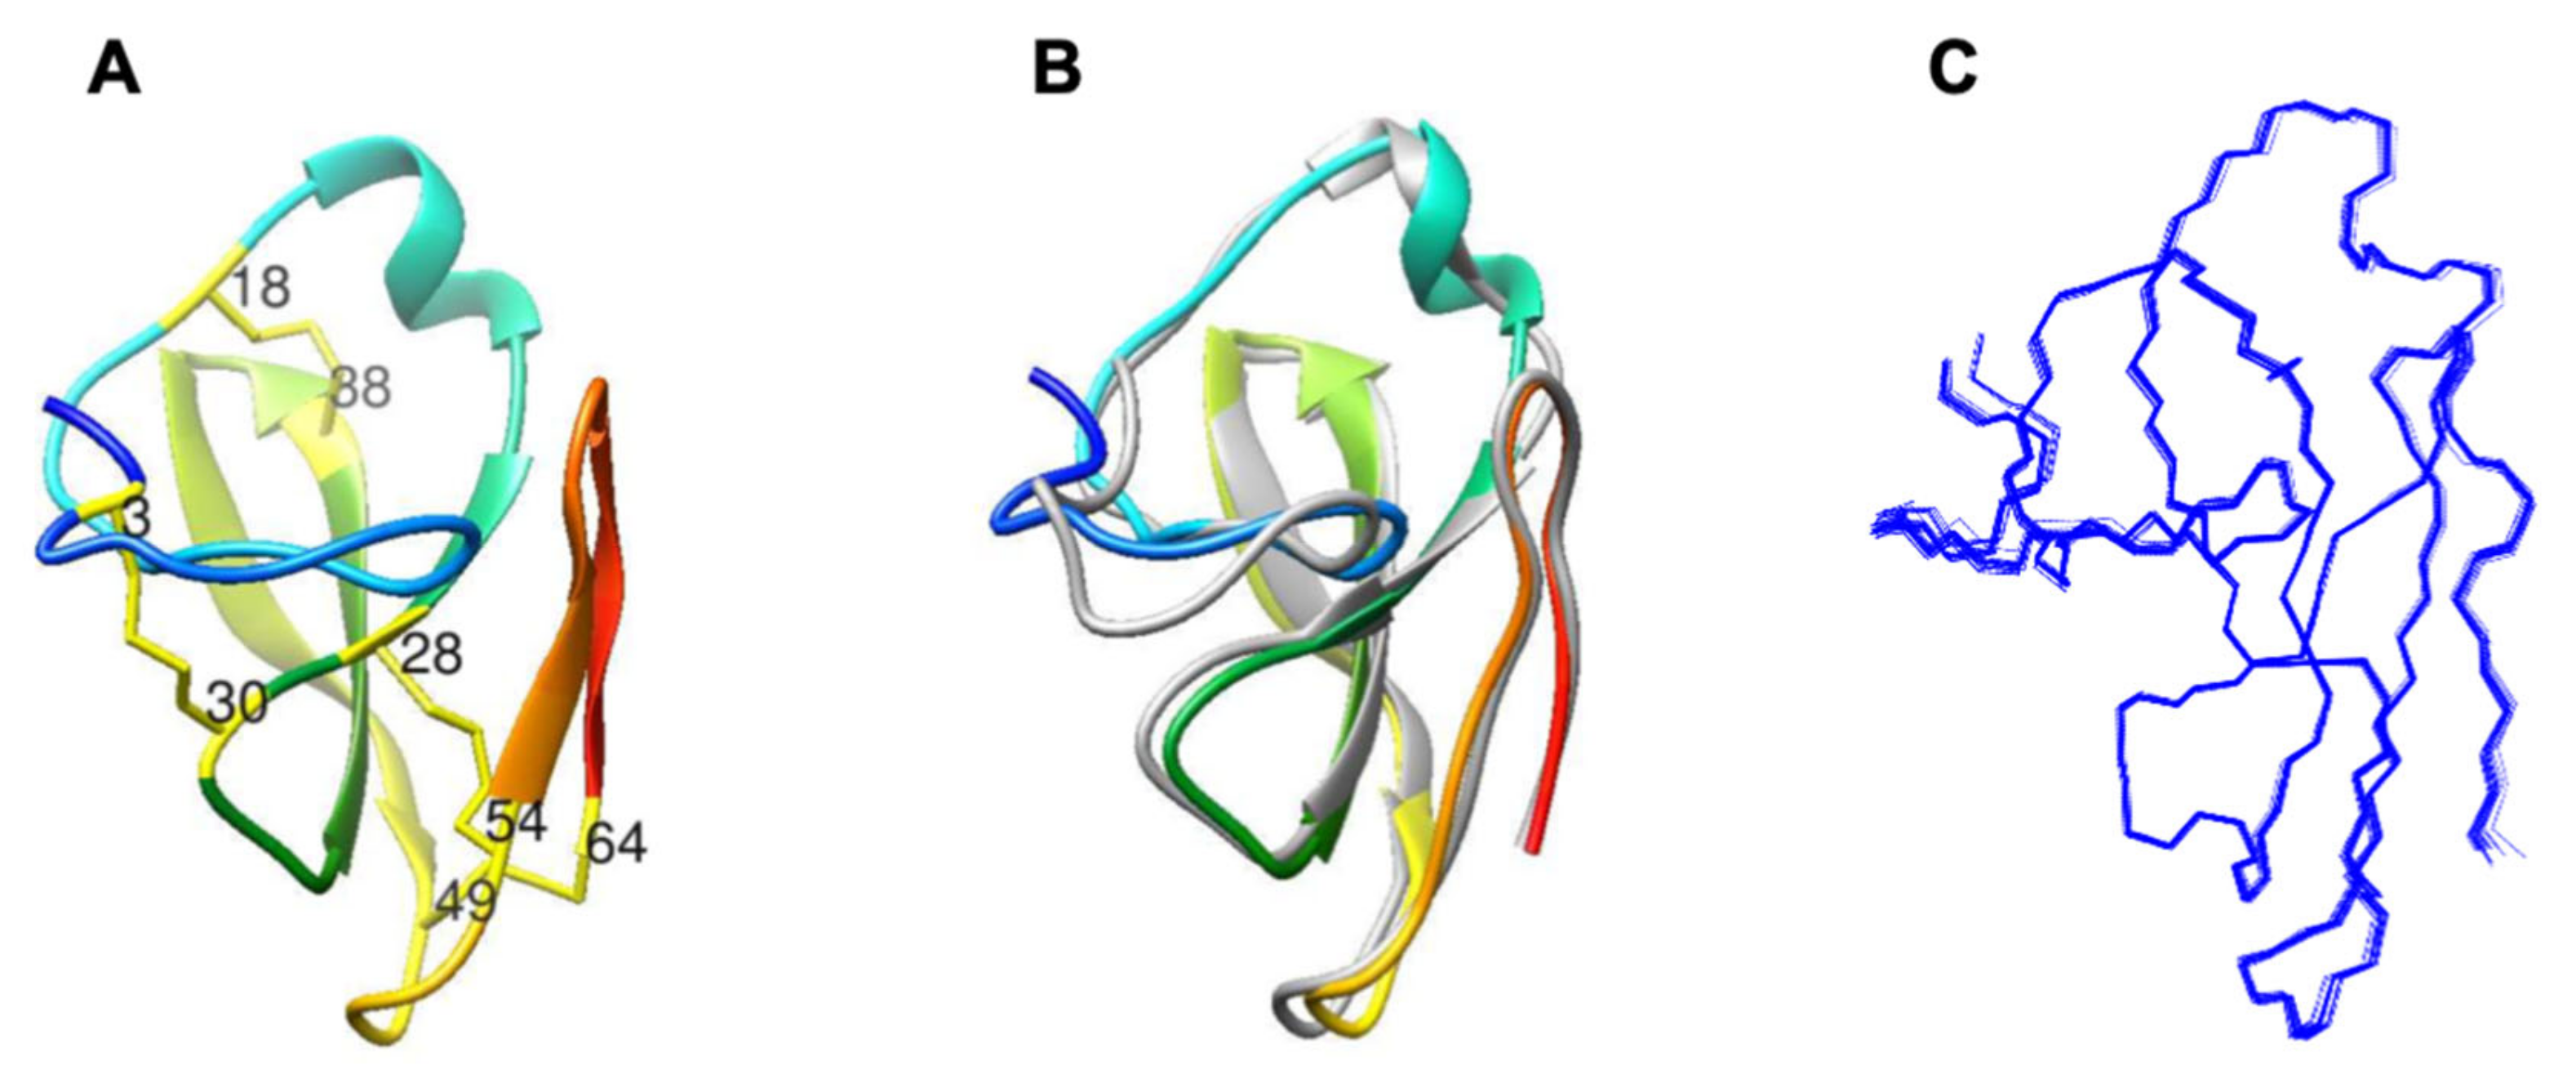
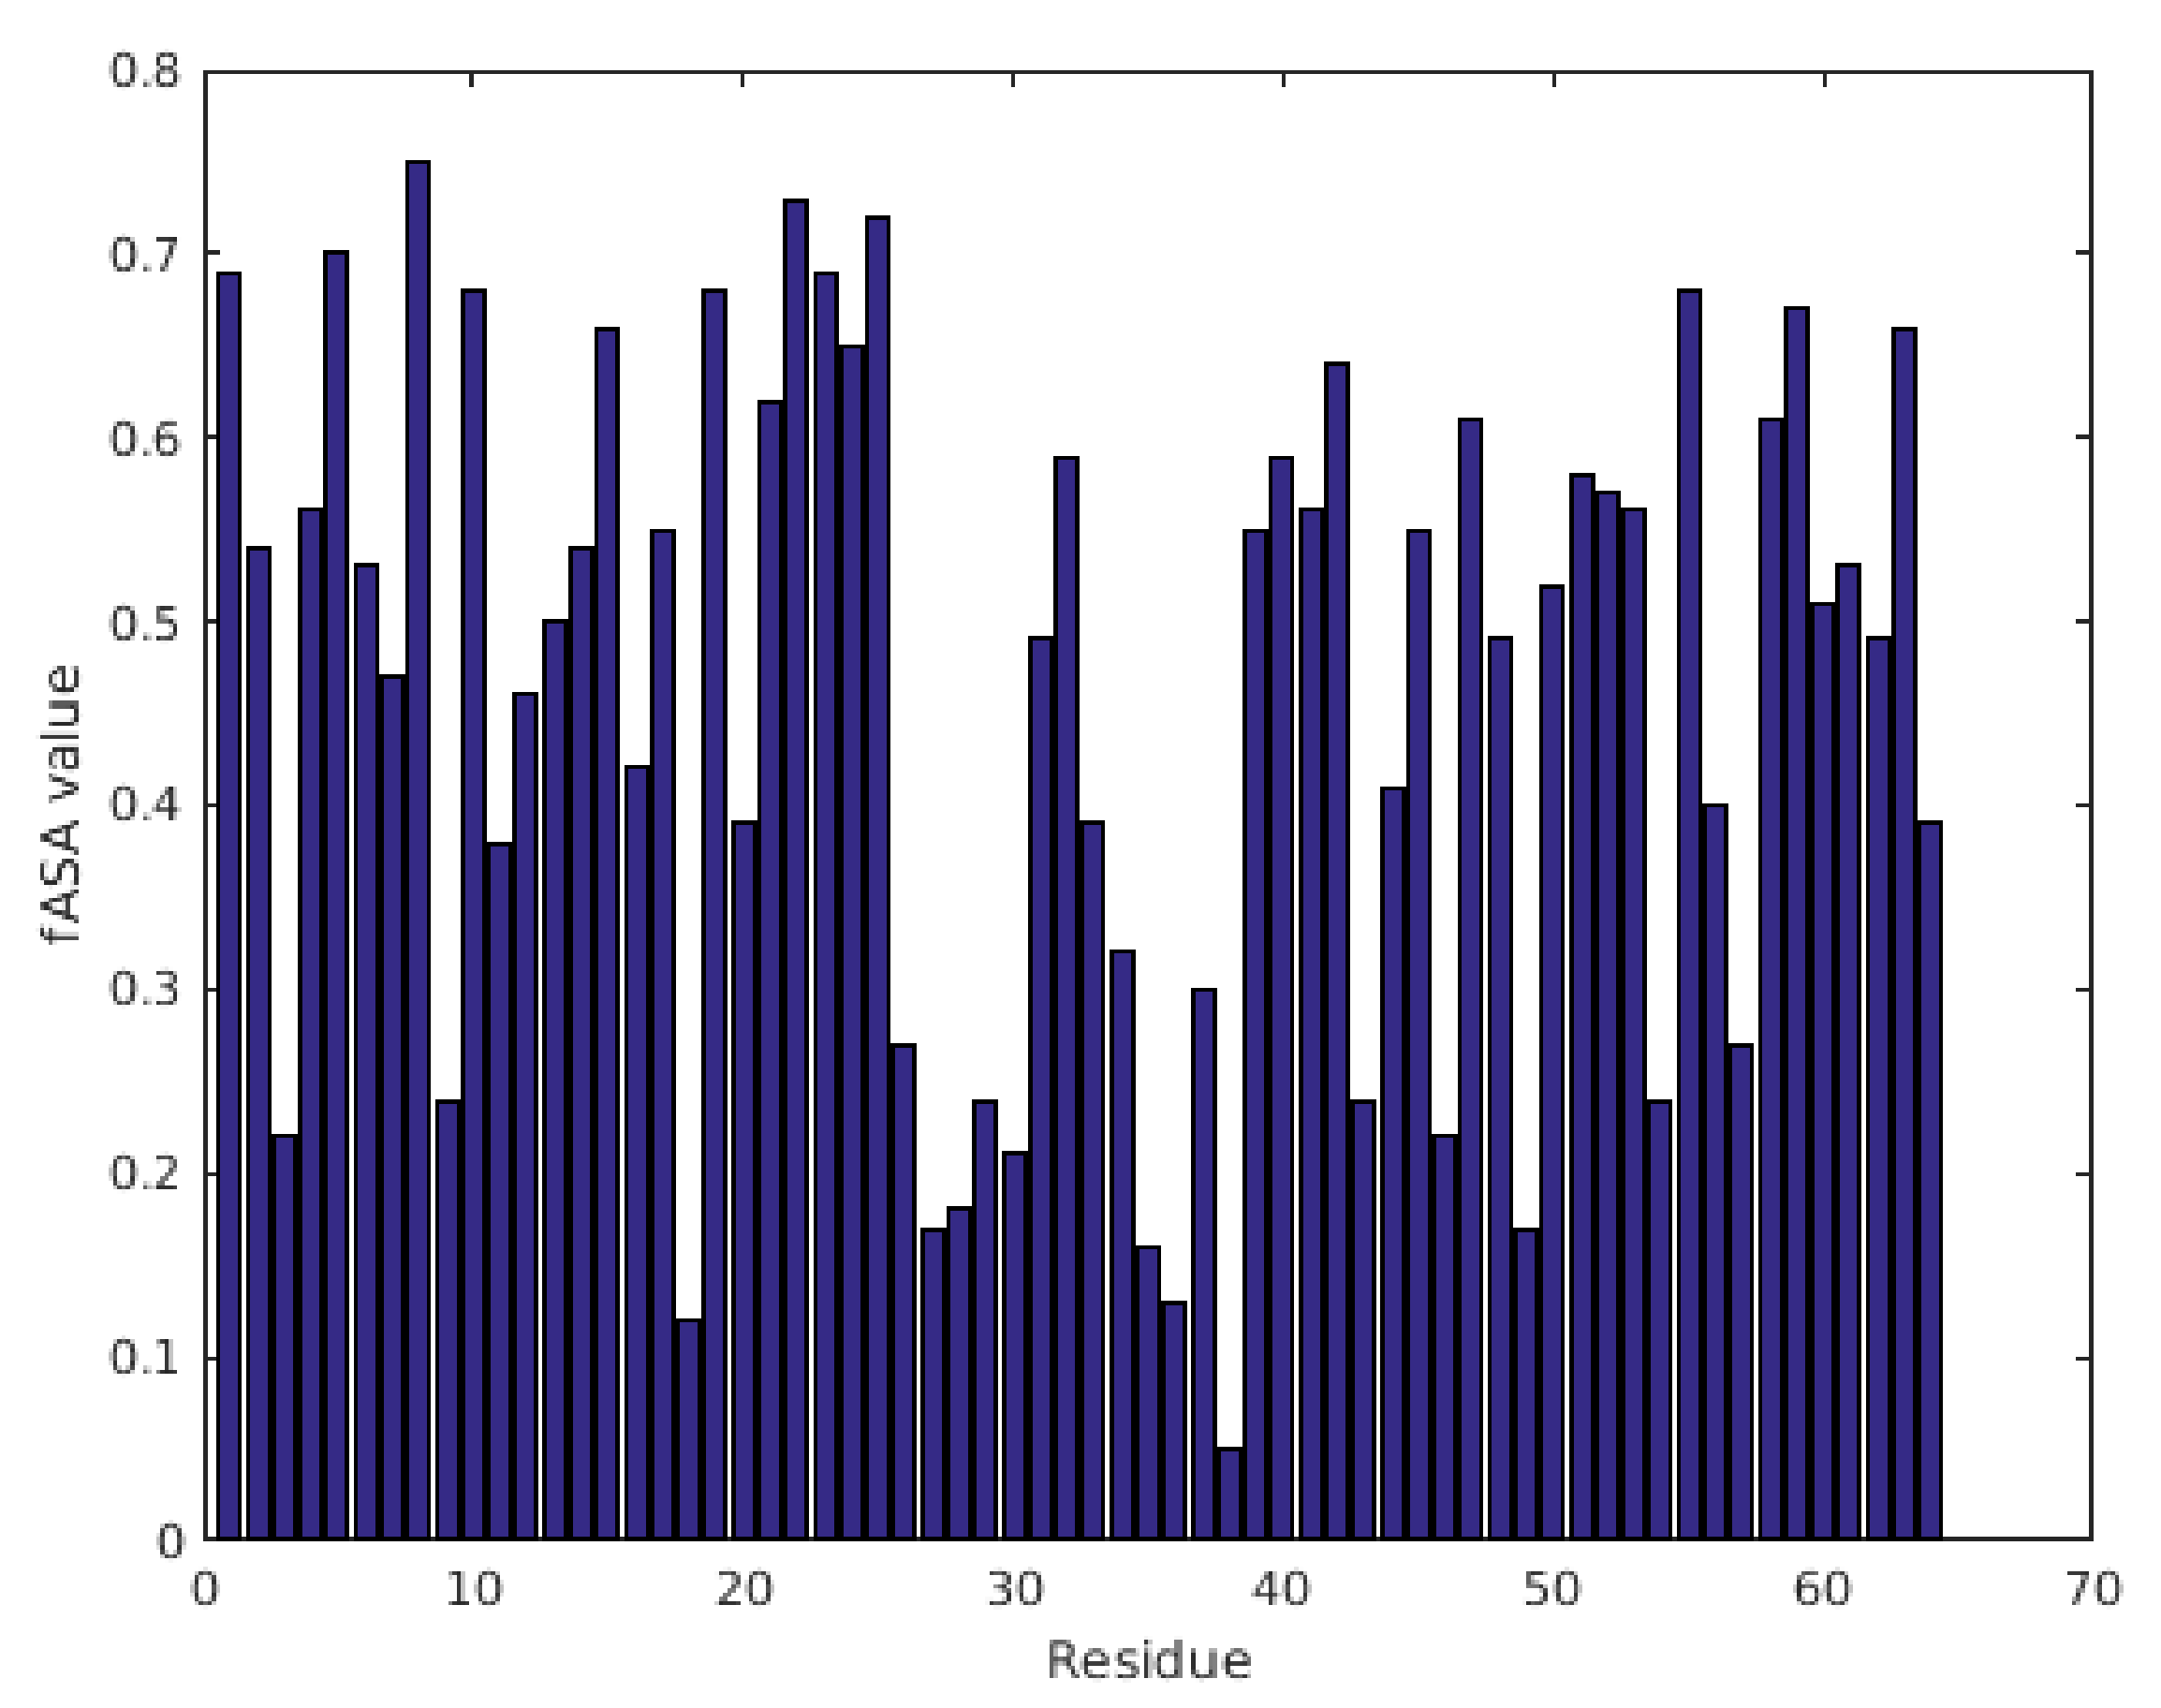
2.1. Characterization of Structural and Dynamical Properties of PAFC

Solution NMR spectroscopy was employed with the 15N- and 13C-labeled recombinant PAFC. All amide backbone and side-chain groups could be identified and assigned in the 1H-15N heteronuclear single quantum correlation (HSQC) spectrum due to the high dispersion of amide (NH) signals (Supplementary Figure S1). This fingerprint clearly showed that the protein adopts a well-folded structure. Many NH signals are split by high 3J (HN, HA) couplings, typical for β-strands. The large majority (97.1%, 90.6%, and 85.1%) of the 15N, 13C (all carbons, without aromatics), and 1H chemical shifts were successfully assigned. More than the half of the nuclear Overhauser effects (NOEs) proved to be either medium- (12.0%) or long-range (43.9%) interactions, which indicated a β-structure for PAFC. The Cβ 13C chemical shift values of all cysteines were typical for disulfide bridges [31], as expected. PAFC has the same abcabdcd-type disulfide bond pattern as BP, connecting 3-30, 18-38, 28-54, and 49-64 cysteines. This assumption was firmly supported by the structure calculations. When no disulfide bond constraints were added to the NOE constraints, nearly identical structures were obtained as with the disulfide-constrained cases. The high number of distance (14.3 NOE/residue) and backbone torsional angle constraints allowed us to calculate a high-quality NMR structure with a low (0.55 ± 0.06 Å) heavy-atom root-mean-square deviation (RMSD) value in the final model. The three-dimensional structure and chemical shift assignments of PAFC were deposited to the Protein Data Bank (pdb code 6TRM) and the Biological Magnetic Resonance Data Bank (BMRB entry no. 34468), respectively. According to official pdb validation analysis, only Cys3 was an outlier for Ramachandran statistics (Supplementary Table S1) of backbone dihedral angles, and according to our records no NOE violations were found.
The three-dimensional structure of PAFC (Figure 2A) shows the characteristic fold of the BP-clade as aligned with BP (Figure 2B), with an RMSD deviation of 1.01 Å between the two structures. The N-terminal part of the protein (1–25) does not form strict secondary structure elements. Though the random coil index (RCI) [32] derived from NMR chemical shifts was well below the critical 0.2 value, a peak value of 0.15 close to the N-terminus (around Gly8) is a sign of disorder. Also, according to the lower number of NOEs at the N-terminus, the conformations of the first seven residues are less well-defined if compared to the rest of PAFC. The next region (aa 8–19) adopts a mostly extended structure, interrupted by bend and turn-like motives (aa 9–10, aa 14–15). It is followed by a short and irregular 310-helix (Ala20–Asp24). In contrast, the C-terminal part of the protein forms a β-strand structure with two antiparallel β-sheets. The first one consists of three (β1, β2, and β3) and the latter one of two (β4, β5) β-strands. The positions of strands are His26–Cys28 for β1, Gly34–Lys39 for β2, Lys42–Asp48 for β3, Arg55–Val57 for β4, and Gly60–Arg63 for β5. The first, longer β-sheet is somewhat right-handed twisted, similarly to that of BP. Although the second one proved to be more irregular, still all the possible H-bonds were experimentally identified in this region (Table 1).
More detailed examination of the β-strands revealed the amphipathic nature of β1, β2-, β4-, and β5-strands. Interestingly, both C-terminal strands are partially positively charged, and they do not contain any acidic residues. In contrast, β3 consists of several charged aa, and it is rather hydrophilic based on the aa sequence, especially compared to other parts of the protein. The fractional associated solvent area (fASA) parameters, as obtained from 13C chemical shifts [35], report on the buried parts of the structure (Figure 3). Low fASA values are characteristic for buried residues. In PAFC, most minima are centered around the cysteines, thereby proving the existence of the usual disulfide-protected hydrophobic inner core of antifungal MPs [10,30].
Four small loops are situated between the β-strands. Three of them form β-turns (Cys30–Asp31, Gly40–Gly41, Ser58–Gln59), and the fourth, located between the two sheets, shows irregular γ-turn motives (at Gly50 and Ala52). The secondary structural analysis described above is consistent with that based on the Dictionary of Secondary Structures of Protein (DSSP) method [36]. PAFC, as a member of the BP-clade proteins, contains four disulfide bridges. While the first two (3–30, 18–38) connect the N-terminal region to the first β-pleated sheet, the others (28–54, 49–64) are located between the two sheets. This arrangement strongly stabilizes the tertiary structure of the protein, and this stability is further supported by several H-bonds formed between the N-terminal extended part and the β-sheets in the order of NH donor and CO acceptor sites (12Arg–28Cys, 28Cys–10Asp, 15Asn–43Trp, and 43Trp–16Ser). In PAFC, the side chains of Asp31, Glu45, and Asp48 are close to each other and form a small negatively charged surface region with the hydrophilic residues Thr33 and Ser53. Interestingly, the most basic side chains face outside and do not interact with one another or any acidic residues. One possible salt bridge can be identified between the side chains of Glu37 and His26, and only two basic arginines (32 and 55) are close to each other. Though the aromatic side chains Trp43 and Phe27 interact with each other to some extent, no significant aromatic core is present in PAFC and only Arg12 is in their vicinity. In contrast, a small hydrophobic core with Ile35 in the center is found near the C-terminal disulfide bonds, in agreement with low fASA values.
For studying the dynamical behavior of PAFC, 15N (70.96 MHz) NMR relaxation (T1, T2, NOE) measurements [37] were performed and evaluated using the Lipari–Szabo model-free method [38]. The 3.14 ± 0.36 ns global correlation time (τc) is similar to other monomeric antifungal MPs (PAF, NFAP). Details of relaxation analysis are provided in Table S2. The average S2 order parameter was calculated as S2 = 0.76 ± 0.11, which shows that PAFC has slightly higher flexibility on the ps–ns timescale if compared to PAF or NFAP [19,30]. To some surprise, the S2 values of even the N-terminal region proved to be similar to those of the β-strands (Supplementary Figure S2). Nevertheless, some residues are somewhat less rigid, including Gly6, Asn15, Glu37, Gly41, Gln47, Gly60, Gly61, and, especially, Gly51 and Ala52. Analysis of the R1*R2 relaxation rate combinations [39] showed that Arg32 and possibly Gly51 must be affected by chemical exchange (Supplementary Figure S3). The conventional reduced spectral density mapping approach (RSDM) [40] also suggests enhanced motions around Arg32 and Gly51 and to a lesser extent at Gly6, Tyr7, Gly8, Gly23, Thr33, Gly34, and E45 (Figure 4). Thus, the end of the first loop plus the β2-strand and the third loop are somewhat more flexible with higher mobility on the ps–ns timescale. However, Carr-Purcell-Meiboom-Gill relaxation dispersion (CPMG-RD) experiments could not detect mobility on a much slower (μs–ms) timescale (data not shown).
For better visualization of the same 15N relaxation data, we introduced a so-called disorder index, where the geometric distance from the rigid-body limiting curve of Figure 4 is displayed as a function of the residue number. Figure 5 clearly shows that extreme dynamics appears in the two γ-core regions between residues 30–40 and 49–56. Finally, we compared the RSDM, R1*R2, and model-free (MF) methods. Using the first two methods, we found that slow exchange must persist in region 32–34, which is not reflected in MF S2 values. On the other hand, the S2 values are low at Gly51 (0.39) and Ala52 (0.58), suggesting enhanced dynamics here at the ps–ns timescale. This fast timescale dynamics was not sensed by the R1*R2 method. In contrast, the more general RSDM methods displayed enhanced dynamics in both regions, independent of the timescale. Interestingly, 15N CPMG-RD T2 relaxation dispersion experiments were insensitive in detecting dynamics at intermediate timescales (μs–ms range).

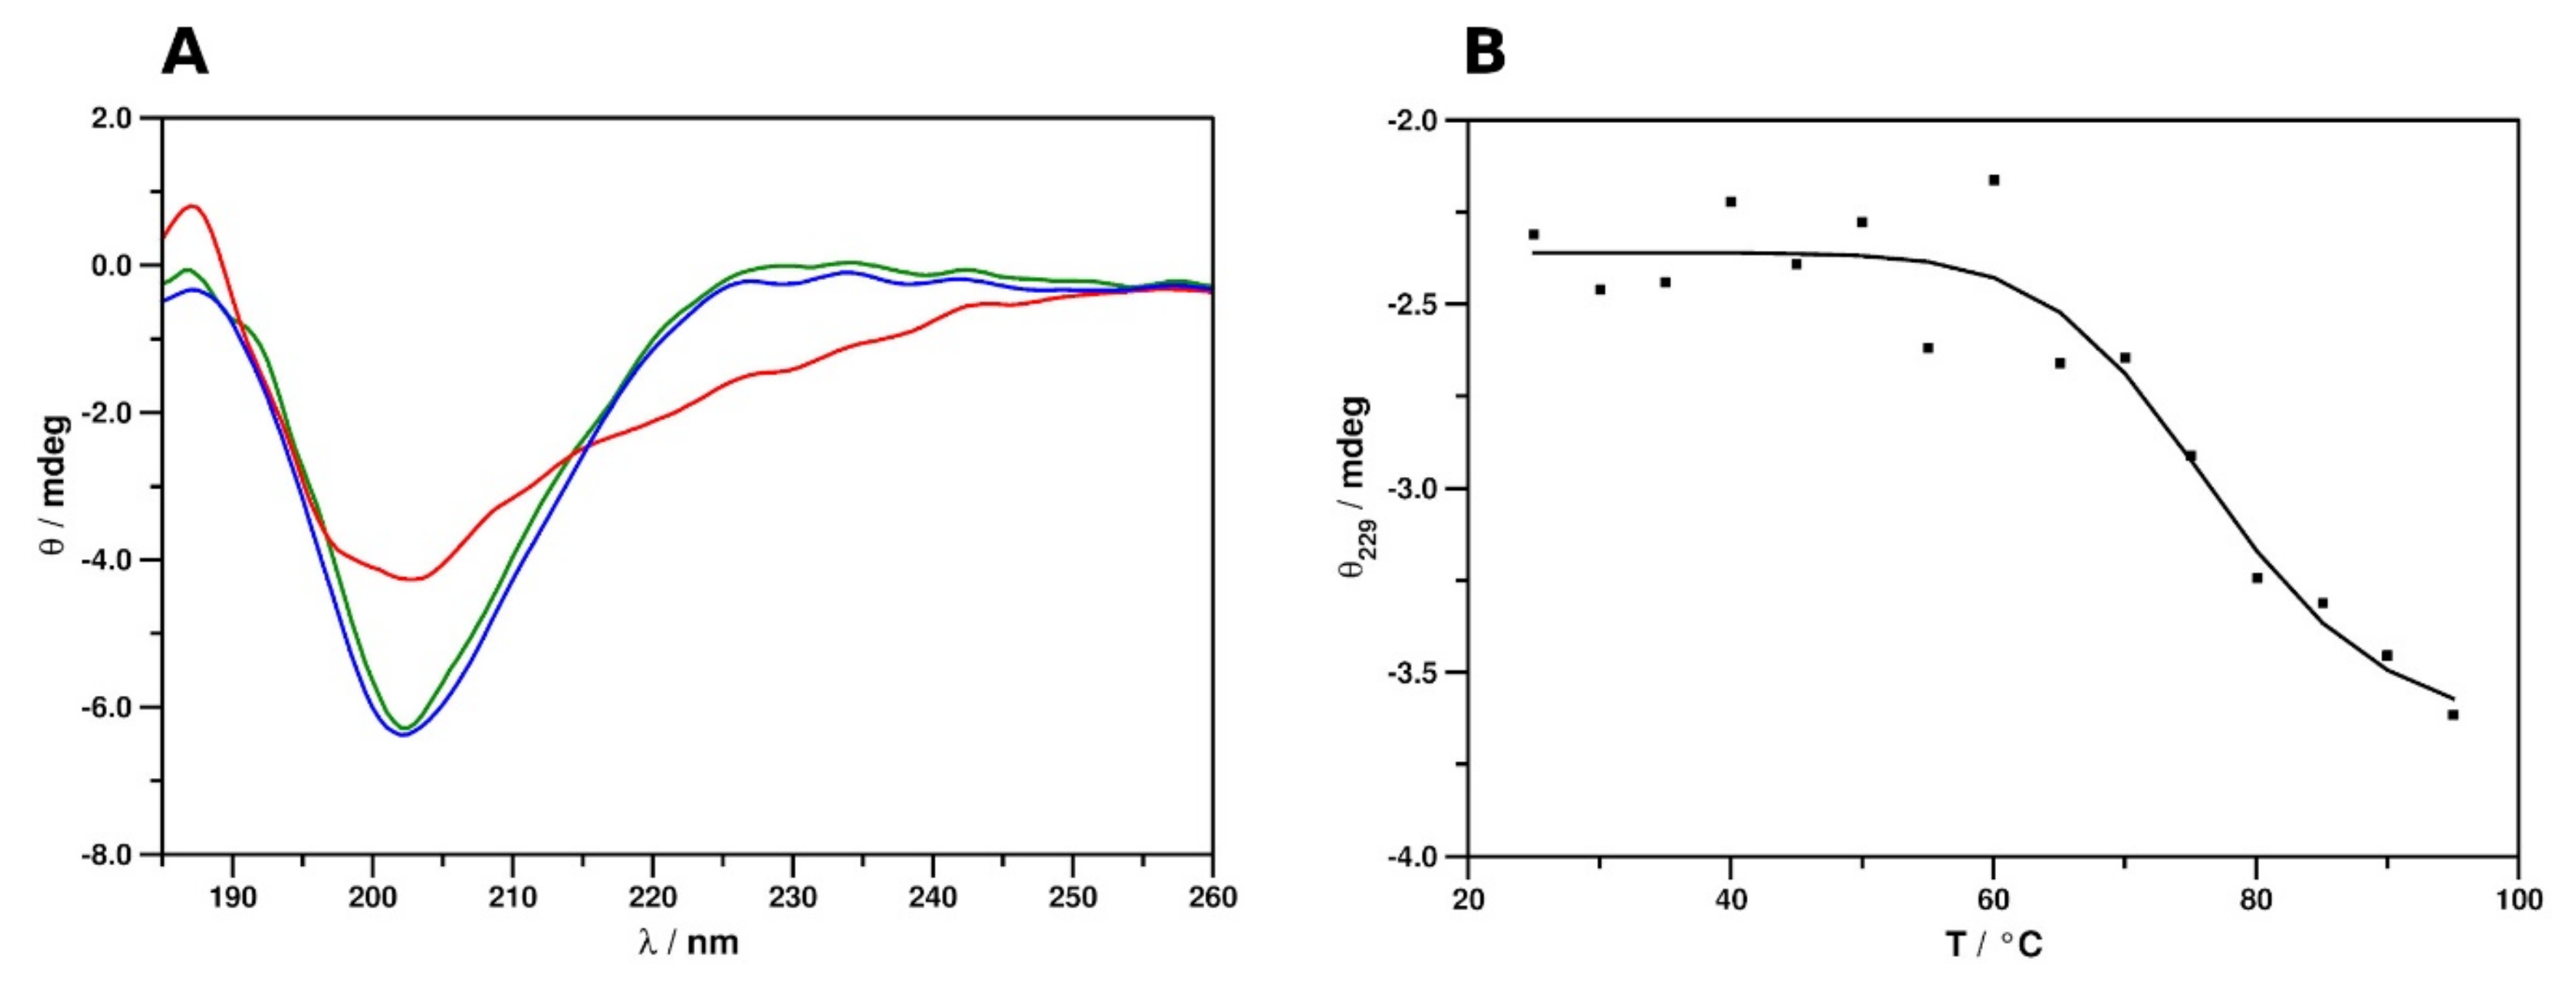
2.2. Secondary Structure and Thermal Stability Analysis of PAFC Using Electronic Circular Dichroism Spectroscopy

The electronic circular dichroism (ECD) spectrum of PAFC at 25 °C showed markedly different features to those observed previously for the related proteins (Figure 6A) PAF [41], PdAfpB from Penicillium digitatum [42], and NFAP and NFAP2 from Neosartorya fischeri [43,44]. The spectrum was characterized by a broad, intensive minimum at 202 nm, which could indicate the presence of multiple structural elements with the predominance of atypical, non-canonical secondary structures. A contribution from a very low intensity maximum, centering around 229 nm, was revealed by comparison to the spectrum acquired at 95 °C. This low-intensity maximum indicated the presence of disulfide bridges with uniform geometries. This suggested, in accordance with the results provided by NMR spectroscopic analysis, that the predominance of highly dynamic disordered structures could be ruled out and that the protein adopts a stable tertiary structure in aqueous solution. Monitoring the change of spectral intensity at 229 nm at elevated temperatures yielded an inverse sigmoid-type unfolding curve (Figure 6B), similar to those acquired previously for other cysteine-rich, cationic, antifungal MPs [41,42,43,44]. Fitting the data points with an inverse sigmoid function (R2 = 0.936) appointed x = 76.83653 as the inflection point of the fitted curve. Therefore, the melting point of the protein structure (Tm) could be estimated to be approx. 77 °C. This indicates remarkable thermal stability, similar to that of related proteins. The spectrum measured again at 25 °C after heat treatment (Figure 6A) confirmed that the unfolding of PAFC is entirely reversible and corroborates the preservation of anti-Candida activity after heat treatment, as reported recently [14].
Spectral deconvolution data and the estimation of secondary structural components are included in Table 2. While the contributions of helical and unordered segments are slightly overestimated by ECD spectra at the expense of β-strands and turn structures, there is an acceptable agreement between ECD and NMR data, especially when considering the limited site specificity of the former.

2.3. Microbial Growth Inhibitory Activity of PAFC

Recombinant, unlabeled PAFC was tested for antimicrobial activity, and the inhibitory concentration that reduces growth by ≥90% (IC90) was determined (Table 3). The microorganisms tested in broth microdilution assays comprised Gram-positive (Bacillus subtilis) and Gram-negative (Escherichia coli) bacteria and filamentous fungi (the PAFC producer P. chrysogenum, the model organisms Aspergillus nidulans, Aspergillus niger and Neurospora crassa, the opportunistic human pathogen Aspergillus fumigatus, and the dermatophytes Microsporum gypseum and Trichophyton rubrum). Filamentous fungi showed high tolerance (A. nidulans) or resistance (P. chrysogenum, A. fumigatus, and A. niger) to PAFC in the tested concentration range. Interestingly, Microsporum gypseum and Trichophyton rubrum proved to be the most sensitive ones (IC90 5–7 µM). No growth inhibitory activity was observed for bacteria at concentrations tested up to 50 μM.

2.4. The Role of the γ-Core Motif in the Antifungal Activity of PAFC

In a previous study, we showed that the peptide spanning the dextromeric γ-core motif of PAF effectively inhibits fungal growth by its own and the efficacy can be increased by modulating its physicochemical properties, i.e., increase in the positive net charge and hydrophilicity [21]. To assess the importance of the two levomeric γ-core motifs for PAFC activity, two peptides spanning the highly conserved motif (CDRTGIVECKG) residing in the protein center and one peptide covering the γ-core (CGGASCRG) at the protein C-terminus were chemically synthesized. The 15-aa-length peptide PCγ15 (FCGCDRTGIVECKGG) comprised the additional residues Phe-Cys-Gly at its N-terminus and showed an almost neutral net charge (−0.2 at pH 7) and a higher grand average of hydropathy (GRAVY) value (−0.087) than the full-length protein (charge +0.6 at pH 7, GRAVY −0.767) (Table 4). PCγ17, a 17-aa-long peptide (RHFCGCDRTGIVECKGG) included the two additional basic residues Arg and His at its N-terminus. It therefore exhibited a higher positive net charge (+1.1 at pH 7) than PAFC and PCγ15 and a GRAVY value of −0.376, rendering this peptide more hydrophilic than PCγ15. Lastly, to determine the role of the putative C-terminal γ-core, the 8-aa-long peptide PCγC-terminal (CGGASCRG) was synthesized, having a similar positive net charge as PAFC (+0.8 at pH 7) but showing the highest GRAVY value of +0.038 (Figure 7 and Table 4).
Determination of the antifungal potential of the peptides was performed by testing their growth inhibitory activity on the human pathogenic yeast Candida albicans and the filamentous model fungus N. crassa up to concentrations of 100 µM. Interestingly, Pγ15 and PCγC-terminal did not inhibit fungal growth in the tested concentration range. PCγ17, however, was effective against N. crassa at an IC90 of 25 µM but not against C. albicans, which is sensitive to the full-length PAFC, as recently reported [14]. The positive net charge and hydrophobicity are important determinants of the antifungal potential of γ-core peptides and their analogues [9,21,44,45,46]. Our data indicated that the predicted canonical PAFC γ-core motives are not functional per se as long as the positive charge is low and the GRAVY value high. The increase in the net charge and the hydrophilicity of the peptide enhance the species-specific antifungal activity. However, the efficacy is still ten-fold lower than that of the full-length protein. This let us conclude that other protein parts are necessary to execute to full antifungal activity.

2.5. Effect of PAFC on Medicago truncatula Seedlings

Recently, we reported on the efficacy of PAFC to inhibit the growth of one of the most prevalent human pathogens, the yeast C. albicans, which renders this MP a promising candidate for the development of new drugs for the treatment of skin and cutaneous fungal infections [14]. In this study, we provide a proof-of-principle that PAFC also protects plants from fungal infection. To consider this MP as a biocontrol agent in agriculture, it is of utmost importance to first exclude any harmful effect on the growth and development of plants. The small and fast-growing legume Medicago truncatula is an appropriate model plant to study the harmful effects of pesticides and antifungal compounds like MPs [47]. Thus, M. truncatula A-17 seedlings grown on water agar in Petri dishes were daily treated with 1 mg mL−1 of PAFC to evaluate the primary root length and the number of lateral roots. No harmful effects were detected after 10 days of incubation between the PAFC-exposed samples compared to the ddH2O-treated negative control, whereas significant changes in the root morphology were observed with the positive control, which was daily treated with 70% (v/v) ethanol (Figure 8).

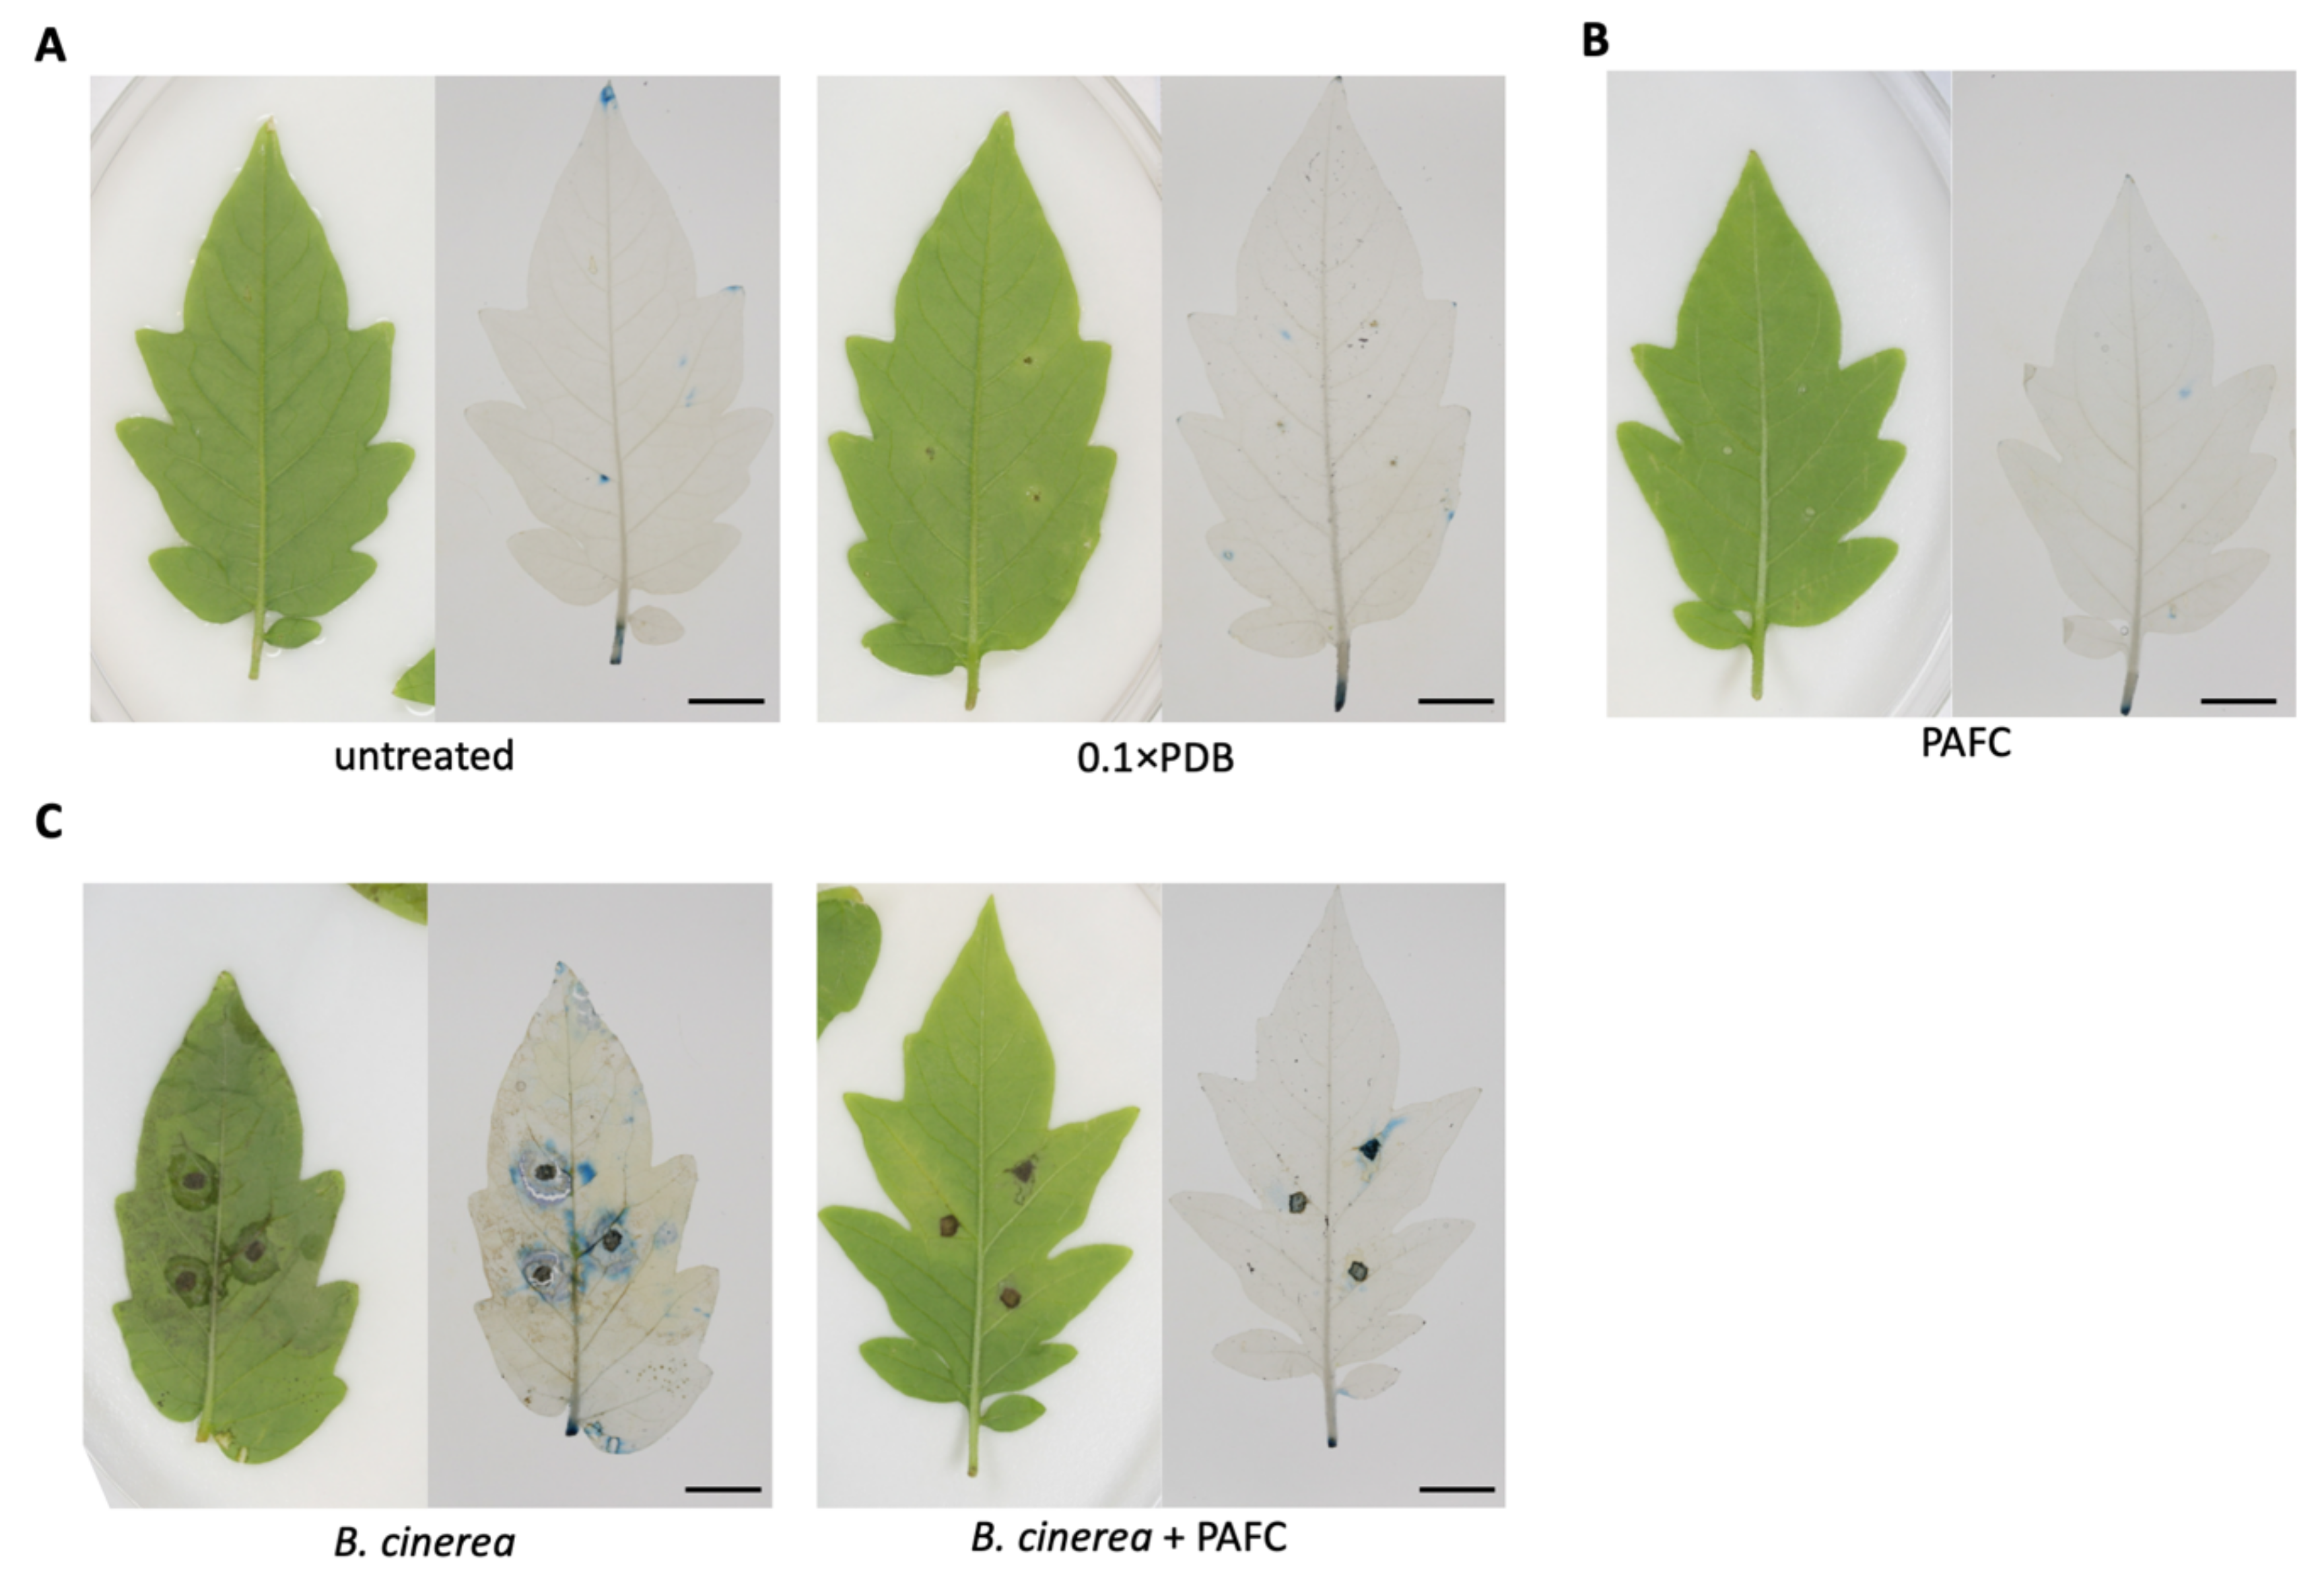
2.6. Protection of Tomato Plant Leaves from Botrytis cinerea Infection

To prove that PAFC can protect plants from fungal infection, we applied a test system that uses the necrotrophic surface plant pathogen Botrytis cinerea that infects tomato plant leaves. To approximate more natural conditions, we used the agar diffusion assay instead of the broth microdilution assay to investigate the antifungal potential of PAFC on this filamentous plant pathogen growing on solid surfaces. PAFC was applied into the wells of agar plates in a concentration range of 37–151 μM (0.25–1 mg mL−1). The determination of the diameters of the inhibition zones around the wells correlated with the PAFC concentration, whereas no growth inhibition could be detected around the ddH2O control well (Table 5).
Microscopy revealed disintegrated conidia and a very low number of germlings in the inhibitory zone around the wells in which 1 mg mL−1 of PAFC had been applied, while healthy, well-developed hyphae were found around the control well containing ddH2O (Supplementary Figure S4).
Next, we infected tomato plant leaves by applying B. cinerea spores alone (infection control) or together with 1 mg mL−1 of PAFC onto the abaxial leaf epidermis at three points per leaf between the lateral veins and analyzed necrosis development around the application sites after four days of incubation (Figure 9). Leaves similarly treated with PAFC alone (PAFC toxicity control), treated with 0.1 × PDB (medium toxicity control), or left untreated served as negative controls. Evan’s blue staining was performed to detect necrotic zones and revealed no tissue damage in any of the controls (Figure 9A,B), corroborating the tolerance of PAFC by tomato plant leaves. Instead, considerable necrotic tissue around the side of B. cinerea application became visible in the infection control (Figure 9C, left side). The presence of PAFC in the infective inoculum, however, significantly reduced necrotic areas on the leaves (Figure 9C, right side). These data clearly indicated that PAFC effectively inhibits B. cinerea growth on the plant leaf surface.

3. Discussion

To unravel the PAFC solution structure at the atomic level, a detailed NMR study was undertaken. The PAFC protein belongs to the BP-clade of ascomycetous MPs. The three-dimensional structure of only one member thereof, the BP from P. brevicompactum, was determined using X-ray crystallography [24]. For PAFC, homology-based in silico structure prediction was performed earlier [14], which suggested the same fold (RMSD = 0.46 Å) as BP. Therefore, only the two experimental atomic-level structures were compared here. Since PAFC and BP have high sequence identity (80%), it is not surprising that their folds are very similar. They form a long N-terminal region with mostly extended and a short helix-like conformation and two antiparallel β-pleated sheet systems at the C-terminus. In both cases, four disulfide bridges are formed with the same abcabdcd pattern. In fact, the two proteins resemble each other so much that the backbone RMSD is only 1.01 Å. The main difference between them is that the N-terminus between residues 1–7 is slightly less ordered in PAFC than in BP. The same is true for the C-terminal β-sheet, which is shorter and more irregular in PAFC. Similar to BP, there is a hole in PAFC, which we call cavity A (Supplementary Figure S5), which seems to be a characteristic feature of the members of the BP-clade [24]. The outer margin of this funnel consists of several positively charged residues (Arg12, Arg13, and Arg25), which confer this part an overall basic nature. However, the side chains of these aa do not interact with each other, and no strong positively charged patch is present in the protein. The inner base of the funnel is formed by the aromatic Phe27 and Trp43 and in part by the charged Arg12. It is important to note that the cavity A structure is similar to that found in BP and it is formed by highly conserved residues [24]. This suggests that it may play an important functional role for BP-clade proteins. Interestingly, a second hole (cavity B, Figure 10B) can also be observed in PAFC. It is more hydrophilic and predominantly formed by the negatively charged Asp31, Glu45, and Asp48 as well as the basic Arg12 main chain, Arg13 and Arg32, and the hydrophilic residues Thr14, Thr33, and Thr44. The negatively charged region identified in BP was searched also in PAFC. Although it exists in PAFC as well, it is smaller there (Asp31, Asp48, and Glu45) and does not include the C-terminal region [14]. The electrostatic surface potential of PAFC is shown in Figure 10A, as calculated from the pdb-deposited 6TRM structure.
The dynamical properties of the PAFC were studied and compared with other antimicrobial MPs, such as PAF, NFAP, and PAFB, possessing β-barrel structures [10,19,30]. According to this study, the folded PAFC is mostly rigid; however, the N-terminal is more dynamical, and the C-terminal part of the first loop combined with the β2-strand and the long loop between the two β-sheets show some internal motion. Surprisingly, the second and third regions totally overlap the two γ-core motifs identified in PAFC. Although the antifungal MPs of the PAF-clade also contain one γ-core motif, these proteins do not exhibit extreme dynamic regions [10,19,30]. Interestingly, cavity B in PAFC involves the most dynamic part of the first γ-core region. So the flexible regions found in both γ-core regions of PAFC might have a potential role for ligand binding, allowing the conformational selection mode [49] for target molecule recognition.
The evolutionary conserved γ-core motif, which is present in two levomeric forms in PAFC, is an important structural and/or functional component found in disulfide-stabilized proteins and peptides from organisms belonging to all kingdoms [22,23]. In MPs of filamentous ascomycetes, this motif localizes in conserved positions, being negatively charged, positively charged, or neutral [21]. Interestingly, the three members of the BP-clade (BP, PAFC, and PeAfpC) contain two levomeric motifs, the one in the central position being neutral or slightly negatively charged and a more positively charged one at the C-terminus [21]. It is the first time that the impact of the γ-core motif of BP-clade MPs on their function was investigated using synthetic peptides that span these regions. While the γ-core was shown to significantly contribute to the antifungal activity of PAF [21], this role could not be assigned yet to the respective motives in PAFC. Neither PCγ15 nor PCγC-terminal showed any efficacy against the growth of N. crassa and C. albicans. Instead, only the N-terminally extended PCγ17 having a higher positive net charge and being more hydrophilic exhibited a detectable IC90 against the filamentous model fungus but not against the yeast cells. This indicates that physicochemical features such as a positive net charge and hydrophilicity of the synthetic peptide play an important role in its species-specific function, but not the motif as such, and structural and functional support from other parts of the protein is required for full MP activity. This is consistent with studies performed with synthetic peptides comprising the dextromeric γ-core motif of the N. fischeri antifungal protein NFAP2 [44] and the P. digitatum antifungal protein AfpB [42], which had no fungal growth inhibitory activity.
By addressing the functional features in more detail, we provide evidence that PAFC exclusively inhibits the growth of filamentous fungi, as no antibacterial activity could be detected. These results complement the reported anti-Candida efficacy of PAFC [14], the anti-yeast activity of the P. brevicompactum BP [24], and the fungal growth inhibitory activity of Pc-Arctin from the artic sediment isolate P. chrysogenum A096, which is identical to PAFC [50]. Interestingly, PAFC was moderately active against its producer P. chrysogenum. Self-inhibition by the production of MPs has been reported previously for filamentous fungi, e.g., P. chrysogenum by PAFB [10], Penicillium digitatum by PdAfpB [51], or P. expansum by PeAfpA and PeAfpB [25]. Though still controversial, this observation could be explained with an additional function of the MPs, apart from their growth inhibitory activity, such as autophagy, nutrient recycling, and regulation of growth and development [10,14,52,53].
Furthermore, we investigated in this study the potential of PAFC as a bio-fungicide. It is the first time that the efficacy of a member of the BP-clade to protect tomato plant leaves from fungal infection was evaluated. The gray mold B. cinerea is a necrotrophic plant pathogen with the ability to infect numerous plant species, causing an estimated annual economic damage of one billion euros [54,55]. One of the hosts is the tomato plant (Solanum lysopersicum), an important and widely used agricultural crop. So far, infection control was managed by chemical fungicides [56], which, in itself, proves to be a problem due to residues in tomato fruits and the risk of toxicity for consumers [57,58]. Additionally, recent evidence showed that B. cinerea has already acquired resistance to many of the commonly used fungicides [59]. Apart from the effective reduction of tomato plant leaf destruction by mold-induced necrosis in the presence of PAFC, we also proved the tolerance of tomato leaves and M. truncatula seedlings to PAFC treatment. In-depth studies are currently in progress to further investigate the applicability of PAFC in agricultural and post-harvest settings to prevent and treat fungal plant infection and fruit decay.
Taken together, the antifungal spectrum, which includes human as well as plant pathogens, suggests PAFC to be a potential candidate for the development of new antifungal strategies applicable in the clinics and agriculture.

4. Materials and Methods

4.1. Microbial Strains and Growth Conditions

Fungal and bacterial strains used in this study are listed in Supplementary Table S3, and the composition of the media is described in Supplementary Table S4. Spores were generated by cultivating P. chrysogenum on P. chrysogenum minimal medium (PcMM) agar plates at 25 °C and A. fumigatus, A. nidulans, and A. niger on solid complete medium (CM) at 37 °C. N. crassa was grown on Vogel’s agar plates at 37 °C under light. The dermatophytes M. gypseum and T. rubrum were cultivated on oatmeal agar at 30 °C. B. cinerea was cultivated on potato dextrose agar (PDA; Sigma-Aldrich, St. Louis, MO, USA) and incubated first at 30 °C for 48 h and then at 25 °C for 10 days. All fungal spores were routinely harvested and washed in spore buffer (0.9% NaCl (w/v), 0.01% Tween (v/v)) before use, except for the spores of dermatophytes, which were harvested in spore buffer and filtered through a funnel lined with cotton to remove hyphae before washing the spores. A single colony of C. albicans was removed from PDA, transferred to liquid 0.1 × PDB, and grown at 160 rpm and 30 °C. After centrifugation, the cells were washed in the same medium before experimental use. E. coli and B. subtilis were grown as a preculture in lysogeny broth (LB) medium until an OD600nm of 0.3 was reached.

4.2. PAFC Production

We inoculated 200 mL of PcMM with 2 × 10⁸ mL−1 spores of the PAFC-overexpressing strain P. chrysogenumOepafC [14], and PAFC was purified from the cell-free supernatant of a 96-h-old shaking culture (25 °C, 200 rpm), as previously described [14]. Isotopic 15N/13C labeling of recombinant PAFC for NMR analysis was achieved by replacing the carbon and nitrogen source in PcMM with 1% 13C-glucose (w/v) (Euriso-Top, Saarbrücken, Germany) and 0.3% Na15NO3 (w/v) (Euriso-Top, Saarbrücken, Germany), respectively. The isotopic-labeled PAFC was produced and purified in the same way as the unlabeled MP.

4.3. NMR Measurements, Signal Assignment, and Structure Calculations

Lyophilized PAFC samples were dissolved in 20 mM acetate buffer (pH = 4.5, 5% D2O) in a concentration of 650 μM. For NMR signal assignments, the standard protocol applied for other 15N-/13C-isotope-labeled antifungal MPs [60,61] was used. Thus, HNCO-, HN(CA)CO-, HNCA-, HN(CO)CA-, HNCACB-, HNHA-, HBHA(CO)NH-, and HN(CO)CACB-type three-dimensional triple-resonance experiments were recorded to identify sequential connections through the protein backbone. The side-chain resonance assignments were completed with the help of HC(C)H COSY, HC(C)H-TOCSY, HCC(CO)NH, and (H)CCH-TOCSY experiments. In the case of aromatic protons, two-dimensional CB(CGCD)HD and CB(CGCDCE)HE spectra were used. For NOE peak assignment and structure calculation, 15N- and 13C-resolved three-dimensional NOESY as well as 2D 1H-1H NOESY spectra were acquired. The identification of H-bonds was accomplished using the HNCOGPHB3D Bruker pulse sequence experiment [34]. All spectra were recorded at 298 K using a Bruker NEO/Avance III 700 MHz spectrometer (Bruker, Billerica, MA, USA). Typical 90° pulses were 8.1, 12, and 32 μs for 1H, 13C, and 15N, respectively, and relaxation delays were in the 1.1–1.7 s range. Direct chemical shift referencing was performed for 1H using 2,2-dimethyl-2-sila-pentane-5-sulfonic acid (DSS), (Sigma-Aldrich, St. Louis, MO, USA) and an indirect one for 15N and 13C nuclei calculated from the gyromagnetic ratios. The spectra were processed using Topspin 3.1, and the resonances were identified and analyzed with CCPNmr Analysis 2.4.2 software [62]. For collecting backbone torsional angle restraints, the TALOS-N webserver was chosen [63,64]. The disulfide pattern was considered the same as in the case of BP, and these bonds were defined as covalent bond restraints for the structure calculation. NOE peak picking and assignment as well as the structure determination of PAFC were accomplished with the UNIO’10 platform [65,66], which is based on the ATNOS/CANDID algorithm and CYANA 2.1 software. For determining the initial protein fold, only NOE distance constraints were considered. The refinement of the three-dimensional structure was completed with disulfide bond pattern and backbone torsional angle restraints [64]. In the final structure calculation, 1421 NOEs were included in the optimization. As usual, 100 conformers were determined, and the 20 lowest-energy structures of them were selected to obtain the final structural ensemble. For the dynamical studies of PAFC, conventional 15N (70.966 MHz), relaxation experiments (T1, T2, and 15N-1H NOE) were also run on the Bruker NEO/Avance III 700 MHz spectrometer using the 15N-/13C-labeled PAFC sample at 298 K. 15N-{1H} NOEs were measured using Bruker’s hsqcnoef3gpsi pulse program. The recycle delay was 7 s in the reference experiment, and the same duration was applied for the pre-saturation 1H pulse train, which was a train of 120° proton pulses (10.8 μs), followed by 5 ms delays in the on-resonance experiment. 15N T1 and T2 relaxation times were measured using standard pulse sequences hsqct1etgpsi3d.2 and hsqct2etgpsi3d.2, with 3 s recycle delays. The 15N relaxation data were analyzed using the Lipari–Szabo method of Bruker Dynamics Center version 2.4.8 software (Bruker, Billerica, MA, USA). The global correlation time and the S2 order parameters for each aa residue were calculated applying the M2 model, which includes residue-specific order parameters and effective correlation times and one global correlation time of an isotropic rotor. To obtain more insight into the dynamical properties of PAFC, the same relaxation data were analyzed with the aid of reduced spectral density mapping [40] using in-house-written MATLAB code. CPMG-RD experiments [67,68] were recorded to disclose possible motions at the millisecond timescale. 15N CPMG-RD T2 relaxation dispersion experiments were carried out as a function of the applied B1 RF field. Bruker’s hsqcrexetf3gpsi3d pulse program was applied. The B1 field was changed in between the 0–1000 Hz range, in 13 steps. The recycle delay was 2 s.

4.4. ECD Spectroscopy

The secondary structure and thermal stability of PAFC were assessed using ECD spectroscopy. Spectra were recorded in the 195–260 nm wavelength range at a scan speed of 100 nm s−1 using a Jasco-J815 spectropolarimeter (JASCO Corporation, Tokyo, Japan). The protein sample was dissolved in H2O at a 0.1 mg mL−1 concentration and transferred to a 0.1-cm-path-length quartz cuvette for the following measurements. First, the ECD spectrum of the sample was recorded at 25 °C. The temperature was then gradually increased up to 95 °C at a rate of 1 °C min−1 using a Peltier thermo-electronic controller (TE Technology, Traverse City, MI, USA), while ellipticity data were recorded as a function of temperature at four wavelengths (195, 202, 215, and 229 nm) appointed by the extrema of the spectrum measured at 25 °C and characteristic wavelengths determined previously for related proteins [41,42,43,44]. The protein solution was equilibrated for 1 min at each temperature point before measurements were taken. The resultant melting curves were fitted with a symmetrical sigmoidal function whose inflexion points corresponded to the melting temperature (Tm) of the protein structure. When the unfolding experiment reached its final temperature point at 95 °C, the ECD spectrum in the 195–260 nm range was recorded again, and then the sample was left to cool to 25 °C. The last spectrum acquisition was done at 25 °C, after 5 min equilibration. The reported spectra were accumulations of 10 scans, from which the spectrum of H2O was subtracted. Ellipticity data are given in mdeg units.
Contributions of spectral signatures to the ECD spectra, emerging from different secondary structural regions of the protein, were determined by the circular dichroism spectra secondary structure (CDSSTR) method [69]. Deconvolution data were then compared to values reported by DSSP analysis [36] of the NMR-derived structure reported here and the crystallographic structure of the homologous P. brevicompactum BP (pdb code 1UOY).

4.5. Synthesis of γ-Core Peptides PCγ15, PCγ17, and PCγC-terminal

The peptides were prepared manually by solid-phase peptide synthesis, applying Fmoc chemistry and dicyclohexylcarbodiimide/N-hydroxybenzotriazole (DCC/HOBt) coupling with a three-fold excess of reagents. Rink amide resin was used as a solid support. As the last step of the synthesis, the N-terminal amino group of the peptide was acetylated on the solid phase. The peptide was cleaved simultaneously from the resin and the side chains deprotected with a 95:5:3 (v/v/w) trifluoroacetic acid (TFA) /water/dithiothreitol mixture at room temperature for 2.5 h. The crude peptide was purified by semi-preparative reversed-phase high-performance liquid chromatography (RP-HPLC) on a Phenomenex Luna 10 µm C18 column using the following eluent system: (A) 0.1% (v/v) TFA and (B) 80% (v/v) acetonitrile and 0.1% (v/v) TFA applying a linear gradient from 10% to 40% B (PCγ15 and PCγ17) or 0% to 30% B (PCγC-terminal) in 60 min at a flow rate of 3.0 mL min−1. Purity was checked with a Phenomenex Luna 10 µm C18 100 Å column and a linear gradient from 28% to 43% B (PCγ15), from 22% to 37% B (PCγ17), or from 8% to 23% B (PCγC-terminal) in 15 min (Supplementary Figure S6). The identity of the peptide was proven by electrospray ionization–mass spectrometry (ESI-MS).

4.6. Determination of Antimicrobial Activity

The inhibitory concentration that reduces microbial growth by ≥90% (IC90) was determined using broth microdilution assays. To this end, 100 μL of fungal spores or yeast cells (104 mL−1) were mixed with 100 μL of PAFC in 0.1 × PDB in increasing concentrations (dermatophytes: 0–20 μM; Aspergillus spp., N. crassa: 0–30 μM; P. chysogenum: 0–100 μM; Candida: 0–20 μM) in 96-well, flat-bottom microtiter plates (Thermo Scientific, Waltham, MA, USA). E. coli and B. subtilis precultures were grown in 0.1 × PDB until an OD620nm of 0.3 was reached, and diluted to an OD620nm of 0.1 and mixed with 100 μL of increasing PAFC concentrations (0–50 μM). The growth inhibition of the static cultures was evaluated by determining the optical density (OD620nm) with a multi-mode microplate reader (FLUOstar Omega, BMG Labtech, Ortenberg, Germany) after cultivation of Aspergillus spp. and C. albicans for 24 h at 30 °C. N. crassa was incubated for 16–30 h at 25 °C, and dermatophytes were cultivated for eight days at 30 °C. Bacterial growth was evaluated after 24 h of cultivation at 30 °C. All assays included a blank (culture broth without spores or cells) for background subtraction and respective untreated microorganisms, which served as a growth control representing 100% growth. All experiments were done in technical triplicates and repeated at least twice. Agar diffusion assays were performed to document the degree of hyphal extension inhibition by PAFC in B. cinerea surface culture. Solid culture medium (0.1 × PDA) was overlaid with 1 mL of 2 × 10⁵ conidia mL−1, and 100 μL of 0.25–1 mg mL–1 PAFC solution diluted in sterile ddH2O was filled into the wells, which had been punched into the solid medium. Sterile ddH2O was used as a negative inhibition control. The diameters of the inhibition zones that had formed around the wells were documented after incubation for 96 h at 25 °C. The experiment was repeated twice.

4.7. Toxicity Tests with Medicaco truncatula Seedlings

To exclude any potential toxic effects of PAFC during plant growth, an experiment with the plant seeds of M. truncatula A-17 was conducted [13]. In short, seeds were sterilized, placed on 1% (w/v) water agar (Kalys, Bernin, France), and germinated at 4 °C in the dark for three days. Seedlings with 3–4 mm root length were chosen for the experiment, and four seedlings per square Petri dish with vents (Greiner, Sigma-Aldrich, St. Louis, MO, USA) containing water agar were put next to each other, keeping a 20 mm distance from the top. The apical region of the primary root was treated for 10 days with daily doses of an aqueous 20 µL PAFC solution (1 mg mL−1) and incubated in a 60% humid plant growth chamber at 23 °C and 1200 lux illumination for the leaf region, while evolving roots were kept in the dark by covering the respective region of the dish with aluminum foil. The primary root length was measured in millimeters and the number of lateral roots counted at day 10 of incubation. Seedlings treated with ddH2O and 70% (v/v) ethanol were used as growth and death controls, respectively. The toxicity test was repeated at least twice.

4.8. Plant Protection Experiments

Tomato plant seeds (Solanum lycopersicum L. cv. Ailsa Craig) were germinated for three days at 27 °C under darkness, and then the seedlings were transferred to Perlite for 14 days and grown in a controlled environment (200 μmol m−2 s−1 photon flux density with 12/12 h light/dark period, a day/night temperature of 23 °C/20 °C, and a relative humidity of 55%–60% for 4 weeks) in hydroponic culture [70]. The plant protection experiments were conducted from 9:00 a.m. For the assessment of PAFC efficacy to protect against fungal infection, the pathogenicity test method described by [71,72] was adopted with slight modifications. Detached tomato plant leaves were positioned in Petri dishes containing three sterilized filter papers (Filters Fioroni, Ingré, France) wetted with sterile ddH2O. (i) For infection control, 10 µL of B. cinerea SZMC 21,472 conidial suspension (1 × 10⁷ conidia mL−1), (ii) for PAFC toxicity testing, 10 µL of 1 mg mL−1 PAFC, (iii) for plant protection investigation, 10 µL of B. cinerea conidial suspension (1 × 10⁷ conidia mL−1) containing PAFC in a concentration range of 0.25–1 µg mL−1, and (iv) for the un-infected control, 10 µL of 0.1 × PDB was dropped onto the abaxial leaf epidermis at three points between the later veins and left to dry on the surface at room temperature. Conidial suspensions and PAFC solutions were prepared in 0.1 × PDB for the tests. After these treatments, leaves were kept in a humid (60%) plant growth chamber for four days at 23 °C under photoperiodic day/night simulation (12/12 h with/without illumination at 1200 lux). Leaves left untreated were used as untreated controls. After the incubation period, the leaves were collected and the necrotic zone around the treatment points and the necrotic lesions were visualized by Evan’s blue staining. Briefly, the leaves were stained with 1% (w/v) Evan’s blue (Sigma-Aldrich, St Louis, MO, USA) for 10 min according to [73] and then rinsed with distilled water until they were fully decolorized. Then the chlorophyll content was eliminated by boiling in 96% (v/v) ethanol for 15 min. The leaves were stored in a glycerine:water:alcohol (4:4:2) solution and photographed with a Canon EOS 700D camera (Tokyo, Japan). Three leaves for each treatment were used in one experiment. The plant protection experiment was repeated twice.

Supplementary Materials

Supplementary Materials can be found at https://www.mdpi.com/1422-0067/22/3/1183/s1.

Author Contributions

L.G., P.P., G.K.T., F.M., and G.B. designed the experiments and conceived and supervised the study. A.C. performed NMR structure analyses; J.H., L.G., L.T., A.Ö., and A.K. performed functional experiments and analyzed the data. G.V. synthesized and purified the peptides. A.B. performed ECD spectroscopy and analyzed the data. All authors have read and agreed to the published version of the manuscript.

Funding

This research was supported by the Austrian Science Fund (FWF I3132-B21 to F.M.), and J.H. was financed by the scholarship of the Aktion Österreich-Ungarn. L.G. and L.T. were financed by the FK 134343 and PD 134284 projects, respectively, of the Hungarian National Research, Development and Innovation (NKFIH) Office. Research of L.G. and P.P. was supported by the János Bolyai Research Scholarship of the Hungarian Academy of Sciences. The present work of L.G. and P.P. was supported by the ÚNKP-20-5—New National Excellence Program of the Ministry for Innovation and Technology from the source of the National Research, Development and Innovation Fund. G.V. and G.K.T. were supported by the NKFIH Office (GINOP-2.3.2-15-2016-00014, 20391-3/2018/FEKUSTRAT). Structural research was supported by the European Union (EU) and co-financed by the European Regional Development Fund under the projects GINOP-2.3.2-15-2016-00008 for G.B. and GINOP-2.3.3-15-2016-00004 (access to 700 MHz NMR facilities).

Institutional Review Board Statement

Not applicable.

Informed Consent Statement

Not applicable.

Data Availability Statement

The data presented in this study are available in supplementary material.

Acknowledgments

We thank Doris Bratschun-Khan for technical support and Zoltán Gáspári for his help with structure visualization.

Conflicts of Interest

The authors declare no conflict of interest.

Abbreviations

AaAmino acid
BPPenicillium brevicompactum bubble protein
BMRBBiological magnetic resonance data bank
CDSSTRCircular dichroism spectra secondary structure
CPMG-RD Carr–Purcell–Meiboom–Gill relaxation dispersion
DSSPDictionary secondary structures of protein
DIDisorder index
ECDElectronic circular dichroism
fASAFractional associated solvent area
GRAVYGrand average of hydropathy value
HI-HSQCHeteronuclear in-phase single quantum coherence
IC90Inhibitory concentration reducing microbial growth by ≥90%
kDakiloDalton
KKelvin
MP(s)Miniprotein(s)
NFAPNeosartorya fischeri antifungal protein
NMR Nuclear magnetic resonance
NOENuclear Overhauser effect
ODOptical density
PAF Penicillium chrysogenum antifungal protein
PdAfpPenicillium digitatum antifungal protein
PeAfpPenicillium expansum antifungal protein
pdbProtein Data Bank
RCIRandom coil index
RMSDRoot-mean-square deviation

References

  1. Fisher, M.C.; Gurr, S.J.; Cuomo, C.A.; Blehert, D.S.; Jin, H.L.; Stukenbrock, E.H.; Stajich, J.E.; Kahmann, R.; Boone, C.; Denning, D.W.; et al. Threats posed by the fungal kingdom to humans, wildlife, and agriculture. mBio 2020, 11. [Google Scholar] [CrossRef] [PubMed]
  2. Hancock, R.E.W.; Sahl, H.-G. Antimicrobial and host-defense peptides as new anti-infective therapeutic strategies. Nat. Biotechnol. 2006, 24, 1551–1557. [Google Scholar] [CrossRef] [PubMed]
  3. Brown, K.L.; Hancock, R.E.W. Cationic host defense (antimicrobial) peptides. Curr. Opin. Immunol. 2006, 18, 24–30. [Google Scholar] [CrossRef] [PubMed]
  4. Zasloff, M. Antimicrobial peptides of multicellular organisms. Nature 2002, 415, 389–395. [Google Scholar] [CrossRef] [PubMed]
  5. Van der Weerden, N.L.; Bleackley, M.R.; Anderson, M.A. Properties and mechanisms of action of naturally occurring antifungal peptides. Cell. Mol. Life Sci. 2013, 70, 3545–3570. [Google Scholar] [CrossRef] [PubMed]
  6. Neelabh; Singh, K.; Rani, J. Sequential and structural aspects of antifungal peptides from animals, bacteria and fungi based on bioinformatics tools. Probiotics Antimicrob. Proteins 2016, 8, 85–101. [Google Scholar] [CrossRef]
  7. Galgóczy, L.; Yap, A.; Marx, F. Cysteine-Rich antifungal proteins from filamentous fungi are promising bioactive natural compounds in anti-Candida therapy. Isr. J. Chem. 2019, 59, 360–370. [Google Scholar] [CrossRef] [PubMed] [Green Version]
  8. Marx, F. Small, basic antifungal proteins secreted from filamentous ascomycetes: A comparative study regarding expression, structure, function and potential application. Appl. Microbiol. Biotechnol. 2004, 65, 133–142. [Google Scholar] [CrossRef]
  9. Huber, A.; Galgóczy, L.; Váradi, G.; Holzknecht, J.; Kakar, A.; Malanovic, N.; Leber, R.; Koch, J.; Keller, M.A.; Batta, G.; et al. Two small, cysteine-rich and cationic antifungal proteins from Penicillium chrysogenum: A comparative study of PAF and PAFB. Biochim. Biophys. Acta Biomembr. 2020, 1862. [Google Scholar] [CrossRef]
  10. Huber, A.; Hajdu, D.; Bratschun-Khan, D.; Gáspári, Z.; Varbanov, M.; Philippot, S.; Fizil, Á.; Czajlik, A.; Kele, Z.; Sonderegger, C.; et al. New antimicrobial potential and structural properties of PAFB: A cationic, cysteine-rich protein from Penicillium chrysogenum Q176. Sci. Rep. 2018, 8. [Google Scholar] [CrossRef]
  11. Marx, F.; Binder, U.; Leiter, E.; Pócsi, I. The Penicillium chrysogenum antifungal protein PAF, a promising tool for the development of new antifungal therapies and fungal cell biology studies. Cell. Mol. Life Sci. 2008, 65, 445–454. [Google Scholar] [CrossRef] [PubMed]
  12. Palicz, Z.; Gall, T.; Leiter, E.; Kollár, S.; Kovács, I.; Miszti-Blasius, K.; Pócsi, I.; Csernoch, L.; Szentesi, P. Application of a low molecular weight antifungal protein from Penicillium chrysogenum (PAF) to treat pulmonary aspergillosis in mice. Emerg. Microbes Infect. 2016, 5. [Google Scholar] [CrossRef] [PubMed] [Green Version]
  13. Tóth, L.; Boros, E.; Poór, P.; Ördög, A.; Kele, Z.; Váradi, G.; Holzknecht, J.; Bratschun-Khan, D.; Nagy, I.; Tóth, G.K.; et al. The potential use of the Penicillium chrysogenum antifungal protein PAF, the designed variant PAFopt and its γ-core peptide Pγopt in plant protection. Microb. Biotechnol. 2020, 13, 1403–1414. [Google Scholar] [CrossRef] [PubMed] [Green Version]
  14. Holzknecht, J.; Kühbacher, A.; Papp, C.; Farkas, A.; Váradi, G.; Marcos, J.F.; Manzanares, P.; Tóth, G.K.; Galgóczy, L.; Marx, F. The Penicillium chrysogenum Q176 antimicrobial protein PAFC effectively inhibits the growth of the opportunistic human pathogen Candida albicans. J. Fungi 2020, 6, 141. [Google Scholar] [CrossRef] [PubMed]
  15. Hegedüs, N.; Leiter, É.; Kovács, B.; Tömöri, V.; Kwon, N.-J.; Emri, T.; Marx, F.; Batta, G.; Csernoch, L.; Haas, H.; et al. The small molecular mass antifungal protein of Penicillium chrysogenum—A mechanism of action oriented review. J. Basic Microbiol. 2011, 51, 561–571. [Google Scholar] [CrossRef] [PubMed] [Green Version]
  16. Leiter, É.; Szappanos, H.; Oberparleiter, C.; Kaiserer, L.; Csernoch, L.; Pusztahelyi, T.; Emri, T.; Pócsi, I.; Salvenmoser, W.; Marx, F. Antifungal protein PAF severely affects the integrity of the plasma membrane of Aspergillus nidulans and induces an apoptosis-like phenotype. Antimicrob. Agents Chemother. 2005, 49, 2445–2453. [Google Scholar] [CrossRef] [Green Version]
  17. Binder, U.; Bencina, M.; Fizil, Á.; Batta, G.; Chhillar, A.K.; Marx, F. Protein kinase A signaling and calcium ions are major players in PAF mediated toxicity against Aspergillus niger. FEBS Lett. 2015, 589, 1266–1271. [Google Scholar] [CrossRef] [Green Version]
  18. Binder, U.; Chu, M.; Read, N.D.; Marx, F. The antifungal activity of the Penicillium chrysogenum protein PAF disrupts calcium homeostasis in Neurospora crassa. Eukaryot. Cell 2010, 9, 1374–1382. [Google Scholar] [CrossRef] [Green Version]
  19. Batta, G.; Barna, T.; Gáspári, Z.; Sándor, S.; Kövér, K.E.; Binder, U.; Sarg, B.; Kaiserer, L.; Chhillar, A.K.; Eigentler, A.; et al. Functional aspects of the solution structure and dynamics of PAF—A highly-stable antifungal protein from Penicillium chrysogenum. FEBS J. 2009, 276, 2875–2890. [Google Scholar] [CrossRef] [Green Version]
  20. Huber, A.; Oemer, G.; Malanovic, N.; Lohner, K.; Kovács, L.; Salvenmoser, W.; Zschocke, J.; Keller, M.A.; Marx, F. Membrane sphingolipids regulate the fitness and antifungal protein susceptibility of Neurospora crassa. Front. Microbiol. 2019, 10. [Google Scholar] [CrossRef] [Green Version]
  21. Sonderegger, C.; Váradi, G.; Galgóczy, L.; Kocsubé, S.; Posch, W.; Borics, A.; Dubrac, S.; Tóth, G.K.; Wilflingseder, D.; Marx, F. The evolutionary conserved γ-core motif influences the anti-Candida activity of the Penicillium chrysogenum antifungal protein PAF. Front. Microbiol. 2018, 9. [Google Scholar] [CrossRef] [PubMed]
  22. Yount, N.Y.; Yeaman, M.R. Multidimensional signatures in antimicrobial peptides. Proc. Natl. Acad. Sci. USA 2004, 101, 7363–7368. [Google Scholar] [CrossRef] [PubMed] [Green Version]
  23. Yount, N.Y.; Yeaman, M.R. Emerging themes and therapeutic prospects for anti-infective peptides. Annu. Rev. Pharmacol. Toxicol. 2012, 52. [Google Scholar] [CrossRef] [PubMed]
  24. Olsen, J.G.; Flensburg, C.; Olsen, O.; Seibold, M.; Bricogne, G.; Henriksen, A. Solving the structure of the bubble protein using the anomalous sulfur signal from single-crystal in-house Cu K α diffraction data only. Acta Crystallogr. Sect. D Biol. Crystallogr. 2004, 60, 618. [Google Scholar] [CrossRef] [Green Version]
  25. Garrigues, S.; Gandia, M.; Castillo, L.; Coca, M.; Marx, F.; Marcos, J.F.; Manzanares, P. Three antifungal proteins from Penicillium expansum: Different patterns of production and antifungal activity. Front. Microbiol. 2018, 9. [Google Scholar] [CrossRef] [PubMed] [Green Version]
  26. Sievers, F.; Wilm, A.; Dineen, D.; Gibson, T.J.; Karplus, K.; Li, W.Z.; Lopez, R.; McWilliam, H.; Remmert, M.; Soding, J.; et al. Fast, scalable generation of high-quality protein multiple sequence alignments using Clustal Omega. Mol. Syst. Biol. 2011, 7. [Google Scholar] [CrossRef]
  27. Fizil, Á.; Gáspári, Z.; Barna, T.; Marx, F.; Batta, G. “Invisible” conformers of an antifungal disulfide protein revealed by constrained cold and heat unfolding, CEST-NMR experiments, and molecular dynamics calculations. Chem. Eur. J. 2015, 21, 5136–5144. [Google Scholar] [CrossRef] [Green Version]
  28. Virágh, M.; Vörös, D.; Kele, Z.; Kovács, L.; Fizil, Á.; Lakatos, G.; Maróti, G.; Batta, G.; Vágvölgyi, C.; Galgóczy, L. Production of a defensin-like antifungal protein NFAP from Neosartorya fischeri in Pichia pastoris and its antifungal activity against filamentous fungal isolates from human infections. Protein Expr. Purif. 2014, 94, 79–84. [Google Scholar] [CrossRef] [Green Version]
  29. Kovács, L.; Virágh, M.; Tako, M.; Papp, T.; Vágvölgyi, C.; Galgóczy, L. Isolation and characterization of Neosartorya fischeri antifungal protein (NFAP). Peptides 2011, 32, 1724–1731. [Google Scholar] [CrossRef]
  30. Hajdu, D.; Huber, A.; Czajlik, A.; Tóth, L.; Kele, Z.; Kocsubé, S.; Fizil, Á.; Marx, F.; Galgóczy, L.; Batta, G. Solution structure and novel insights into phylogeny and mode of action of the Neosartorya (Aspergillus) fischeri antifungal protein (NFAP). Int. J. Biol. Macromol. 2019, 129, 511–522. [Google Scholar] [CrossRef]
  31. Sharma, D.; Rajarathnam, K. C-13 NMR chemical shifts can predict disulfide bond formation. J. Biomol. NMR 2000, 18, 165–171. [Google Scholar] [CrossRef] [PubMed]
  32. Berjanskii, M.V.; Wishart, D.S. Application of the random coil index to studying protein flexibility. J. Biomol. NMR 2008, 40, 31–48. [Google Scholar] [CrossRef] [PubMed]
  33. Pettersen, E.F.; Goddard, T.D.; Huang, C.C.; Couch, G.S.; Greenblatt, D.M.; Meng, E.C.; Ferrin, T.E. UCSF Chimera—A visualization system for exploratory research and analysis. J. Comput. Chem. 2004, 25, 1605–1612. [Google Scholar] [CrossRef] [PubMed] [Green Version]
  34. Cordier, F.; Grzesiek, S. Direct observation of hydrogen bonds in proteins by interresidue 3hJNC’ scalar couplings. J. Am. Chem. Soc. 1999, 121, 1601–1602. [Google Scholar] [CrossRef]
  35. Hafsa, N.E.; Arndt, D.; Wishart, D.S. Accessible surface area from NMR chemical shifts. J. Biomol. NMR 2015, 62, 387–401. [Google Scholar] [CrossRef] [PubMed]
  36. Kabsch, W.; Sander, C. Dictionary of protein secondary structure: Pattern-Recognition of hydrogen-bonded and geometrical features. Biopolymers 1983, 22, 2577–2637. [Google Scholar] [CrossRef]
  37. Farrow, N.A.; Muhandiram, R.; Singer, A.U.; Pascal, S.M.; Kay, C.M.; Gish, G.; Shoelson, S.E.; Pawson, T.; Formankay, J.D.; Kay, L.E. Backbone dynamics of a free and a phosphopeptide-complexed src homology-2 domain studied by N-15 NMR relaxation. Biochemistry 1994, 33, 5984–6003. [Google Scholar] [CrossRef]
  38. Lipari, G.; Szabo, A. Model-Free approach to the interpretation of nuclear magnetic-resonance relaxation in macromolecules.1. Theory and range of validity. J. Am. Chem. Soc. 1982, 104, 4546–4559. [Google Scholar] [CrossRef]
  39. Kneller, J.M.; Lu, M.; Bracken, C. An effective method for the discrimination of motional anisotropy and chemical exchange. J. Am. Chem. Soc. 2002, 124, 1852–1853. [Google Scholar] [CrossRef]
  40. Lefevre, J.F.; Dayie, K.T.; Peng, J.W.; Wagner, G. Internal mobility in the partially folded DNA binding and dimerization domains of GAL4: NMR analysis of the N-H spectral density functions. Biochemistry 1996, 35, 2674–2686. [Google Scholar] [CrossRef]
  41. Sonderegger, C.; Galgóczy, L.; Garrigues, S.; Fizil, Á.; Borics, A.; Manzanares, P.; Hegedüs, N.; Huber, A.; Marcos, J.F.; Batta, G.; et al. A Penicillium chrysogenum-based expression system for the production of small, cysteine-rich antifungal proteins for structural and functional analyses. Microb. Cell Fact. 2016, 15, 192. [Google Scholar] [CrossRef] [PubMed] [Green Version]
  42. Garrigues, S.; Gandia, M.; Borics, A.; Marx, F.; Manzanares, P.; Marcos, J.F. Mapping and identification of antifungal peptides in the putative antifungal protein AfpB from the filamentous fungus Penicillium digitatum. Front. Microbiol. 2017, 8. [Google Scholar] [CrossRef] [PubMed] [Green Version]
  43. Galgóczy, L.; Borics, A.; Virágh, M.; Ficze, H.; Váradi, G.; Kele, Z.; Marx, F. Structural determinants of Neosartorya fischeri antifungal protein (NFAP) for folding, stability and antifungal activity. Sci. Rep. 2017, 7. [Google Scholar] [CrossRef] [PubMed] [Green Version]
  44. Tóth, L.; Váradi, G.; Borics, A.; Batta, G.; Kele, Z.; Vendrinszky, A.; Tóth, R.; Ficze, H.; Tóth, G.K.; Vágvölgyi, C.; et al. Anti-Candidal activity and functional mapping of recombinant and synthetic Neosartorya fischeri antifungal protein 2 (NFAP2). Front. Microbiol. 2018, 9. [Google Scholar] [CrossRef] [Green Version]
  45. Mello, E.D.; Taveira, G.B.; Carvalho, A.D.; Gomes, V.M. Improved smallest peptides based on positive charge increase of the γ-core motif from PnuD-1 and their mechanism of action against Candida species. Int. J. Nanomed. 2019, 14, 407–420. [Google Scholar] [CrossRef] [Green Version]
  46. Tóth, L.; Váradi, G.; Boros, E.; Borics, A.; Ficze, H.; Nagy, I.; Tóth, G.K.; Rákhely, G.; Marx, F.; Galgóczy, L. Biofungicidal potential of Neosartorya (Aspergillus) fischeri antifungal protein NFAP and novel synthetic γ-core peptides. Front. Microbiol. 2020, 11. [Google Scholar] [CrossRef]
  47. Barker, D.G.; Pfaff, T.; Moreau, D.; Groves, E.; Ruffel, S.; Lepetit, M.; Whitehand, S.; Maillet, F.; Nair, R.M.; Journet, E.P. Growing M. Truncatula: Choice of substrates and growth conditions. In Medicago Truncatula Handbook; Mathesius, U., Journet, E.P., Sumner, L.W., Eds.; Samuel Roberts Noble Foundation: Ardmore, OK, USA, 2006; ISBN 0-9754303-1-9. [Google Scholar]
  48. Jurrus, E.; Engel, D.; Star, K.; Monson, K.; Brandi, J.; Felberg, L.E.; Brookes, D.H.; Wilson, L.; Chen, J.H.; Liles, K.; et al. Improvements to the APBS biomolecular solvation software suite. Protein Sci. 2018, 27, 112–128. [Google Scholar] [CrossRef] [Green Version]
  49. Boehr, D.D.; Nussinov, R.; Wright, P.E. The role of dynamic conformational ensembles in biomolecular recognition. Nat. Chem. Biol. 2009, 5, 789–796. [Google Scholar] [CrossRef] [Green Version]
  50. Chen, Z.T.; Ao, J.Q.; Yang, W.C.; Jiao, L.P.; Zheng, T.L.; Chen, X.H. Purification and characterization of a novel antifungal protein secreted by Penicillium chrysogenum from an arctic sediment. Appl. Microbiol. Biotechnol. 2013, 97, 10381–10390. [Google Scholar] [CrossRef]
  51. Garrigues, S.; Gandia, M.; Popa, C.; Borics, A.; Marx, F.; Coca, M.; Marcos, J.F.; Manzanares, P. Efficient production and characterization of the novel and highly active antifungal protein AfpB from Penicillium digitatum. Sci. Rep. 2017, 7. [Google Scholar] [CrossRef] [Green Version]
  52. Paege, N.; Jung, S.; Schape, P.; Muller-Hagen, D.; Ouedraogo, J.P.; Heiderich, C.; Jedamzick, J.; Nitsche, B.M.; van den Hondel, C.A.; Ram, A.F.; et al. A transcriptome meta-analysis proposes novel biological roles for the antifungal protein AnAFP in Aspergillus niger. PLoS ONE 2016, 11, e0165755. [Google Scholar] [CrossRef] [PubMed]
  53. Huber, A.; Lerchster, H.; Marx, F. Nutrient excess triggers the expression of the Penicillium chrysogenum antifungal protein PAFB. Microorganisms 2019, 7, 654. [Google Scholar] [CrossRef] [Green Version]
  54. Dean, R.; Van Kan, J.A.L.; Pretorius, Z.A.; Hammond-Kosack, K.E.; Di Pietro, A.; Spanu, P.D.; Rudd, J.J.; Dickman, M.; Kahmann, R.; Ellis, J.; et al. The top 10 fungal pathogens in molecular plant pathology. Mol. Plant Pathol. 2012, 13, 414–430. [Google Scholar] [CrossRef] [PubMed] [Green Version]
  55. Elad, Y.; Vivier, M.; Fillinger, S. Botrytis, the good, the bad and the ugly. In Botrytis—The Fungus, the Pathogen and its Management in Agricultural Systems; Fillinger, S., Elad, Y., Eds.; Springer: Cham, Switzerland, 2016. [Google Scholar]
  56. Adnan, M.; Hamada, M.S.; Li, G.Q.; Luo, C.X. Detection and molecular characterization of resistance to the dicarboximide and benzamide fungicides in Botrytis cinerea from tomato in Hubei province, China. Plant Dis. 2018, 102, 1299–1306. [Google Scholar] [CrossRef] [PubMed] [Green Version]
  57. Abbey, J.A.; Percival, D.; Abbey, L.; Asiedu, S.K.; Prithiviraj, B.; Schilder, A. Biofungicides as alternative to synthetic fungicide control of grey mould (Botrytis cinerea)—Prospects and challenges. Biocontrol Sci. Technol. 2019, 29, 241–262. [Google Scholar] [CrossRef]
  58. Rosero-Hernandez, E.D.; Moraga, J.; Collado, I.G.; Echeverri, F. Natural compounds that modulate the development of the fungus Botrytis cinerea and protect Solanum lycopersicum. Plants 2019, 8, 111. [Google Scholar] [CrossRef] [PubMed] [Green Version]
  59. Adnan, M.; Hamada, M.S.; Hahn, M.; Li, G.; Luo, C. Fungicide resistance of Botrytis cinerea from strawberry to procymidone and zoxamide in Hubei, China. Phytopathol. Res. 2019, 1. [Google Scholar] [CrossRef]
  60. Keller, R. The Computer Aided Resonance Assignment Tutorial; Cantina Verlag: Goldau, Switzerland, 2004. [Google Scholar]
  61. Sattler, M.; Schleucher, J.; Griesinger, C. Heteronuclear multidimensional NMR experiments for the structure determination of proteins in solution employing pulsed field gradients. Prog. Nucl. Magn. Reson. Spectrosc. 1999, 34, 93–158. [Google Scholar] [CrossRef]
  62. Vranken, W.F.; Boucher, W.; Stevens, T.J.; Fogh, R.H.; Pajon, A.; Llinas, P.; Ulrich, E.L.; Markley, J.L.; Ionides, J.; Laue, E.D. The CCPN data model for NMR spectroscopy: Development of a software pipeline. Proteins Struct. Funct. Bioinform. 2005, 59, 687–696. [Google Scholar] [CrossRef]
  63. Shen, Y.; Bax, A. Protein backbone and sidechain torsion angles predicted from NMR chemical shifts using artificial neural networks. J. Biomol. NMR 2013, 56, 227–241. [Google Scholar] [CrossRef] [Green Version]
  64. Shen, Y.; Delaglio, F.; Cornilescu, G.; Bax, A. TALOS plus: A hybrid method for predicting protein backbone torsion angles from NMR chemical shifts. J. Biomol. NMR 2009, 44, 213–223. [Google Scholar] [CrossRef]
  65. Herrmann, T.; Güntert, P.; Wüthrich, K. Protein NMR structure determination with automated NOE-identification in the NOESY spectra using the new software ATNOS. J. Biomol. NMR 2002, 24, 171–189. [Google Scholar] [CrossRef] [PubMed]
  66. Herrmann, T.; Güntert, P.; Wüthrich, K. Protein NMR structure determination with automated NOE assignment using the new software CANDID and the torsion angle dynamics algorithm DYANA. J. Mol. Biol. 2002, 319, 209–227. [Google Scholar] [CrossRef] [Green Version]
  67. Grey, M.J.; Wang, C.Y.; Palmer, A.G. Disulfide bond isomerization in basic pancreatic trypsin inhibitor: Multisite chemical exchange quantified by CPMG relaxation dispersion and chemical shift modeling. J. Am. Chem. Soc. 2003, 125, 14324–14335. [Google Scholar] [CrossRef] [PubMed]
  68. Palmer, A.G.; Koss, H. Chemical exchange. In Biological NMR, Pt B; Wand, A.J., Ed.; Academic Press: Waltham, MA, USA, 2019; Volume 615, pp. 177–236. [Google Scholar]
  69. Sreerama, N.; Woody, R.W. Estimation of protein secondary structure from circular dichroism spectra: Comparison of CONTIN, SELCON, and CDSSTR methods with an expanded reference set. Anal. Biochem. 2000, 287, 252–260. [Google Scholar] [CrossRef] [PubMed]
  70. Poór, P.; Gémes, K.; Horváth, F.; Szepesi, A.; Simon, M.L.; Tari, I. Salicylic acid treatment via the rooting medium interferes with stomatal response, CO2 fixation rate and carbohydrate metabolism in tomato, and decreases harmful effects of subsequent salt stress. Plant Biol. 2011, 13, 105–114. [Google Scholar] [CrossRef] [PubMed]
  71. El Oirdi, M.; Trapani, A.; Bouarab, K. The nature of tobacco resistance against Botrytis cinerea depends on the infection structures of the pathogen. Environ. Microbiol. 2010, 12, 239–253. [Google Scholar] [CrossRef]
  72. El Oirdi, M.; Abd El Rahman, T.; Rigano, L.; El Hadrami, A.; Rodriguez, M.C.; Daayf, F.; Vojnov, A.; Bouarab, K. Botrytis cinerea manipulates the antagonistic effects between immune pathways to promote disease development in tomato. Plant Cell 2011, 23, 2405–2421. [Google Scholar] [CrossRef] [Green Version]
  73. Kato, Y.; Miura, E.; Matsushima, R.; Sakamoto, W. White leaf sectors in yellow variegated2 are formed by viable cells with undifferentiated plastids. Plant Physiol. 2007, 144, 952–960. [Google Scholar] [CrossRef] [Green Version]
Figure 1. ClustalW multiple alignment of the mature, P. brevicompactum “bubble protein” BP-clade-specific MPs of Eurotiomycetes [21]. P. chrysogenum PAFC (Pench_146100) is framed in blue. The two conserved γ-core motifs found in the members of this clade are framed in red. The abbreviations of the full species names and the protein accession number are indicated: Penbr (P. brevicompactum), Pench (P. chrysogenum), Penfla (Penicillium falvigenum) Penla (Penicillium lanosocoeruleum), Penpol (Penicillium polonicum), Pencop (Penicillium coprophilum), Penswi (Penicillium swiecickii), Penex (Penicillium expansum), Penvul (Penicillium vulpinum), Asptaic (Aspergillus taichungensis), Aspcand (Aspergillus candidus), Asptr (Aspergillus triticus), Aspcam (Aspergillus campestris), Aspeamy (Aspergillus amylovorus), Aspve (Aspergillus versicolor), Neofi (Neosartorya fischeri), Aspnov (Aspergillus novofumigatus), Penant (Penicillium antarticum), and Aspbom (Aspergillus bombycis). The color coding of aa was applied according to ClustalX. The conservation between the respective sequences based on the ClustalW2 Multiple Sequence Alignment tool [26] is indicated at the bottom.
Ijms 22 01183 g001
Figure 2. Comparison of the structures of Penicillium spp. MPs. (A) The NMR solution structure of the PAFC (pdb code 6TRM). The position of the Cys residues is indicated, and the disulfide bonds are labeled as yellow sticks. (B) Superimposed structures of the PAFC (pdb code 6TRM) and the P. brevicompactum BP (gray color; pdb code: 1UOY) using Chimera visualization software [33]. (C) Backbone NMR conformational ensemble of 20 structures of PAFC.
Ijms 22 01183 g002
Figure 3. fASA values of PAFC calculated from 13C chemical shift data show residue-by-residue hydrophobicity of the structure. Residues with fASA values below 0.25 are considered strongly buried, while fASA values above 0.75 indicate exposure to solvent.
Ijms 22 01183 g003
Figure 4. Reduced spectral density mapping of NH mobilities in PAFC (298 K). The limiting continuous curve represents the absence of internal motion, as calculated by τc = 3.14 ns global correlation time. Spectral densities (the strength of fluctuating radiofrequency fields from molecular rotational diffusion) at 15N frequency shown as a function of such fields close to zero frequency (slow-motion regime) [40]. JomN on the vertical axis shows the spectral densities at 15N frequency, while J0 on the horizontal axis is proportional to spectral densities close to zero frequency. The units of the two axes should be understood as 10−9 (s rad−1).
Ijms 22 01183 g004
Figure 5. Disorder index (DI), as obtained directly from reduced spectral density mapping of 15N NMR relaxation data. The DI is just derived from Figure 4 by calculating the geometrical (shortest) distances of the points from the solid (limiting) curve. The γ-core regions are labeled as red bars, while other residues are blue.
Ijms 22 01183 g005
Figure 6. ECD spectra and thermal unfolding curve of PAFC. (A) Spectra in the 185–260 nm region were measured at 25 °C (green), 95 °C (red), and again 25 °C (blue) after refolding. (B) Thermal unfolding of PAFC, followed by ECD spectra at 229 nm. Tm = 77 °C.
Ijms 22 01183 g006
Figure 7. The primary structure of PAFC and the derived synthetic γ-core peptides. The aa sequence of PAFC is indicated by a one-letter code. The predicted levomeric γ-core motifs in the center and the C-terminus are highlighted in red. Below, sequences of the N-terminally acetylated (Ac-) synthetic peptides PCγ15, PCγ17, and PCγC-terminal are indicated.
Ijms 22 01183 g007
Figure 8. Vegetative growth and root development of Medicago truncatula A-17. (A) Morphology of plant seedlings and (B) primary root length (gray bars) and number of lateral roots (hatched bars) after daily treatment with 1 mg mL−1 of PAFC for 10 days at 25 °C under continuous illumination (1200 lux) compared to the ddH2O- and 70% (v/v) ethanol-treated controls, respectively. Scale bar, 30 mm. Significant difference in (B) was evaluated with the two-sample t-test and is indicated with ** (p < 0.005).
Ijms 22 01183 g008
Figure 9. PAFC tolerance of tomato plant leaves and protective effect of PAFC against B. cinerea infection. The phenotype of leaves is shown in the left panels and damage evaluation with Evan’s blue staining in the right panels. (A) Leaves were either left untreated or treated with 10 µL of 0.1 × PDB (negative controls). (B) For toxicity testing, leaves were treated with 10 µL of PAFC (1 mg mL−1). (C) Plant protection efficacy was evaluated with leaves infected with 10 µL of B. cinerea conidia (107 conidia mL−1) (infection control) and conidia mixed with PAFC (1 mg mL−1). Plants were then further incubated for four days at 23 °C under photoperiodic day/night simulation (12/12 h with or without illumination at 1200 lux) and then harvested for staining. Scale bar, 10 mm.
Ijms 22 01183 g009
Figure 10. (A) Electrostatic potential surface of PAFC, as calculated [48] from the 6TRM structure deposited in pdb. Red means negative, and blue means positive surfaces. The scale is in kJ/mol/e. (B) Front view of cavity B of PAFC, formed predominantly by residues 3, 12, 13, 14, 28, 29, 30, 31, 33, 34, 35, 36, 44, 45, and 48.
Ijms 22 01183 g010
Table 1. Observed long-range hydrogen bonds in PAFC, identified in the hncogphb3d NMR spectrum [34].
Secondary Structure ElementsResidue with Amide HydrogenResidue with Carbonyl Oxygen
β1-β229Gly34Gly
β1-β236Val27Phe
β1-β227Phe36Val
β2-β335Ile47Gln
β2-β337Glu44Thr
β2-β339Lys42Lys
β2-β344Thr37Glu
β2-β346Ile35Ile
β2-β349Cys33Thr
β4-β555Arg63Arg
β4-β557Val60Gly
β4-β563Arg55Arg
N-terminal-β112Arg28Cys
N-terminal-β128Cys10Asp
N-terminal-β315Asn43Trp
N-terminal-β343Trp16Ser
loop1-β454Cys32Arg
N-terminal region13Arg1Asp
Table 2. Estimation of secondary structural components of PAFC from ECD spectra compared to those obtained from NMR measurements.
Secondary Structural
Elements/%
PAFC
25 °C
PAFC
95 °C
PAFC
25 °C
after Heating
BP Crystallographic Structure (1UOY) §PAFC Solution NMR Structure (6TRM) §
α- or 310-helix13151456
β-strand, extended2826283938
β- or γ-turns, bends2626253133
unordered3334322523
§ The fraction of secondary structural elements was determined by DSSP analysis [36] of the NMR-derived PAFC structure and the crystallographic structure of the homologous P. brevicompactum BP [24].
Table 3. PAFC inhibitory concentrations that reduce the growth of microorganisms by ≥90% (IC90) $.
MicroorganismIC90
µMμg mL−1
Aspergillus fumigatus>30199
Aspergillus nidulans30199
Aspergillus niger>30199
Neurospora crassa1599
Penicillium chrysogenum50331
Microsporum gypseum746
Trichophyton rubrum533
Bacillus subtilis>50331
Escherichia coli>50331
$ Broth microdilution assays were performed to determine the IC90. Microorganisms were grown in ten-fold-diluted potato dextrose broth (0.1 × PDB) for 24 h at 30 °C in static culture before measurement of the optical density at wavelength 620 nm (OD620nm). Exceptions: N. crassa was grown for 16–30 h at 25 °C, and M. gypseum and T. rubrum were grown for eight days at 30 °C. IC90 was defined as the PAFC concentration that inhibited growth by ≥90% compared to the untreated control, which represented 100% growth.
Table 4. Physicochemical characteristics and the fungal growth inhibitory potential (IC90) of the peptides PCγ15, PCγ17, and PCγC-terminal compared to the full-length MP PAFC §.
Protein/PeptideMolecular Mass (kDa)Charge
(pH 7.0)
GRAVYIC90
N. crassaC. albicans
μMμg mL−1μMμg mL−1
PAFC6.6+0.6−0.76712.5832.517
PCγ151.5−0.2+0.087>10066>10066
PCγ171.8+1.1−0.36725166>10066
PCγC-terminal0.7+0.8+0.038>10066>10066
§ The calculated molecular mass (kDa, ExPasy ProtParam tool), the predicted net charge (at pH 7, http://protcalc.sourceforge.net), and the GRAVY value (www.gravy-calculator.de) are indicated. For determination of IC90 values in 0.1 × PDB, C. albicans was grown for 24 h at 30 °C and N. crassa for 16–30 h at 25 °C. IC90 was defined as a protein/peptide concentration that inhibited growth by ≥90% compared to the untreated control, which represented 100% growth.
Table 5. Inhibition of Botrytis cinerea surface culture growth by PAFC §.
PAFC (mg mL−1)Diameter of Inhibition Zone (mm)
0.2516.5 ± 0.71
0.517.0 ± 0.00
0.7518.5 ± 0.71
1.020.0 ± 0.00
§Botrytis cinerea SZMC 21,472 was grown on 0.1 × PDA plates for 96 h at 25 °C.
Publisher’s Note: MDPI stays neutral with regard to jurisdictional claims in published maps and institutional affiliations.

