
Oncogenic NRAS Accelerates Rhabdomyosarcoma Formation When Occurring within a Specific Time Frame during Tumor Development in Mice


Abstract
:1. Introduction
2. Results and Discussion
3. Materials and Methods
3.1. Animal Experiments
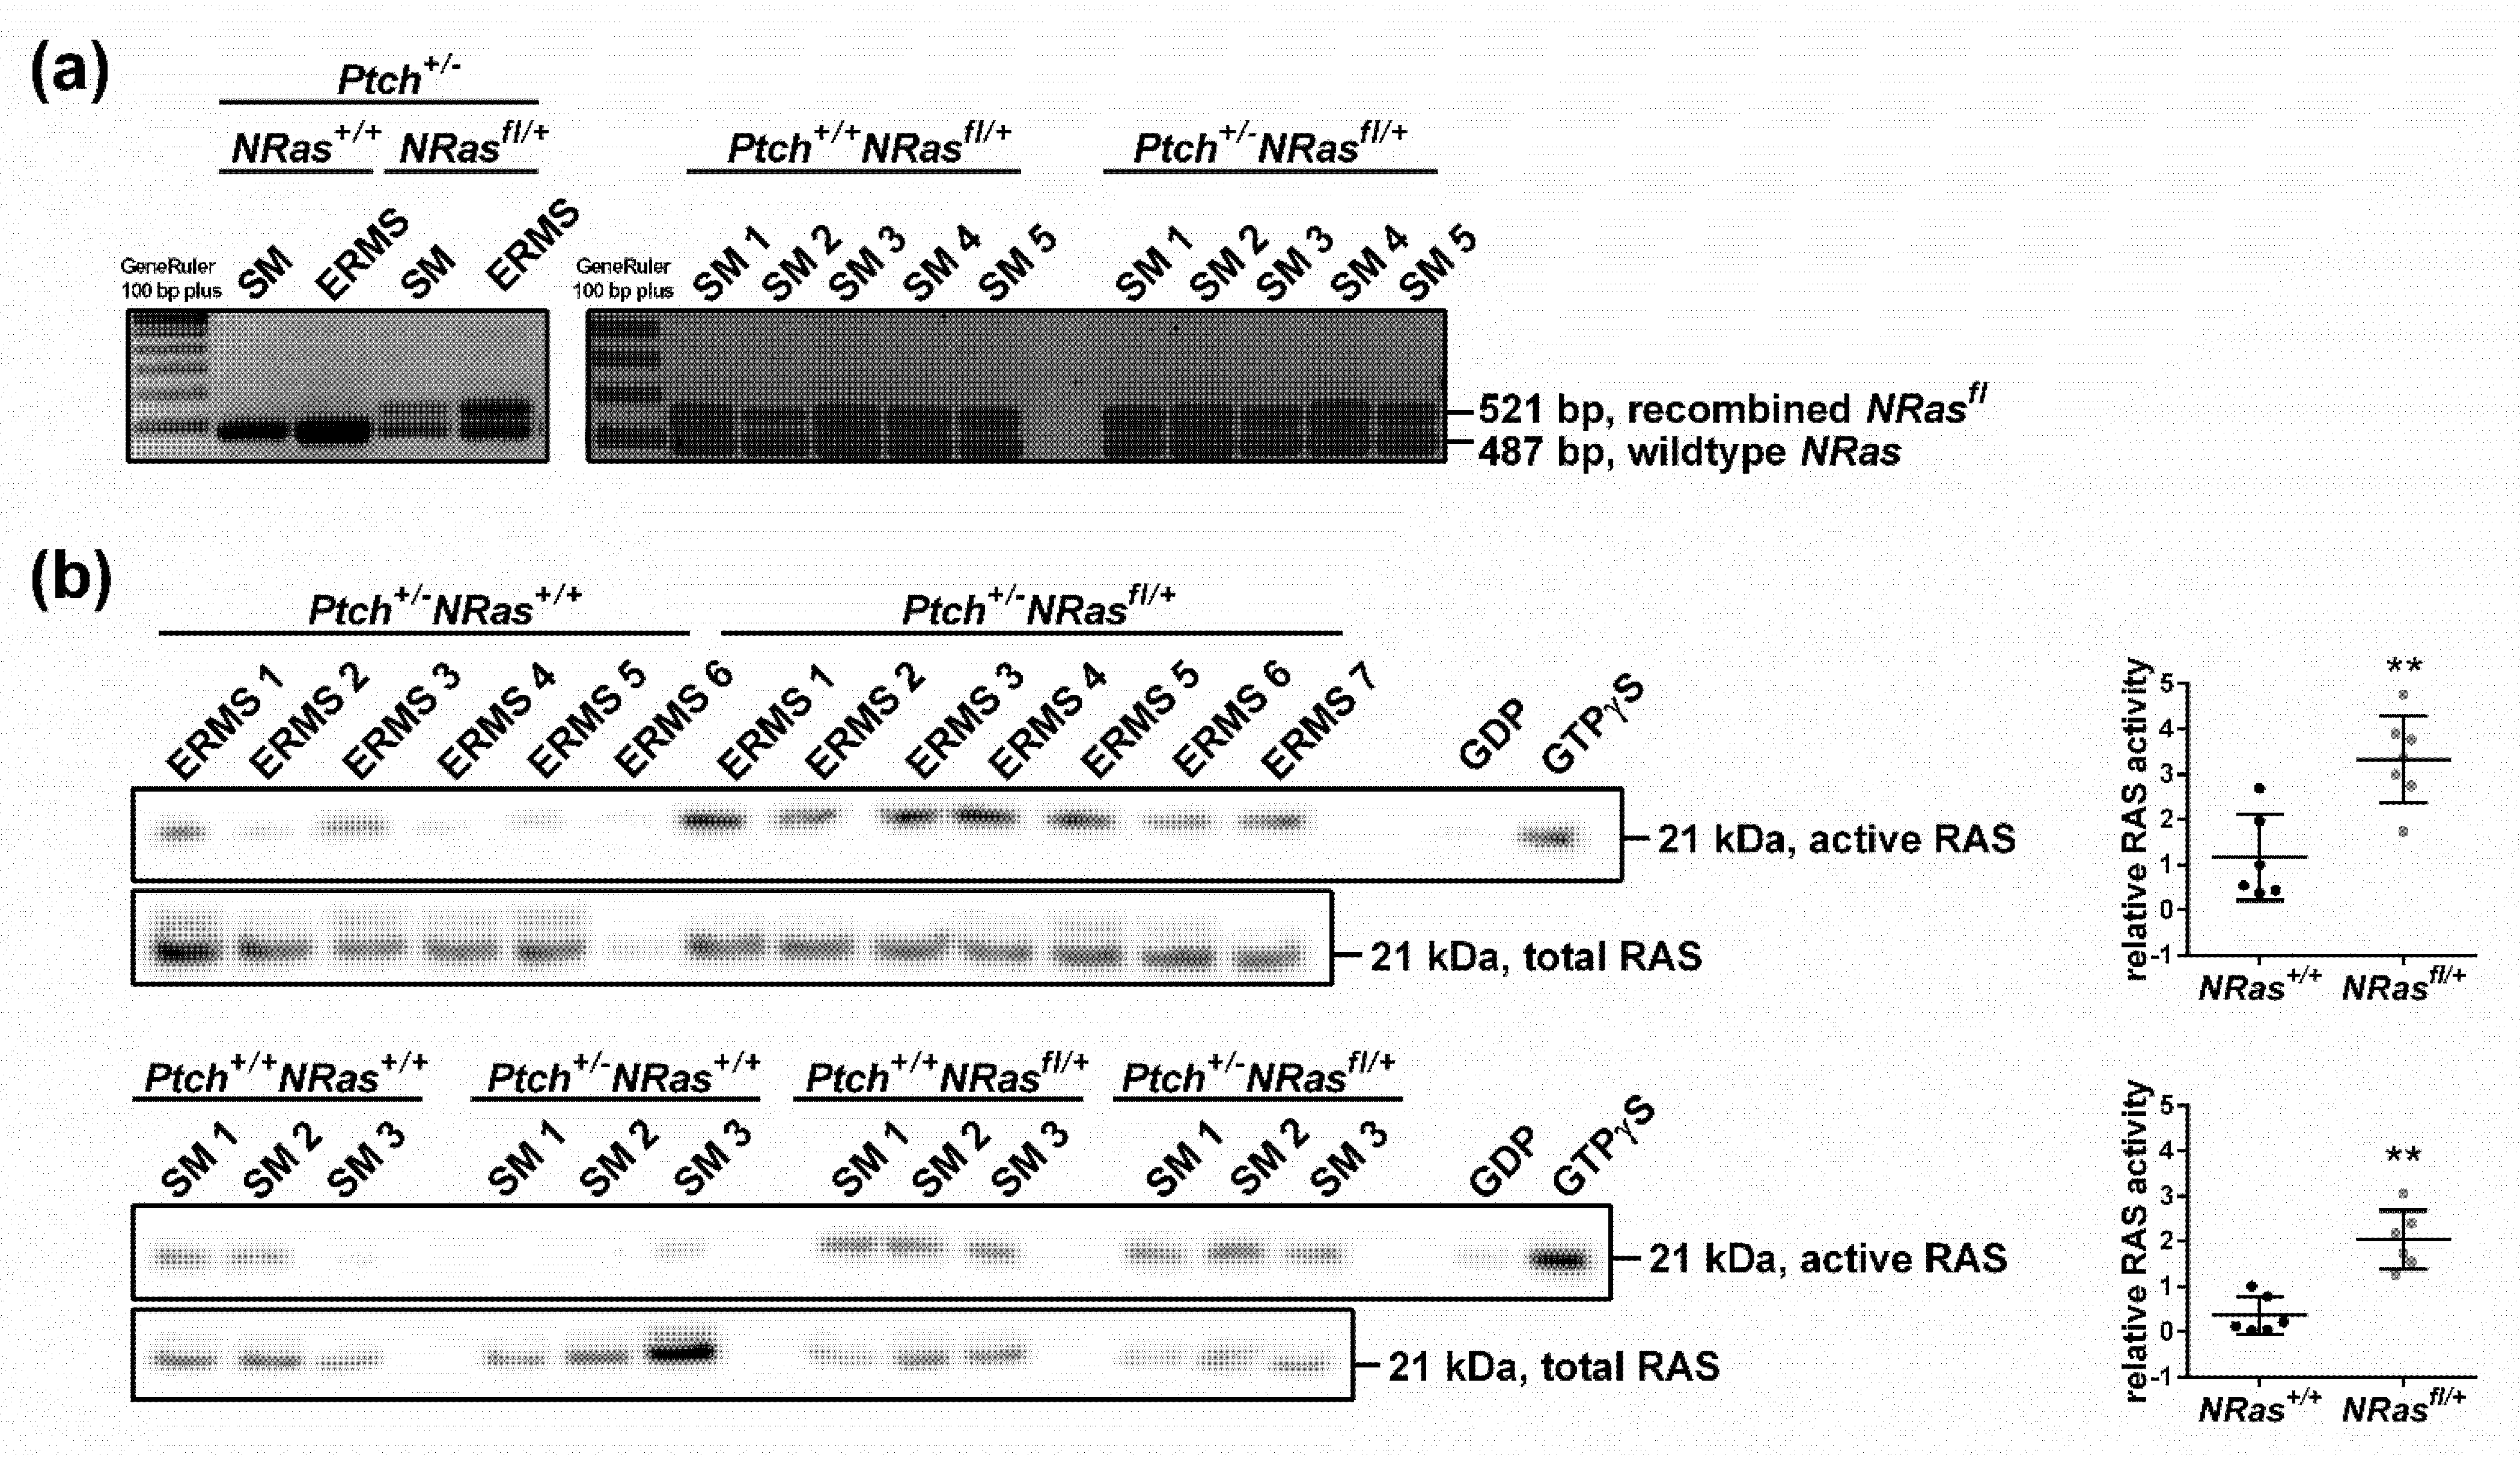
3.2. NRas Recombination Assays
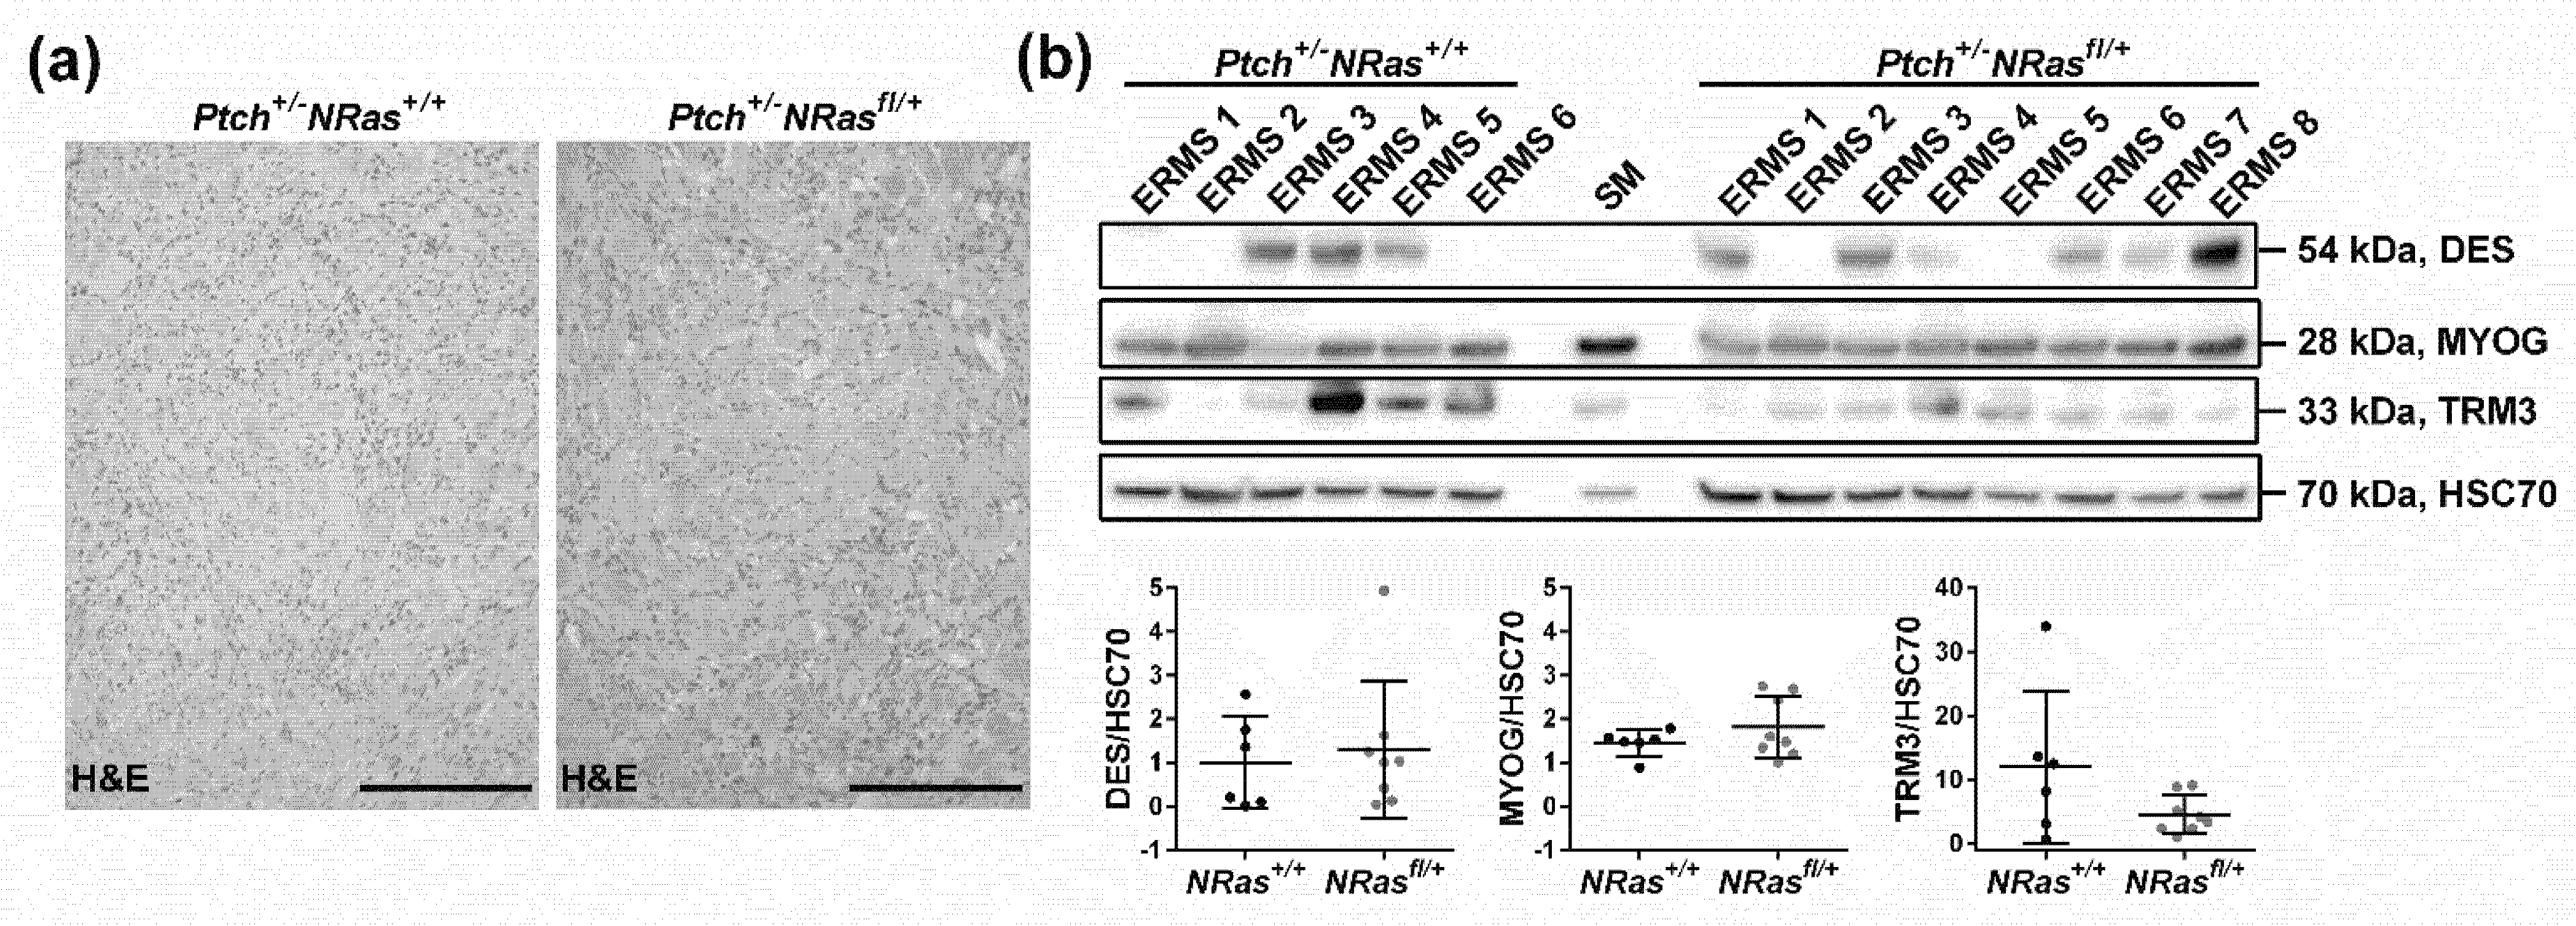
3.3. Western Blot and RAS Activity Assay
3.4. Immunohistochemistry
3.5. Statistical Analyses
Author Contributions
Funding
Institutional Review Board Statement
Informed Consent Statement
Acknowledgments
Conflicts of Interest
References
- Chen, C.; Dorado Garcia, H.; Scheer, M.; Henssen, A.G. Current and Future Treatment Strategies for Rhabdomyosarcoma. Front. Oncol. 2019, 9, 1458. [Google Scholar] [CrossRef] [PubMed]
- Cristina, R.A. World Health Organization Classification of Soft Tissue and Bone Tumours, 5th ed.; IARC Press: Lyon, France, 2020; Volume 3. [Google Scholar]
- Skapek, S.X.; Ferrari, A.; Gupta, A.A.; Lupo, P.J.; Butler, E.; Shipley, J.; Barr, F.G.; Hawkins, D.S. Rhabdomyosarcoma. Nat. Rev. Dis. Primers 2019, 5, 1. [Google Scholar] [CrossRef] [PubMed]
- Williamson, D.; Missiaglia, E.; de Reynies, A.; Pierron, G.; Thuille, B.; Palenzuela, G.; Thway, K.; Orbach, D.; Lae, M.; Freneaux, P.; et al. Fusion gene-negative alveolar rhabdomyosarcoma is clinically and molecularly indistinguishable from embryonal rhabdomyosarcoma. J. Clin. Oncol. 2010, 28, 2151–2158. [Google Scholar] [CrossRef] [Green Version]
- Shern, J.F.; Selfe, J.; Izquierdo, E.; Patidar, R.; Chou, H.C.; Song, Y.K.; Yohe, M.E.; Sindiri, S.; Wei, J.; Wen, X.; et al. Genomic Classification and Clinical Outcome in Rhabdomyosarcoma: A Report from an International Consortium. J. Clin. Oncol. 2021, 39, 2859–2871. [Google Scholar] [CrossRef] [PubMed]
- Seki, M.; Nishimura, R.; Yoshida, K.; Shimamura, T.; Shiraishi, Y.; Sato, Y.; Kato, M.; Chiba, K.; Tanaka, H.; Hoshino, N.; et al. Integrated genetic and epigenetic analysis defines novel molecular subgroups in rhabdomyosarcoma. Nat. Commun. 2015, 6, 7557. [Google Scholar] [CrossRef] [Green Version]
- Casey, D.L.; Wexler, L.H.; Pitter, K.L.; Samstein, R.M.; Slotkin, E.K.; Wolden, S.L. Genomic Determinants of Clinical Outcomes in Rhabdomyosarcoma. Clin. Cancer Res. 2020, 26, 1135–1140. [Google Scholar] [CrossRef] [Green Version]
- Agaram, N.P.; Huang, S.C.; Tap, W.D.; Wexler, L.H.; Antonescu, C.R. Clinicopathologic and Survival Correlates of Embryonal Rhabdomyosarcoma Driven by RAS/RAF Mutations. Genes Chromosomes Cancer 2021. online ahead of print. [Google Scholar] [CrossRef]
- Prior, I.A.; Lewis, P.D.; Mattos, C. A comprehensive survey of Ras mutations in cancer. Cancer Res. 2012, 72, 2457–2467. [Google Scholar] [CrossRef] [Green Version]
- Li, S.; Balmain, A.; Counter, C.M. A model for RAS mutation patterns in cancers: Finding the sweet spot. Nat. Rev. Cancer 2018, 18, 767–777. [Google Scholar] [CrossRef]
- Nitzki, F.; Zibat, A.; Frommhold, A.; Schneider, A.; Schulz-Schaeffer, W.; Braun, T.; Hahn, H. Uncommitted precursor cells might contribute to increased incidence of embryonal rhabdomyosarcoma in heterozygous Patched1-mutant mice. Oncogene 2011, 30, 4428–4436. [Google Scholar] [CrossRef] [Green Version]
- Bauer, J.; Cuvelier, N.; Ragab, N.; Simon-Keller, K.; Nitzki, F.; Geyer, N.; Botermann, D.S.; Elmer, D.P.; Rosenberger, A.; Rando, T.A.; et al. Context-dependent modulation of aggressiveness of pediatric tumors by individual oncogenic RAS isoforms. Oncogene 2021, 40, 4955–4966. [Google Scholar] [CrossRef]
- Biressi, S.; Bjornson, C.R.; Carlig, P.M.; Nishijo, K.; Keller, C.; Rando, T.A. Myf5 expression during fetal myogenesis defines the developmental progenitors of adult satellite cells. Dev. Biol. 2013, 379, 195–207. [Google Scholar] [CrossRef] [Green Version]
- Wang, J.; Liu, Y.; Li, Z.; Wang, Z.; Tan, L.X.; Ryu, M.J.; Meline, B.; Du, J.; Young, K.H.; Ranheim, E.; et al. Endogenous oncogenic Nras mutation initiates hematopoietic malignancies in a dose- and cell type-dependent manner. Blood 2011, 118, 368–379. [Google Scholar] [CrossRef] [PubMed] [Green Version]
- You, X.; Ryu, M.J.; Cho, E.; Sang, Y.; Damnernsawad, A.; Zhou, Y.; Liu, Y.; Zhang, J.; Lee, Y. Embryonic Expression of Nras (G 12 D) Leads to Embryonic Lethality and Cardiac Defects. Front. Cell Dev. Biol. 2021, 9, 633661. [Google Scholar] [CrossRef] [PubMed]
- Altmuller, F.; Lissewski, C.; Bertola, D.; Flex, E.; Stark, Z.; Spranger, S.; Baynam, G.; Buscarilli, M.; Dyack, S.; Gillis, J.; et al. Genotype and phenotype spectrum of NRAS germline variants. Eur. J. Hum. Genet. EJHG 2017, 25, 823–831. [Google Scholar] [CrossRef] [PubMed]
- Garren, B.; Stephan, M.; Hogue, J.S. NRAS associated RASopathy and embryonal rhabdomyosarcoma. Am. J. Med. Genet. Part A 2020, 182, 195–200. [Google Scholar] [CrossRef]
- Cirstea, I.C.; Kutsche, K.; Dvorsky, R.; Gremer, L.; Carta, C.; Horn, D.; Roberts, A.E.; Lepri, F.; Merbitz-Zahradnik, T.; Konig, R.; et al. A restricted spectrum of NRAS mutations causes Noonan syndrome. Nat. Genet. 2010, 42, 27–29. [Google Scholar] [CrossRef]
- Chal, J.; Pourquie, O. Making muscle: Skeletal myogenesis in vivo and in vitro. Development 2017, 144, 2104–2122. [Google Scholar] [CrossRef] [Green Version]
- Yohe, M.E.; Heske, C.M.; Stewart, E.; Adamson, P.C.; Ahmed, N.; Antonescu, C.R.; Chen, E.; Collins, N.; Ehrlich, A.; Galindo, R.L.; et al. Insights in pediatric rhabdomyosarcoma research: Challenges and goals. Pediatric Blood Cancer 2019, 66, e27869. [Google Scholar] [CrossRef]
- Yamamoto, M.; Legendre, N.P.; Biswas, A.A.; Lawton, A.; Yamamoto, S.; Tajbakhsh, S.; Kardon, G.; Goldhamer, D.J. Loss of MyoD and Myf5 in Skeletal Muscle Stem Cells Results in Altered Myogenic Programming and Failed Regeneration. Stem Cell Rep. 2018, 10, 956–969. [Google Scholar] [CrossRef] [Green Version]
- Sieber, O.M.; Tomlinson, S.R.; Tomlinson, I.P. Tissue, cell and stage specificity of (epi)mutations in cancers. Nat. Rev. Cancer 2005, 5, 649–655. [Google Scholar] [CrossRef] [PubMed]
- Rivlin, N.; Brosh, R.; Oren, M.; Rotter, V. Mutations in the p53 Tumor Suppressor Gene: Important Milestones at the Various Steps of Tumorigenesis. Genes Cancer 2011, 2, 466–474. [Google Scholar] [CrossRef] [PubMed] [Green Version]
- Zibat, A.; Uhmann, A.; Nitzki, F.; Wijgerde, M.; Frommhold, A.; Heller, T.; Armstrong, V.; Wojnowski, L.; Quintanilla-Martinez, L.; Reifenberger, J.; et al. Time-point and dosage of gene inactivation determine the tumor spectrum in conditional Ptch knockouts. Carcinogenesis 2009, 30, 918–926. [Google Scholar] [CrossRef] [Green Version]
- Hahn, H.; Nitzki, F.; Schorban, T.; Hemmerlein, B.; Threadgill, D.; Rosemann, M. Genetic mapping of a Ptch1-associated rhabdomyosarcoma susceptibility locus on mouse chromosome 2. Genomics 2004, 84, 853–858. [Google Scholar] [CrossRef]
- Haigis, K.M.; Kendall, K.R.; Wang, Y.; Cheung, A.; Haigis, M.C.; Glickman, J.N.; Niwa-Kawakita, M.; Sweet-Cordero, A.; Sebolt-Leopold, J.; Shannon, K.M.; et al. Differential effects of oncogenic K-Ras and N-Ras on proliferation, differentiation and tumor progression in the colon. Nat. Genet. 2008, 40, 600–608. [Google Scholar] [CrossRef] [PubMed] [Green Version]
- Casper, K.B.; Jones, K.; McCarthy, K.D. Characterization of astrocyte-specific conditional knockouts. Genesis 2007, 45, 292–299. [Google Scholar] [CrossRef]


| Genotype (All Mice Are Myf5CreER/wt) | Drug; Age at Application | n | 2 Median Overall Survival (Min-Max) | Mice with ERMS (Palpable and Non-Palpable) | Mice with Palpable ERMS | Mice with ≥ 2 ERMS (Palpable and Non-Palpable) | Other Findings |
|---|---|---|---|---|---|---|---|
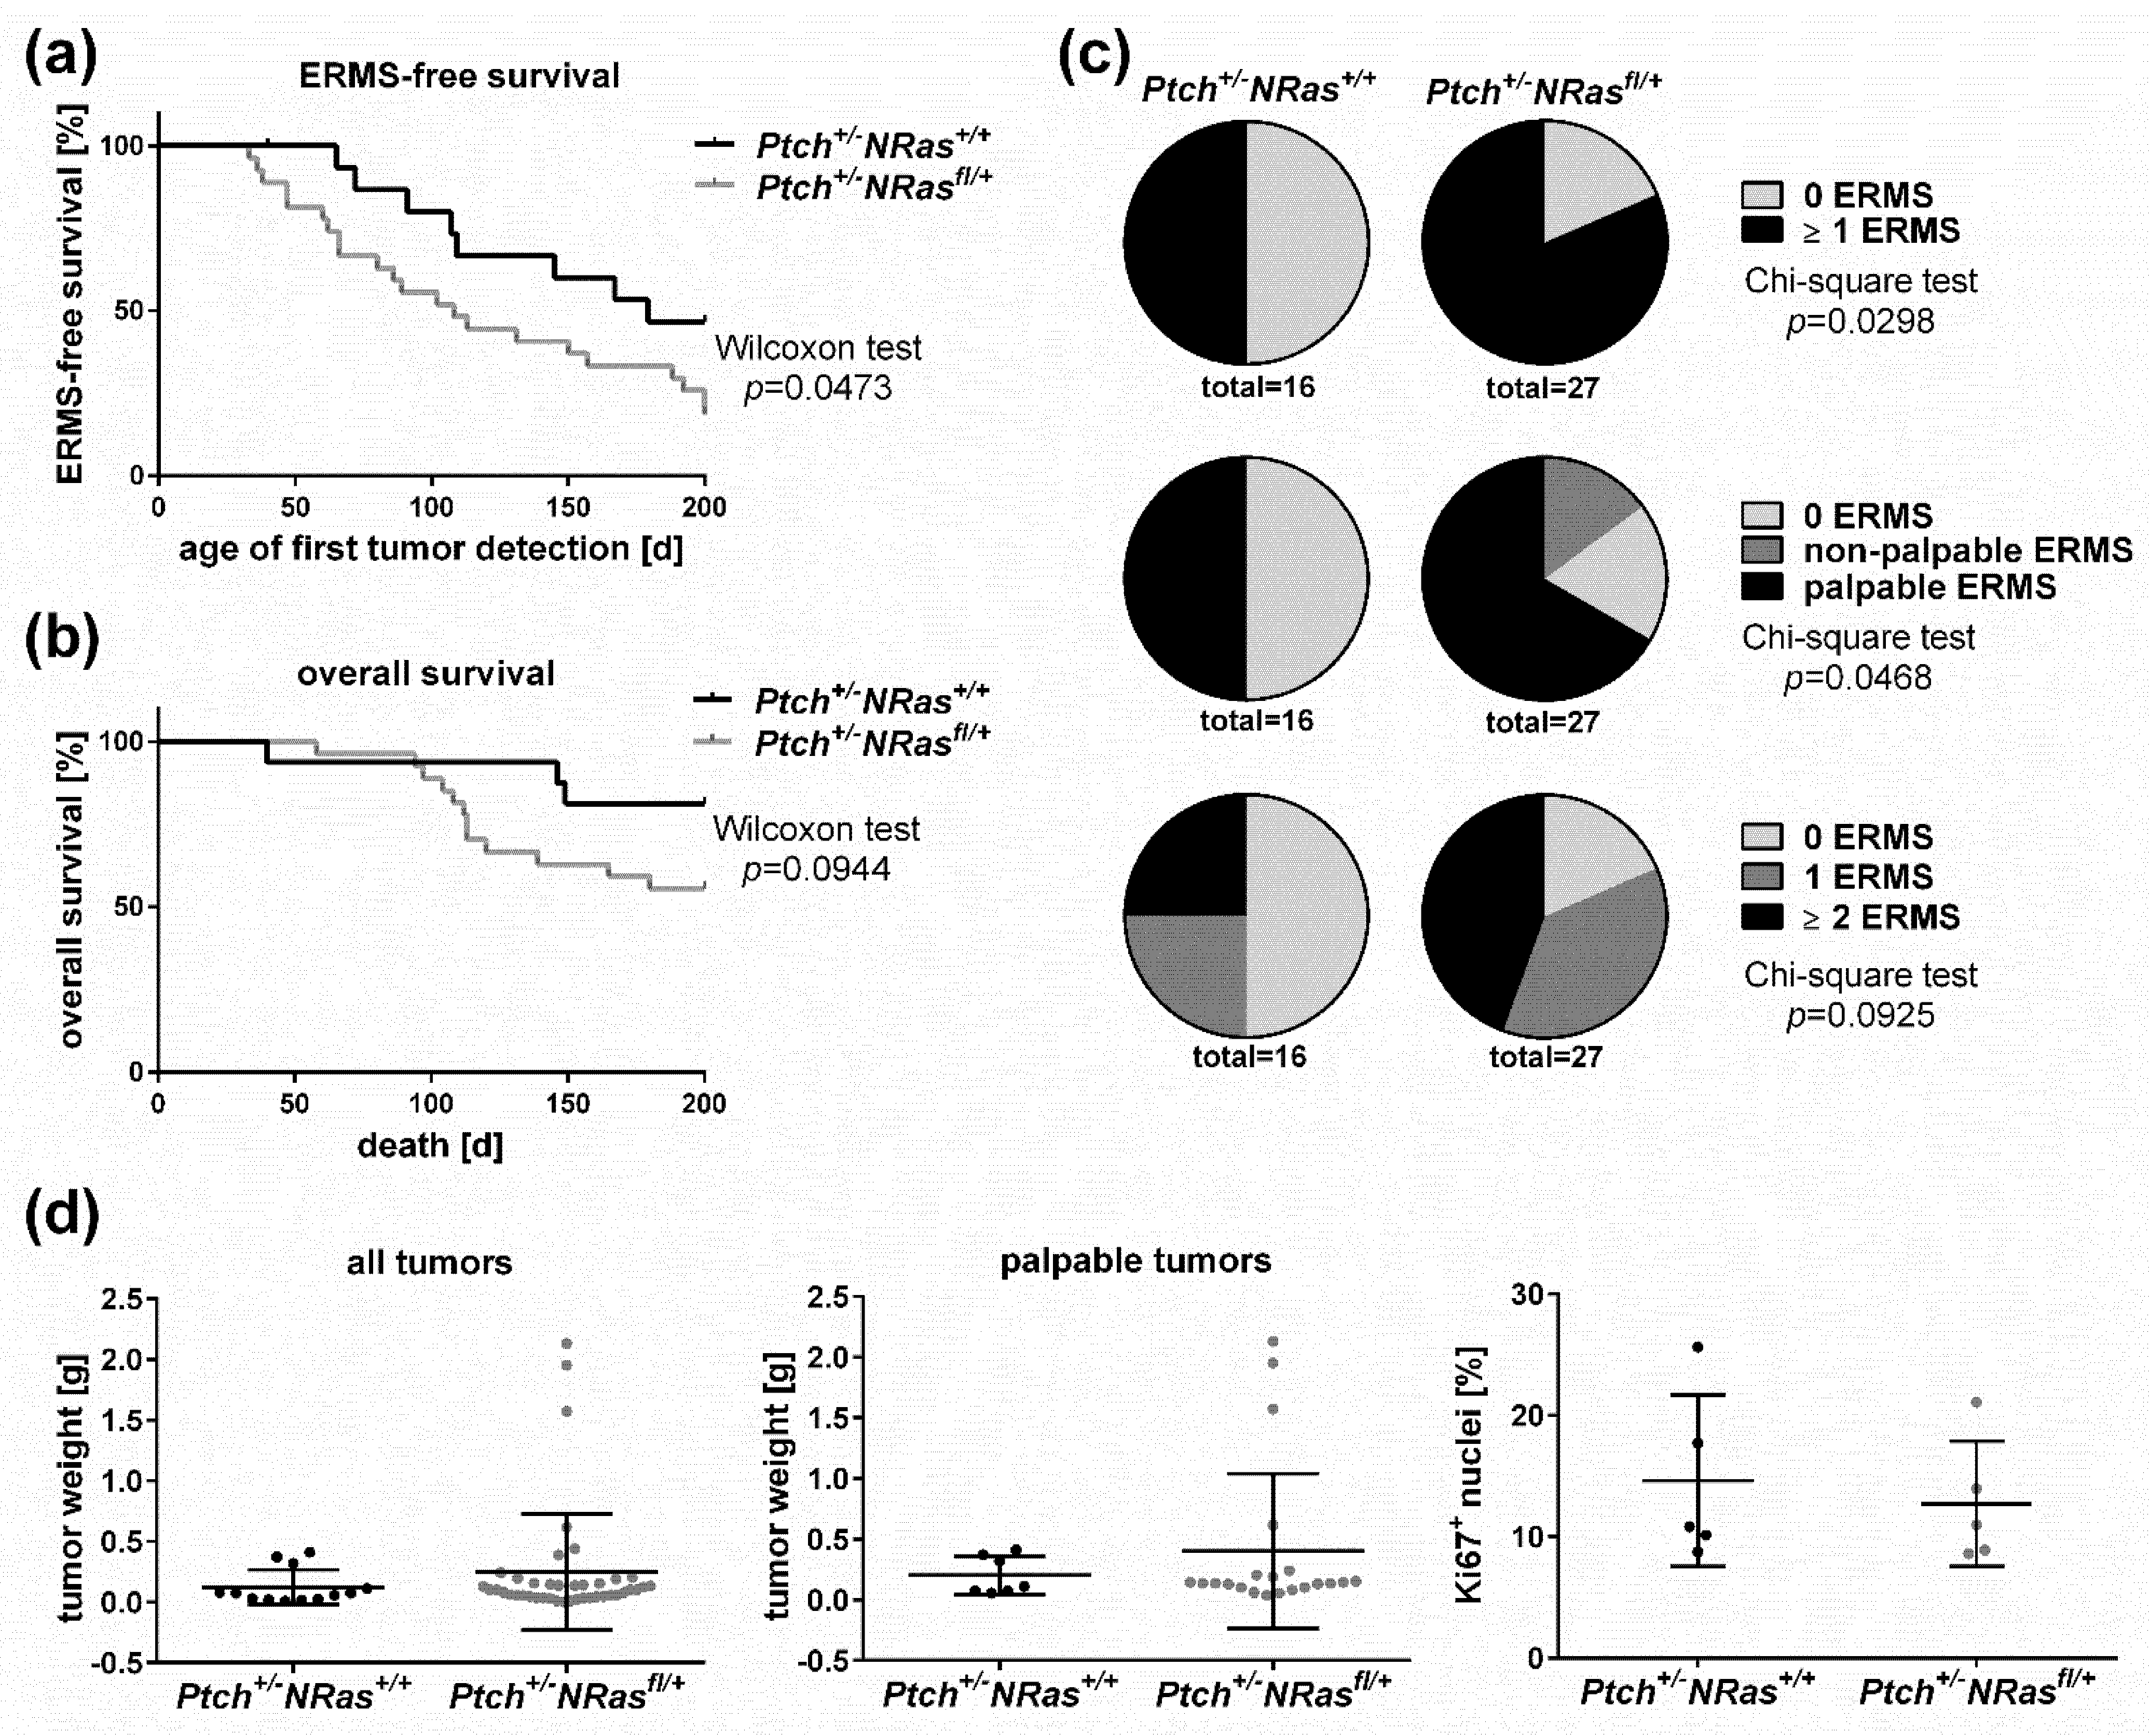
| 1Ptch+/-NRasfl/+ | no drug | 26 | 200 days (76–206) | 16 (62%) | 14 (54%) | 10 (38%) | 3cysts (4), medulloblastoma (2) |
| 1Ptch+/-NRasfl/+ | 5 × 1 mg Tam i.p. at P28 to P32 | 26 | 200 days (131–212) | 19 (73%) | 17 (65%) | 8 (31%) | 3cysts (6), medulloblastoma (1) |
| Ptch+/+NRas+/+ | 2 × 1.5 mg Tam i.p. at P12 and P14 | 20 | 201 days (193–211) | - | - | - | - |
| Ptch+/+NRasfl/+ | 2 × 1.5 mg Tam i.p. at P12 and P14 | 28 | 200 days (166–211) | - | - | - | adipositas (1), opacity of eye lens (1) |
| Ptch+/-NRas+/+ | 2 × 1.5 mg Tam i.p. at P12 and P14 | 16 | 201 (40–211) | 8 (50%) | 8 (50%) | 4 (25%) | 3cysts (5), microsomia (1) |
| Ptch+/-NRasfl/+ | 2 × 1.5 mg Tam i.p. at P12 and P14 | 27 | 199 (58–211) | 22 (81%) | 18 (67%) | 12 (44%) | 3cysts (9), abdominal varicosis (1), opacity of eye lens (1) |
Publisher’s Note: MDPI stays neutral with regard to jurisdictional claims in published maps and institutional affiliations. |
© 2021 by the authors. Licensee MDPI, Basel, Switzerland. This article is an open access article distributed under the terms and conditions of the Creative Commons Attribution (CC BY) license (https://creativecommons.org/licenses/by/4.0/).
Share and Cite
Ragab, N.; Bauer, J.; Botermann, D.S.; Uhmann, A.; Hahn, H. Oncogenic NRAS Accelerates Rhabdomyosarcoma Formation When Occurring within a Specific Time Frame during Tumor Development in Mice. Int. J. Mol. Sci. 2021, 22, 13377. https://doi.org/10.3390/ijms222413377
Ragab N, Bauer J, Botermann DS, Uhmann A, Hahn H. Oncogenic NRAS Accelerates Rhabdomyosarcoma Formation When Occurring within a Specific Time Frame during Tumor Development in Mice. International Journal of Molecular Sciences. 2021; 22(24):13377. https://doi.org/10.3390/ijms222413377
Chicago/Turabian StyleRagab, Nada, Julia Bauer, Dominik S. Botermann, Anja Uhmann, and Heidi Hahn. 2021. "Oncogenic NRAS Accelerates Rhabdomyosarcoma Formation When Occurring within a Specific Time Frame during Tumor Development in Mice" International Journal of Molecular Sciences 22, no. 24: 13377. https://doi.org/10.3390/ijms222413377
APA StyleRagab, N., Bauer, J., Botermann, D. S., Uhmann, A., & Hahn, H. (2021). Oncogenic NRAS Accelerates Rhabdomyosarcoma Formation When Occurring within a Specific Time Frame during Tumor Development in Mice. International Journal of Molecular Sciences, 22(24), 13377. https://doi.org/10.3390/ijms222413377