
Modeling Transposition of the Great Arteries with Patient-Specific Induced Pluripotent Stem Cells

 , , , and
Abstract
: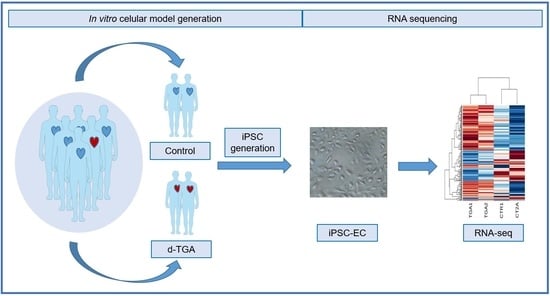
1. Introduction
2. Results
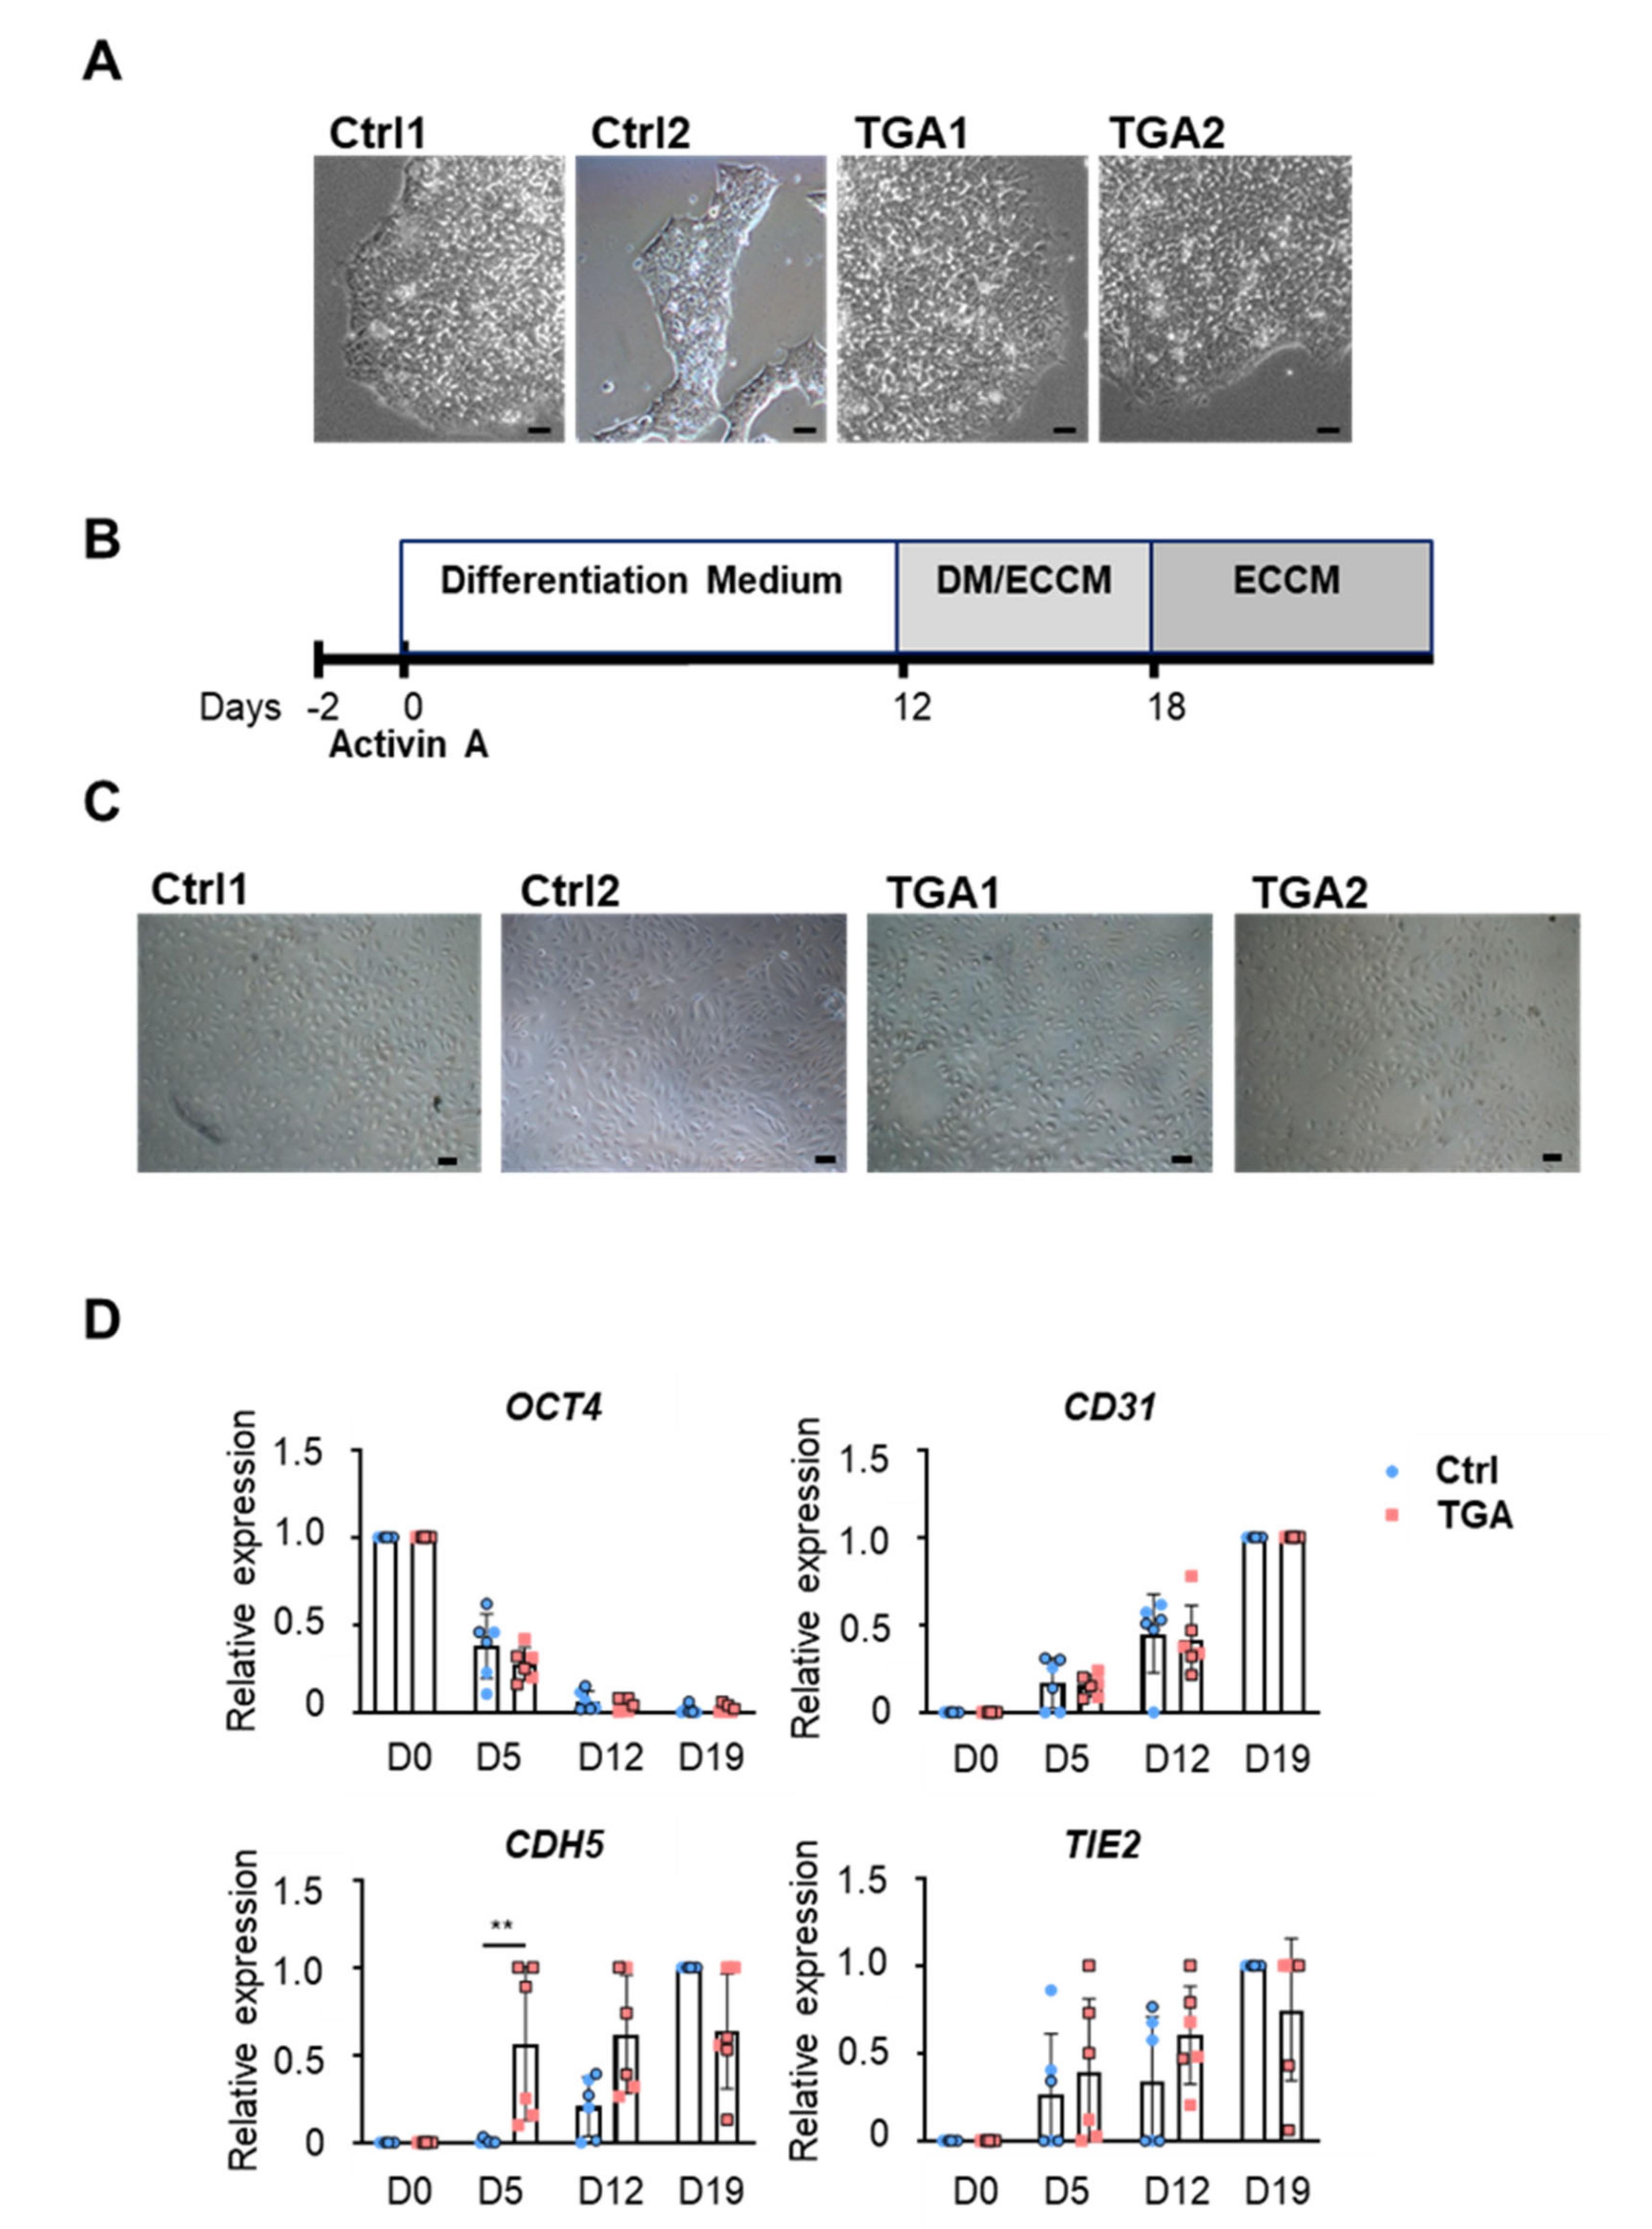
2.1. Generation of Endothelial Cells from Differentiated iPSCs
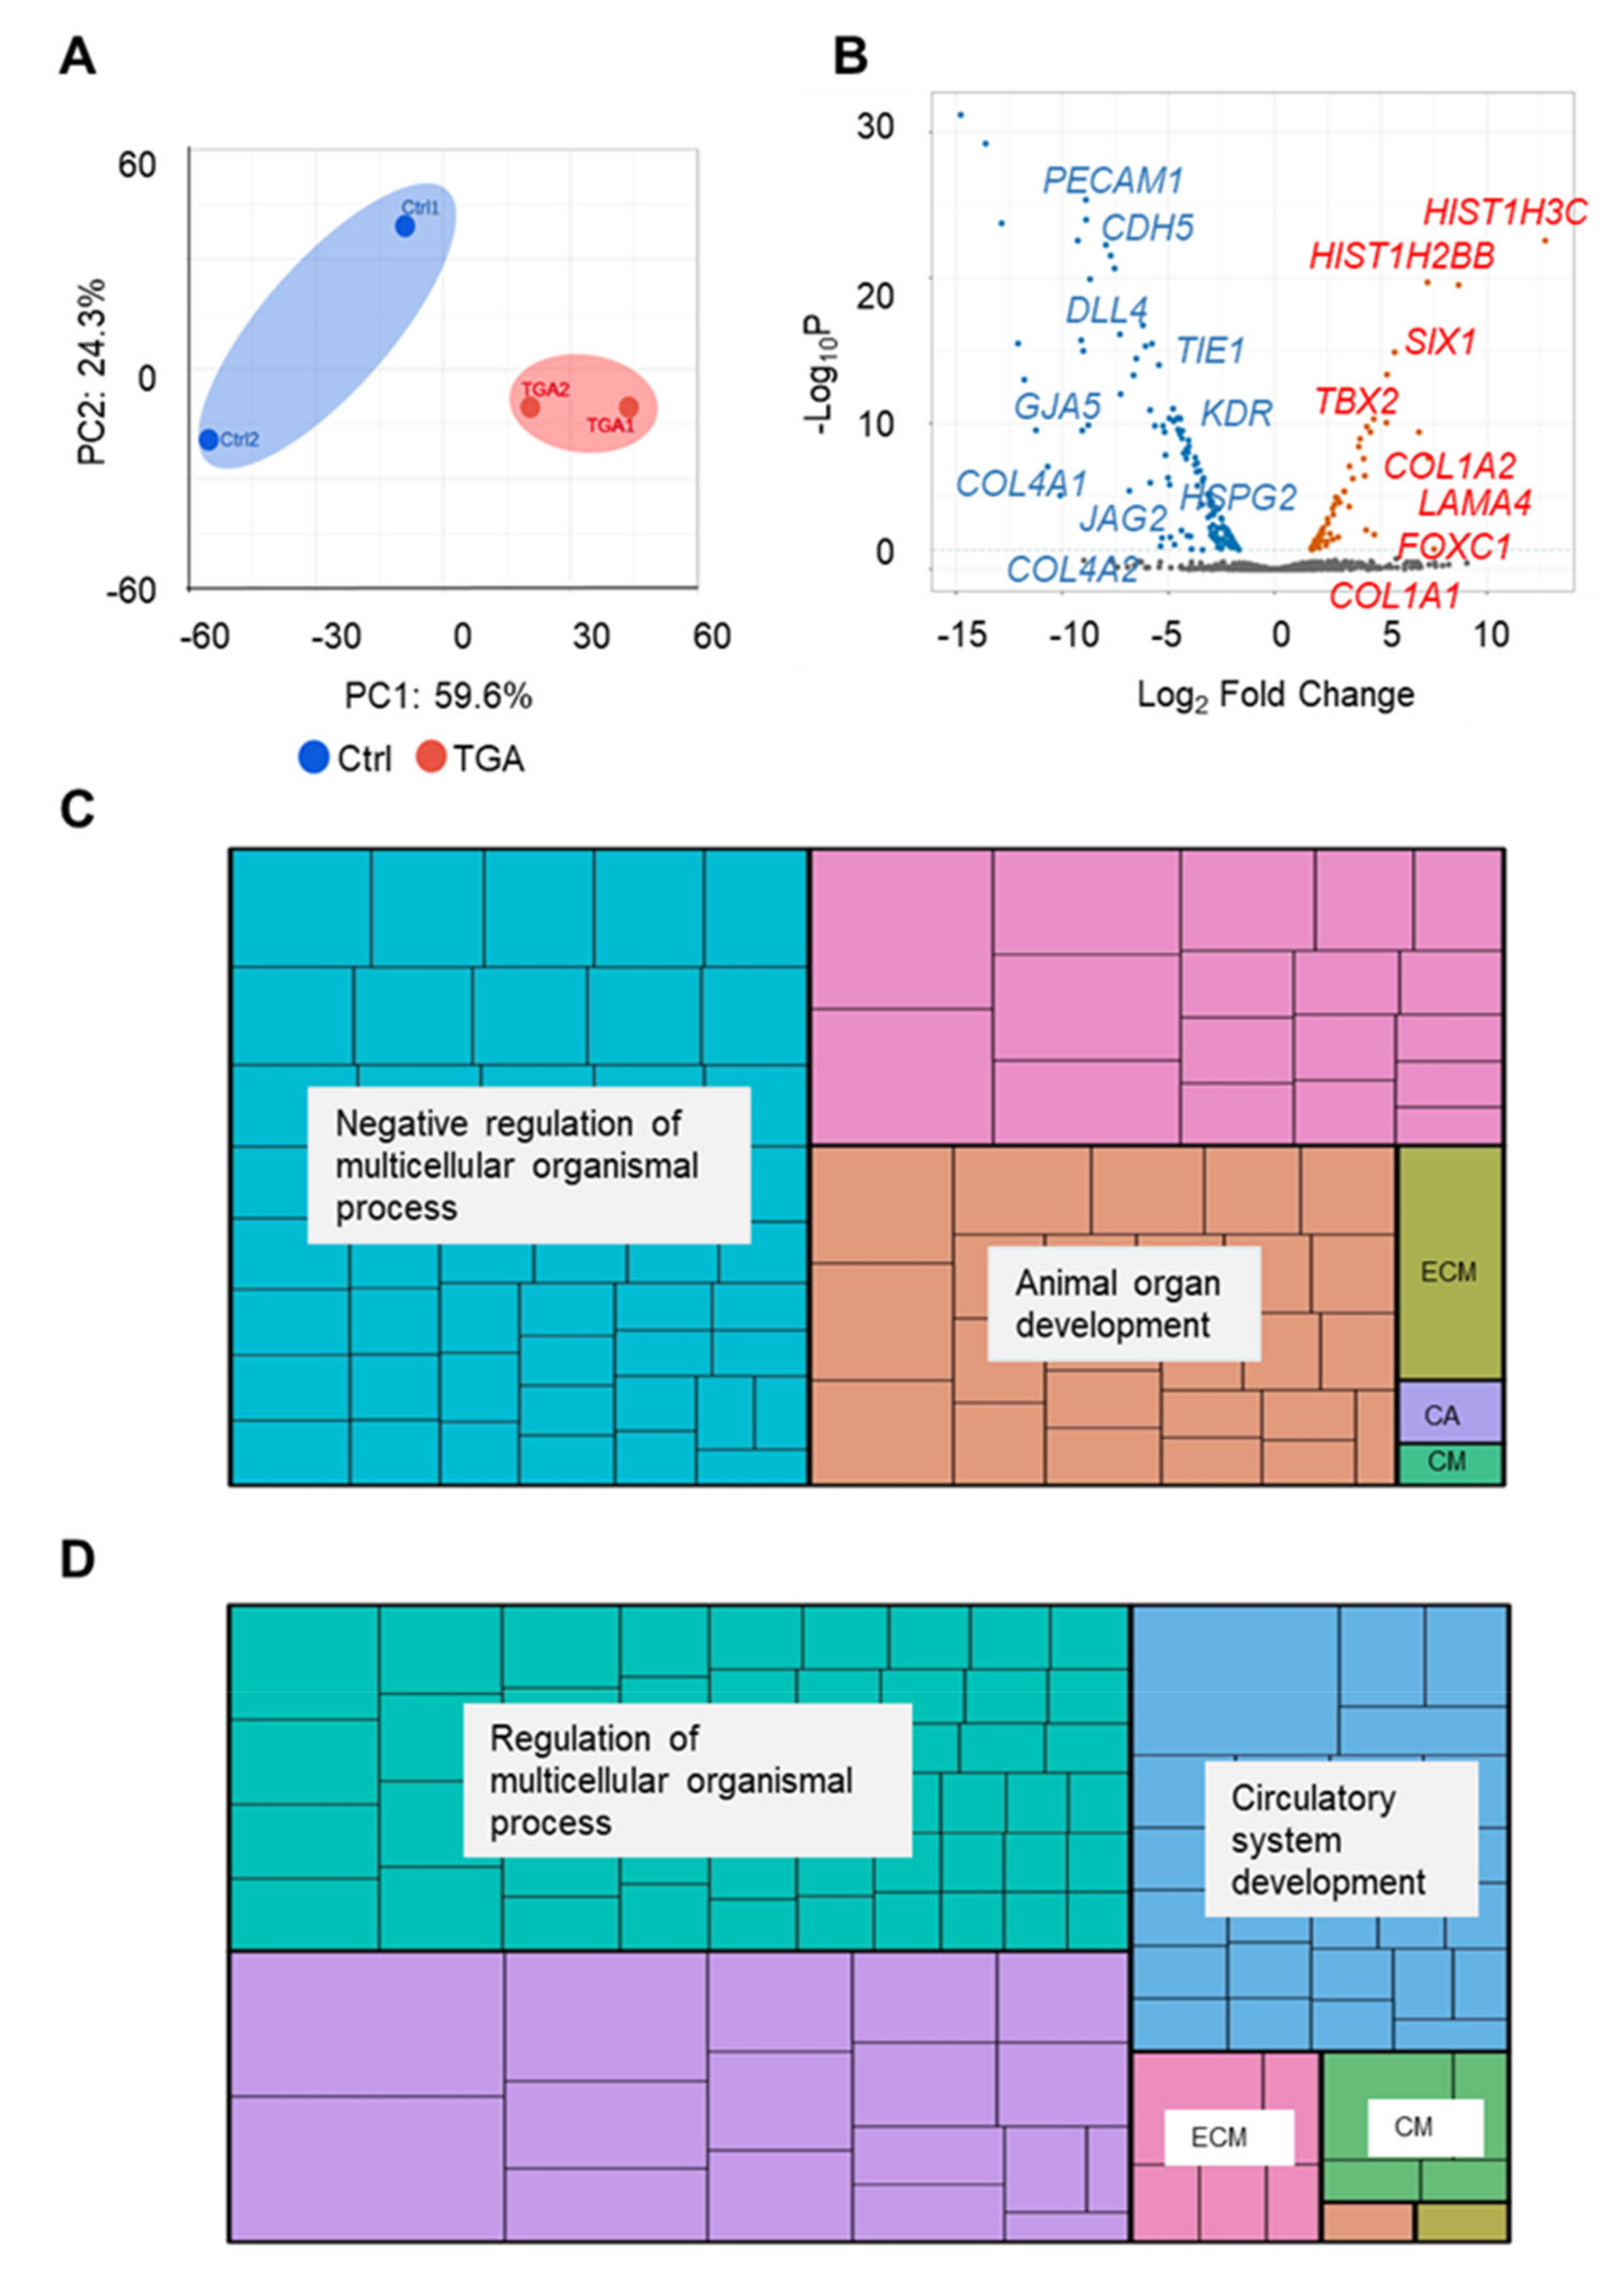
2.2. RNA-Seq Analysis of Endothelial Cells from Differentiated Control and d-TGA iPSC Lines
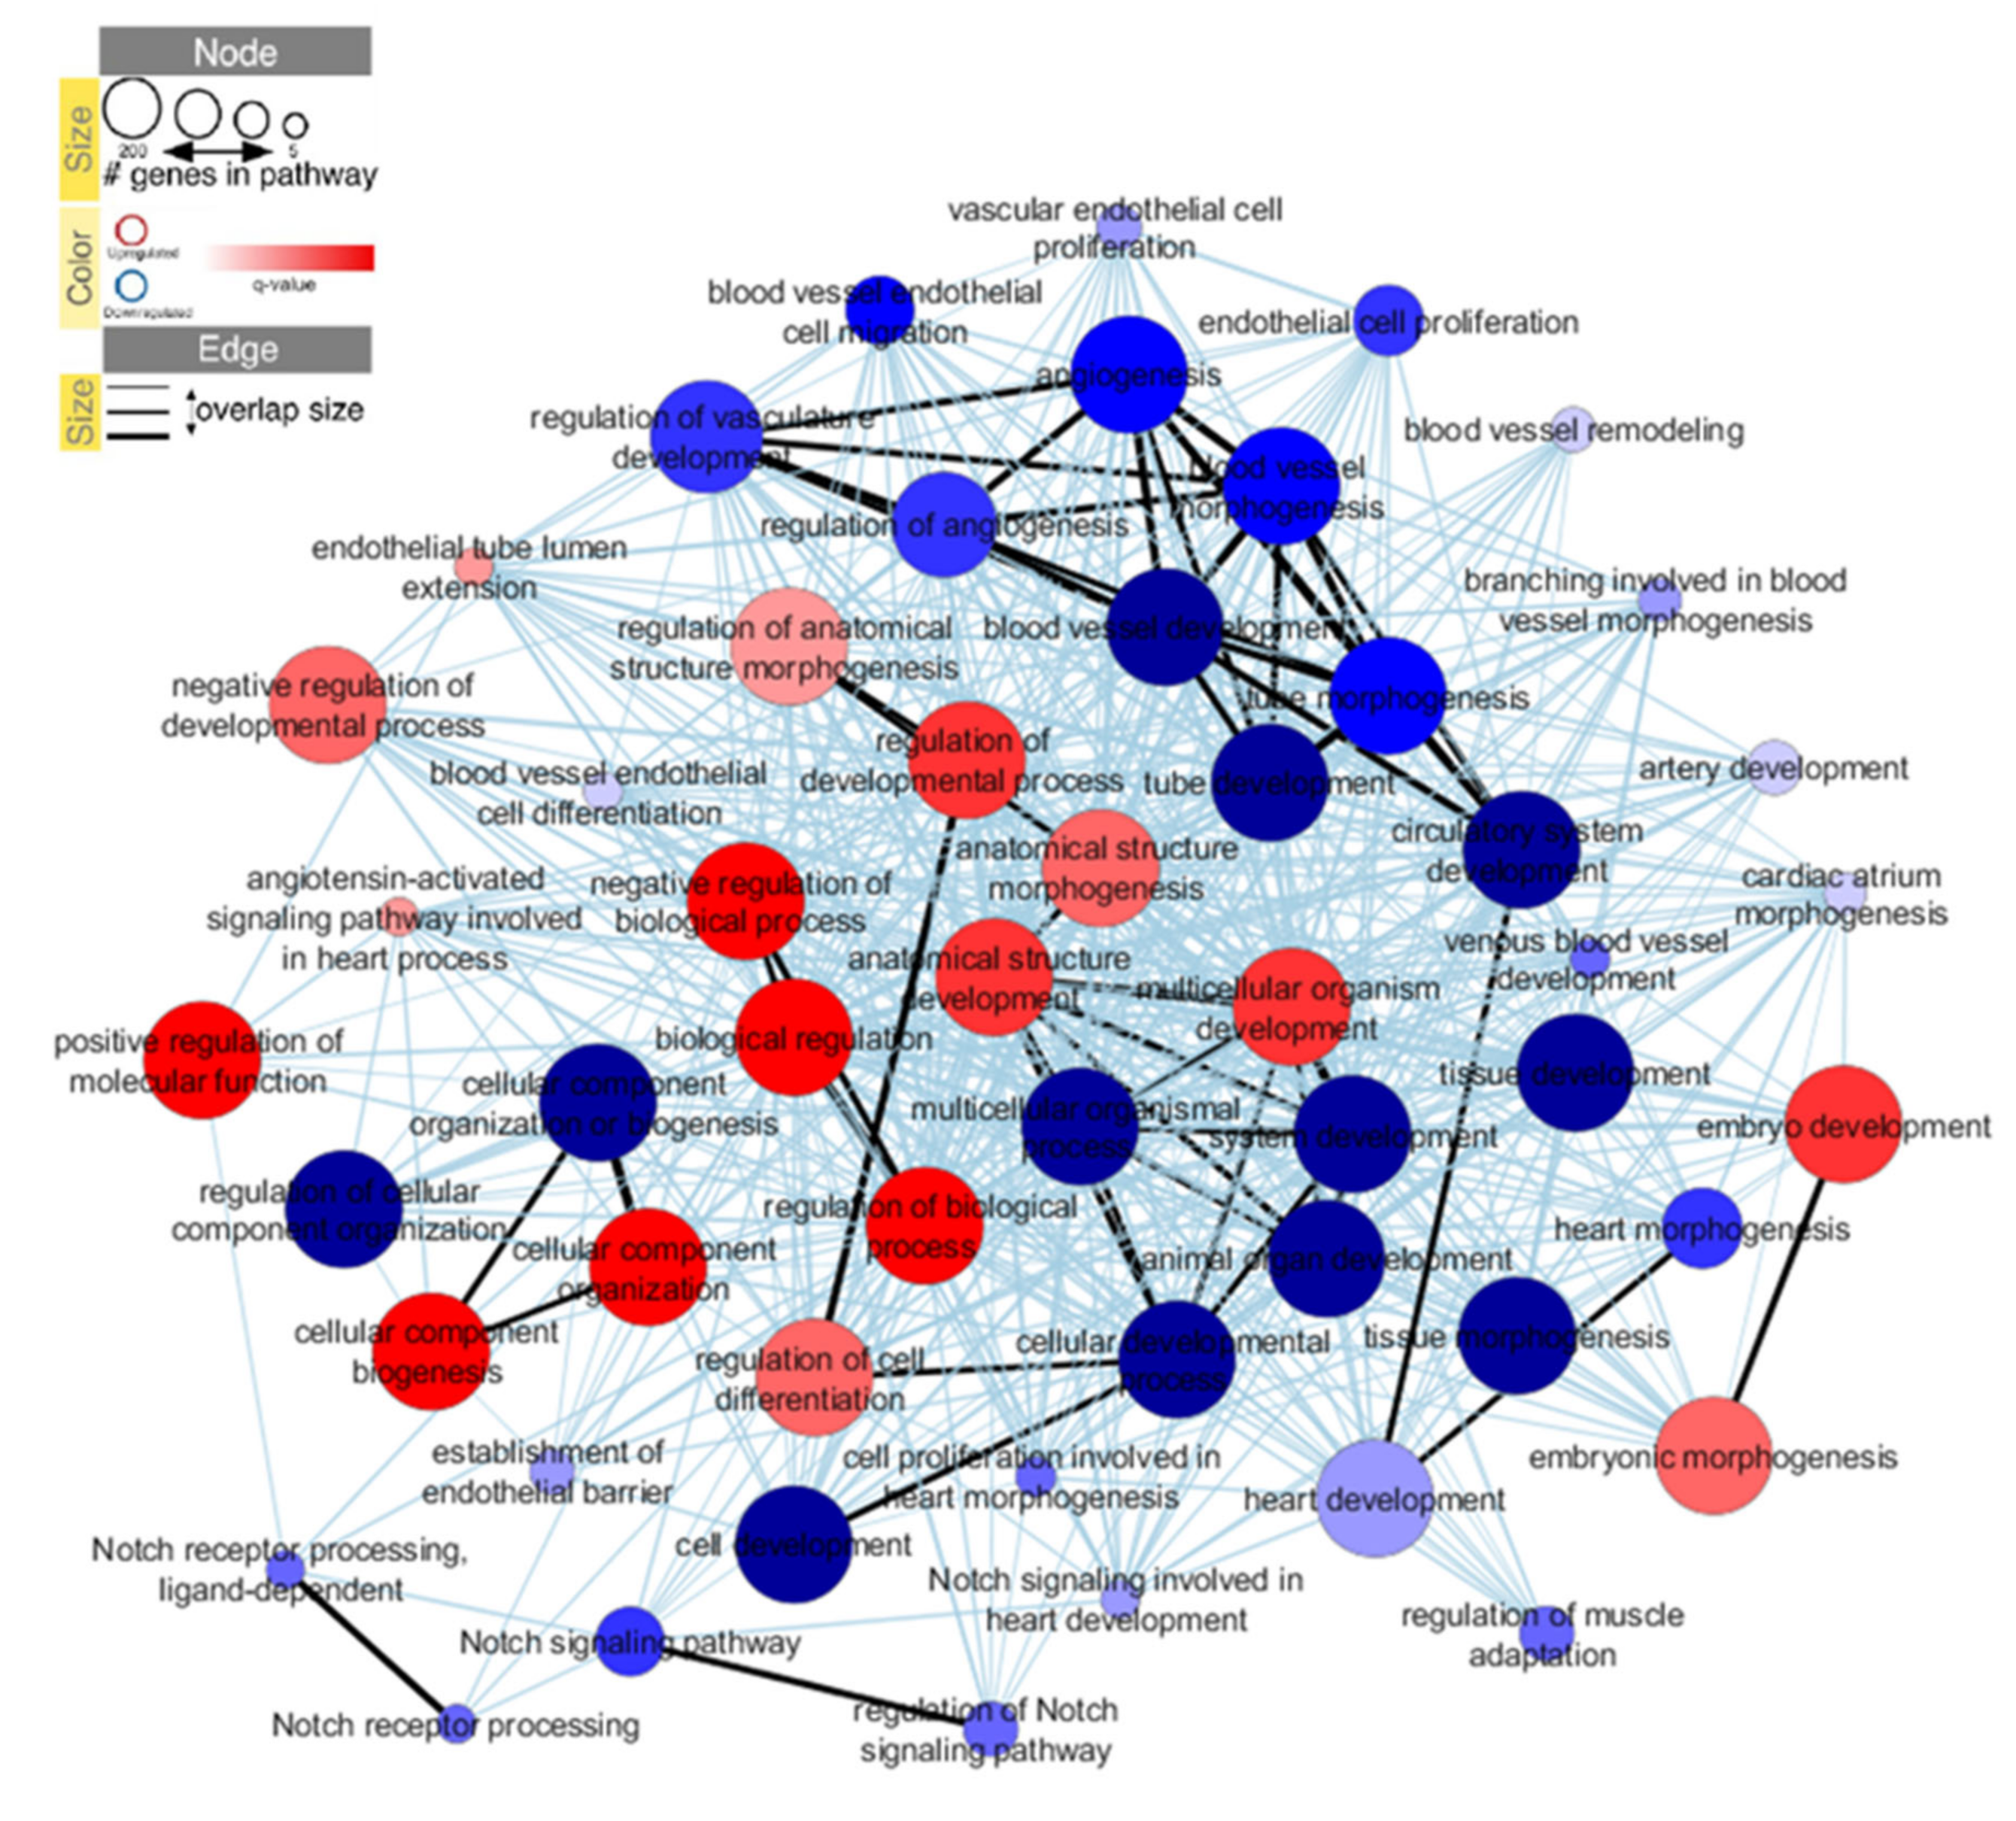
2.3. iPSC-ECs from Patients with d-TGA Show Alterations in Signaling Pathways
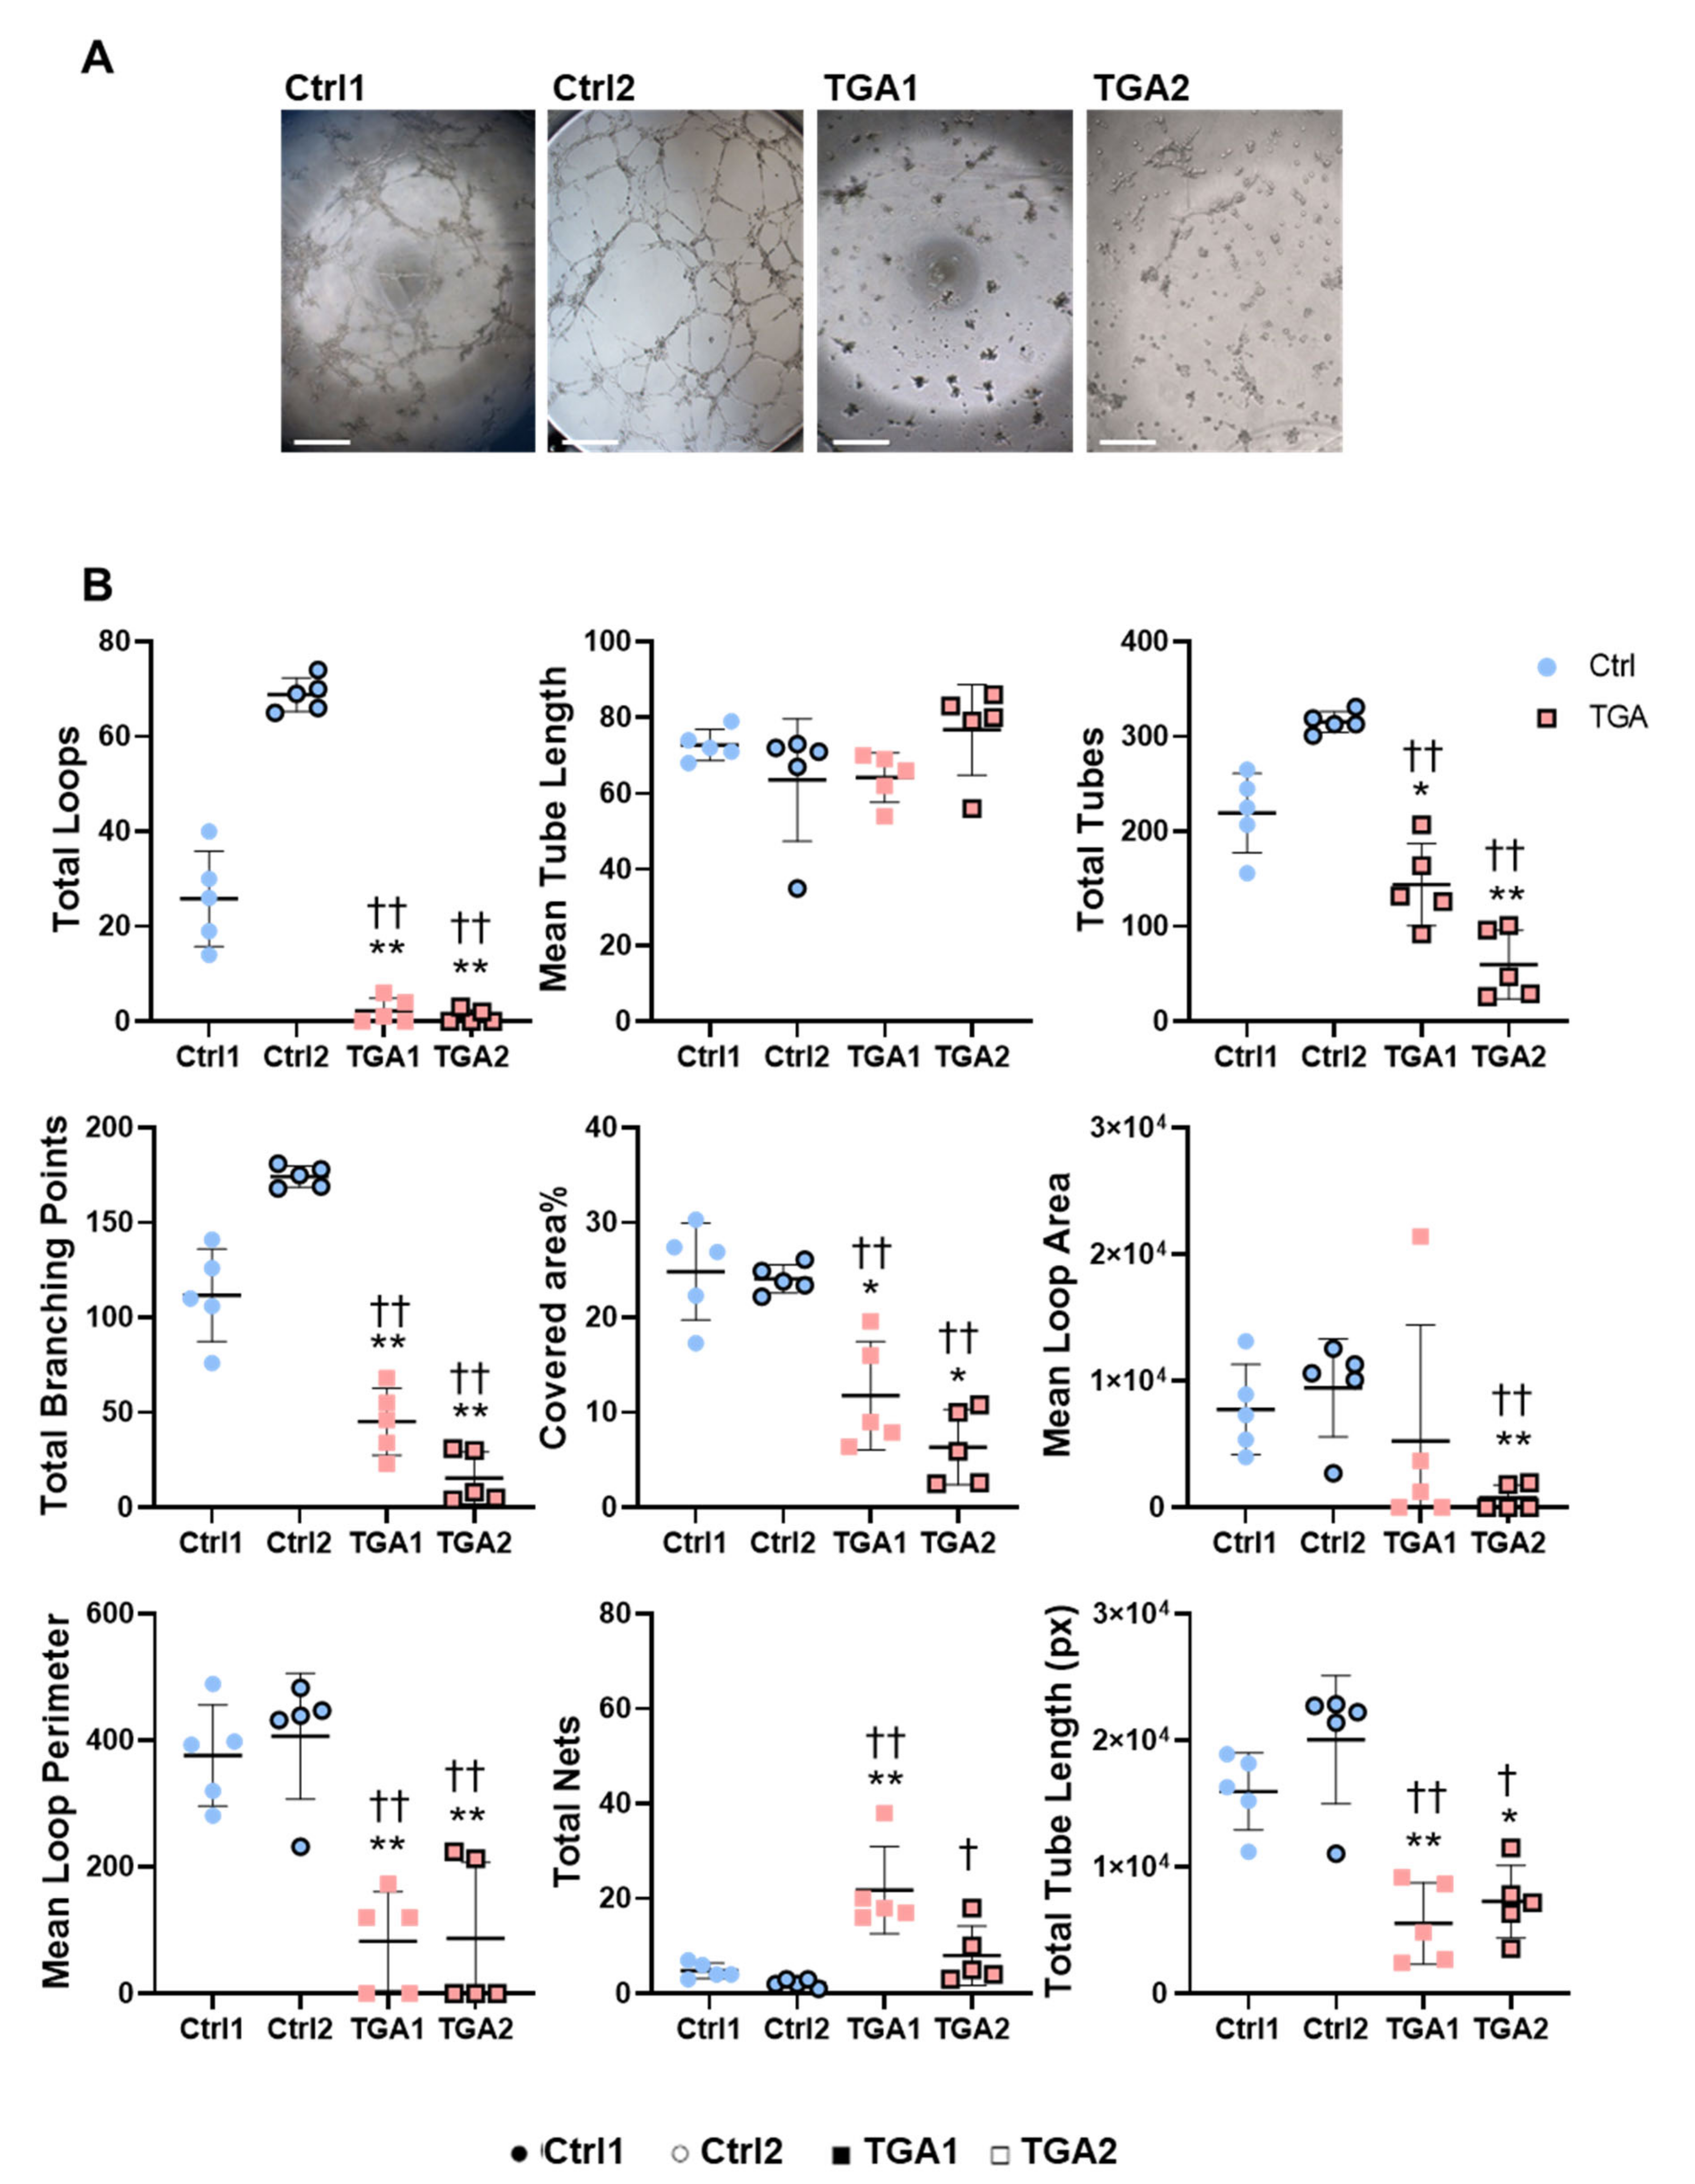
2.4. Capillary-like Tube Formation Processes Are Altered in iPSC-ECs from Patients with d-TGA
3. Discussion
4. Materials and Methods
4.1. Human-Induced Pluripotent Cell Generation
4.2. Cell Culture
4.3. Endothelial Differentiation
4.4. Fluorescence-Activated Cell Sorting
4.5. Tube Formation Assay
4.6. RNA Extraction and Quantitative Real-Time PCR
4.7. RNA-Seq
4.8. Interactome Analysis
4.9. Statistical Analysis
Supplementary Materials
Author Contributions
Funding
Institutional Review Board Statement
Informed Consent Statement
Data Availability Statement
Acknowledgments
Conflicts of Interest
References
- Van Der Linde, D.; Konings, E.E.M.; Slager, M.A.; Witsenburg, M.; Helbing, W.A.; Takkenberg, J.J.M.; Roos-Hesselink, J.W. Birth prevalence of congenital heart disease worldwide: A systematic review and meta-analysis. J. Am. Coll. Cardiol. 2011, 58, 2241–2247. [Google Scholar] [CrossRef] [PubMed] [Green Version]
- Kodo, K.; Nishizawa, T.; Furutani, M.; Arai, S.; Yamamura, E.; Joo, K.; Takahashi, T.; Matsuoka, R.; Yamagishi, H. GATA6 mutations cause human cardiac outflow tract defects by disrupting semaphorin-plexin signaling. Proc. Natl. Acad. Sci. USA 2009, 106, 13933–13938. [Google Scholar] [CrossRef] [PubMed] [Green Version]
- Unolt, M.; Putotto, C.; Silvestri, L.M.; Marino, D.; Scarabotti, A.; Massaccesi, V.; Caiaro, A.; Versacci, P.; Marino, B. Transposition of great arteries: New insights into the pathogenesis. Front. Pediatr. 2013, 1, 11. [Google Scholar] [CrossRef] [PubMed] [Green Version]
- Gutgesell, H.P.; Garson, A.; McNamara, D.G. Prognosis for the newborn with transposition of the great arteries. Am. J. Cardiol. 1979, 44, 96–100. [Google Scholar] [CrossRef]
- Brickner, M.E.; Hillis, L.D.; Lange, R.A. Congenital heart disease in adults (Second of two parts). N. Engl. J. Med. 2000, 342, 334–342. [Google Scholar] [CrossRef]
- Mégarbané, A.; Salem, N.; Stephan, E.; Ashoush, R.; Lenoir, D.; Delague, V.; Kassab, R.; Loiselet, J.; Bouvagnet, P. X-linked transposition of the great arteries and incomplete penetrance among males with a nonsense mutation in ZIC3. Eur. J. Hum. Genet. 2000, 8, 704–708. [Google Scholar] [CrossRef] [PubMed]
- Sakabe, M.; Kokubo, H.; Nakajima, Y.; Saga, Y. Ectopic retinoic acid signaling affects outflow tract cushion development through suppression of the myocardial Tbx2-Tgf 2 pathway. Development 2012, 139, 385–395. [Google Scholar] [CrossRef] [PubMed] [Green Version]
- Harrelson, Z.; Kelly, R.G.; Goldin, S.N.; Gibson-Brown, J.J.; Bollag, R.J.; Silver, L.M.; Papaioannou, V.E. Tbx2 is essential for patterning the atrioventricular canal and for morphogenensis of the outflow tract during heart development. Development 2004, 131, 5041–5052. [Google Scholar] [CrossRef] [Green Version]
- Bruneau, B.G. The developmental genetics of congenital heart disease. Nature 2008, 451, 943–948. [Google Scholar] [CrossRef]
- Walma, D.A.C.; Yamada, K.M. The extracellular matrix in development. Development 2020, 147, dev175596. [Google Scholar] [CrossRef] [PubMed]
- Costell, M.; Carmona, R.; Gustafsson, E.; González-Iriarte, M.; Fässler, R.; Muñoz-Chápuli, R. Hyperplastic Conotruncal Endocardial Cushions and Transposition of Great Arteries in Perlecan-Null Mice. Circ. Res. 2002, 91, 158–164. [Google Scholar] [CrossRef] [PubMed] [Green Version]
- Yasui, H.; Nakazawa, M.; Morishima, M.; Miyagawa-Tomita, S.; Momma, K. Morphological observations on the pathogenetic process of transposition of the great arteries induced by retinoic acid in mice. Circulation 1995, 91, 2478–2486. [Google Scholar] [CrossRef] [PubMed]
- Takahashi, K.; Tanabe, K.; Ohnuki, M.; Narita, M.; Ichisaka, T.; Tomoda, K.; Yamanaka, S. Induction of Pluripotent Stem Cells from Adult Human Fibroblasts by Defined Factors. Cell 2007, 131, 861–872. [Google Scholar] [CrossRef] [PubMed] [Green Version]
- Choi, K.-D.; Yu, J.; Smuga-Otto, K.; Salvagiotto, G.; Rehrauer, W.; Vodyanik, M.; Thomson, J.; Slukvin, I. Hematopoietic and Endothelial Differentiation of Human Induced Pluripotent Stem Cells. Stem Cells 2009, 27, 559–567. [Google Scholar] [CrossRef]
- Prasain, N.; Lee, M.R.; Vemula, S.; Meador, J.L.; Yoshimoto, M.; Ferkowicz, M.J.; Fett, A.; Gupta, M.; Rapp, B.M.; Saadatzadeh, M.R.; et al. Differentiation of human pluripotent stem cells to cells similar to cord-blood endothelial colony–forming cells. Nat. Biotechnol. 2014, 32, 1151–1157. [Google Scholar] [CrossRef] [PubMed]
- James, D.; Nam, H.S.; Seandel, M.; Nolan, D.; Janovitz, T.; Tomishima, M.; Studer, L.; Lee, G.; Lyden, D.; Benezra, R.; et al. Expansion and maintenance of human embryonic stem cell-derived endothelial cells by TGFΒ inhibition is Id1 dependent. Nat. Biotechnol. 2010, 28, 161–166. [Google Scholar] [CrossRef] [PubMed]
- Musunuru, K. Genome editing of human pluripotent stem cells to generate human cellular disease models. DMM Dis. Model. Mech. 2013, 6, 896–904. [Google Scholar] [CrossRef] [PubMed] [Green Version]
- Carcamo-Orive, I.; Hoffman, G.E.; Cundiff, P.; Beckmann, N.D.; D’Souza, S.L.; Knowles, J.W.; Patel, A.; Papatsenko, D.; Abbasi, F.; Reaven, G.M.; et al. Analysis of Transcriptional Variability in a Large Human iPSC Library Reveals Genetic and Non-genetic Determinants of Heterogeneity. Cell Stem Cell 2017, 20, 518–532. [Google Scholar] [CrossRef] [Green Version]
- Li, B.; Xu, L.; Hong, N.; Chen, S.; Xu, R. In Silico Analyses Reveal the Relationship Between SIX1/EYA1 Mutations and Conotruncal Heart Defects. Pediatr. Cardiol. 2018, 39, 176–182. [Google Scholar] [CrossRef] [PubMed]
- Garlanda, C.; Dejana, E. Heterogeneity of endothelial cells: Specific markers. Arterioscler. Thromb. Vasc. Biol. 1997, 17, 1193–1202. [Google Scholar] [CrossRef] [PubMed]
- Ontoria-Oviedo, I.; Palacios, I.; Panadero, J.; Sánchez, B.; García-García, F.; López-Cerdán, A.; Dorronsoro, A.; Castellano, D.; Rodríguez-Borlado, L.; Bernad, A.; et al. Plasmatic Membrane Expression of Adhesion Molecules in Human Cardiac Progenitor/Stem Cells Might Explain Their Superior Cell Engraftment after Cell Transplantation. Stem Cells Int. 2020, 2020, 8872009. [Google Scholar] [CrossRef] [PubMed]
- Liu, Y.; Chen, S.; Zühlke, L.; Black, G.C.; Choy, M.K.; Li, N.; Keavney, B.D. Global birth prevalence of congenital heart defects 1970–2017: Updated systematic review and meta-analysis of 260 studies. Int. J. Epidemiol. 2019, 48, 455–463. [Google Scholar] [CrossRef] [PubMed]
- Kitani, T.; Tian, L.; Zhang, T.; Itzhaki, I.; Zhang, J.Z.; Ma, N.; Liu, C.; Rhee, J.W.; Romfh, A.W.; Lui, G.K.; et al. RNA sequencing analysis of induced pluripotent stem cell-derived cardiomyocytes from congenital heart disease patients. Circ. Res. 2020, 126, 923–925. [Google Scholar] [CrossRef]
- Christoffels, V.M.; Hoogaars, W.M.H.; Tessari, A.; Clout, D.E.W.; Moorman, A.F.M.; Campione, M. T-Box Transcription Factor Tbx2 Represses Differentiation and Formation of the Cardiac Chambers. Dev. Dyn. 2004, 229, 763–770. [Google Scholar] [CrossRef] [PubMed]
- Ribeiro, I.; Kawakami, Y.; Büscher, D.; Raya, Á.; Rodriguez-León, J.; Morita, M.; Rodríguez Esteban, C.; Izpisúa Belmonte, J.C. Tbx2 and Tbx3 regulate the dynamics of cell proliferation during heart remodeling. PLoS ONE 2007, 2, e398. [Google Scholar] [CrossRef] [PubMed] [Green Version]
- Koo, H.Y.; Kume, T. FoxC1-Dependent Regulation of Vascular Endothelial Growth Factor Signaling in Corneal Avascularity. Trends Cardiovasc. Med. 2013, 23, 1–4. [Google Scholar] [CrossRef] [PubMed] [Green Version]
- Kidholm, C.L.; Beck, H.C.; Madsen, J.B.; Palstrøm, N.B.; Lindholt, J.S.; Rasmussen, L.M. Preliminary analysis of proteome alterations in non-aneurysmal, internal mammary artery tissue from patients with abdominal aortic aneurysms. PLoS ONE 2018, 13, e0192957. [Google Scholar] [CrossRef] [PubMed] [Green Version]
- Hirashiki, A.; Yamada, Y.; Murase, Y.; Suzuki, Y.; Kataoka, H.; Morimoto, Y.; Tajika, T.; Murohara, T.; Yokota, M. Association of Gene Polymorphisms with Coronary Artery Disease in Low- or High-Risk Subjects Defined by Conventional Risk Factors. J. Am. Coll. Cardiol. 2003, 42, 1429–1437. [Google Scholar] [CrossRef] [Green Version]
- Pietras, A.; Von Stedingk, K.; Lindgren, D.; Påhlman, S.; Axelson, H. JAG2 induction in hypoxic tumor cells alters notch signaling and enhances endothelial cell tube formation. Mol. Cancer Res. 2011, 9, 626–636. [Google Scholar] [CrossRef] [PubMed] [Green Version]
- Pedrosa, A.R.; Trindade, A.; Fernandes, A.C.; Carvalho, C.; Gigante, J.; Tavares, A.T.; Diéguez-Hurtado, R.; Yagita, H.; Adams, R.H.; Duarte, A. Endothelial jagged1 antagonizes Dll4 regulation of endothelial branching and promotes vascular maturation downstream of Dll4/Notch1. Arterioscler. Thromb. Vasc. Biol. 2015, 35, 1134–1146. [Google Scholar] [CrossRef] [Green Version]
- Benedito, R.; Roca, C.; Sörensen, I.; Adams, S.; Gossler, A.; Fruttiger, M.; Adams, R.H. The Notch Ligands Dll4 and Jagged1 Have Opposing Effects on Angiogenesis. Cell 2009, 137, 1124–1135. [Google Scholar] [CrossRef] [PubMed] [Green Version]
- Vittet, D.; Buchou, T.; Schweitzer, A.; Dejana, E.; Huber, P. Targeted null-mutation in the vascular endothelial-cadherin gene impairs the organization of vascular-like structures in embryoid bodies. Proc. Natl. Acad. Sci. USA 1997, 94, 6273–6278. [Google Scholar] [CrossRef] [Green Version]
- Gory-Fauré, S.; Prandini, M.H.; Pointu, H.; Roullot, V.; Pignot-Paintrand, I.; Vernet, M.; Huber, P. Role of vascular endothelial-cadherin in vascular morphogenesis. Development 1999, 126, 2093–2102. [Google Scholar] [CrossRef]
- Drake, C.J. Embryonic and adult vasculogenesis. Birth Defects Res. Part C Embryo Today Rev. 2003, 69, 73–82. [Google Scholar] [CrossRef] [PubMed]
- Yu, J.; Vodyanik, M.A.; Smuga-Otto, K.; Antosiewicz-Bourget, J.; Frane, J.L.; Tian, S.; Nie, J.; Jonsdottir, G.A.; Ruotti, V.; Stewart, R.; et al. Induced pluripotent stem cell lines derived from human somatic cells. Science 2007, 318, 1917–1920. [Google Scholar] [CrossRef]
- Churko, J.M.; Burridge, P.W.; Wu, J.C. Generation of human iPSCs from human peripheral blood mononuclear cells using non-integrative sendai virus in chemically defined conditions. Methods Mol. Biol. 2013, 1036, 81–88. [Google Scholar] [CrossRef] [PubMed]
- Berecz, T.; Husvéth-Tóth, M.; Mioulane, M.; Merkely, B.; Apáti, Á.; Földes, G. Generation and Analysis of Pluripotent Stem Cell-Derived Cardiomyocytes and Endothelial Cells for High Content Screening Purposes. In Methods in Molecular Biology; Humana: New York, NY, USA, 2020; Volume 2150. [Google Scholar]
- Ontoria-Oviedo, I.; Dorronsoro, A.; Sánchez, R.; Ciria, M.; Gómez-Ferrer, M.; Buigues, M.; Grueso, E.; Tejedor, S.; García-García, F.; González-King, H.; et al. Extracellular Vesicles Secreted by Hypoxic AC10 Cardiomyocytes Modulate Fibroblast Cell Motility. Front. Cardiovasc. Med. 2018, 5, 152. [Google Scholar] [CrossRef] [PubMed] [Green Version]
- Robinson, M.D.; McCarthy, D.J.; Smyth, G.K. edgeR: A Bioconductor package for differential expression analysis of digital gene expression data. Bioinformatics 2010, 26, 139–140. [Google Scholar] [CrossRef] [PubMed] [Green Version]
- Reimand, J.; Isserlin, R.; Voisin, V.; Kucera, M.; Tannus-Lopes, C.; Rostamianfar, A.; Wadi, L.; Meyer, M.; Wong, J.; Xu, C.; et al. Pathway enrichment analysis and visualization of omics data using g:Profiler, GSEA, Cytoscape and EnrichmentMap. Nat. Protoc. 2019, 14, 482–517. [Google Scholar] [CrossRef] [PubMed]
- Raudvere, U.; Kolberg, L.; Kuzmin, I.; Arak, T.; Adler, P.; Peterson, H.; Vilo, J. G:Profiler: A web server for functional enrichment analysis and conversions of gene lists (2019 update). Nucleic Acids Res. 2019, 47, W191–W198. [Google Scholar] [CrossRef] [PubMed] [Green Version]


| GO_ID | Term | p-Value |
|---|---|---|
| GO:0009887 | Animal organ morphogenesis | 1.59 × 10⁻¹² |
| GO:0048513 | Animal organ development | 1.84 × 10⁻¹⁰ |
| GO:0043062 | Extracellular structure organization | 5.34 × 10⁻⁹ |
| GO:0048856 | Anatomical structure development | 1.95 × 10⁻⁶ |
| GO:0051093 | Negative regulation of developmental process | 3.13 × 10⁻⁶ |
| GO:0009790 | Embryonic development | 9.05 × 10⁻⁵ |
| GO:0045995 | Regulation of embryonic development | 1.10 × 10⁻³ |
| GO:0072359 | Circulatory system development | 4.52 × 10⁻³ |
| GO:0009792 | Embryonic development ending in birth or egg hatching | 6.98 × 10⁻³ |
| GO:0060560 | Developmental growth involved in morphogenesis | 2.60 × 10⁻² |
| GO:0048568 | Embryonic organ development | 2.60 × 10⁻² |
| GO:0035148 | Tube formation | 3.10 × 10⁻² |
| GO:0048562 | Embryonic organ morphogenesis | 4.81 × 10⁻² |
| GO_ID | Term | p-Value |
|---|---|---|
| GO:0072359 | Circulatory system development | 5.44 × 10⁻¹⁵ |
| GO:0007275 | Multicellular organism development | 3.94 × 10⁻¹² |
| GO:0001568 | Blood vessel development | 6.28 × 10⁻¹² |
| GO:0048646 | Anatomical structure formation involved in morphogenesis | 7.67 × 10⁻¹² |
| GO:0048514 | Blood vessel morphogenesis | 7.67 × 10⁻¹² |
| GO:0072358 | Cardiovascular system development | 7.67 × 10⁻¹² |
| GO:0048856 | Anatomical structure development | 2.86 × 10⁻¹⁰ |
| GO:0035239 | Tube morphogenesis | 3.65 × 10⁻¹⁰ |
| GO:0032502 | Developmental process | 4.03 × 10⁻¹⁰ |
| GO:0035295 | Tube development | 1.07 × 10⁻⁹ |
| GO:2000181 | Negative regulation of blood vessel morphogenesis | 1.09 × 10⁻⁵ |
| GO:0022603 | Regulation of anatomical structure morphogenesis | 1.10 × 10⁻⁵ |
| GO:0007507 | Heart development | 1.42 × 10⁻⁵ |
| GO:0050793 | Regulation of developmental process | 1.37 × 10⁻⁴ |
| GO:0051093 | Negative regulation of developmental process | 1.10 × 10⁻³ |
| GO:0003230 | Cardiac atrium development | 5.46 × 10⁻³ |
| GO:1903587 | Regulation of blood vessel endothelial cell proliferation involved in sprouting angiogenesis | 1.48 × 10⁻² |
| GO_ID | Term | p-Value |
|---|---|---|
| GO:0050789 | Regulation of biological process | 1.39 × 10⁻¹¹ |
| GO:0050793 | Regulation of developmental process | 7.00 × 10⁻⁹ |
| GO:0007275 | Multicellular organism development | 3.40 × 10⁻⁸ |
| GO:0048856 | Anatomical structure development | 8.06 × 10⁻⁸ |
| GO:0048513 | Animal organ development | 3.38 × 10⁻⁷ |
| GO:0009790 | Embryonic development | 8.96 × 10⁻⁷ |
| GO:0009653 | Anatomical structure morphogenesis | 6.32 × 10⁻⁵ |
| GO:0048598 | Embryonic morphogenesis | 4.82 × 10⁻³ |
| GO:0051093 | Negative regulation of developmental process | 1.50 × 10⁻² |
| GO:0086098 | Angiotensin-activated signaling pathway involved in heart process | 3.62 × 10⁻² |
| GO_ID | Term | p-Value |
|---|---|---|
| GO:0051128 | Regulation of cellular component organization | 1.91 × 10⁻³¹ |
| GO:0048869 | Cellular developmental process | 6.91 × 10⁻²³ |
| GO:0048731 | System development | 3.88 × 10⁻²² |
| GO:0009888 | Tissue development | 1.99 × 10⁻¹⁹ |
| GO:0048513 | Animal organ development | 4.43 × 10⁻¹⁵ |
| GO:0032501 | Multicellular organismal process | 3.89 × 10⁻¹³ |
| GO:0048729 | Tissue morphogenesis | 5.28 × 10⁻¹² |
| GO:0072359 | Circulatory system development | 8.95 × 10⁻⁹ |
| GO:0001568 | Blood vessel development | 3.60 × 10⁻⁸ |
| GO:0035295 | Tube development | 9.09 × 10⁻⁸ |
| GO:0048514 | Blood vessel morphogenesis | 9.56 × 10⁻⁸ |
| GO:0001525 | Angiogenesis | 1.35 × 10⁻⁷ |
| GO:0035239 | Tube morphogenesis | 2.12 × 10⁻⁷ |
| GO:0007219 | Notch signaling pathway | 7.34 × 10⁻⁶ |
| GO:0045765 | Regulation of angiogenesis | 9.75 × 10⁻⁶ |
| GO:1901342 | Regulation of vasculature development | 1.80 × 10⁻⁵ |
| GO:0009790 | Embryonic development | 6.51 × 10⁻⁵ |
| GO:0003007 | Heart morphogenesis | 7.34 × 10⁻⁴ |
| GO:0007220 | Notch receptor processing | 2.93 × 10⁻³ |
| GO:0035333 | Notch receptor processing, ligand-dependent | 5.73 × 10⁻³ |
| GO:0060841 | Venous blood vessel development | 5.95 × 10⁻³ |
| GO:0061028 | Notch signaling involved in heart development | 1.06 × 10⁻² |
| GO:0060837 | Blood vessel endothelial cell differentiation | 2.16 × 10⁻² |
| GO:0060840 | Artery development | 2.88 × 10⁻² |
| GO:0001974 | Blood vessel remodeling | 3.36 × 10⁻² |
Publisher’s Note: MDPI stays neutral with regard to jurisdictional claims in published maps and institutional affiliations. |
© 2021 by the authors. Licensee MDPI, Basel, Switzerland. This article is an open access article distributed under the terms and conditions of the Creative Commons Attribution (CC BY) license (https://creativecommons.org/licenses/by/4.0/).
Share and Cite
Ontoria-Oviedo, I.; Földes, G.; Tejedor, S.; Panadero, J.; Kitani, T.; Vázquez, A.; Wu, J.C.; Harding, S.E.; Sepúlveda, P. Modeling Transposition of the Great Arteries with Patient-Specific Induced Pluripotent Stem Cells. Int. J. Mol. Sci. 2021, 22, 13270. https://doi.org/10.3390/ijms222413270
Ontoria-Oviedo I, Földes G, Tejedor S, Panadero J, Kitani T, Vázquez A, Wu JC, Harding SE, Sepúlveda P. Modeling Transposition of the Great Arteries with Patient-Specific Induced Pluripotent Stem Cells. International Journal of Molecular Sciences. 2021; 22(24):13270. https://doi.org/10.3390/ijms222413270
Chicago/Turabian StyleOntoria-Oviedo, Imelda, Gabor Földes, Sandra Tejedor, Joaquín Panadero, Tomoya Kitani, Alejandro Vázquez, Joseph C. Wu, Sian E. Harding, and Pilar Sepúlveda. 2021. "Modeling Transposition of the Great Arteries with Patient-Specific Induced Pluripotent Stem Cells" International Journal of Molecular Sciences 22, no. 24: 13270. https://doi.org/10.3390/ijms222413270
APA StyleOntoria-Oviedo, I., Földes, G., Tejedor, S., Panadero, J., Kitani, T., Vázquez, A., Wu, J. C., Harding, S. E., & Sepúlveda, P. (2021). Modeling Transposition of the Great Arteries with Patient-Specific Induced Pluripotent Stem Cells. International Journal of Molecular Sciences, 22(24), 13270. https://doi.org/10.3390/ijms222413270