
Evaluation of the Central Effects of Systemic Lentiviral-Mediated Leptin Delivery in Streptozotocin-Induced Diabetic Rats


 ,
, 
Abstract
1. Introduction
2. Results
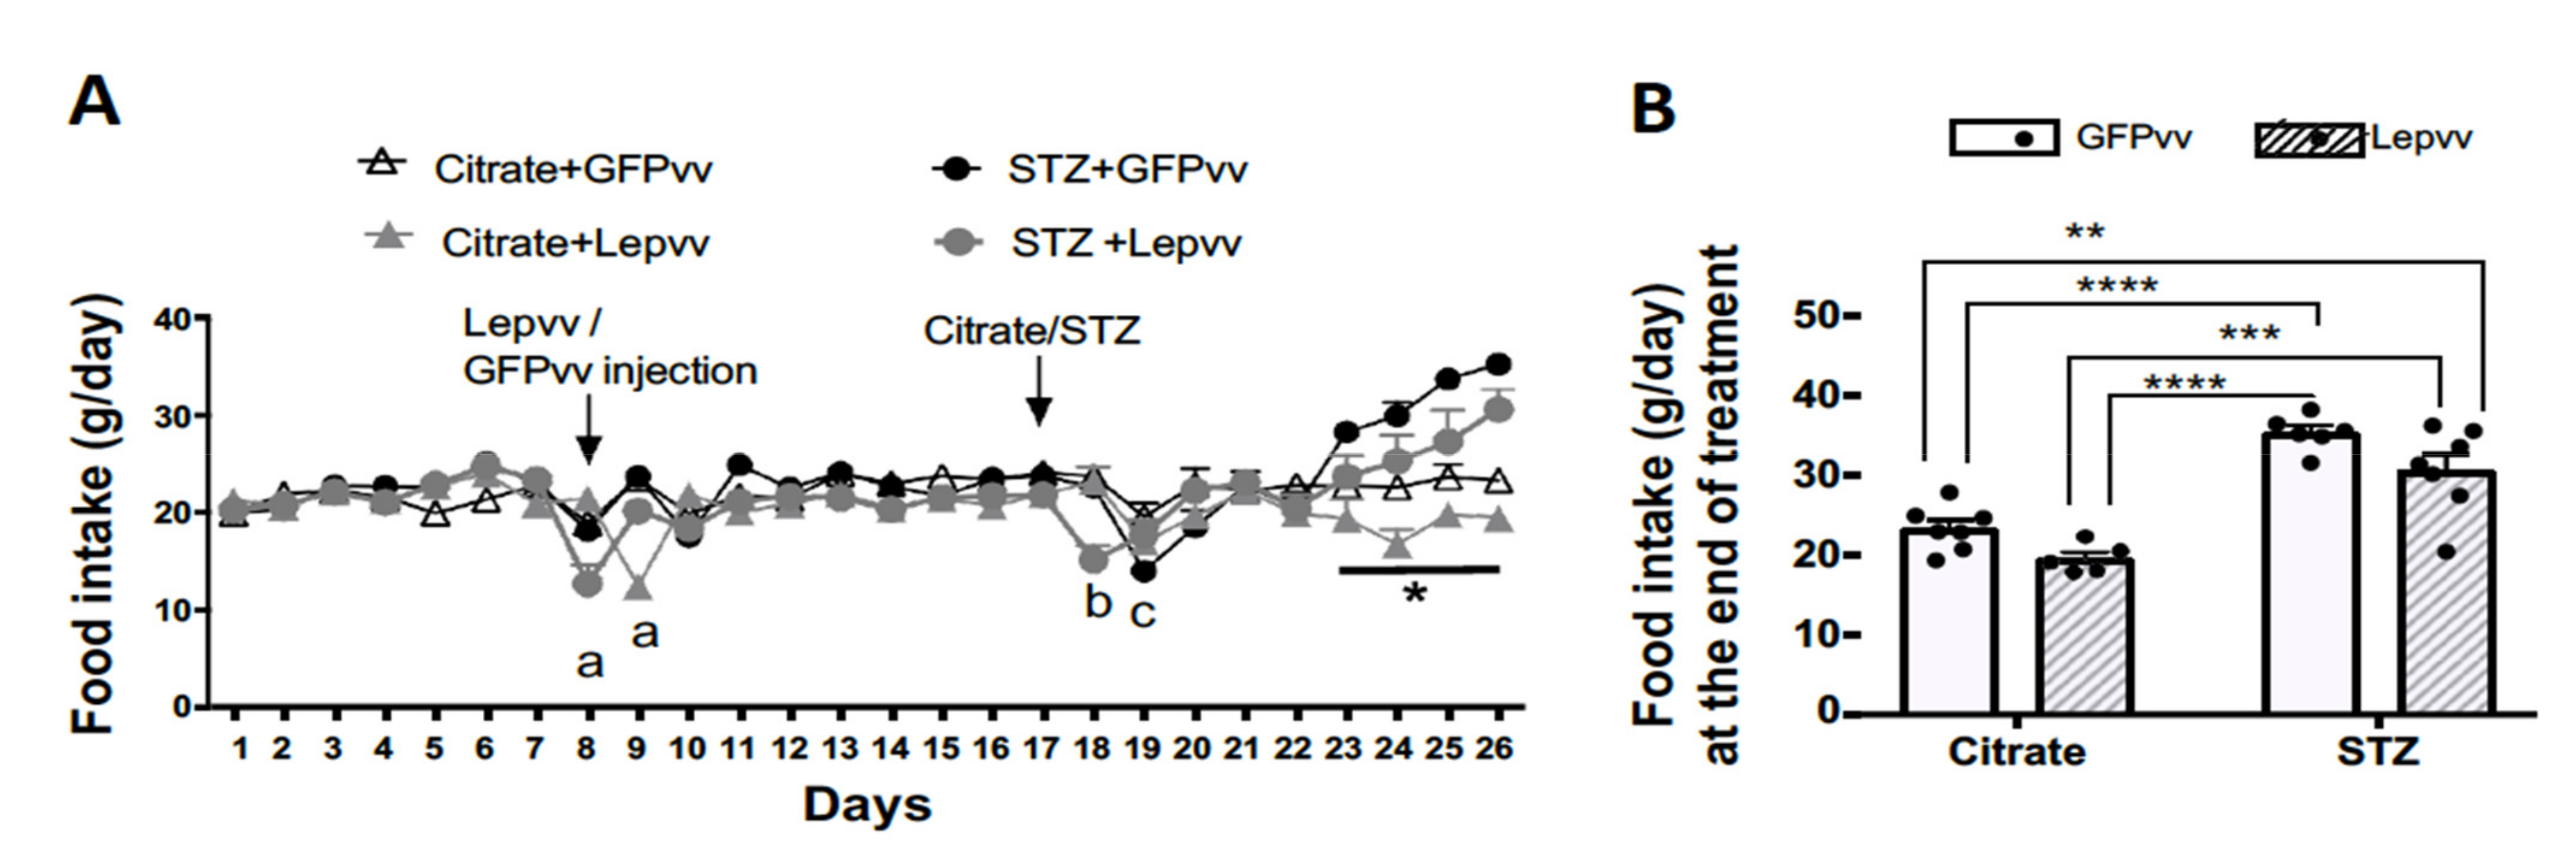
2.1. Food Intake
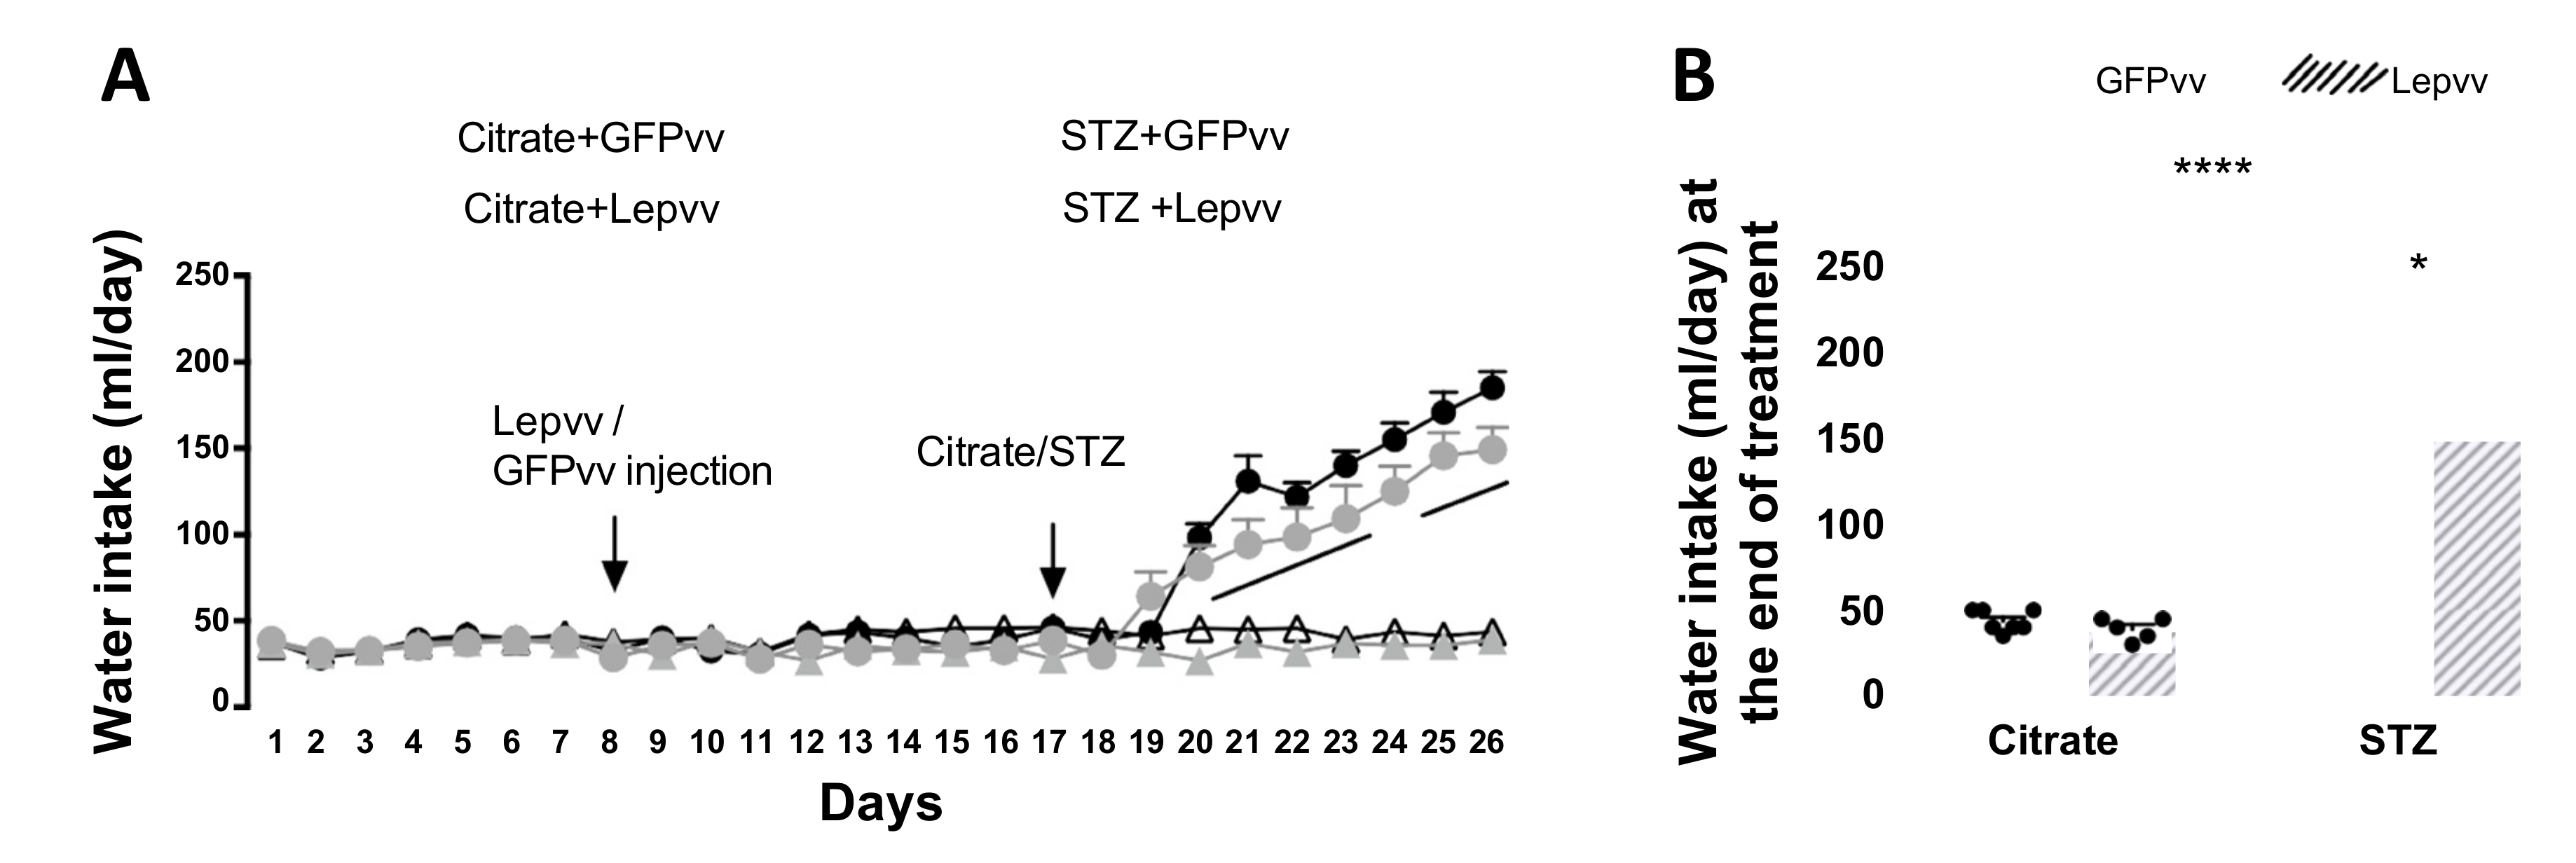
2.2. Water Intake
2.3. Body Weight
2.4. Serum Leptin and Insulin and Blood Glucose
2.5. HPA Axis Activity
Norepinephrine Concentrations in the PVN
2.6. Serum Corticosterone
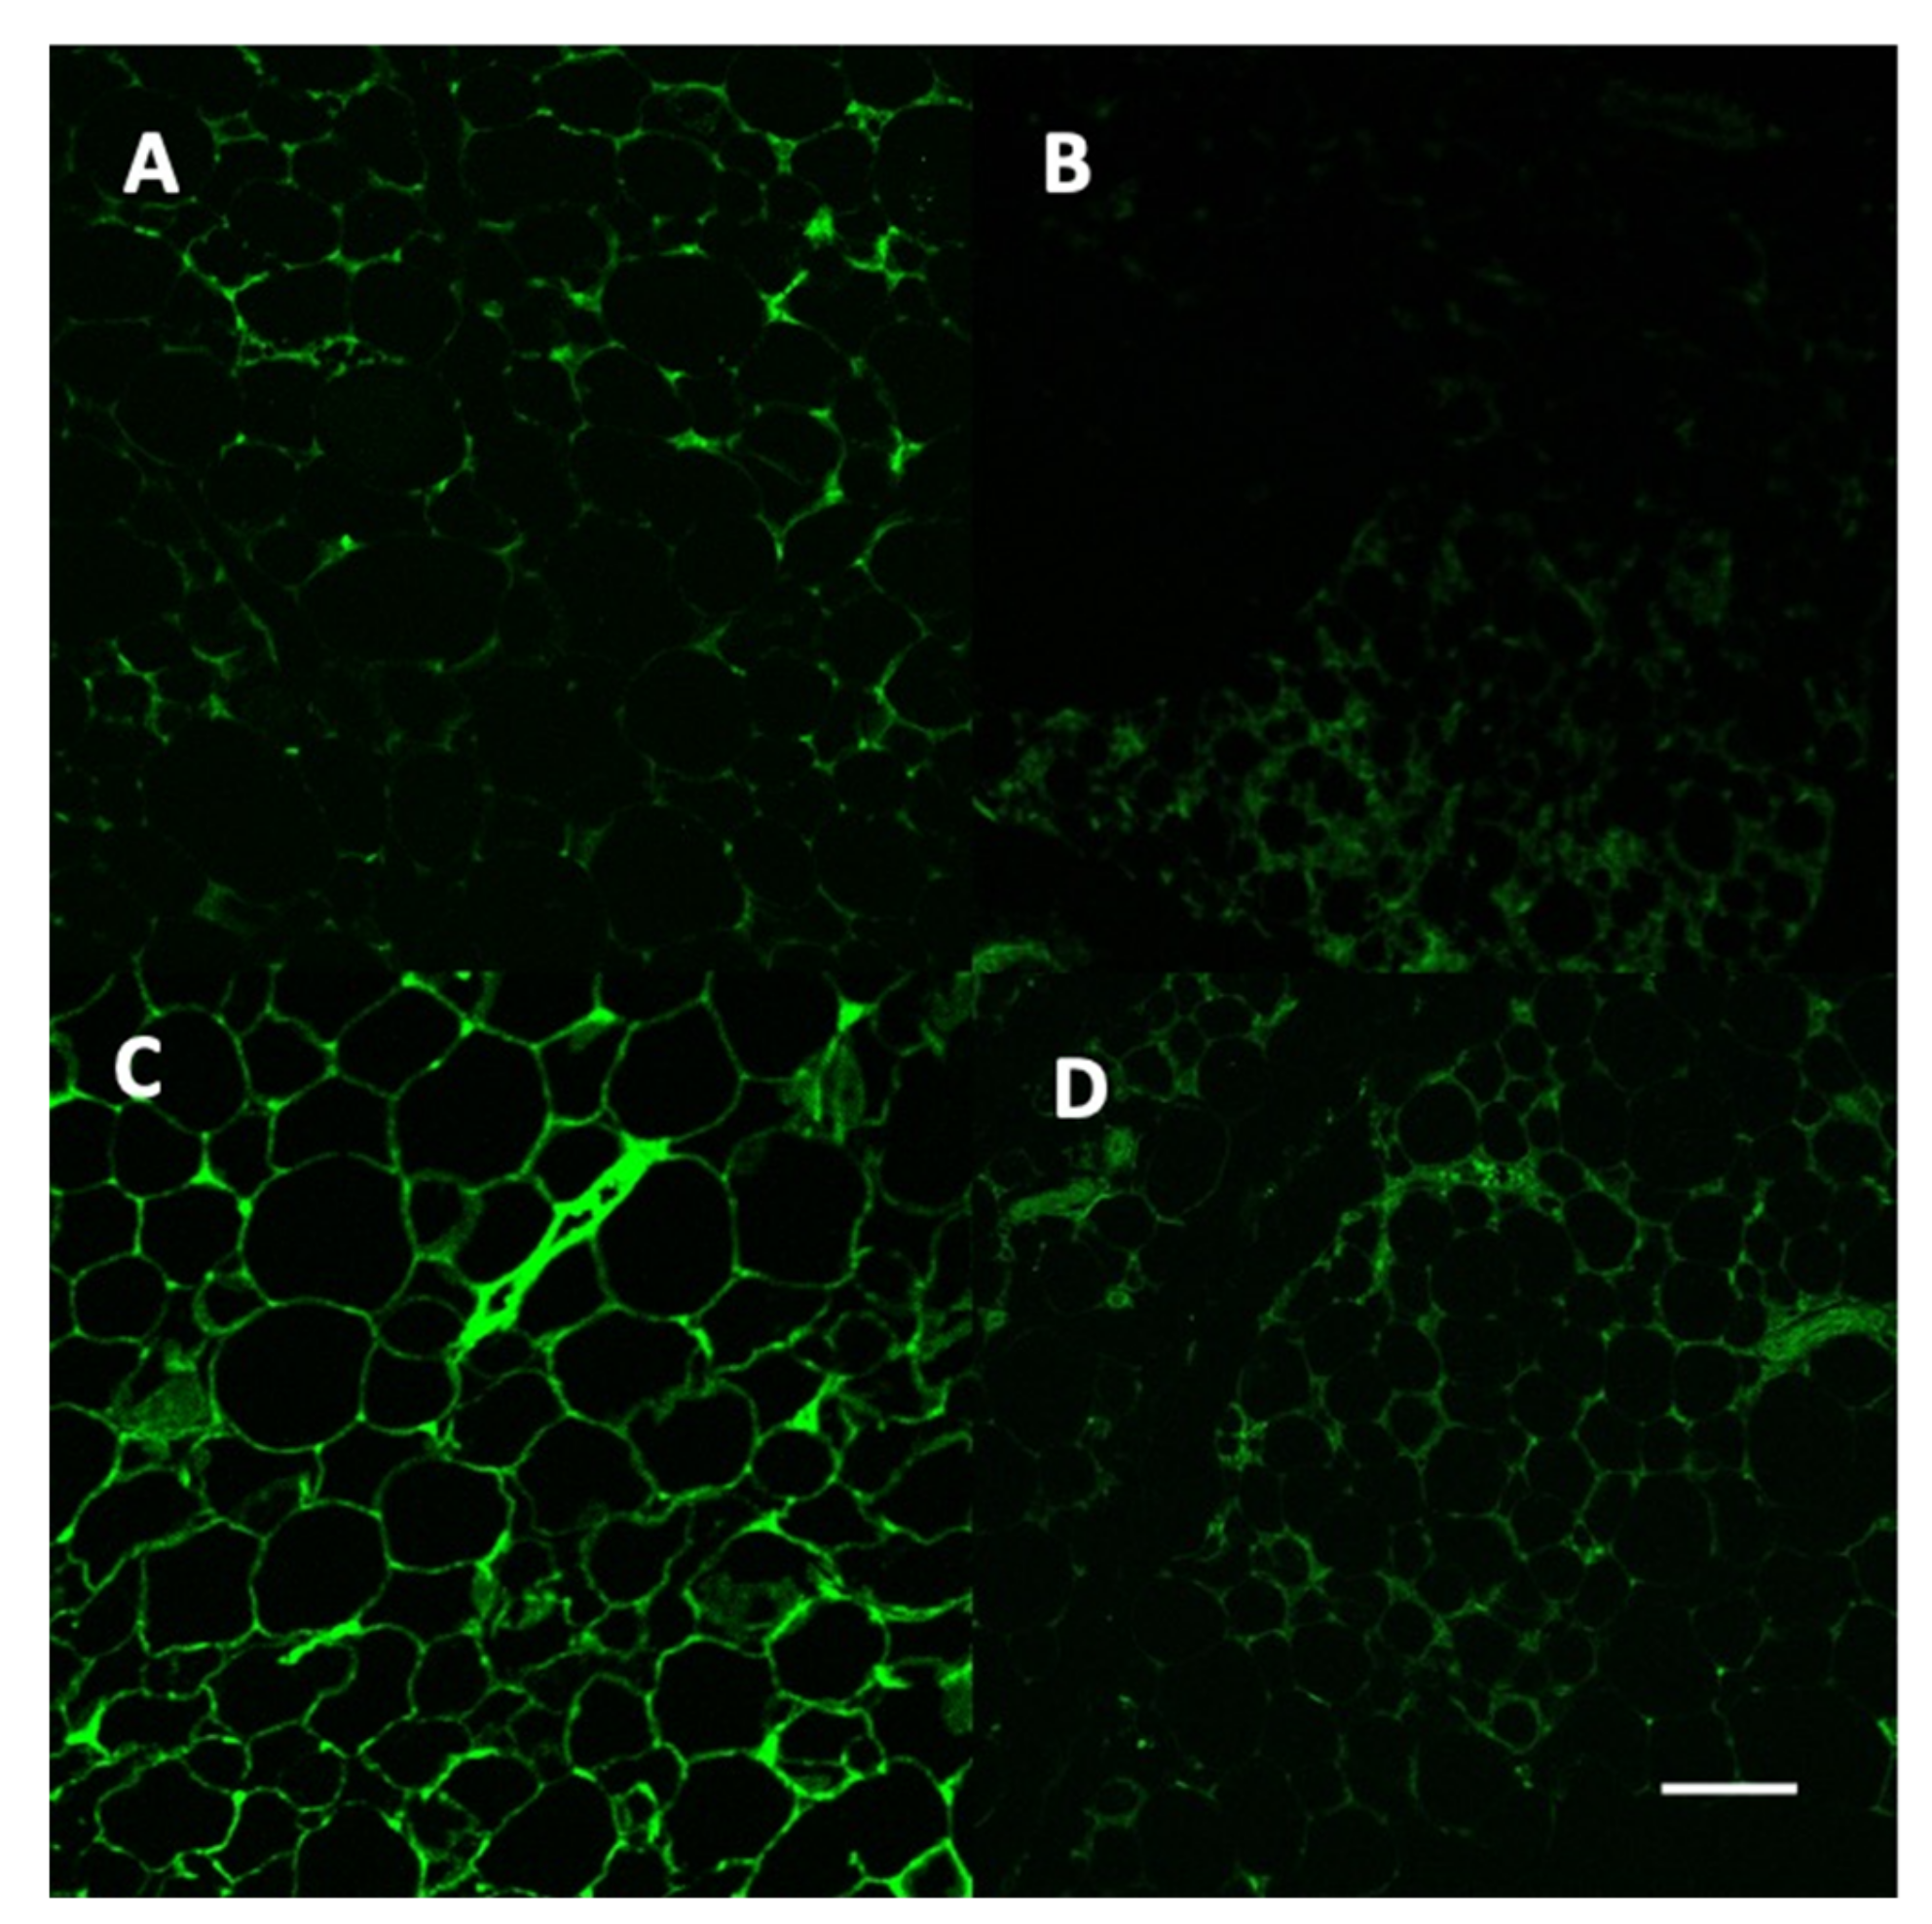
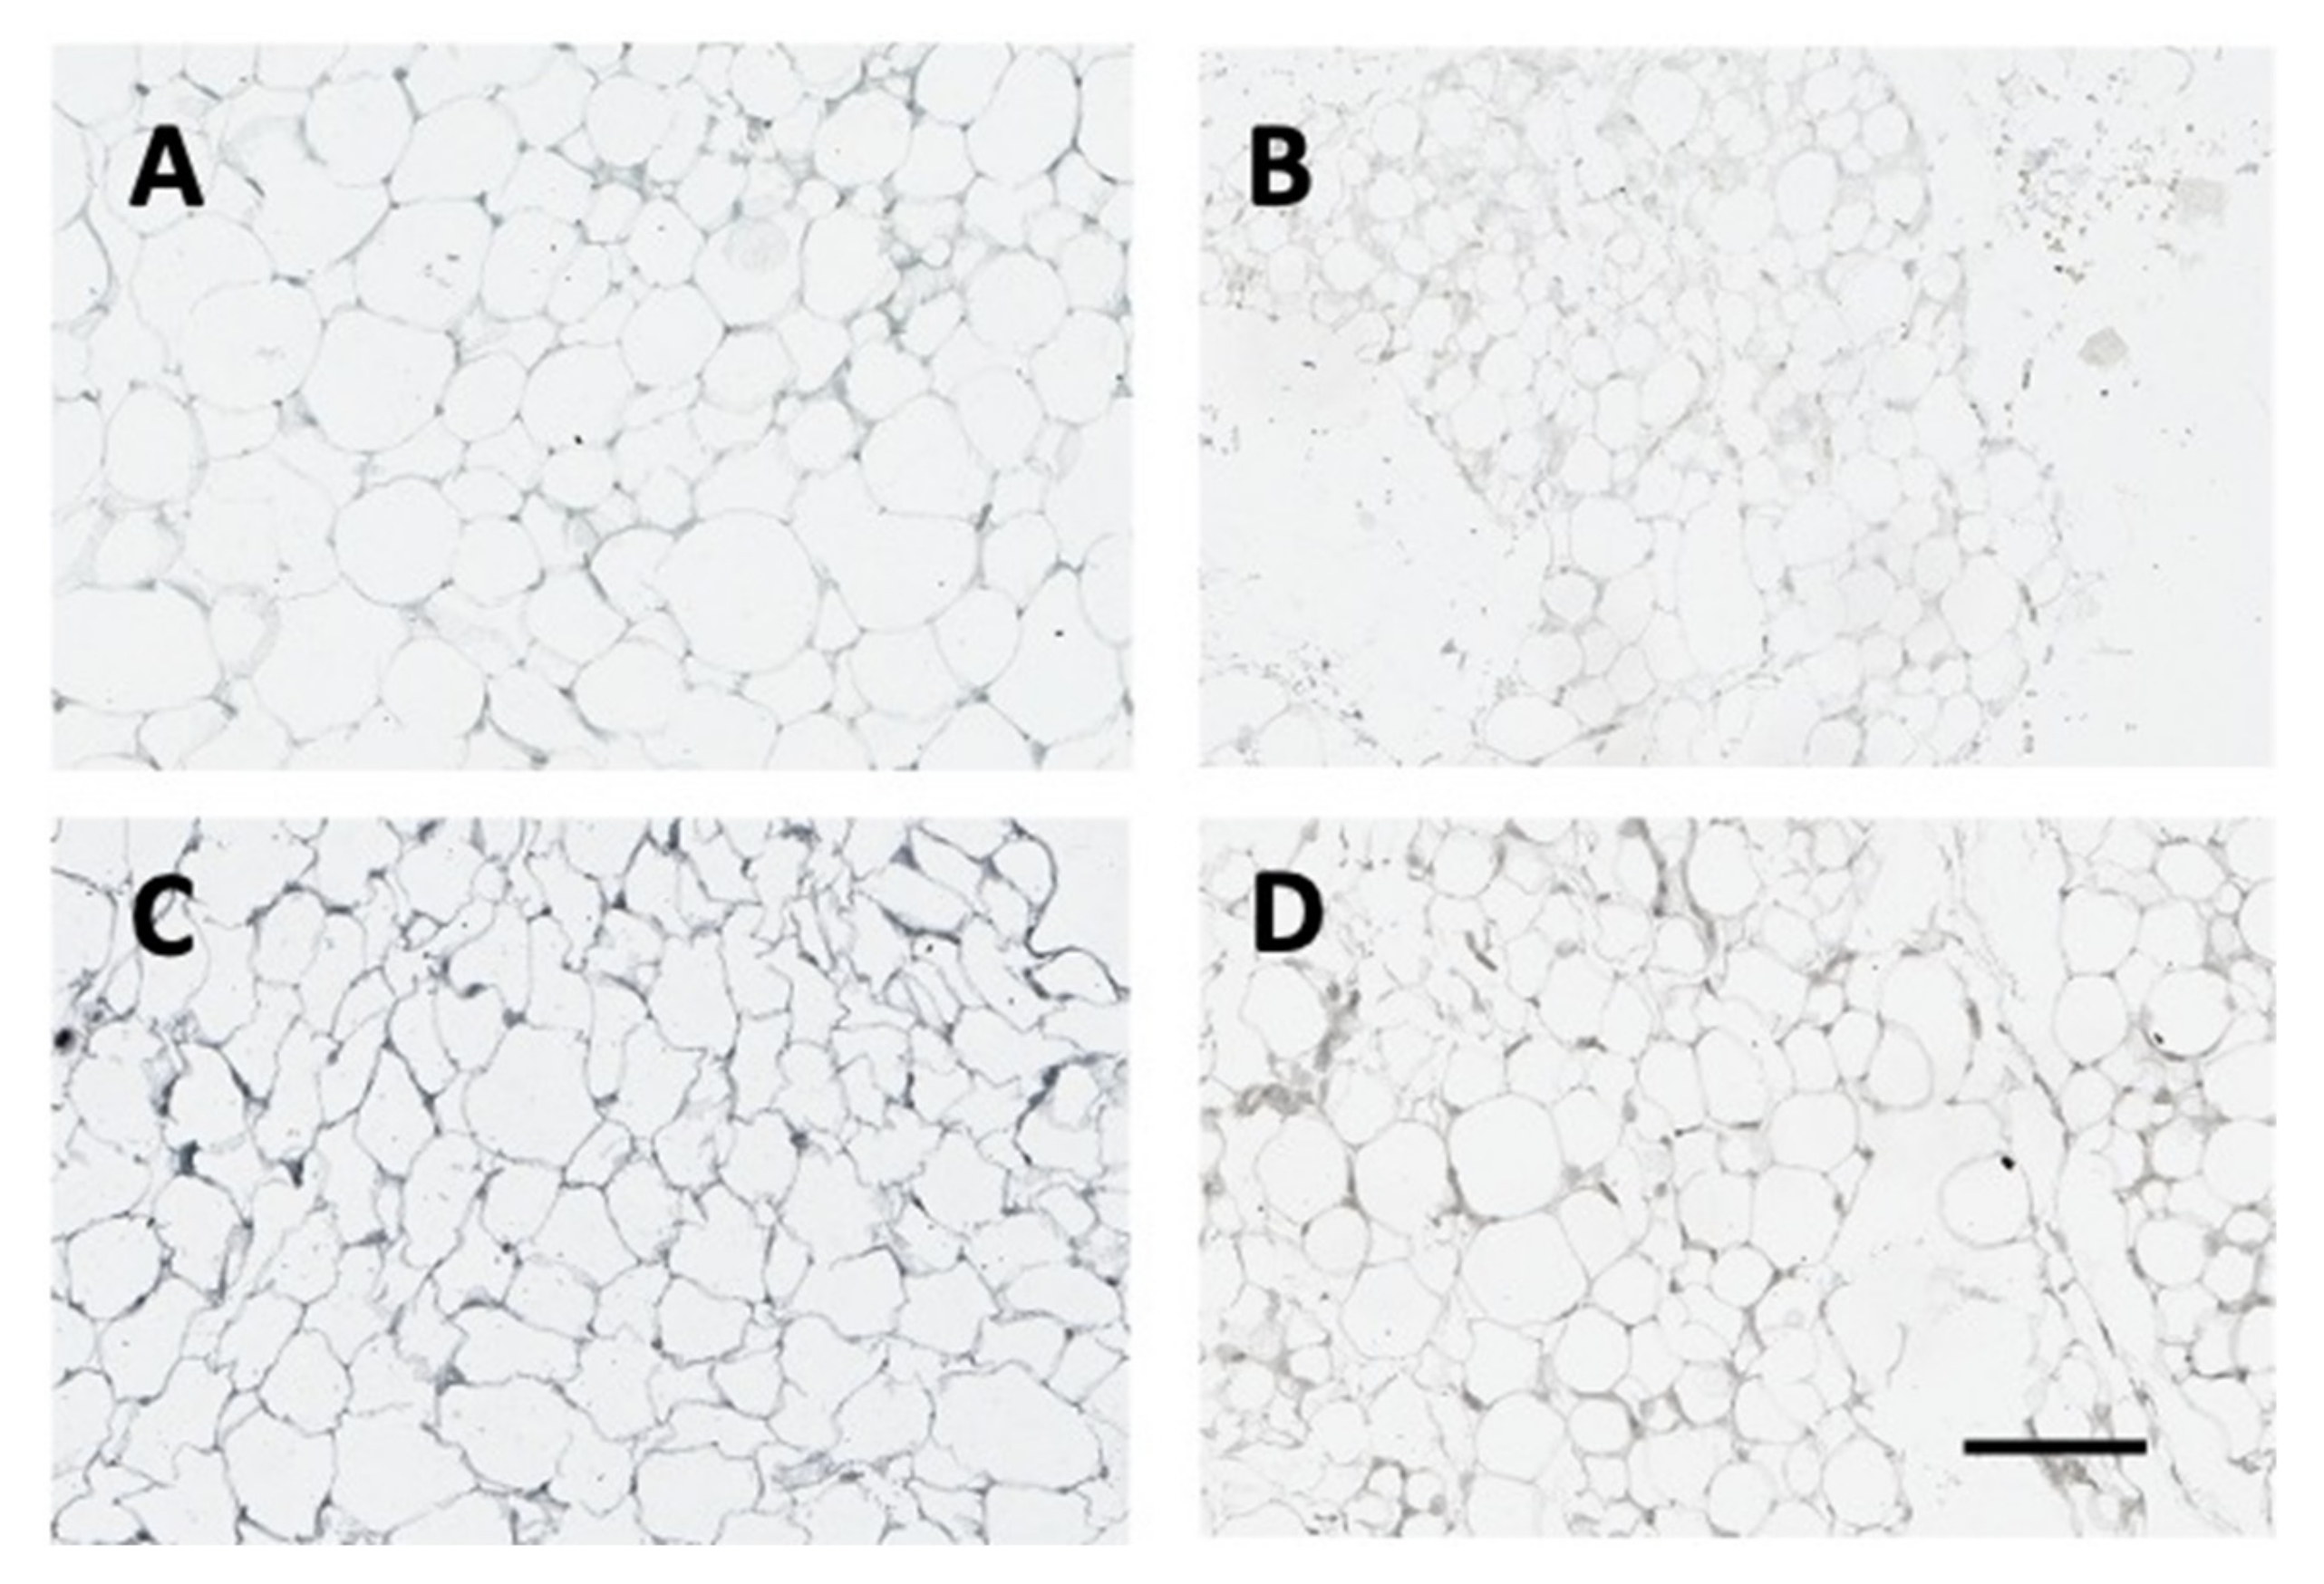
2.7. Vector and Leptin Expression in Adipose Tissue
3. Discussion
4. Materials and Methods
4.1. Animals
4.2. Plasmid Construction
4.3. Production of Leptin Lentiviral Particles
4.4. Experimental Design
4.5. RIA: Corticosterone and Leptin
4.6. Insulin Assay
4.7. Brain Microdissection
4.8. High-Performance Liquid Chromatography with Electrochemical Detection (HPLC-EC)
4.9. Confocal Microscopy and Leptin Immunohistochemistry
4.10. Protein Assay
4.11. Statistical Analysis
Author Contributions
Funding
Institutional Review Board Statement
Data Availability Statement
Acknowledgments
Conflicts of Interest
References
- Fenske, R.J.; Kimple, M.E. Targeting dysfunctional beta-cell signaling for the potential treatment of type 1 diabetes mellitus. Exp. Biol. Med. 2018, 243, 586–591. [Google Scholar] [CrossRef]
- Subramanian, S.; Hirsch, I.B. Intensive Diabetes Treatment and Cardiovascular Outcomes in Type 1 Diabetes Mellitus: Implications of the Diabetes Control and Complications Trial/Epidemiology of Diabetes Interventions and Complications Study 30-Year Follow-up. Endocrinol. Metab. Clin. North Am. 2018, 47, 65–79. [Google Scholar] [CrossRef]
- Copenhaver, M.; Hoffman, R.P. Type 1 diabetes: Where are we in 2017? Transl. Pediatr. 2017, 6, 359–364. [Google Scholar] [CrossRef]
- Kee, A.R.; Wong, T.Y.; Li, L.J. Retinal vascular imaging technology to monitor disease severity and complications in type 1 diabetes mellitus: A systematic review. Microcirculation 2017, 24, 2. [Google Scholar] [CrossRef] [PubMed]
- Bjornstad, P.; Donaghue, K.C.; Maahs, D.M. Macrovascular disease and risk factors in youth with type 1 diabetes: Time to be more attentive to treatment? Lancet Diabetes Endocrinol. 2018, 6, 809–820. [Google Scholar] [CrossRef]
- Grauslund, J. Eye complications and markers of morbidity and mortality in long-term type 1 diabetes. Acta Ophthalmol. 2011, 89, 1–19. [Google Scholar] [CrossRef]
- Goncalves, N.P.; Vaegter, C.B.; Pallesen, L.T. Peripheral Glial Cells in the Development of Diabetic Neuropathy. Front. Neurol. 2018, 9, 268. [Google Scholar] [CrossRef] [PubMed]
- Chan, O.; Inouye, K.; Riddell, M.C.; Vranic, M.; Matthews, S.G. Diabetes and the hypothalamo-pituitary-adrenal (HPA) axis. Minerva Endocrinol. 2003, 28, 87–102. [Google Scholar] [PubMed]
- Chan, O.; Inouye, K.; Akirav, E.M.; Park, E.; Riddell, M.C.; Matthews, S.G.; Vranic, M. Hyperglycemia does not increase basal hypothalamo-pituitary-adrenal activity in diabetes but it does impair the HPA response to insulin-induced hypoglycemia. Am. J. Physiol. Regul. Integr. Comp. Physiol. 2005, 289, R235–R246. [Google Scholar] [CrossRef] [PubMed]
- Barber, M.; Kasturi, B.S.; Austin, M.E.; Patel, K.P.; MohanKumar, S.M.; MohanKumar, P.S. Diabetes-induced neuroendocrine changes in rats: Role of brain monoamines, insulin and leptin. Brain Res. 2003, 964, 128–135. [Google Scholar] [CrossRef]
- Havel, P.J.; Uriu-Hare, J.Y.; Liu, T.; Stanhope, K.L.; Stern, J.S.; Keen, C.L.; Ahren, B. Marked and rapid decreases of circulating leptin in streptozotocin diabetic rats: Reversal by insulin. Am. J. Physiol. 1998, 274, R1482–R1491. [Google Scholar] [CrossRef] [PubMed]
- Becker, D.J.; Ongemba, L.N.; Brichard, V.; Henquin, J.C.; Brichard, S.M. Diet- and diabetes-induced changes of ob gene expression in rat adipose tissue. FEBS Lett. 1995, 371, 324–328. [Google Scholar] [PubMed]
- MacDougald, O.A.; Hwang, C.S.; Fan, H.; Lane, M.D. Regulated expression of the obese gene product (leptin) in white adipose tissue and 3T3-L1 adipocytes. Proc. Natl. Acad. Sci. USA 1995, 92, 9034–9037. [Google Scholar] [CrossRef]
- Amitani, M.; Asakawa, A.; Amitani, H.; Inui, A. The role of leptin in the control of insulin-glucose axis. Front Neurosci. 2013, 7, 51. [Google Scholar] [CrossRef] [PubMed]
- Clark, K.A.; Shin, A.C.; Sirivelu, M.P.; Mohankumar, S.M.; Mohankumar, P.S. Systemic administration of leptin decreases plasma corticosterone levels: Role of hypothalamic norepinephrine. Brain Res. 2008, 1195, 89–95. [Google Scholar] [CrossRef] [PubMed][Green Version]
- Campfield, L.A.; Smith, F.J.; Guisez, Y.; Devos, R.; Burn, P. Recombinant mouse OB protein: Evidence for a peripheral signal linking adiposity and central neural networks. Science 1995, 269, 546–549. [Google Scholar] [CrossRef]
- Pelleymounter, M.A.; Cullen, M.J.; Baker, M.B.; Hecht, R.; Winters, D.; Boone, T.; Collins, F. Effects of the obese gene product on body weight regulation in ob/ob mice. Science 1995, 269, 540–543. [Google Scholar] [CrossRef] [PubMed]
- Friedman, J.M.; Halaas, J.L. Leptin and the regulation of body weight in mammals. Nature 1998, 395, 763–770. [Google Scholar] [CrossRef] [PubMed]
- Flier, J.S. Clinical review 94: What’s in a name? In search of leptin’s physiologic role. J. Clin. Endocrinol. Metab. 1998, 83, 1407–1413. [Google Scholar]
- Roubos, E.W.; Dahmen, M.; Kozicz, T.; Xu, L. Leptin and the hypothalamo-pituitary-adrenal stress axis. Gen. Comp. Endocrinol. 2012, 177, 28–36. [Google Scholar] [PubMed]
- Huang, Q.; Rivest, R.; Richard, D. Effects of leptin on corticotropin-releasing factor (CRF) synthesis and CRF neuron activation in the paraventricular hypothalamic nucleus of obese (ob/ob) mice. Endocrinology 1998, 139, 1524–1532. [Google Scholar] [CrossRef]
- Huang, Q.; Timofeeva, E.; Richard, D. Regulation of corticotropin-releasing factor and its types 1 and 2 receptors by leptin in rats subjected to treadmill running-induced stress. J. Endocrinol. 2006, 191, 179–188. [Google Scholar] [CrossRef][Green Version]
- Kawakami, A.; Okada, N.; Rokkaku, K.; Honda, K.; Ishibashi, S.; Onaka, T. Leptin inhibits and ghrelin augments hypothalamic noradrenaline release after stress. Stress 2008, 11, 363–369. [Google Scholar] [CrossRef]
- Chinookoswong, N.; Wang, J.L.; Shi, Z.Q. Leptin restores euglycemia and normalizes glucose turnover in insulin-deficient diabetes in the rat. Diabetes 1999, 48, 1487–1492. [Google Scholar] [CrossRef]
- Dube, M.G.; Beretta, E.; Dhillon, H.; Ueno, N.; Kalra, P.S.; Kalra, S.P. Central leptin gene therapy blocks high-fat diet-induced weight gain, hyperleptinemia, and hyperinsulinemia: Increase in serum ghrelin levels. Diabetes 2002, 51, 1729–1736. [Google Scholar] [CrossRef]
- Bagnasco, M.; Dube, M.G.; Kalra, P.S.; Kalra, S.P. Evidence for the existence of distinct central appetite, energy expenditure, and ghrelin stimulation pathways as revealed by hypothalamic site-specific leptin gene therapy. Endocrinology 2002, 143, 4409–4421. [Google Scholar] [CrossRef]
- Torto, R.; Boghossian, S.; Dube, M.G.; Kalra, P.S.; Kalra, S.P. Central leptin gene therapy blocks ovariectomy-induced adiposity. Obesity 2006, 14, 1312–1319. [Google Scholar] [CrossRef]
- Lindenmaier, L.B.; Philbrick, K.A.; Branscum, A.J.; Kalra, S.P.; Turner, R.T.; Iwaniec, U.T. Hypothalamic Leptin Gene Therapy Reduces Bone Marrow Adiposity in ob/ob Mice Fed Regular and High-Fat Diets. Front. Endocrinol. 2016, 7, 110. [Google Scholar] [CrossRef] [PubMed]
- Dhillon, H.; Kalra, S.P.; Prima, V.; Zolotukhin, S.; Scarpace, P.J.; Moldawer, L.L.; Muzyczka, N.; Kalra, P.S. Central leptin gene therapy suppresses body weight gain, adiposity and serum insulin without affecting food consumption in normal rats: A long-term study. Regul. Pept. 2001, 99, 69–77. [Google Scholar] [CrossRef]
- Muzzin, P.; Cusin, I.; Charnay, Y.; Rohner-Jeanrenaud, F. Single intracerebroventricular bolus injection of a recombinant adenovirus expressing leptin results in reduction of food intake and body weight in both lean and obese Zucker fa/fa rats. Regul. Pept. 2000, 92, 57–64. [Google Scholar] [CrossRef]
- Zhang, Y.; Scarpace, P.J. Circumventing central leptin resistance: Lessons from central leptin and POMC gene delivery. Peptides 2006, 27, 350–364. [Google Scholar] [CrossRef]
- Wang, Z.; Zhou, Y.T.; Kakuma, T.; Lee, Y.; Kalra, S.P.; Kalra, P.S.; Pan, W.; Unger, R.H. Leptin resistance of adipocytes in obesity: Role of suppressors of cytokine signaling. Biochem. Biophys. Res. Commun. 2000, 277, 20–26. [Google Scholar] [CrossRef]
- Zufferey, R.; Dull, T.; Mandel, R.J.; Bukovsky, A.; Quiroz, D.; Naldini, L.; Trono, D. Self-inactivating lentivirus vector for safe and efficient in vivo gene delivery. J. Virol. 1998, 72, 9873–9880. [Google Scholar] [CrossRef]
- Iwaniec, U.T.; Boghossian, S.; Lapke, P.D.; Turner, R.T.; Kalra, S.P. Central leptin gene therapy corrects skeletal abnormalities in leptin-deficient ob/ob mice. Peptides 2007, 28, 1012–1019. [Google Scholar] [CrossRef] [PubMed]
- Muzzin, P.; Eisensmith, R.C.; Copeland, K.C.; Woo, S.L. Correction of obesity and diabetes in genetically obese mice by leptin gene therapy. Proc. Natl. Acad. Sci. USA 1996, 93, 14804–14808. [Google Scholar] [CrossRef] [PubMed]
- Turner, R.T.; Dube, M.; Branscum, A.J.; Wong, C.P.; Olson, D.A.; Zhong, X.; Kweh, M.F.; Larkin, I.V.; Wronski, T.J.; Rosen, C.J.; et al. Hypothalamic leptin gene therapy reduces body weight without accelerating age-related bone loss. J. Endocrinol. 2015, 227, 129–141. [Google Scholar] [CrossRef] [PubMed]
- Perez-Gonzalez, R.; Alvira-Botero, M.X.; Robayo, O.; Antequera, D.; Garzon, M.; Martin-Moreno, A.M.; Brera, B.; de Ceballos, M.L.; Carro, E. Leptin gene therapy attenuates neuronal damages evoked by amyloid-beta and rescues memory deficits in APP/PS1 mice. Gene Ther. 2014, 21, 298–308. [Google Scholar] [CrossRef] [PubMed]
- Kojima, S.; Asakawa, A.; Amitani, H.; Sakoguchi, T.; Ueno, N.; Inui, A.; Kalra, S.P. Central leptin gene therapy, a substitute for insulin therapy to ameliorate hyperglycemia and hyperphagia, and promote survival in insulin-deficient diabetic mice. Peptides 2009, 30, 962–966. [Google Scholar] [CrossRef] [PubMed]
- Ueno, N.; Inui, A.; Kalra, P.S.; Kalra, S.P. Leptin transgene expression in the hypothalamus enforces euglycemia in diabetic, insulin-deficient nonobese Akita mice and leptin-deficient obese ob/ob mice. Peptides 2006, 27, 2332–2342. [Google Scholar] [CrossRef] [PubMed]
- Murphy, J.E.; Zhou, S.; Giese, K.; Williams, L.T.; Escobedo, J.A.; Dwarki, V.J. Long-term correction of obesity and diabetes in genetically obese mice by a single intramuscular injection of recombinant adeno-associated virus encoding mouse leptin. Proc. Natl. Acad. Sci. USA 1997, 94, 13921–13926. [Google Scholar] [CrossRef] [PubMed]
- Yu, X.; Park, B.H.; Wang, M.Y.; Wang, Z.V.; Unger, R.H. Making insulin-deficient type 1 diabetic rodents thrive without insulin. Proc. Natl. Acad. Sci. USA 2008, 105, 14070–14075. [Google Scholar] [CrossRef] [PubMed]
- Heinrich, G.; Ghadieh, H.E.; Ghanem, S.S.; Muturi, H.T.; Rezaei, K.; Al-Share, Q.Y.; Bowman, T.A.; Zhang, D.; Garofalo, R.S.; Yin, L.; et al. Loss of Hepatic CEACAM1: A Unifying Mechanism Linking Insulin Resistance to Obesity and Non-Alcoholic Fatty Liver Disease. Front. Endocrinol. 2017, 8, 8. [Google Scholar] [CrossRef]
- Francis, J.; MohanKumar, S.M.; MohanKumar, P.S. Leptin inhibits norepinephrine efflux from the hypothalamus in vitro: Role of gamma aminobutyric acid. Brain Res. 2004, 1021, 286–291. [Google Scholar] [CrossRef] [PubMed]
- Chiodini, I.; Adda, G.; Scillitani, A.; Coletti, F.; Morelli, V.; Di Lembo, S.; Epaminonda, P.; Masserini, B.; Beck-Peccoz, P.; Orsi, E.; et al. Cortisol secretion in patients with type 2 diabetes: Relationship with chronic complications. Diabetes Care 2007, 30, 83–88. [Google Scholar] [CrossRef] [PubMed]
- Milone, M.C.; O’Doherty, U. Clinical use of lentiviral vectors. Leukemia 2018, 32, 1529–1541. [Google Scholar] [CrossRef] [PubMed]


Publisher’s Note: MDPI stays neutral with regard to jurisdictional claims in published maps and institutional affiliations. |
© 2021 by the authors. Licensee MDPI, Basel, Switzerland. This article is an open access article distributed under the terms and conditions of the Creative Commons Attribution (CC BY) license (https://creativecommons.org/licenses/by/4.0/).
Share and Cite
Clark, K.A.; Shin, A.C.; Sirivelu, M.P.; MohanKumar, R.C.; Maddineni, S.R.; Ramachandran, R.; MohanKumar, P.S.; MohanKumar, S.M.J. Evaluation of the Central Effects of Systemic Lentiviral-Mediated Leptin Delivery in Streptozotocin-Induced Diabetic Rats. Int. J. Mol. Sci. 2021, 22, 13197. https://doi.org/10.3390/ijms222413197
Clark KA, Shin AC, Sirivelu MP, MohanKumar RC, Maddineni SR, Ramachandran R, MohanKumar PS, MohanKumar SMJ. Evaluation of the Central Effects of Systemic Lentiviral-Mediated Leptin Delivery in Streptozotocin-Induced Diabetic Rats. International Journal of Molecular Sciences. 2021; 22(24):13197. https://doi.org/10.3390/ijms222413197
Chicago/Turabian StyleClark, Kimberly A., Andrew C. Shin, Madhu P. Sirivelu, Ramya C. MohanKumar, Sreenivasa R. Maddineni, Ramesh Ramachandran, Puliyur S. MohanKumar, and Sheba M. J. MohanKumar. 2021. "Evaluation of the Central Effects of Systemic Lentiviral-Mediated Leptin Delivery in Streptozotocin-Induced Diabetic Rats" International Journal of Molecular Sciences 22, no. 24: 13197. https://doi.org/10.3390/ijms222413197
APA StyleClark, K. A., Shin, A. C., Sirivelu, M. P., MohanKumar, R. C., Maddineni, S. R., Ramachandran, R., MohanKumar, P. S., & MohanKumar, S. M. J. (2021). Evaluation of the Central Effects of Systemic Lentiviral-Mediated Leptin Delivery in Streptozotocin-Induced Diabetic Rats. International Journal of Molecular Sciences, 22(24), 13197. https://doi.org/10.3390/ijms222413197