Article

An RNA-Seq-Based Framework for Characterizing Canine Prostate Cancer and Prioritizing Clinically Relevant Biomarker Candidate Genes

1
Small Animal Clinic, University of Veterinary Medicine Hannover, Foundation, 30559 Hannover, Germany
2
Department of Hematology/Oncology/Palliative Care, Rostock University Medical Centre, 18057 Rostock, Germany
3
Institute of Biomedical Informatics, Graz University of Technology, 8010 Graz, Austria
4
Institute of Pathology, University of Veterinary Medicine Hannover, Foundation, 30559 Hannover, Germany
5
Institute of Veterinary Medicine, University of Göttingen, 37077 Göttingen, Germany
6
Chronix Biomedical GmbH, 37079 Göttingen, Germany
7
Comprehensive Cancer Center Mecklenburg-Vorpommern (CCC-MV), Campus Rostock, University of Rostock, 18057 Rostock, Germany
*
Author to whom correspondence should be addressed.
These authors contributed equally to this work.
Int. J. Mol. Sci. 2021, 22(21), 11481; https://doi.org/10.3390/ijms222111481
Submission received: 6 September 2021 / Revised: 16 October 2021 / Accepted: 16 October 2021 / Published: 25 October 2021
(This article belongs to the Special Issue Advances in Molecular Research on Prostate Cancer)

Abstract

:
Prostate cancer (PCa) in dogs is a highly malignant disease akin to its human counterpart. In contrast to the situation in humans, multi-gene approaches facilitating risk stratification of canine PCa are barely established. The aims of this study were the characterization of the transcriptional landscape of canine PCa and the identification of diagnostic, prognostic and/or therapeutic biomarkers through a multi-step screening approach. RNA-Sequencing of ten malignant tissues and fine-needle aspirations (FNA), and 14 nonmalignant tissues and FNAs was performed to find differentially expressed genes (DEGs) and deregulated pathways. The 4098 observed DEGs were involved in 49 pathways. These 49 pathways could be grouped into five superpathways summarizing the hallmarks of canine PCa: (i) inflammatory response and cytokines; (ii) regulation of the immune system and cell death; (iii) cell surface and PI3K signaling; (iv) cell cycle; and (v) phagosome and autophagy. Among the highly deregulated, moderately to strongly expressed DEGs that were members of one or more superpathways, 169 DEGs were listed in relevant databases and/or the literature and included members of the PCa pathway, oncogenes, prostate-specific genes, and druggable genes. These genes are novel and promising candidate diagnostic, prognostic and/or therapeutic canine PCa biomarkers.

1. Introduction

Prostate cancer (PCa) in dogs can occur spontaneously, with aging dogs exhibiting higher incidence thereof than any other nonhuman species [1,2,3]. Although the incidence in dogs (0.2%, [4]) is substantially lower than in men, canine PCa is typically aggressive, with a high likelihood of metastasis [5]. In particular, the metastatic castration-resistant state of human PCa shares many clinical properties with canine PCa [5,6,7], making canine PCa of considerable value for the study of human cancer pathogenesis and for the evaluation of therapeutic interventions [8].
Despite some advances, there are gaps in our knowledge of canine PCa and its diagnostic workup [2,9], especially compared to human PCa. Notwithstanding numerous immunohistochemical and a few gene expression studies on canine PCa [10,11,12,13,14,15,16,17,18,19], no comprehensive marker set has proved suitable for routine clinical assessment [2,20]. With regard to the prostate-specific antigen (PSA, encoded by Kallikrein Related Peptidase 3 or KLK3), as commonly used blood serum biomarker in regular checkups for human PCa [21], no unambiguous canine ortholog has been identified for the human gene encoding PSA, i.e., KLK3 [22]. The canine prostate-specific arginine esterase (CPSE, encoded by KLK2), another member of the kallikrein family with striking similarities to human PSA [23], has been suggested as a blood serum marker for diagnosing benign prostatic hyperplasia [24]. Whether CPSE is also a marker for diagnosing canine PCa still has to be investigated [25,26]. Further studies are needed to establish a reliable classification system and molecular diagnostic tests for canine PCa [9]. Histopathological terminology standards for prostatic diseases in dogs and also the Gleason score grading system used for human PCa, have been recently adapted to canine PCa [27]. Nonetheless, most canine PCa continues to be diagnosed at an advanced stage with limited therapeutic options [5,7].
Molecular information, especially that enabled by high-throughput technologies such as next-generation sequencing (NGS), plays an increasingly important role in the diagnostic work-up of human PCa [28,29]. In veterinary medicine, high-throughput technologies are emerging as the method of choice to characterize diseases at molecular level [30]. Recently, genome-wide profiling of androgen receptor (AR) negative canine PCa revealed a large number of copy number alterations associated with aberrant expression of cancer-related and tumor suppressor genes [31]. Nevertheless, most gene expression studies in canine PCa to date are based on the quantitative polymerase chain reaction (qPCR). They have provided information on the hormonal network of canine PCa, including the AR, or tumor suppressor genes, such as NK3 homeobox 1 (NKX3-1), and therapeutically relevant genes, like KIT proto-oncogene, receptor tyrosine kinase (KIT) [11,16,19]. However, although qPCR-based quantification is highly specific and sensitive, it is limited by its throughput and impracticable at whole-genome level [32]. In contrast to qPCR-based approaches, NGS technologies such as RNA-Sequencing (RNA-Seq) yield an almost fully comprehensive picture of the transcriptional landscape and have the potential to provide insight into the molecular mechanisms and regulatory networks underlying PCa [33,34,35].
Integrating the clinical findings with the molecular context is imperative in order to further characterize any disease [30,32,36] and prospectively enable the intelligent selection of interventional compounds. Thus, the combination of clinical, pathological and gene expression data has led to the development of various tissue-based multi-gene assays for human PCa [36]. Some such assays even enable the use of formalin-fixed paraffin-embedded needle core biopsies for gene expression profiling [36]. In dogs, we were recently able to show that fresh frozen tissue and aspirates collected intra vitam by fine-needle aspiration biopsies (FNA) of the canine prostate can serve as reliable sampling material for gene expression profiling in clinical settings [37]. Taking a step forward towards developing new molecular diagnostic approaches for canine PCa, the present study used RNA-Seq data of malignant and nonmalignant post mortem prostate tissues and intra vitam fine-needle aspirates to characterize the transcriptional landscape of canine PCa. A multidisciplinary approach was applied to identify canine PCa biomarker candidates that could enable targeting specific clinical questions and warrant further research. Ultimately, this study aims at improving the diagnostic and therapeutic possibilities for canine PCa and at strengthening the dog as a model for human PCa.

2. Results

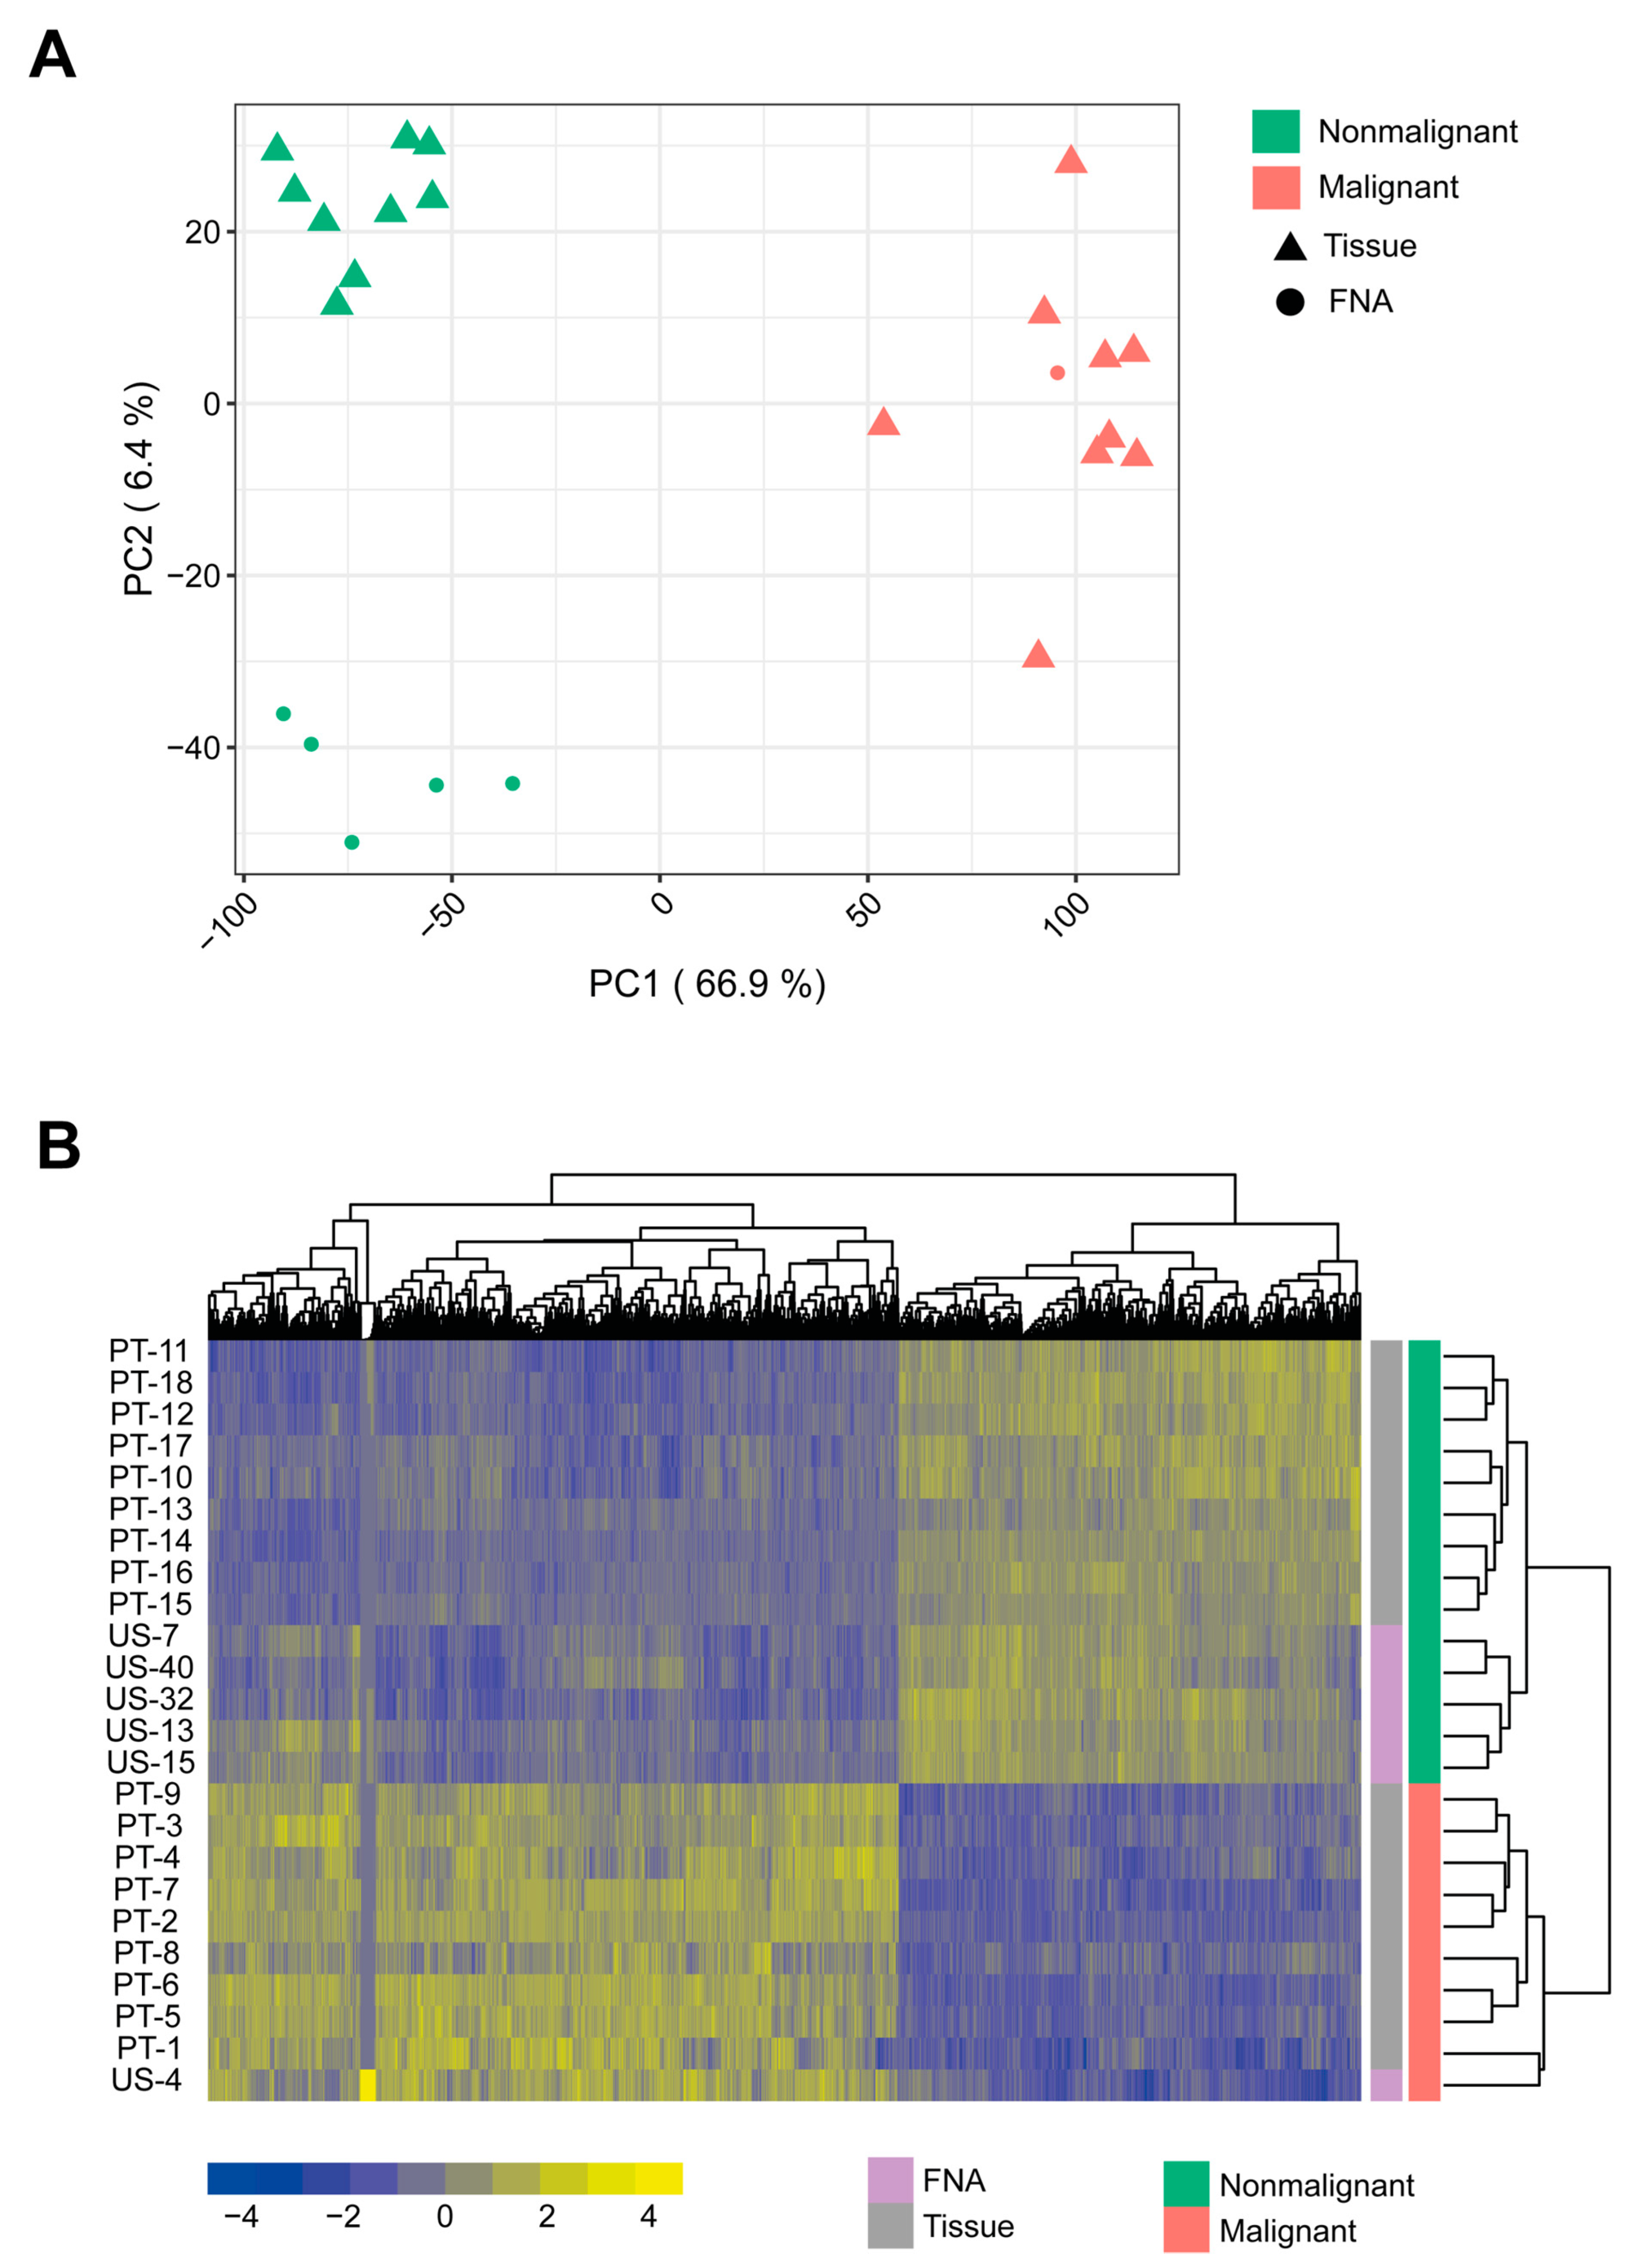
2.1. Discriminating Malignant and Nonmalignant Canine Prostate Samples

RNA-Seq data of 10 malignant and 14 nonmalignant canine prostate tissue and FNA samples were compared to characterize the transcriptional landscape of the malignant phenotype of the canine prostate and identify canine PCa biomarker candidates featuring its most striking molecular mechanisms (Figure 1). Differential expression analysis revealed a total of 4098 DEGs between these two sample groups (see Materials and Methods). The transcriptomic profiles discriminated between malignant and nonmalignant samples according to the corresponding histopathological or cytological diagnoses (Figure 2). In particular, the differences between the two sample groups explained at least 66.9% of the variance in the data (Figure 2A). Most DEGs (2454, 60%) were upregulated. Specifically, 1665 DEGs (41%) were highly upregulated (log2 fold-change ≥ 2), while 839 DEGs (21%) were highly downregulated (log2 fold-change ≤ −2). Overall, 3328 DEGs were annotated with one or more biological processes (Figure S1A), mainly associated with immune response, cell activation and regulation of cell proliferation (Figure S1B, see Materials and Methods).

2.2. The Transcriptional Landscape of Canine PCa Is Characterized by the Deregulation of Pathways Involved in Immune Response, Cell Adhesion, PI3K Signaling, Cell Cycle, as Well as Phagosome and Autophagy

Pathway analysis of the 4098 DEGs revealed 49 enriched pathways (see Materials and Methods). Based on their cross-talk, which was quantified based on the overlap coefficient between the pathway gene members, the pathways could be grouped into five superpathways summarizing the disease hallmarks of canine PCa (Figure 3). Overall, the superpathways involved 1973 genes, with the two largest ones encompassing 85% of all genes.
All superpathways could be mapped to key biological processes commonly deregulated in cancer. The largest superpathway was associated with the biological processes “positive regulation of response to stimulus”, “protein phosphorylation”, “cell activation” and “cytokine production”, among others (see Materials and Methods, Figure 3C). It involved 20 pathways and 1182 genes. The second largest superpathway was related to “positive regulation of response to stimulus”, “protein phosphorylation” and “cell death” (Figure 3D). It comprised 19 pathways and 1075 genes. The third superpathway was connected to “cell surface receptor signaling pathway”, “protein phosphorylation”, “movement of cell or subcellular component” and “circulatory system development” (Figure 3E). This superpathway consisted of four pathways and 459 genes. The fourth superpathway was involved in “positive regulation of macromolecule metabolism”, “mitotic cell cycle phase transition”, “chromosome organization” and “hematopoietic or lymphoid organ development” (Figure 3F). It comprised three pathways and 289 genes. The smallest superpathway was linked to “ferric iron transport”, “immune response”, “phagosome maturation” and “regulation of autophagy” (Figure 3G). It included three pathways and 174 genes. Hereinafter, we refer to these five superpathways as (i) “inflammatory response and cytokines”, (ii) “regulation of the immune system and cell death”, (iii) “cell surface and PI3K signaling”, (iv) “cell cycle” and (v) “phagosome and autophagy”, respectively.
The mean of the median overlap coefficient across all pathways in a superpathway ranged from 4% (“cell cycle”) to 23% (“regulation of the immune system and cell death”), reflecting various levels of cross-talking between the pathways. Between 34% (“inflammatory response and cytokines”) and 43% (“phagosome and autophagy”) of the genes in each superpathway were differentially expressed. From a total of 688 DEGs in any of the five superpathways, the vast majority of DEGs (562, 82%) were upregulated. Moreover, all the pathways involved in the superpathways were upregulated in the sense that they comprised a larger number of upregulated genes than downregulated ones.
In particular, the “regulation of the immune system and cell death” superpathway included the “prostate cancer” pathway. This pathway has 84 gene members, of which 34 (40%) were DEGs. Interestingly, many of those DEGs are also members of three of the remaining four superpathways: 29 of the “inflammatory response and cytokines” superpathway, 27 of the “cell surface and PI3K signaling” superpathway and eight of the “cell cycle” superpathway, confirming its central role in PCa.

2.3. A Framework for Selecting Canine PCa Biomarker Candidates with Clinical Value

Among the 688 DEGs making up the five superpathways, 477 were highly deregulated (see Materials and Methods, Figure 4A), with the vast majority of them (84%) being upregulated. Approximately 90% (428) of the highly deregulated genes were moderately to strongly expressed in one or both sample groups (with median library size-normalized counts above the 40th percentile; see Materials and Methods). These 428 genes are hereinafter referred to as DEGsS (Figure 4A), and represent between 88% and 92% of the highly deregulated genes in each superpathway. Specifically, 65% (276) were members of the “inflammatory response and cytokines” superpathway, 54% (230) of the “regulation of the immune system and cell death” superpathway, 22% (92) of the “cell surface and PI3K signaling” superpathway, 16% (70) of the “cell cycle” superpathway and 12% (52) of the “phagosome and autophagy” superpathway.
Furthermore, of the 4098 DEGs, 602 (15%) were identified in relevant public databases or in the literature, and are hereinafter referred to as DEGsD (Figure 4A). Among them, 328 DEGs were mentioned in the literature in the context of canine or human PCa, 212 were potentially modulated by small molecules (“druggable”), 122 DEGs were proto-oncogenes or tyrosine-protein kinases, 40 DEGs were in human PCa gene assays, 34 were members of the “prostate cancer” pathway, and 31 were relatively specific to the prostate according to the Human Protein Atlas (HPA) database (see Materials and Methods, Figure 4B). Only 20% (123) of the DEGsD were found in two or more of these databases and no DEGD was identified in any of them (Figure 4B). Furthermore, with the exception of the DEGsD in the “prostate cancer” pathway, most DEGsD in a given database were only present in that database. In contrast, the vast majority (76%, 26) of the differentially expressed members of the “prostate cancer” pathway were found in at least another database. Specifically, 25 of the DEGsD in the “prostate cancer” pathway are “druggable” or have been reported in the literature in the context of canine or human PCa. Interestingly, only a few of the assays- (35%, 14) or literature-associated (30%, 100) DEGsD could be linked to other databases.
Among the 602 DEGsD, 169 (28%) were also categorized as strongly deregulated superpathway genes (DEGsS) (Figure 4, Table S1). These 169 genes are hereinafter referred to as DEGsSD (Figure 4A). Most (397) of the remaining 433 DEGsD were moderately to strongly expressed in one or both sample groups and many (272) were highly deregulated; 90 were members of a superpathway (Figure 4B, Table S1). Only one DEGD (pre-rRNA-processing protein TSR1 homolog) did not satisfy any of the criteria used for defining the DEGsS. Among the 169 DEGsSD, 19 were proto-oncogenes (AURKA, CSF1R, EGFR, ETS1, ETV1, FGR, FOS, HCK, KIT, LYN, MECOM, MET, NRAS, PDGFRA, PDGFRB, PTTG1, REL, SPI1, and ZBTB16), nine were relatively specific to the (human) prostate (ARG2, CHRM1, CREB3L4, CXCL10, KLK2, NKX3-1, SLC45A3, SRD5A2 and TMPRSS2), thirteen were orthologs to genes on commercial human PCa multi-gene assays (BUB1B, CDK1, COL1A1, FOS, IQGAP3, KLK2, ORC6, PLK1, PTTG1, RAD51, RRM2, SRD5A2 and THBS2), and 80 were druggable, including 75 (94%) upregulated genes (Figure 4B, Table S1). The orthologs of the genes on commercial human PCa multi-gene assays are associated with cell cycle progression (CDK1, BUB1B, ORC6, RAD51, PLK1, PTTG1 and RRM2), cell proliferation (IQGAP3), stromal response (COL1A1), cell adhesion (THBS2), stress response (FOS), and androgen signaling (KLK2, SRD5A2). Of the 75 upregulated druggable DEGsSD, 15 (BTK, CSF1R, EGFR, EIF2AK2, EPHA2, FGR, HCK, JAK3, KIT, LYN, MET, PDGFRA, PDGFRB, SYK and TEC) encode tyrosine kinases (Table S1). Fifty-eight percent of the 169 DEGsSD have been mentioned in the literature, with 45 DEGsSD being present in at least one additional database (Figure 4B, Table S1). Specifically, half of the “prostate cancer” pathway DEGsSD had previously been referred to in the literature (AR, CDKN1A, CTNNB1, EGFR, KLK2, NKX3-1, PDGFRA, SRD5A2) (Figure 4B, Table S1). The “prostate cancer” pathway also comprises genes that are relatively specific to the (human) prostate (CREB3L4, KLK2, NKX3-1 and SRD5A2), proto-oncogenes (EGFR, NRAS, PDGFRA and PDGFRB), and druggable candidates (CDKN1A, CTNNB1, EGFR, NRAS, PDGFRA, PDGFRB, PIK3CD and PIK3CG) (Figure 4B, Table S1).

2.4. The Gene Network of 602 DEGsD Form a Tightly Interconnected Gene Network Intertwined with the “Prostate Cancer” Pathway

The PPI network of the 602 DEGsD revealed 5151 interactions (pvalue 1.0 × 10⁻¹⁶), with each protein in the network exhibiting an average of 17 interactions (Figure S2). The transcription factor encoded by TP53 had the largest number of interactions (103) (Table S1). The proteins of 95 genes exhibited more than 17 interactions and considered hubs (Figure S2, Table S1). Among them, 65 corresponded to members of the superpathway (Table S1).
Interestingly, eleven hubs were members of the “prostate cancer” pathway; these hubs interacted with almost one third (178) of the 602 DEGsD. Moreover, 30 of the interaction partners of the eleven hubs that were members of the “prostate cancer” pathway were, in turn, hubs. Together, these 41 genes included members from all five superpathways, emphasizing the relevance of the “prostate cancer” pathway. Indeed, of the eight pathways that are known to actively cross-talk with the “prostate cancer” pathway (Figure 5), five were tightly connected to four of our superpathways. In particular, the “cytokine-cytokine receptor interaction” pathway is represented by the “inflammatory response and cytokines” superpathway. Similarly, the “PI3K-Akt signaling” pathway is represented by the “cell surface and PI3K signaling” superpathway. Finally, the “cell cycle”, “p53 signaling pathway” and “transcriptional misregulation in cancer” pathways are represented by the “cell cycle” superpathway. As observed for all other deregulated pathways, most (21, 62%) of the DEGs in the “prostate cancer” pathway were upregulated. Nevertheless, AR, the gene encoding the hub with the second largest number of interactions (36) among those in the “prostate cancer” pathway, was strongly downregulated (log2 fold-change −3.5).

3. Discussion

In contrast to its human counterpart, canine PCa is usually detected at relatively late stages [5,7]. In addition, there is no comprehensive marker set available for routine diagnostics and treatment success rates are low [2,20]. These observations point both to the need for a better understanding of the molecular mechanisms underlying canine PCa and more effective therapeutic and prognostic strategies. In our study, we applied RNA-Seq to characterize the transcriptional landscape of canine PCa as well as presenting a framework to prioritize PCa biomarker candidates to address different clinical questions. Furthermore, we integrated clinical and bioinformatic data analysis to systematically characterize the genes that are differentially expressed between malignant and nonmalignant canine prostate samples. Such multidisciplinary approaches have recently been highlighted as being of particular importance in veterinary medicine [30].

3.1. Five Superpathways Provide a Comprehensive Insight into the Hallmarks of Canine PCa

We were able to identify five superpathways as hallmarks of canine PCa. These superpathways summarize the essential features of the 49 pathways that were found to be deregulated in canine PCa and encapsulate the complex interactions between the tumor, its environment and the immune system. In addition to providing a comprehensive, integrative and robust approach to understand PCa biology, the superpathways open up avenues for developing new diagnostic tests and therapeutic approaches.
The transcriptional changes observed in canine PCa largely involve pathways that are relevant to the immune and inflammation responses, particularly represented by the “inflammatory response and cytokines” and “regulation of the immune system and cell death” superpathways. Indeed, the cytokine and chemokine network has been reported to support tumor development by initiating tumor growth and angiogenesis [42,43]. In addition, three of the five superpathways (“inflammatory response and cytokines”, “regulation of the immune system and cell death” and “cell surface and PI3K signaling”) reflect changes in cell adhesion molecules. Generally, cell adhesion molecules are involved in cell-to-cell and cell-to-extracellular matrix (ECM) adhesion [44] and, consequently, are important for tissue architecture [45]. Consistently, cell adhesion molecules play a decisive role in tumor invasiveness and dissemination [45,46]. As such, they are of potential prognostic value. The environment that contributes to the survival and progression of the tumor is composed largely of the ECM, inflammatory and endothelial cells and fibroblasts [47]. Therefore, the three aforementioned superpathways could provide insights into the mechanisms leading to metastasis of canine PCa.
Apart from its aforementioned role in inflammation, the “regulation of the immune system and cell death” superpathway largely involves genes such as collagen, integrin and matrix metalloproteinases, which are also involved in tissue remodeling in the canine prostate, particularly as part of the ECM or associated therewith [48]. In dogs, physiological alterations of the tissue structure depend on age, hormonal influence and neutering status [49]. Moreover, molecular profiling has also been deemed helpful for classifying prostatic lesions such as proliferative inflammatory atrophies and prostatic intraepithelial neoplasia [9]. Thus, the activation state of the superpathways, including genes associated with tissue remodeling, could be used to support clinicopathological findings in canine PCa.
In addition to being linked to cell adhesion, the “cell surface and PI3K signaling” superpathway provides insights into the activation state of the PI3K-AKT signaling pathway. This pathway has been implicated in the development of human castration-resistant PCa [50,51] and is the focus of ongoing research on pathway-specific inhibitors for this condition [52]. Current research encourages targeting PI3K signaling in combination with other compounds [53]. Several therapeutic interventions are evaluated in murine xenograft in vivo models providing valuable data [54,55,56]. Nonetheless, these models are rarely able to mimic PCa biology as closely as canine PCa is able to [3,7,8]. Therefore, the “cell surface and PI3K signaling” superpathway offers the possibility of evaluating the efficiency of these combinations in canine PCa delivering superior in vivo data, further underlining the relevance of the dog as a biological model for human PCa.
The “cell cycle” superpathway represents another hallmark of canine PCa. Among others, it encompasses cyclines and transcription factors that control mitosis and mediate mechanisms that are central for the balance between cell growth and death [57,58]. The potential of cell cycle genes as diagnostic biomarkers for canine PCa is supported by their use in human PCa multi-gene assays [59,60].
Finally, the smallest superpathway is associated with phagosome and autophagy. Autophagy has been repeatedly associated with the castration-resistant state of human PCa and has been linked to the emergence of therapeutic resistance [61]. This is particularly relevant to canine PCa, for which therapeutic options are limited [2].
Together, the five superpathways encapsulate the complex and cross-talking gene network of canine PCa and facilitate its molecular analysis.

3.2. Database-Associated Strongly Deregulated Superpathway Genes Are Reliable Biomarker Candidates for the Diagnostic and Therapeutic Work-Up

High-throughput data mining has great potential for discovering novel PCa biomarkers [35]. Our multi-step RNA-Seq screening identified 428 strongly deregulated superpathway genes (DEGsS) and 602 database-associated deregulated genes (DEGsD). A total of 169 genes were common to both gene sets, i.e., database-associated strongly deregulated superpathway genes (DEGsSD). While the DEGsS meet statistically stringent criteria, the DEGsD reflect the state-of-the-art knowledge of PCa in different databases and in the literature. The DEGsSD meet both sets of criteria, thus offering a portfolio of most promising biomarker candidates to design, prioritize, implement and manage research programs addressing diverse clinical questions in canine PCa.
The strongest PCa biomarker candidates are the 16 DEGsSD that are members of the “prostate cancer” pathway. These genes provide a basic but comprehensive understanding of the fundamental biological processes deregulated in canine PCa. Indeed, the 16 genes encompass genes of four of the five superpathways (all except for the “phagosome and autophagy” superpathway) and are present in multiple databases. Furthermore, half of the “prostate cancer” pathway DEGsSD are well described in the PCa literature (AR, CDKN1A, CTNNB1, EGFR, KLK2, NKX3-1, PDGFRA, SRD5A2), confirming that this is a pivotal pathway to specifically target clinical questions on canine PCa. Finally, the “prostate cancer” pathway also includes DEGsSD that are relatively specific to the (human) prostate (SRD5A2, KLK2, NKX3-1 and CREB3L4), proto-oncogenes (EGFR, PDGFRA, PDGFRB, NRAS) and druggable candidates (PIK3CD, CTNNB1, PIK3CG, CDKN1A). Notably, the “prostate cancer” pathway comprises KLK2, the most strongly downregulated DEGSD (log2 fold-change −12.6). KLK2 is of particular interest because it has a one-to-many orthologous relationship to human KLK3, the gene encoding the PSA [23]. Nevertheless, it is worth noticing that, in contrast to human PSA, KLK2 was down-regulated in our study and that the serum levels of CPSE, the protein encoded by KLK2, have been reported to exhibit the same trend [25]. Beyond the use of the kallikrein members as diagnostic markers for human PCa [62], the kallikrein network is involved in a variety of processes potentially driving tumor progression [63]. Hence, the down-regulation of KLK2 could still be of diagnostic or therapeutic significance. Supporting the role of kallikrein members in canine PCa, we also identified KLK4, another member of the kallikrein family, as down-regulated. The role of KLK2 and KLK4 in canine PCa certainly warrants further investigation.
Thirteen DEGsSD are the canine orthologs of genes used in human commercial PCa multi-gene assays. This is of peculiar importance because there is a possibility to rapidly adapt molecular screening assays used in humans for use in dogs. Strikingly, these 13 DEGsSD encompass genes of all five superpathways and, hence, represent the disease hallmarks of canine PCa in a comprehensive manner. Moreover, the 13 DEGsSD could be used to systematically evaluate the dog as a model for human PCa.
Two additional groups of genes that could complement the aforementioned ones as diagnostic biomarkers for canine PCa are prostate-specific genes and oncogenes. Overall, we were able to assign nine DEGsSD as being relatively specific to the (human) prostate, and hence, as potential specific markers for the canine prostate. In the diagnosis of human PCa, specific markers are utilized in immunohistochemistry to confirm the prostate origin of the sample [64,65]. On the other hand, oncogenes are known to be pivotal for tumorigenesis [47]. In human castration-resistant PCa, oncogenes have been suggested to control a variety of pathways [66] and shown to activate the tyrosine kinase network [67].
Furthermore, we identified several DEGsSD that bear the potential to improve and scale up the use of chemotherapeutic agents and molecularly targeted therapeutic strategies for canine PCa. Notably, 17 upregulated DEGsSD encode tyrosine protein kinases. Tyrosine kinases have become the subject of growing attention in veterinary medicine regarding molecular targeted therapies [68]. In particular, the two tyrosine kinase inhibitors (TKIs), toceranib and masitinib, have been approved as molecular targeted therapies for canine patients [68]. Among other receptor tyrosine kinases, toceranib and masitinib both target the tyrosine kinase KIT [69,70,71], which has been frequently described as a prognostic marker and therapy target, especially in canine mast cell tumor [72]. KIT was a strongly upregulated DEGSD (log2 fold-change 4.1). Previous findings on the canine prostate indicate that samples with a high Gleason score are positive for immunoexpression of c-kit [11]. Therefore, such cases could benefit from the use of a TKI. Whether the dog can provide additional therapeutic insights for human PCa still needs to be evaluated.
In addition to the aforementioned therapeutic potential, some DEGsSD have prognostic value. For example, high levels of the multi-resistant p-glycoprotein ABCB1 (also known as MDR1) have been associated with ABC-protein-mediated chemotherapeutic resistance of tumor cells [73] and may explain the limited efficacy of doxorubicin on canine PCa cell lines [74]. Current therapeutic options for canine PCa are limited [2]. The data presented here provide an illustration of how our RNA-Seq data may contribute to the development of new therapeutic strategies to improve treatment outcome.

3.3. Database-Associated Deregulated Genes Such as TP53, MYC and AR Are Crucial to Complement the DEGsSD and Tackle Clinically Relevant Questions

To date, 433 DEGs are present in public databases [40,75,76,77] or have been reported in the literature [59,60,78] and are therefore DEGsD but did not satisfy the criteria of the DEGsS. Some of these genes have been extensively evaluated and characterized in both canine and human PCa. The most noteworthy among them is perhaps TP53. TP53 is a druggable member of the “prostate cancer” pathway that has been frequently reported in the literature as pivotal in the tumorigenesis of canine PCa [79]. Consistent with this hypothesis, we found that TP53 has the largest number of interactions within the deregulated gene network of canine PCa. However, it was only moderately deregulated (log2 fold-change 1.1) between malignant and nonmalignant canine prostate samples. Similarly, MYC is a druggable proto-oncogene frequently discussed in the literature [80] but was only moderately deregulated (log2 fold-change 1.5). Such examples demonstrate the importance of the DEGsD as complement of the DEGsSD to customize and target different aspects of canine PCa.
Ultimately, a panel combining DEGsSD and DEGsD appears as the most appealing option to tackle unanswered questions on the hormonal axis in canine PCa. In dogs as in humans, steroid hormones such as androgens and estrogens generally affect the prostate gland development and functionality [7,81,82], which is why their deregulation is expected to have a major impact. Indeed, almost all human PCas are acknowledged to begin in an androgen-dependent state in which androgen deprivation therapies are standard and have proven effective [83]. In contrast, androgen deprivation therapies are not successful in dogs [84]. In this context, we found that 16 DEGsSD (BRCA1, CASP8, CAV1, CDC6, CDK1, CTNNB1, E2F1, EGFR, ETV1, KLK2, KPNA2, NKX3-1, PROM1, RUNX2, SLC45A3, TMPRSS2) and 20 DEGsD (AREG, CAPZA1, EZH2, FOLH1, FOXA1, GEN1, HSP90B1, IL6, KLF4, KLK4, KRAS, KRT5, MAPK14, MKI67, MYC, NCOA1, NR3C1, TNF, TNK2, UBE2C) are direct interaction partners of the AR. Although the majority of the direct interaction partners of the AR were upregulated, the AR itself was downregulated. This might be due to differences in the number of castrated dogs between the malignant (7/10) and the nonmalignant (0/14) sample groups. Nevertheless, our observations are supported by a recent study suggesting that canine PCa is associated with loss of AR expression [82,85]. In addition, we found that the estrogen receptor 2 (ESR2) and the steroid 5 alpha-reductases 1 and 2 (SRD5A1 and SRD5A2) were downregulated. SRD5A1 and SRD5A2 encode the 5α-reductases, which are involved in the transformation of testosterone to 5α-dihydrotestosterone [86] and, like estrogens, actively regulate the size of the prostate [81,82]. DEGsSD such as NKX3-1 and KLK2 and also DEGsD such as ACPP (also known as PAP) and FOLH1 are among other genes known to be regulated by the AR and, thus, presumably relevant to the hormonal axis of canine PCa. Therefore, we found that the tumor suppressor NKX3-1 was strongly downregulated in the malignant sample group (log2 fold-change −9.8). This result is in agreement with previous research on progressive canine PCa [80]. Moreover, NKX3-1 has been recommended as a marker to determine prostatic origin of metastatic tumors [87]. We also observed that ACPP was strongly downregulated (log2 fold-change −5.1). ACPP encodes a prostate-specific acid phosphatase that is orthologous to a human prostate-specific tumor suppressor [88] reported to be affected by the exposure to androgens in human PCa [89]. Consistent with a tumor suppressor role for ACPP in the canine prostate, positive immunostaining of prostate-specific acid phosphatase has been associated with normal prostatic acinar tissues in dogs [90]. In contrast, we observed that FOLH1 was strongly upregulated (log2 fold-change 4.0) in the malignant sample group. FOLH1 encodes the prostate-specific membrane antigen (PSMA) that is orthologous to an androgen-repressed gene in human PCa [91]. This is in agreement with our findings and research from others, who detected that FOLH1 is expressed in AR-negative canine PCa cells [92]. Overall, these examples demonstrate the complex gene interactions that need to be understood to answer clinical questions and further compare human and canine PCa.

4. Materials and Methods

4.1. Ethical Statement and Sampling of Fresh Frozen Prostate Tissue and FNA Samples

In the present study, a subset of samples was analyzed (Figure 1), which was previously used to evaluate similarities and differences at gene expression level, comparing FNA samples with fresh frozen canine prostate tissues [37]. Samples used in the present study were collected in agreement with the owners. None of the dogs were euthanized due to reasons of sample collection. Aspirates of the canine prostate collected by ultrasound-guided FNA were obtained at the Small Animal Clinic of the University of Veterinary Medicine Hannover, Foundation (Germany) in accordance with the German Animal Welfare Guidelines, approved by the Ethics Committee of the State of Lower Saxony, Germany (No. 14/1700).

4.2. Data Processing and Differential Gene Expression Analysis

Raw sequencing reads were obtained from the Gene Expression Omnibus database (GSE122916) [37,93]. One sample (US-3) was excluded from the analysis. The malignant sample group comprised nine fresh frozen prostate tissues and one aspirate collected using the ultrasound-guided FNA technique. Nonmalignant samples of the canine prostate were used as control, including nine fresh frozen tissue samples and five FNA samples. The diagnosis of the fresh frozen tissue samples was based on histopathological examination, while the samples collected by FNA were examined cytologically (Figure 1) [37]. Quality control of raw sequencing reads were initially performed with FastQC [94]. Raw reads were mapped to the dog CanFam3.1 reference genome assembly and annotation of the Ensembl database (version 94, [95]) using STAR (version 2.5.0) [96] with parameters “--sjdbGTFfile Canis_familiaris.CanFam3.1.94.gtf --sjdbOverhang 70 --quantMode TranscriptomeSAM GeneCounts --quantTranscriptomeBan IndelSoftclipSingleend”, where “Canis_familiaris.CanFam3.1.94.gtf” is the genome annotation downloaded from the Ensembl database (http://ftp.ensembl.org/pub/release-94/gtf/canis_familiaris/Canis_familiaris.CanFam3.1.94.gtf.gz, last accessed on 18 October 2021). Count data for Ensembl identifiers were normalized for multiple testing with the R/Bioconductor package DESeq2 [97], and differentially expressed genes (DEGs) were identified. Genes with a false discovery rate (FDR) ≤ 1 × 10⁻⁵ were considered to be differentially expressed. Ensembl Compara [98] was used to identify homo sapiens (hsa) orthologs to canis lupus familiaris (cfa) genes, and thus improve the limited annotation of the dog genome [30].

4.3. Pathway Enrichment and Functional Analysis

Pathway enrichment and functional analysis of DEGs were performed with DAVID (Database for annotation, visualization and integrated discovery tool) [38] based on the KEGG_PATHWAY (Kyoto Encyclopedia of Genes and Genomes) [40] and GOTERM_BP_FAT (Gene Ontology Biological Processes). The cut-off for statistical significance was an FDR of less than or equal to 5%. The analyses were performed for the human orthologs of the canine genes, which were retrieved using Ensembl Biomart (version 94) [99]. The background for the analysis was the set of 19,324 human genes that were reported as orthologs of one or more canine genes by Ensembl Biomart. Enriched GOTERM_BP_FAT terms were summarized with REVIGO (Reduce + Visualize Gene Ontology) [39].

4.4. Pathway Cross-Talk

Cross-talk between the KEGG pathways that were enriched among the differentially expressed genes was quantified based on their gene overlap. Specifically, we computed the overlap coefficient between all pairs of pathways. Then, we hierarchically clustered the pathways using the complete linkage algorithm based on a distance defined as 1 minus the overlap coefficient. KEGG pathway annotation for each gene was retrieved from DAVID [38].

4.5. Multi-Step Screening for Canine PCa Biomarker Candidates

A multi-step screening approach was used for identification of “strongly deregulated superpathway genes” (DEGsS) and “database-associated deregulated genes” (DEGsD). A gene was a DEGS (Figure 1) if (i) its base-2 logarithm (log2) fold-change was smaller than −2 or larger than 2; (ii) its normalized count was above the 40th percentile in at least one of the sample groups; and (iii) it was a member of the superpathway (i.e., a member of one of its constituent KEGG pathways).
A gene was a DEGD (Figure 1) if (i) it was enriched (11), group enriched (25), and/or elevated (84) in the prostate according the human protein atlas (https://www.proteinatlas.org/humanproteome/tissue/prostate, last accessed on 18 October 2021 [75]); (ii) it was a member of the KEGG “prostate cancer” pathway (cfa05215, [40]); (iii) it was a proto-oncogene (keyword:”Proto-oncogene [KW-0656]” AND organism:”Homo sapiens (Human) [9606]”) or a tyrosine-protein kinase (keyword:”Tyrosine-protein kinase [KW-0829]” AND reviewed:yes AND organism:”Homo sapiens (Human) [9606]”) in the UniProt keyword database (https://www.uniprot.org/, last accessed on 18 October 2021 [76]); (iv) it was reported by PubMed (https://www.ncbi.nlm.nih.gov/pubmed/, last accessed on 18 October 2021) literature mining ((dogs[MeSH Terms]) AND prostatic neoplasms[MeSH Terms] AND biomarkers[MeSH Terms]) OR (canine[TIAB] OR dog[TIAB] AND prostate cancer[TIAB]) between 2015–2020 and additional manual curation of “canine prostate”; (v) the tissue-based human PCa multi-gene assays Oncotype, Prolaris, and Decipher [36,59,60,78]; and (vi) analyzed on drug-gene interactions using the Drug-Gene Interaction Database with official gene names and the filter “FDA approved”, “antineoplastics” and “immunotherapies” [77]. DEGs that were assigned to at least one of the aforementioned criteria were designated as database-associated DEGsD. DEGsD that additionally matched the criteria as DEGsS were termed as “database-associated strongly deregulated superpathway genes” (DEGsSD).

4.6. PPI Network Construction and Identification of Hub Genes

The Search Tool for the Retrieval of Interacting Genes/Proteins (STRING) database, version 11.0 [100], was employed to construct a protein–protein interaction network (PPI) for the 602 genes in either DEGS and/or DEGD. PPIs with a confidence greater than 0.4 were considered reliable. DEGs of the “prostate cancer” pathway and associated level of deregulation were visualized using the Pathview Web tool [41].

5. Conclusions

In conclusion, to the best of our knowledge, this is the first tissue- and biopsy-based study comparatively characterizing the transcriptional landscape of canine PCa samples and samples of nonmalignant origin. In addition to identifying five superpathways encapsulating the hallmarks of canine PCa, we provide a framework for prioritizing candidate canine PCa biomarkers for different purposes. It is noteworthy that KLK2 featured recurring significantly in our assessment: it is the most strongly downregulated DEGSD, a member of the “prostate cancer” pathway, a putative prostate-specific marker and it is involved in the hormonal axis of PCa. Although further studies are necessary to confirm KLK2 as a clinical marker, KLK2 illustrates the importance of integrating clinical information such as medical history, age, hormonal status and cytological or histopathological diagnosis with molecular biological information. In summary, our data are a valuable resource for the diagnostic, prognostic, and/or therapeutic work-up of canine PCa, and an orientation for further gene expression studies, such as targeted NGS or qPCR screenings.

Supplementary Materials

The following are available online at https://www.mdpi.com/article/10.3390/ijms222111481/s1.

Author Contributions

Conceptualization, H.T., I.N. and H.M.E.; methodology, H.T., L.T., M.H.-T., B.B., E.S., J.B. and H.M.E.; software, L.T., B.B., E.S. and J.B.; validation, H.T. and L.T.; formal analysis, H.T., L.T. and J.B.; investigation, H.T., L.T., E.-M.P., J.T.S., M.H.-T., J.B. and H.M.E.; resources, L.T., M.H.-T., B.B., E.S., J.B., I.N. and H.M.E.; data curation, H.T., L.T. and J.B.; writing—original draft preparation, H.T. and L.T.; writing—review and editing, E.-M.P., J.T.S., L.K.H., M.H.-T., B.B., E.S., J.B., I.N. and H.M.E.; visualization, H.T. and L.T.; supervision, I.N. and H.M.E.; project administration, L.T., L.K.H., I.N. and H.M.E. All authors have read and agreed to the published version of the manuscript.

Funding

This research received no external funding.

Institutional Review Board Statement

In the present study, a subset of samples was analyzed, which was previously used to evaluate similarities and differences at gene expression level, comparing FNA samples with fresh frozen canine prostate tissues [37]. Samples used in the present study were collected in agreement with the owners. None of the dogs were euthanized due to reasons of sample collection. Aspirates of the canine prostate collected by ultrasound-guided FNA were obtained at the Small Animal Clinic of the University of Veterinary Medicine Hannover, Foundation (Germany) in accordance with the German Animal Welfare Guidelines, approved by the Ethics Committee of the State of Lower Saxony, Germany (No. 14/1700).

Informed Consent Statement

Not applicable.

Data Availability Statement

The dataset analyzed in this study is openly available in the Gene Expression Omnibus database (https://www.ncbi.nlm.nih.gov/geo/, last accessed on 18 October 2021), accession GSE122916.

Conflicts of Interest

The authors declare no conflict of interest.

References

  1. Waters, D.J.; Patronek, G.J.; Bostwick, D.G.; Glickman, L.T. Comparing the Age at Prostate Cancer Diagnosis in Humans and Dogs. J. Natl. Cancer Inst. 1996, 88, 1686–1687. [Google Scholar] [CrossRef] [Green Version]
  2. Schrank, M.; Romagnoli, S. Prostatic Neoplasia in the Intact and Castrated Dog: How Dangerous is Castration? Animals 2020, 10, 85. [Google Scholar] [CrossRef] [Green Version]
  3. Waters, D.J.; Sakr, W.A.; Hayden, D.W.; Lang, C.M.; McKinney, L.; Murphy, G.P.; Radinsky, R.; Ramoner, R.; Richardson, R.C.; Tindall, D.J. Workgroup 4: Spontaneous prostate carcinoma in dogs and nonhuman primates. Prostate 1998, 36, 64–67. [Google Scholar] [CrossRef]
  4. Gamlem, H.; Nordstoga, K.; Glattre, E. Canine neoplasia–introductory paper. Apmis 2008, 116, 5–18. [Google Scholar] [CrossRef] [PubMed]
  5. Leroy, B.E.; Northrup, N. Prostate cancer in dogs: Comparative and clinical aspects. Vet. J. 2009, 180, 149–162. [Google Scholar] [CrossRef]
  6. Palmieri, C.; Lean, F.; Akter, S.; Romussi, S.; Grieco, V. A retrospective analysis of 111 canine prostatic samples: Histopathological findings and classification. Res. Veter. Sci. 2014, 97, 568–573. [Google Scholar] [CrossRef]
  7. Sun, F.; Báez-Díaz, C.; Sánchez-Margallo, F.M. Canine prostate models in preclinical studies of minimally invasive interventions: Part I, canine prostate anatomy and prostate cancer models. Transl. Androl. Urol. 2017, 6, 538. [Google Scholar] [CrossRef] [PubMed] [Green Version]
  8. Fonseca-Alves, C.E.; Vicente, I.; Calazans, S.G.; Amorim, R.L. Canine Prostate Cancer: Would the Dog be an Important Model for the Study of New Drugs? Am. J. Drug Discov. Dev. 2013, 3, 220–224. [Google Scholar] [CrossRef] [Green Version]
  9. Palmieri, C.; Foster, R.; Grieco, V.; Fonseca-Alves, C.; Wood, G.; Culp, W.; Escobar, H.M.; De Marzo, A.; Laufer-Amorim, R. Histopathological Terminology Standards for the Reporting of Prostatic Epithelial Lesions in Dogs. J. Comp. Pathol. 2019, 171, 30–37. [Google Scholar] [CrossRef] [PubMed]
  10. Kobayashi, P.E.; Fonseca-Alves, C.E.; Rivera-Calderón, L.G.; Carvalho, M.; Kuasne, H.; Rogatto, S.; Laufer-Amorim, R. Deregulation of E-cadherin, β-catenin, APC and Caveolin-1 expression occurs in canine prostate cancer and metastatic processes. Res. Veter. Sci. 2018, 118, 254–261. [Google Scholar] [CrossRef] [Green Version]
  11. Fonseca-Alves, C.E.; Kobayashi, P.E.; Palmieri, C.; Laufer-Amorim, R. Investigation of c-KIT and Ki67 expression in normal, preneoplastic and neoplastic canine prostate. BMC Veter. Res. 2017, 13, 380. [Google Scholar] [CrossRef] [Green Version]
  12. Winkler, S.; Escobar, H.M.; Meyer, B.; Simon, D.; Eberle, N.; Baumgartner, W.; Loeschke, S.; Nolte, I.; Bullerdiek, J. HMGA2 expression in a canine model of prostate cancer. Cancer Genet. Cytogenet. 2007, 177, 98–102. [Google Scholar] [CrossRef] [PubMed]
  13. Leroy, B.E.; Nadella, M.V.P.; Toribio, R.E.; Leav, I.; Rosol, T.J. Canine Prostate Carcinomas Express Markers of Urothelial and Prostatic Differentiation. Veter. Pathol. 2004, 41, 131–140. [Google Scholar] [CrossRef] [PubMed]
  14. Moulay, M.; Liu, W.; Willenbrock, S.; Sterenczak, K.A.; Carlson, R.; Ngezahayo, A.; Escobar, H.M.; Nolte, I. Evaluation of stem cell marker gene expression in canine prostate carcinoma- and prostate cyst-derived cell lines. Anticancer. Res. 2013, 33, 5421–5431. [Google Scholar]
  15. Lai, C.-L.; Ham, R.V.D.; van Leenders, G.; van der Lugt, J.; Mol, J.A.; Teske, E. Histopathological and immunohistochemical characterization of canine prostate cancer. Prostate 2008, 68, 477–488. [Google Scholar] [CrossRef]
  16. Rivera-Calderón, L.G.; Fonseca-Alves, C.E.; Kobayashi, P.E.; Carvalho, M.; Drigo, S.A.; Vasconcelos, R.D.O.; Laufer-Amorim, R. Alterations in PTEN, MDM2, TP53 and AR protein and gene expression are associated with canine prostate carcinogenesis. Res. Veter. Sci. 2016, 106, 56–61. [Google Scholar] [CrossRef] [Green Version]
  17. Kobayashi, M.; Saito, A.; Tanaka, Y.; Michishita, M.; Kobayashi, M.; Irimajiri, M.; Kaneda, T.; Ochiai, K.; Bonkobara, M.; Takahashi, K.; et al. MicroRNA expression profiling in canine prostate cancer. J. Veter. Med Sci. 2017, 79, 719–725. [Google Scholar] [CrossRef] [Green Version]
  18. Calderón, L.G.R.; Fonseca-Alves, C.E.; Kobayashi, P.E.; Carvalho, M.; Vasconcelos, R.; Laufer-Amorim, R. p-mTOR, p-4EBP-1 and eIF4E expression in canine prostatic carcinoma. Res. Veter. Sci. 2018, 122, 86–92. [Google Scholar] [CrossRef]
  19. Fonseca-Alves, C.E.; Kobayashi, P.E.; Laufer-Amorim, R. Evaluation of NKX3.1 and C-MYC expression in canine prostatic cancer. Res. Veter. Sci. 2018, 118, 365–370. [Google Scholar] [CrossRef] [Green Version]
  20. Gobello, C.; Castex, G.; Corrada, Y. Serum and seminal markers in the diagnosis of disorders of the genital tract of the dog: A mini-review. Theriogenology 2002, 57, 1285–1291. [Google Scholar] [CrossRef]
  21. Hatakeyama, S.; Yoneyama, T.; Tobisawa, Y.; Ohyama, C. Recent progress and perspectives on prostate cancer biomarkers. Int. J. Clin. Oncol. 2016, 22, 214–221. [Google Scholar] [CrossRef] [PubMed] [Green Version]
  22. Elliott, M.B.; Irwin, D.M.; Diamandis, E.P. In silico identification and Bayesian phylogenetic analysis of multiple new mammalian kallikrein gene families. Genomics 2006, 88, 591–599. [Google Scholar] [CrossRef] [PubMed] [Green Version]
  23. Chapdelaine, P.; Gauthier, E.; Ho-Kim, M.A.; Bissonnette, L.; Tremblay, R.R.; Dubé, J.Y. Characterization and Expression of the Prostatic Arginine Esterase Gene, a Canine Glandular Kallikrein. DNA Cell Biol. 1991, 10, 49–59. [Google Scholar] [CrossRef] [PubMed]
  24. Alonge, S.; Melandri, M.; Aiudi, G.; Lacalandra, G.M. Advances in prostatic diagnostics in dogs: The role of Canine Prostatic Specific Esterase (CPSE) in the early diagnosis of prostatic disorders. Top. Companion Anim. Med. 2018, 33, 105–108. [Google Scholar] [CrossRef]
  25. Bell, F.W.; Klausner, J.S.; Hayden, D.W.; Lund, E.M.; Liebenstein, B.B.; Feeney, D.A.; Johnston, S.D.; Shivers, J.L.; Ewing, C.M.; Isaacs, W.B. Evaluation of Serum and Seminal Plasma Markers in the Diagnosis of Canine Prostatic Disorders. J. Veter. Intern. Med. 1995, 9, 149–153. [Google Scholar] [CrossRef]
  26. Melandri, M.; Alonge, S. Highlights on the Canine Prostatic Specific Esterase (CPSE): A diagnostic and screening tool in veterinary andrology. Veter. Med. Sci. 2020, 7, 35–40. [Google Scholar] [CrossRef]
  27. Palmieri, C.; Grieco, V. Proposal of Gleason-like grading system of canine prostate carcinoma in veterinary pathology practice. Res. Veter. Sci. 2015, 103, 11–15. [Google Scholar] [CrossRef] [PubMed] [Green Version]
  28. Tolkach, Y.; Kristiansen, G. The Heterogeneity of Prostate Cancer: A Practical Approach. Pathobiology 2018, 85, 108–116. [Google Scholar] [CrossRef]
  29. Salami, S.S.; Hovelson, D.H.; Kaplan, J.B.; Mathieu, R.; Udager, A.M.; Curci, N.E.; Lee, M.; Plouffe, K.R.; De La Vega, L.L.; Susani, M.; et al. Transcriptomic heterogeneity in multifocal prostate cancer. JCI Insight 2018, 3. [Google Scholar] [CrossRef]
  30. Katogiritis, A.; Khanna, C. Towards the Delivery of Precision Veterinary Cancer Medicine. Veter. Clin. N. Am. Small Anim. Pr. 2019, 49, 809–818. [Google Scholar] [CrossRef]
  31. Laufer-Amorim, R.; Fonseca-Alves, C.E.; Villacis, R.; Linde, S.A.D.; Carvalho, M.; Larsen, S.J.; Marchi, F.A.; Rogatto, S.R. Comprehensive Genomic Profiling of Androgen-Receptor-Negative Canine Prostate Cancer. Int. J. Mol. Sci. 2019, 20, 1555. [Google Scholar] [CrossRef] [PubMed] [Green Version]
  32. Klopfleisch, R.; Gruber, A.D. Transcriptome and proteome research in veterinary science: What is possible and what questions can be asked? Sci. World J. 2012, 2012, 254962. [Google Scholar] [CrossRef] [Green Version]
  33. Cieślik, M.; Chinnaiyan, A.M. Cancer transcriptome profiling at the juncture of clinical translation. Nat. Rev. Genet. 2017, 19, 93–109. [Google Scholar] [CrossRef]
  34. Rajan, P.; Stockley, J.; Sudbery, I.M.; Fleming, J.T.; Hedley, A.; Kalna, G.; Sims, D.; Ponting, C.P.; Heger, A.; Robson, C.N.; et al. Identification of a candidate prognostic gene signature by transcriptome analysis of matched pre- and post-treatment prostatic biopsies from patients with advanced prostate cancer. BMC Cancer 2014, 14, 977. [Google Scholar] [CrossRef] [PubMed] [Green Version]
  35. Hudson, B.D.; Kulp, K.S.; Loots, G. Prostate cancer invasion and metastasis: Insights from mining genomic data. Briefings Funct. Genom. 2013, 12, 397–410. [Google Scholar] [CrossRef] [Green Version]
  36. Na, R.; Wu, Y.; Ding, Q.; Xu, J. Clinically available RNA profiling tests of prostate tumors: Utility and comparison. Asian J. Androl. 2016, 18, 575–579. [Google Scholar] [CrossRef] [PubMed]
  37. Thiemeyer, H.; Taher, L.; Schille, J.T.; Harder, L.; Hungerbuehler, S.O.; Mischke, R.; Hewicker-Trautwein, M.; Kiełbowicz, Z.; Brenig, B.; Schütz, E.; et al. Suitability of ultrasound-guided fine-needle aspiration biopsy for transcriptome sequencing of the canine prostate. Sci. Rep. 2019, 9, 1–14. [Google Scholar] [CrossRef] [PubMed]
  38. Huang, D.W.; Sherman, B.T.; Lempicki, R.A. Systematic and integrative analysis of large gene lists using DAVID bioinformatics resources. Nat. Protoc. 2009, 4, 44–57. [Google Scholar]
  39. Supek, F.; Bošnjak, M.; Škunca, N.; Smuc, T. REVIGO Summarizes and Visualizes Long Lists of Gene Ontology Terms. PLoS ONE 2011, 6, e21800. [Google Scholar] [CrossRef] [Green Version]
  40. Ogata, H.; Goto, S.; Sato, K.; Fujibuchi, W.; Bono, H.; Kanehisa, M. KEGG: Kyoto Encyclopedia of Genes and Genomes. Nucleic Acids Res. 1999, 27, 29–34. [Google Scholar] [CrossRef] [Green Version]
  41. Luo, W.; Pant, G.; Bhavnasi, Y.K.; Blanchard, S.G., Jr.; Brouwer, C. Pathview Web: User friendly pathway visualization and data integration. Nucleic Acids Res. 2017, 45, W501–W508. [Google Scholar] [CrossRef]
  42. Vindrieux, D.; Escobar, P.; Lazennec, G. Emerging roles of chemokines in prostate cancer. Endocrine-Related Cancer 2009, 16, 663–673. [Google Scholar] [CrossRef] [Green Version]
  43. Raposo, T.; Beirão, B.; Pang, L.; Queiroga, F.; Argyle, D. Inflammation and cancer: Till death tears them apart. Veter. J. 2015, 205, 161–174. [Google Scholar] [CrossRef] [PubMed]
  44. Hanahan, D.; Coussens, L.M. Accessories to the Crime: Functions of Cells Recruited to the Tumor Microenvironment. Cancer Cell 2012, 21, 309–322. [Google Scholar] [CrossRef] [PubMed] [Green Version]
  45. Corn, P.G. The tumor microenvironment in prostate cancer: Elucidating molecular pathways for therapy development. Cancer Manag. Res. 2012, 4, 183–193. [Google Scholar] [CrossRef] [Green Version]
  46. Shiao, S.L.; Chu, G.C.-Y.; Chung, L.W. Regulation of prostate cancer progression by the tumor microenvironment. Cancer Lett. 2016, 380, 340–348. [Google Scholar] [CrossRef] [PubMed] [Green Version]
  47. Hanahan, D.; Weinberg, R.A. Hallmarks of Cancer: The Next Generation. Cell 2011, 144, 646–674. [Google Scholar] [CrossRef] [PubMed] [Green Version]
  48. Calderón, L.G.R.; Kobayashi, P.E.; Vasconcelos, R.O.; Fonseca-Alves, C.E.; Laufer-Amorim, R. Characterization of collagens fibers (I, III, IV) and elastin in the extracellular matrix of normal and neoplastic canine prostate. Vet Sci. 2019, 6. [Google Scholar]
  49. Ruetten, H.; Wegner, K.A.; Romero, M.F.; Wood, M.W.; Marker, P.C.; Strand, U.; Colopy, S.A.; Vezina, C.M. Prostatic collagen architecture in neutered and intact canines. Prostate 2018, 78, 839–848. [Google Scholar] [CrossRef]
  50. Karantanos, T.; Corn, P.G.; Thompson, T.C. Prostate cancer progression after androgen deprivation therapy: Mechanisms of castrate resistance and novel therapeutic approaches. Oncogene 2013, 32, 5501–5511. [Google Scholar] [CrossRef]
  51. Rybak, A.P.; Bristow, R.; Kapoor, A. Prostate cancer stem cells: Deciphering the origins and pathways involved in prostate tumorigenesis and aggression. Oncotarget 2014, 6, 1900–1919. [Google Scholar] [CrossRef]
  52. Saad, F.; Shore, N.; Zhang, T.; Sharma, S.; Cho, H.K.; Jacobs, I.A. Emerging therapeutic targets for patients with advanced prostate cancer. Cancer Treat. Rev. 2019, 76, 1–9. [Google Scholar] [CrossRef] [PubMed]
  53. Braglia, L.; Zavatti, M.; Vinceti, M.; Martelli, A.M.; Marmiroli, S. Deregulated PTEN/PI3K/AKT/mTOR signaling in prostate cancer: Still a potential druggable target? Biochim. Et Biophys. Acta (BBA) Mol. Cell Res. 2020, 1867, 118731. [Google Scholar] [CrossRef]
  54. Pienta, K.J.; Abate-Shen, C.; Agus, D.B.; Attar, R.M.; Chung, L.W.; Greenberg, N.M.; Hahn, W.C.; Isaacs, J.T.; Navone, N.M.; Peehl, D.M.; et al. The current state of preclinical prostate cancer animal models. Prostate 2008, 68, 629–639. [Google Scholar] [CrossRef] [Green Version]
  55. Yu, C.; Hu, K.; Nguyen, D.; Wang, Z.A. From genomics to functions: Preclinical mouse models for understanding oncogenic pathways in prostate cancer. Am. J. Cancer Res. 2019, 9, 2079. [Google Scholar] [PubMed]
  56. Ittmann, M.; Huang, J.; Radaelli, E.; Martin, P.; Signoretti, S.; Sullivan, R.; Simons, B.; Ward, J.M.; Robinson, B.D.; Chu, G.C.; et al. Animal Models of Human Prostate Cancer: The Consensus Report of the New York Meeting of the Mouse Models of Human Cancers Consortium Prostate Pathology Committee. Cancer Res. 2013, 73, 2718–2736. [Google Scholar] [CrossRef] [Green Version]
  57. Balk, S.P.; Knudsen, K.E. AR, the cell cycle, and prostate cancer. Nucl. Recept. Signal. 2008, 6, 6001. [Google Scholar] [CrossRef] [Green Version]
  58. Packer, J.R.; Maitland, N.J. The molecular and cellular origin of human prostate cancer. Biochim. Et Biophys. Acta (BBA) Mol. Cell Res. 2016, 1863, 1238–1260. [Google Scholar] [CrossRef] [PubMed]
  59. Erho, N.; Crisan, A.; Vergara, I.; Mitra, A.P.; Ghadessi, M.; Buerki, C.; Bergstralh, E.J.; Kollmeyer, T.; Fink, S.; Haddad, Z.; et al. Discovery and Validation of a Prostate Cancer Genomic Classifier that Predicts Early Metastasis Following Radical Prostatectomy. PLoS ONE 2013, 8, e66855. [Google Scholar] [CrossRef] [Green Version]
  60. Cuzick, J.; Swanson, G.; Fisher, G.; Brothman, A.R.; Berney, D.; Reid, J.E.; Mesher, D.; Speights, V.; Stankiewicz, E.; Foster, C.S.; et al. Prognostic value of an RNA expression signature derived from cell cycle proliferation genes in patients with prostate cancer: A retrospective study. Lancet Oncol. 2011, 12, 245–255. [Google Scholar] [CrossRef] [Green Version]
  61. Huang, Y.; Jiang, X.; Liang, X.; Jiang, G. Molecular and cellular mechanisms of castration resistant prostate cancer (Review). Oncol. Lett. 2018, 15, 6063–6076. [Google Scholar] [CrossRef] [PubMed] [Green Version]
  62. Vickers, A.; Gupta, A.; Savage, C.J.; Pettersson, K.; Dahlin, A.; Bjartell, A.; Manjer, J.; Scardino, P.T.; Ulmert, D.; Lilja, H. A Panel of Kallikrein Marker Predicts Prostate Cancer in a Large, Population-Based Cohort Followed for 15 Years without Screening. Cancer Epidemiol. Biomarkers Prev. 2010, 20, 255–261. [Google Scholar] [CrossRef] [Green Version]
  63. Mavridis, K.; Avgeris, M.; Scorilas, A. Targeting kallikrein-related peptidases in prostate cancer. Expert Opin. Ther. Targets 2014, 18, 365–383. [Google Scholar] [CrossRef] [PubMed] [Green Version]
  64. Kristiansen, I.; Stephan, C.; Jung, K.; Dietel, M.; Rieger, A.; Tolkach, Y.; Kristiansen, G. Sensitivity of HOXB13 as a Diagnostic Immunohistochemical Marker of Prostatic Origin in Prostate Cancer Metastases: Comparison to PSA, Prostein, Androgen Receptor, ERG, NKX3.1, PSAP, and PSMA. Int. J. Mol. Sci. 2017, 18, 1151. [Google Scholar] [CrossRef] [Green Version]
  65. Kristiansen, G. Markers of clinical utility in the differential diagnosis and prognosis of prostate cancer. Mod. Pathol. 2018, 31, 143–155. [Google Scholar] [CrossRef]
  66. Shtivelman, E.; Beer, T.M.; Evans, C.P. Molecular pathways and targets in prostate cancer. Oncotarget 2014, 5, 7217–7259. [Google Scholar] [CrossRef] [Green Version]
  67. Drake, J.; Graham, N.A.; Stoyanova, T.; Sedghi, A.; Goldstein, A.; Cai, H.; Smith, D.A.; Zhang, H.; Komisopoulou, E.; Huang, J.; et al. Oncogene-specific activation of tyrosine kinase networks during prostate cancer progression. Proc. Natl. Acad. Sci. USA 2012, 109, 1643–1648. [Google Scholar] [CrossRef] [Green Version]
  68. Bavcar, S.; Argyle, D.J. Receptor tyrosine kinase inhibitors: Molecularly targeted drugs for veterinary cancer therapy. Veter. Comp. Oncol. 2012, 10, 163–173. [Google Scholar] [CrossRef]
  69. London, C.A.; Hannah, A.L.; Zadovoskaya, R.; Chien, M.B.; Kollias-Baker, C.; Rosenberg, M.; Downing, S.; Post, G.; Boucher, J.; Shenoy, N.; et al. Phase I dose-escalating study of SU11654, a small molecule receptor tyrosine kinase inhibitor, in dogs with spontaneous malignancies. Clin. Cancer Res. 2003, 9, 2755–2768. [Google Scholar] [PubMed]
  70. London, C.A.; Malpas, P.B.; Wood-Follis, S.L.; Boucher, J.F.; Rusk, A.W.; Rosenberg, M.P.; Henry, C.J.; Mitchener, K.L.; Klein, M.K.; Hintermeister, J.G.; et al. Multi-center, Placebo-controlled, Double-blind, Randomized Study of Oral Toceranib Phosphate (SU11654), a Receptor Tyrosine Kinase Inhibitor, for the Treatment of Dogs with Recurrent (Either Local or Distant) Mast Cell Tumor Following Surgical Excision. Clin. Cancer Res. 2009, 15, 3856–3865. [Google Scholar] [CrossRef] [PubMed] [Green Version]
  71. Ogilvie, G.; Ahn, A. Masitinib–the efficacy of targeted therapy in veterinary medicine. Vet. Cancer Soc. Newsl. Summer 2010, 34, 6–11. [Google Scholar]
  72. da Costa, R.M.G. C-kit as a prognostic and therapeutic marker in canine cutaneous mast cell tumours: From laboratory to clinic. Vet. J. 2015, 205, 5–10. [Google Scholar] [CrossRef] [Green Version]
  73. Klopfleisch, R.; Kohn, B.; Gruber, A. Mechanisms of tumour resistance against chemotherapeutic agents in veterinary oncology. Veter. J. 2016, 207, 63–72. [Google Scholar] [CrossRef]
  74. Packeiser, E.-M.; Hewicker-Trautwein, M.; Thiemeyer, H.; Mohr, A.; Junginger, J.; Schille, J.T.; Escobar, H.M.; Nolte, I. Characterization of six canine prostate adenocarcinoma and three transitional cell carcinoma cell lines derived from primary tumor tissues as well as metastasis. PLoS ONE 2020, 15, e0230272. [Google Scholar] [CrossRef] [Green Version]
  75. Uhlén, M.; Fagerberg, L.; Hallström, B.M.; Lindskog, C.; Oksvold, P.; Mardinoglu, A.; Sivertsson, Å.; Kampf, C.; Sjöstedt, E.; Asplund, A. Tissue-based map of the human proteome. Science 2015, 347, 1260419. [Google Scholar] [CrossRef] [PubMed]
  76. Consortium, U. UniProt: A worldwide hub of protein knowledge. Nucleic Acids Res. 2019, 47, D506–D515. [Google Scholar] [CrossRef] [Green Version]
  77. Griffith, M.; Griffith, O.L.; Coffman, A.C.; Weible, J.V.; McMichael, J.F.; Spies, N.C.; Koval, J.; Das, I.; Callaway, M.B.; Eldred, J.M.; et al. DGIdb: Mining the druggable genome. Nat. Methods 2013, 10, 1209–1210. [Google Scholar] [CrossRef]
  78. Klein, E.A.; Cooperberg, M.R.; Magi-Galluzzi, C.; Simko, J.P.; Falzarano, S.M.; Maddala, T.; Chan, J.; Li, J.; Cowan, J.E.; Tsiatis, A.C.; et al. A 17-gene Assay to Predict Prostate Cancer Aggressiveness in the Context of Gleason Grade Heterogeneity, Tumor Multifocality, and Biopsy Undersampling. Eur. Urol. 2014, 66, 550–560. [Google Scholar] [CrossRef] [Green Version]
  79. Pagliarone, S.; Frattone, L.; Pirocchi, V.; Della Salda, L.; Palmieri, C. Altered expression of p53, but not Rb, is involved in canine prostatic carcinogenesis. Res. Veter. Sci. 2016, 105, 195–199. [Google Scholar] [CrossRef]
  80. Fonseca-Alves, C.E.; Rodrigues, M.M.; de Moura, V.M.; Rogatto, S.; Laufer-Amorim, R. Alterations of C-MYC, NKX3.1, and E-cadherin expression in canine prostate carcinogenesis. Microsc. Res. Tech. 2013, 76, 1250–1256. [Google Scholar] [CrossRef]
  81. Sun, F.; Báez-Díaz, C.; Sánchez-Margallo, F.M. Canine prostate models in preclinical studies of minimally invasive interventions: Part II, benign prostatic hyperplasia models. Transl. Androl. Urol. 2017, 6, 547. [Google Scholar] [CrossRef] [Green Version]
  82. Gallardo, F.; Mogas, T.; Baró, T.; Rabanal, R.; Morote, J.; Abal, M.; Reventós, J.; Lloreta, J. Expression of Androgen, Oestrogen α and β, and Progesterone Receptors in the Canine Prostate: Differences between Normal, Inflamed, Hyperplastic and Neoplastic Glands. J. Comp. Pathol. 2007, 136, 1–8. [Google Scholar] [CrossRef]
  83. Wang, G.; Zhao, D.; Spring, D.J.; Depinho, R.A. Genetics and biology of prostate cancer. Genes Dev. 2018, 32, 1105–1140. [Google Scholar] [CrossRef] [Green Version]
  84. Johnston, S.; Kamolpatana, K.; Kustritz, M.R.; Johnston, G. Prostatic disorders in the dog. Anim. Reprod. Sci. 2000, 60–61, 405–415. [Google Scholar] [CrossRef]
  85. Kobayashi, P.E.; Rodrigues, M.M.; Gartner, F.; Rema, A.; Fonseca-Alves, C.E.; Laufer-Amorim, R. Association between decreased expression of estrogen receptor alpha, androgen receptor and phosphatase and tensin homolog immunoexpression in the canine prostate. Pesqui. Veterinária Bras. 2019, 39, 40–46. [Google Scholar] [CrossRef]
  86. Shidaifat, F. Age-Dependent Expression of 5α-Reductase and Androgen Receptors mRNA by the Canine Prostate. Physiol. Res. 2009, 58, 155–158. [Google Scholar] [CrossRef]
  87. Amin, M.B.; Epstein, J.I.; Ulbright, T.M.; Humphrey, P.A.; Egevad, L.; Montironi, R.; Grignon, D.; Trpkov, K.; Lopez-Beltran, A.; Zhou, M. Best practices recommendations in the application of immunohistochemistry in urologic pathology: Report from the International Society of Urological Pathology consensus conference. Am. J. Surg. Pathol. 2014, 38, 1017–1022. [Google Scholar] [CrossRef]
  88. Muniyan, S.; Ingersoll, M.A.; Batra, S.K.; Lin, M.-F. Cellular prostatic acid phosphatase, a PTEN-functional homologue in prostate epithelia, functions as a prostate-specific tumor suppressor. Biochim. Biophys. Acta (BBA)-Rev. Cancer 2014, 1846, 88–98. [Google Scholar] [CrossRef] [Green Version]
  89. Kong, H.Y.; Byun, J. Emerging Roles of Human Prostatic Acid Phosphatase. Biomol. Ther. 2013, 21, 10–20. [Google Scholar] [CrossRef] [Green Version]
  90. Sorenmo, K.U.; Goldschmidt, M.; Shofer, F.; Goldkamp, C.; Ferracone, J. Immunohistochemical characterization of canine prostatic carcinoma and correlation with castration status and castration time. Veter. Comp. Oncol. 2003, 1, 48–56. [Google Scholar] [CrossRef]
  91. Vaz, S.; Hadaschik, B.; Gabriel, M.; Herrmann, K.; Eiber, M.; Costa, D. Influence of androgen deprivation therapy on PSMA expression and PSMA-ligand PET imaging of prostate cancer patients. Eur. J. Nucl. Med. Mol. Imaging 2019, 47, 9–15. [Google Scholar] [CrossRef] [Green Version]
  92. Wu, L.Y.; Johnson, J.M.; Simmons, J.K.; Mendes, D.E.; Geruntho, J.J.; Liu, T.; Dirksen, W.P.; Rosol, T.; Davis, W.C.; Berkman, C.E. Biochemical characterization of prostate-specific membrane antigen from canine prostate carcinoma cells. Prostate 2014, 74, 451–457. [Google Scholar] [CrossRef] [PubMed] [Green Version]
  93. Barrett, T.; Wilhite, S.E.; Ledoux, P.; Evangelista, C.; Kim, I.F.; Tomashevsky, M.; Marshall, K.A.; Phillippy, K.H.; Sherman, P.M.; Holko, M. NCBI GEO: Archive for functional genomics data sets—Update. Nucleic Acids Res. 2012, 41, D991–D995. [Google Scholar] [CrossRef] [Green Version]
  94. Andrews, S. FastQC: A Quality Control Tool for High Throughput Sequence Data. Available online: http://www.bioinformatics.babraham.ac.uk/projects/fastqc (accessed on 18 October 2021).
  95. Yates, A.D.; Achuthan, P.; Akanni, W.; Allen, J.; Allen, J.; Alvarez-Jarreta, J.; Amode, M.R.; Armean, I.M.; Azov, A.G.; Bennett, R. Ensembl 2020. Nucleic Acids Res. 2020, 48, D682–D688. [Google Scholar] [CrossRef]
  96. Dobin, A.; Davis, C.A.; Schlesinger, F.; Drenkow, J.; Zaleski, C.; Jha, S.; Batut, P.; Chaisson, M.; Gingeras, T. STAR: Ultrafast universal RNA-seq aligner. Bioinformatics 2012, 29, 15–21. [Google Scholar] [CrossRef]
  97. Love, M.I.; Huber, W.; Anders, S. Moderated estimation of fold change and dispersion for RNA-seq data with DESeq2. Genome biology 2014, 15, 550. [Google Scholar] [CrossRef] [Green Version]
  98. Aken, B.L.; Ayling, S.C.; Barrell, D.; Clarke, L.; Curwen, V.; Fairley, S.; Banet, J.F.; Billis, K.; Giron, C.G.; Hourlier, T.; et al. The Ensembl gene annotation system. Database 2016, 2016. [Google Scholar] [CrossRef]
  99. Kinsella, R.J.; Kähäri, A.; Haider, S.; Zamora, J.; Proctor, G.; Spudich, G.; Almeida-King, J.; Staines, D.; Derwent, P.; Kerhornou, A.; et al. Ensembl BioMarts: A hub for data retrieval across taxonomic space. Database 2011, 2011, bar030. [Google Scholar] [CrossRef]
  100. Szklarczyk, D.; Morris, J.H.; Cook, H.; Kuhn, M.; Wyder, S.; Simonovic, M.; Santos, A.; Doncheva, N.T.; Roth, A.; Bork, P. The STRING database in 2017: Quality-controlled protein–protein association networks, made broadly accessible. Nucleic Acids Res. 2016, gkw937. [Google Scholar] [CrossRef]
Figure 1. Experimental design. Flowchart of RNA-Sequencing (RNA-Seq) analysis for characterization (green) and identification of differentially expressed genes (DEGs) between malignant and nonmalignant canine prostate samples. Selection (blue and gray) of strongly deregulated superpathway genes (DEGsS) and database-associated deregulated genes (DEGsD).
Ijms 22 11481 g001
Figure 2. Differentially expressed genes (DEGs) between malignant and nonmalignant canine prostate samples. (A) Principal component analysis (PCA) based on the normalized regularized logarithm (rlog)-transformed read counts of the DEGs: fine-needle aspiration (FNA) samples (circle), prostate tissue samples (triangle), nonmalignant (green), malignant samples (red). PCA verified that most of the variance (66.9%, PC1) was associated with the altered expression between the malignant and the nonmalignant canine PCa samples; (B) Heatmap and hierarchical clustering of prostate tissue (gray), FNA (purple), nonmalignant (green) and malignant (red) samples and DEGs based on Euclidean distances between normalized rlog-transformed counts. Rows have been centered and scaled to compute z-scores.
Ijms 22 11481 g002
Figure 3. Superpathways summarizing the hallmarks of canine prostate cancer (PCa). (A) The forty-nine Kyoto Encyclopedia of Genes and Genomes (KEGG) pathways enriched among canine PCa differentially expressed genes (DEGs). Note that the analysis was performed based on the human homologs of the canine DEGs to take advantage of the better annotation available for human genes. The color of the cells in the heatmap visualizes the overlap coefficient-based distance between pairs of pathways; while 0 implies a 100% overlap between the gene members of the pathways, 1 implies 0%. The pathways were hierarchically clustered using the complete linkage algorithm based on a distance defined as 1 minus the overlap coefficient; (B) Stacked bar chart showing the number of gene members that are not differentially expressed (yellow) and DEGs (blue) in each of the 49 pathways enriched among canine PCa DEGs; (CG) Superpathway treemaps: Summary of the Gene Ontology (GO) biological processes enriched in the five superpathways. Gene ontology (GOTERM_BP_FAT) enrichment analysis was performed on DEGs using the database for annotation, visualization and integrated Discovery (DAVID) [38], and clustered and displayed with Reduce + Visualize Gene ontology (REVIGO) [39]. The treemaps show the enriched biological processes and the box sizes represent the respective negative logarithm of the false discovery rate (FDR): (C) Inflammatory response and cytokines superpathway; (D) Regulation of the immune system and cell death superpathway; (E) Cell surface and PI3K signaling superpathway; (F) Cell cycle superpathway; (G) Phagosome and autophagy superpathway.
Ijms 22 11481 g003
Figure 4. Intersections and selection of canine prostate cancer (PCa) biomarker candidates. (A) Flowchart indicating how selection of canine PCa biomarker candidates is performed based on two different approaches: (1) strongly deregulated superpathway genes (DEGsS) and (2) database-associated deregulated genes (DEGsD), with overlap DEGsSD. FNA: Fine-needle aspiration sample; KEGG: Kyoto Encyclopedia of Genes and Genomes; REVIGO: Reduce + Visualize Gene ontology; (B) V UpSet plot visualizing the intersection between different groups of differentially expressed genes (DEGs) according to the two different approaches. Criteria for DEGsD: the human protein atlas (HPA) database, the “prostate cancer” pathway of the Kyoto encyclopedia of genes and genomes (PCa pathway), human prostate cancer multi-gene assays (hPCa gene assays), UniProt keywords proto-oncogene [KW-0656] and tyrosine-protein kinases [KW-0829] (UP_KEYWORDS), druggable database and literature. Criteria for DEGsS: superpathway, strongly DEGs with base-2 logarithm (log2) fold-change ≤−2/≥2 and ≥40th percentile. Intersections of DEGS and DEGsD as selection criteria for DEGsSD. The horizontal bars (left, red) display the total number of DEGs in each group. The vertical bars (top, gray) visualize the number of DEGs in each combination of groups, as indicated by the dots. Note that all the intersections are disjoint.
Ijms 22 11481 g004
Figure 5. Prostate cancer (PCa) pathway. (A) Differentially expressed genes (DEGs) in the PCa pathway. Ensembl gene identifier (Ensembl ID cfa, column 1), official gene symbol (column 2), base-2 logarithm (log2) fold-change in the expression value of the genes between the nonmalignant and malignant sample groups (column 3); in columns 5 to 11, a dot indicates whether the gene is a database-associated deregulated gene (DEGD, column 11) and/or a strongly deregulated superpathway gene (DEGS, column 10), as well as whether the gene is a member of any of the five superpathways (columns 5–9): (i) inflammatory response and cytokines; (ii) regulation of the immune system and cell death; (iii) cell surface and PI3K signaling; (iv) cell cycle; and (v) phagosome and autophagy; (B) Modified graphic diagram of the PCa pathway (cfa05215; [40]), visualized using the Pathview Web tool [41]. Genes are represented as rectangles and molecular interactions as arrows. The color of the rectangles illustrates the log2 fold-changes of the expression value of the genes between the nonmalignant and malignant sample groups; upregulated genes are displayed in yellow; downregulated genes in blue; genes that are not deregulated are shown in gray. Protein–protein interactions: phosphorylation (+p), dephosphorylation (−p). Additional pathways related to the PCa are highlighted as boxes with rounded corners. Related pathways that are associated with the superpathways are highlighted with green boxes with rounded corners. Discrepancies in annotations between KEGG and the database for annotation, visualization and integrated Discovery (DAVID) are highlighted with black asterisks.
Ijms 22 11481 g005
Publisher’s Note: MDPI stays neutral with regard to jurisdictional claims in published maps and institutional affiliations.

