
Combining Heat Stress with Pre-Existing Drought Exacerbated the Effects on Chlorophyll Fluorescence Rise Kinetics in Four Contrasting Plant Species


Abstract
:1. Introduction
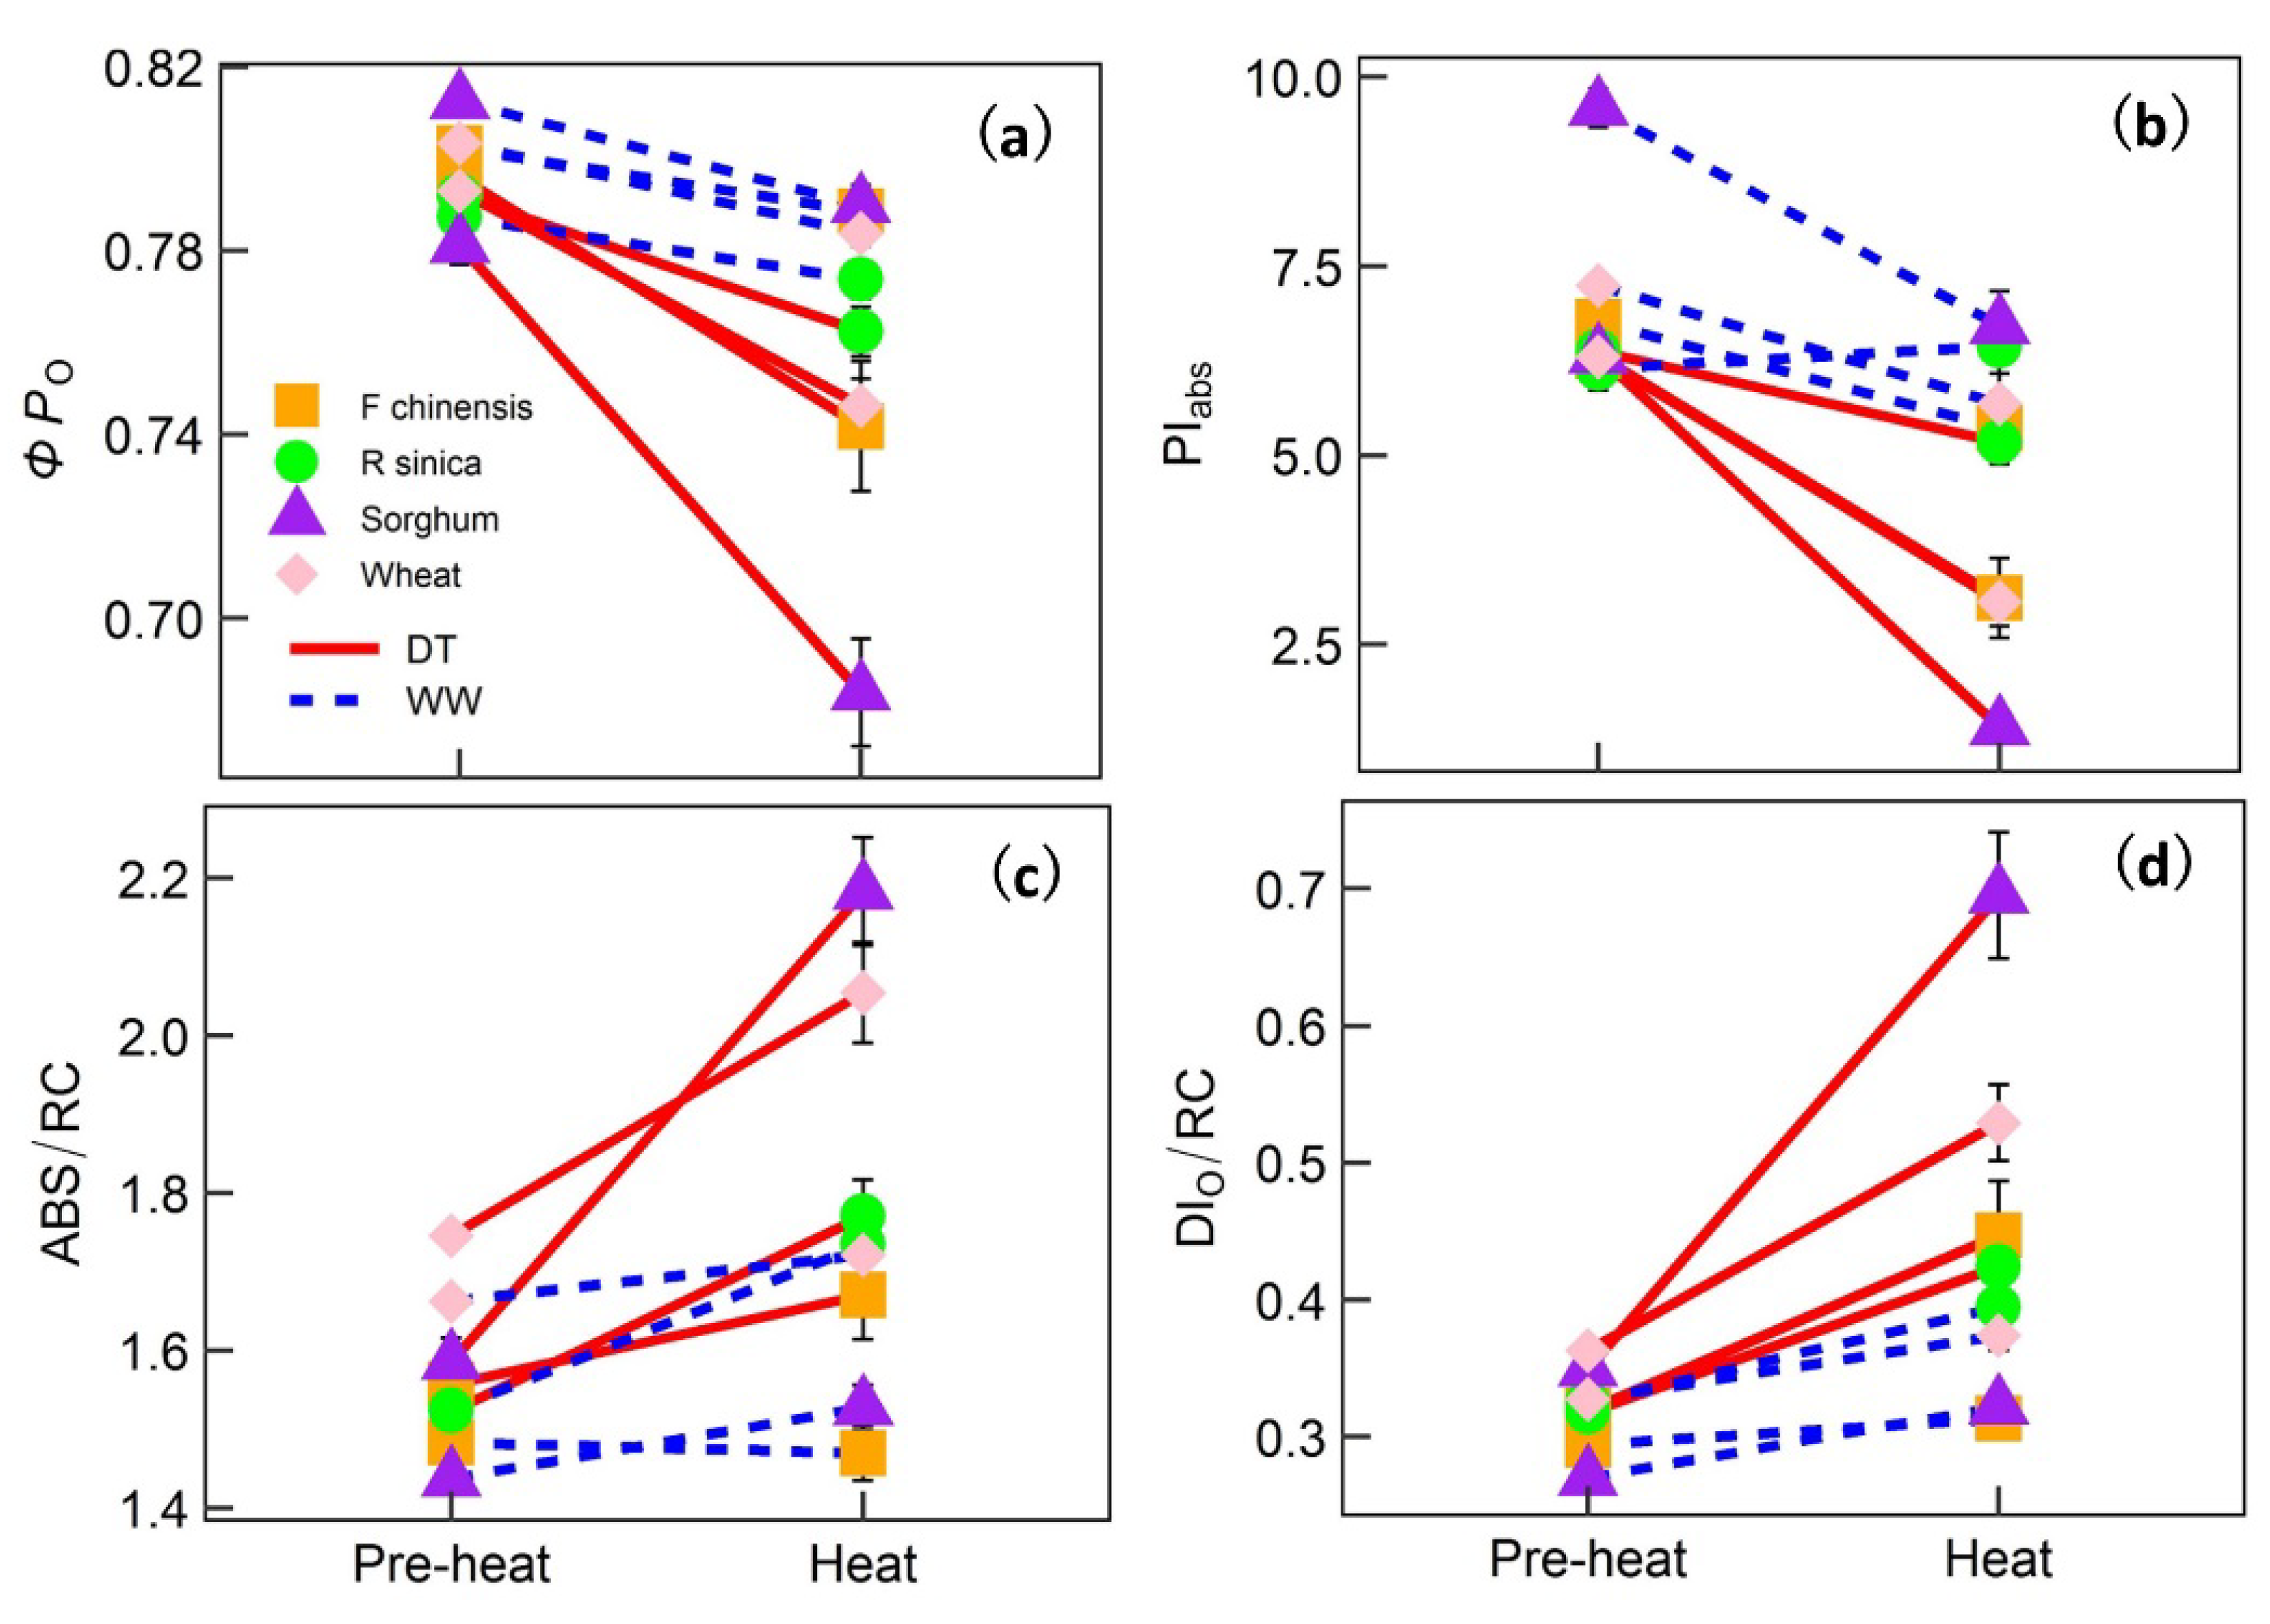
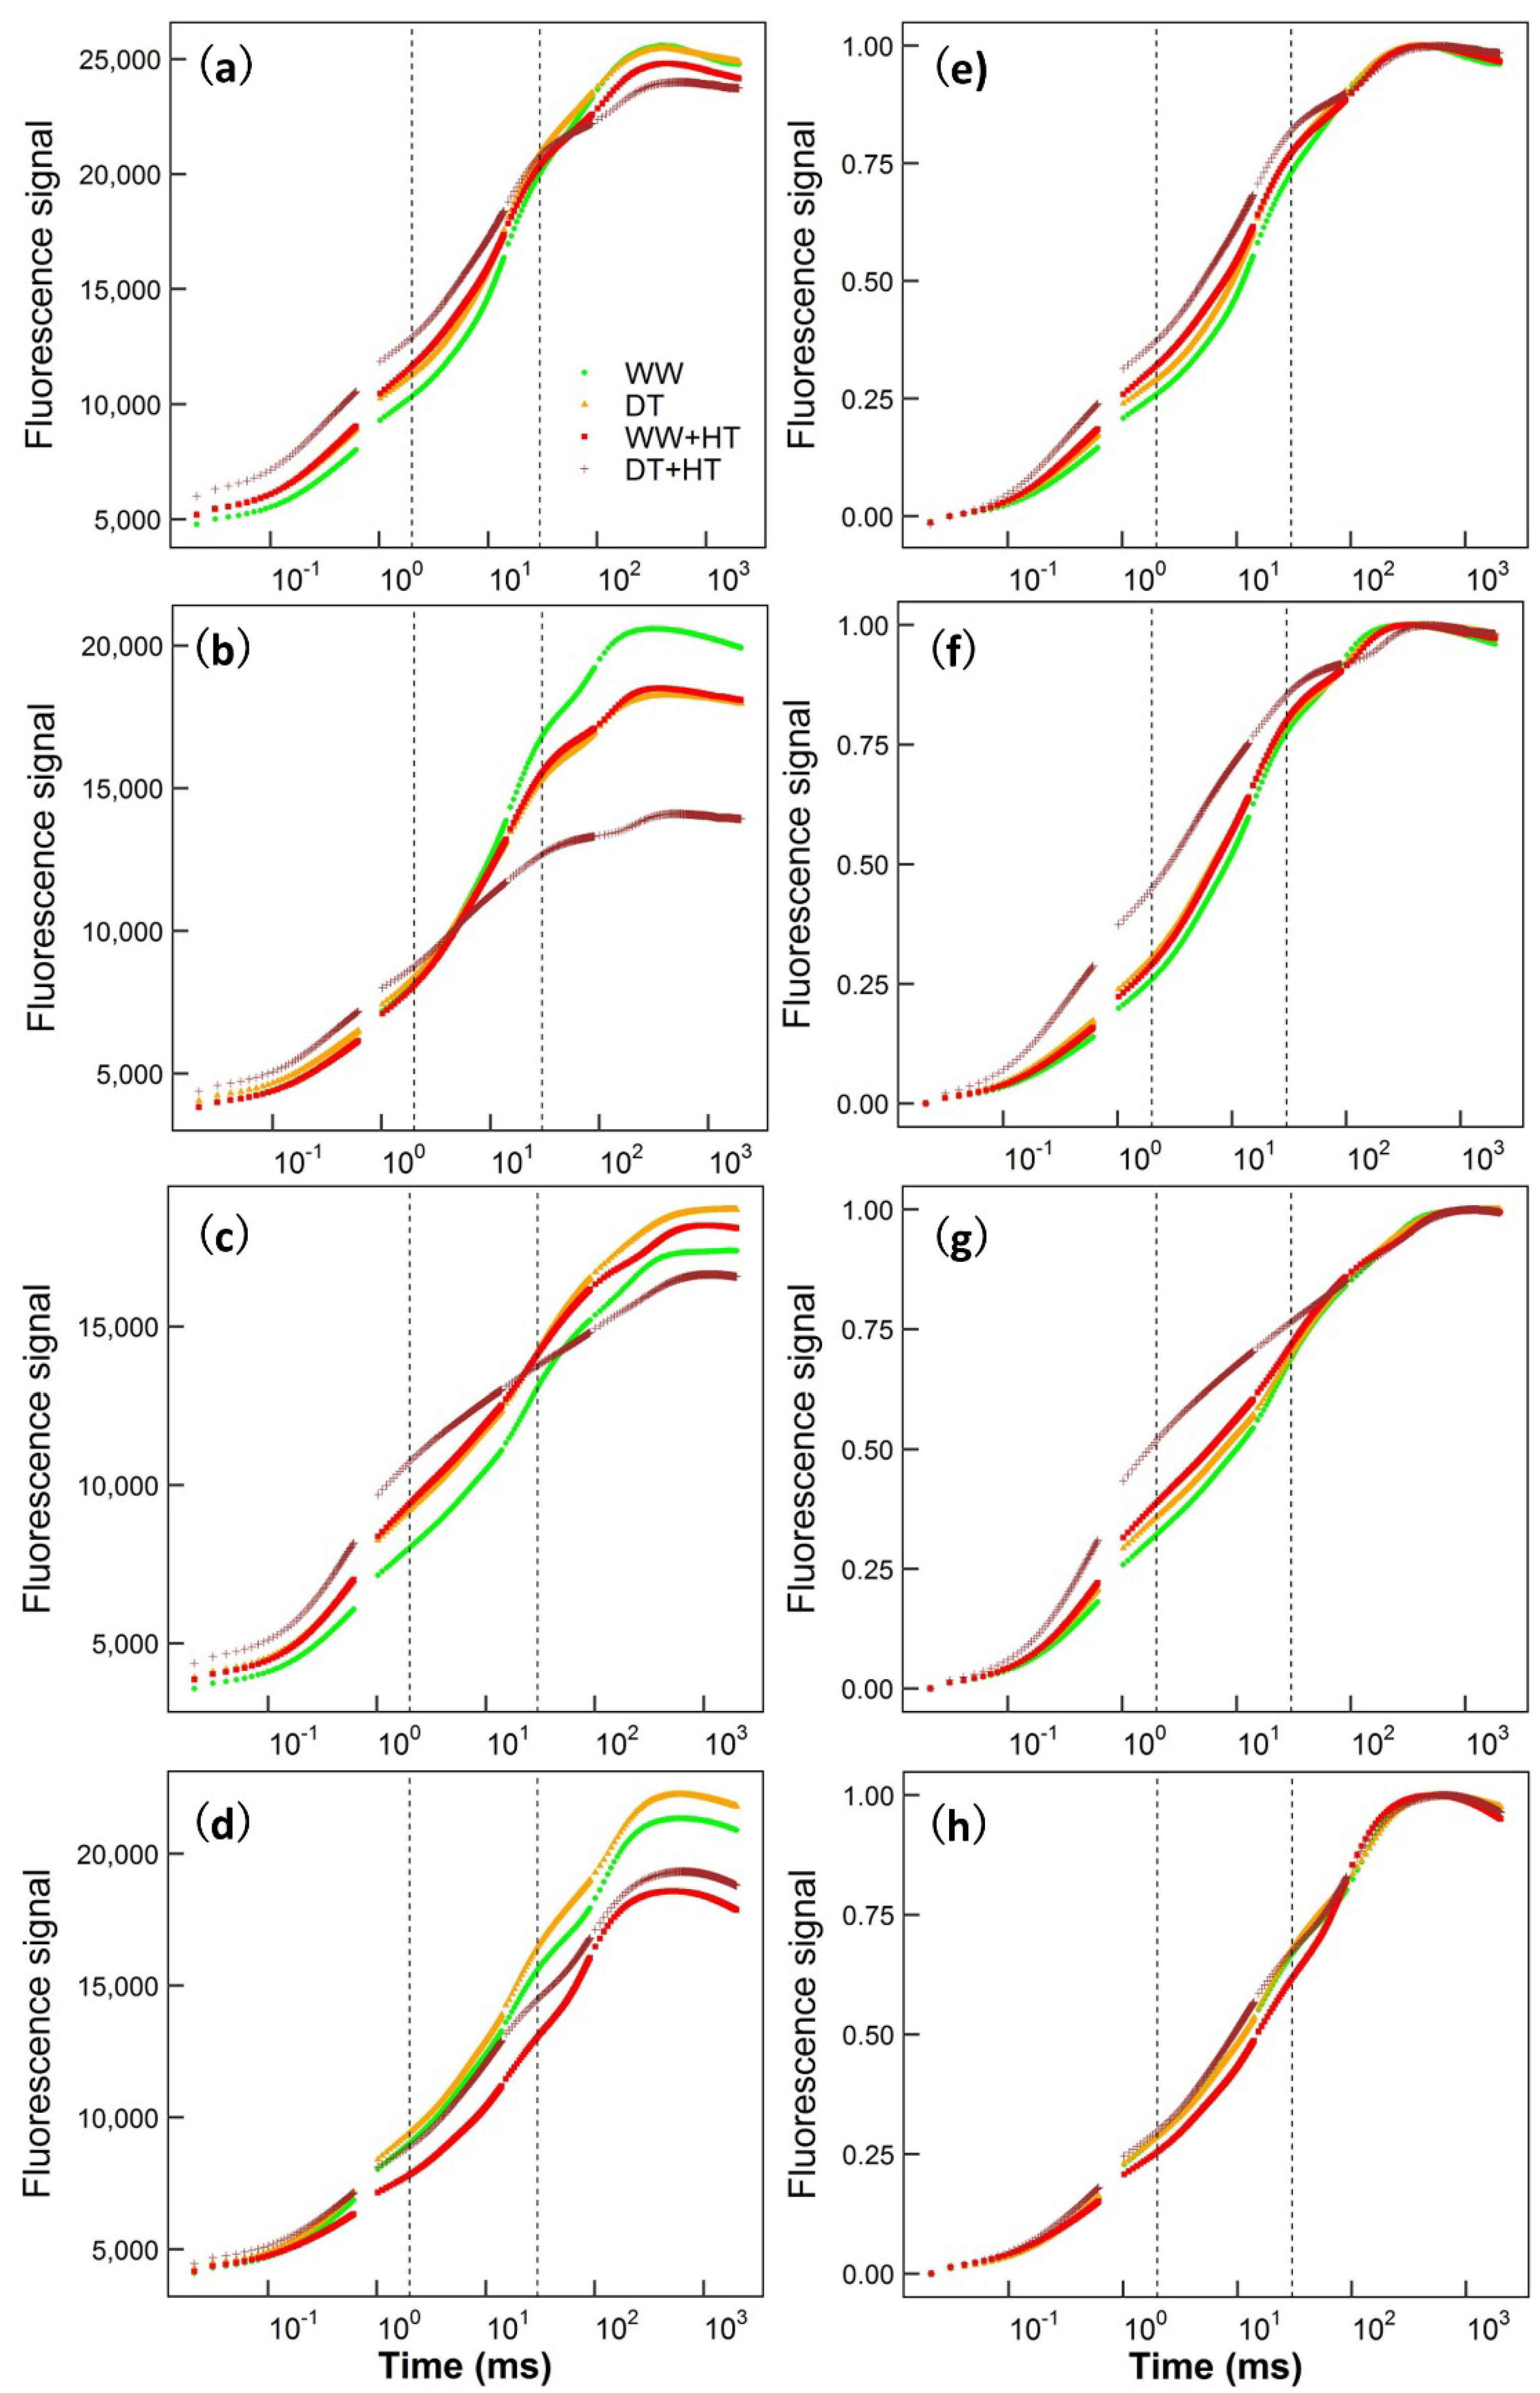
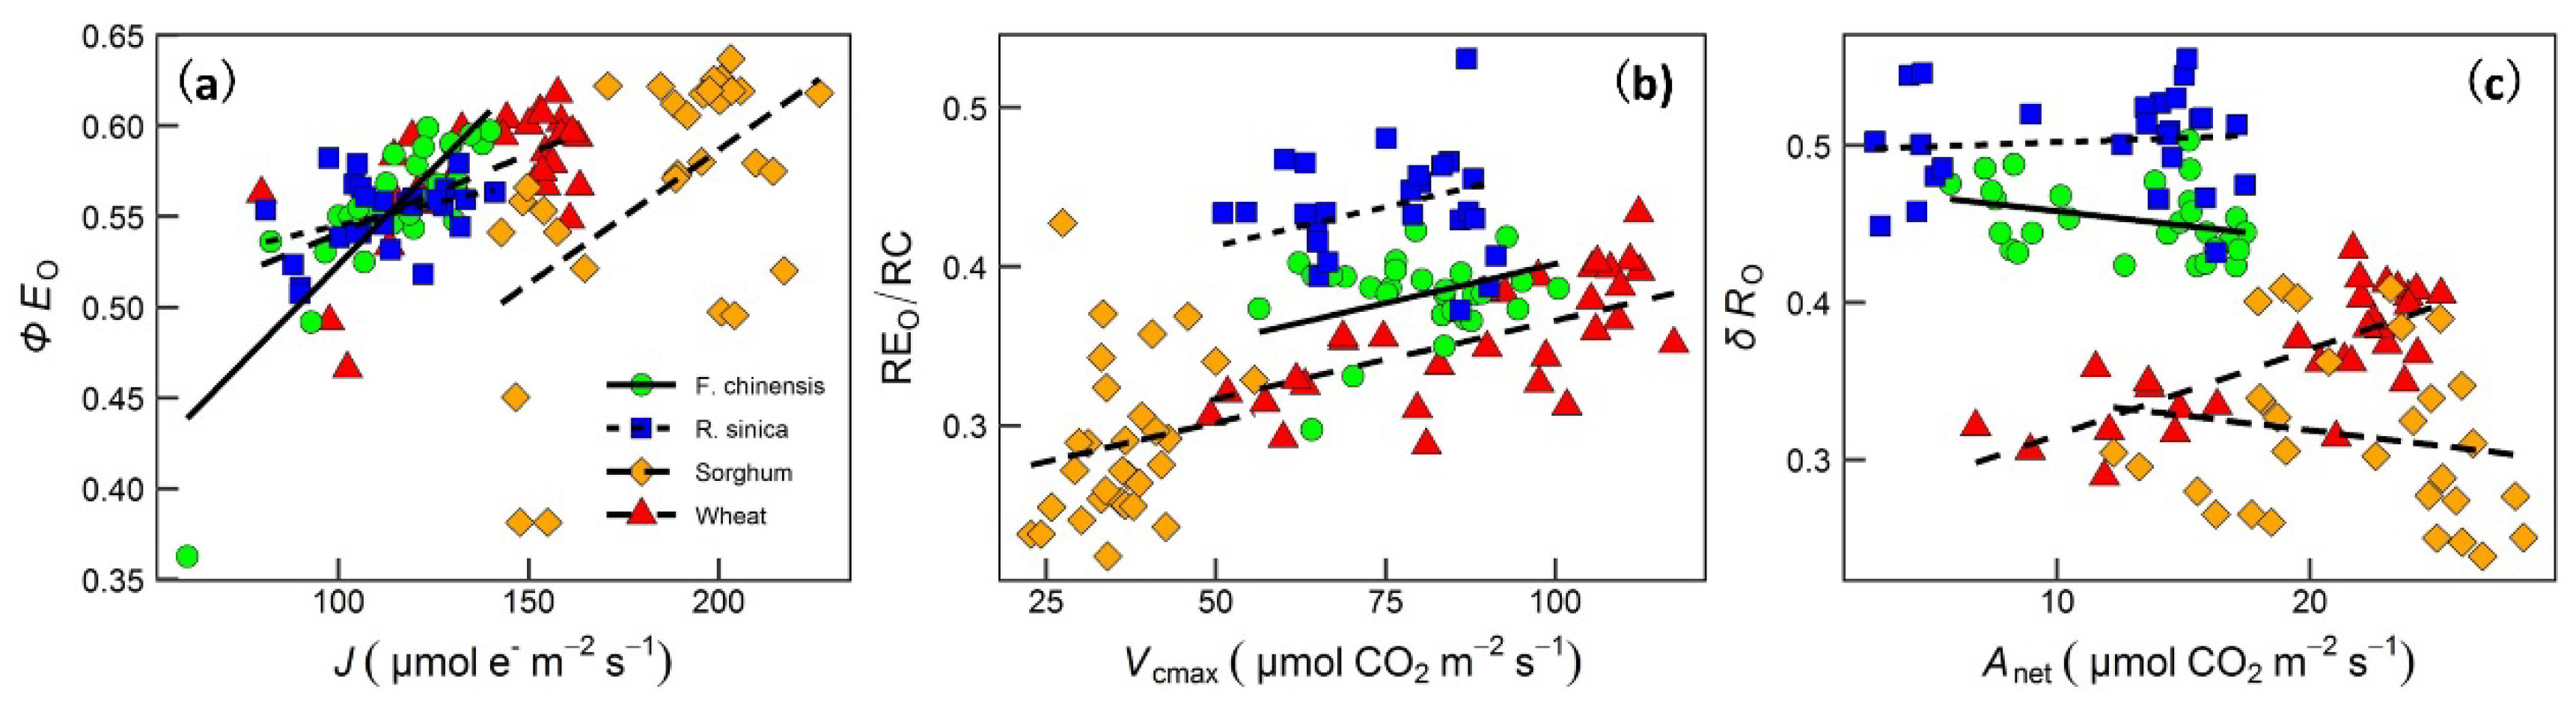
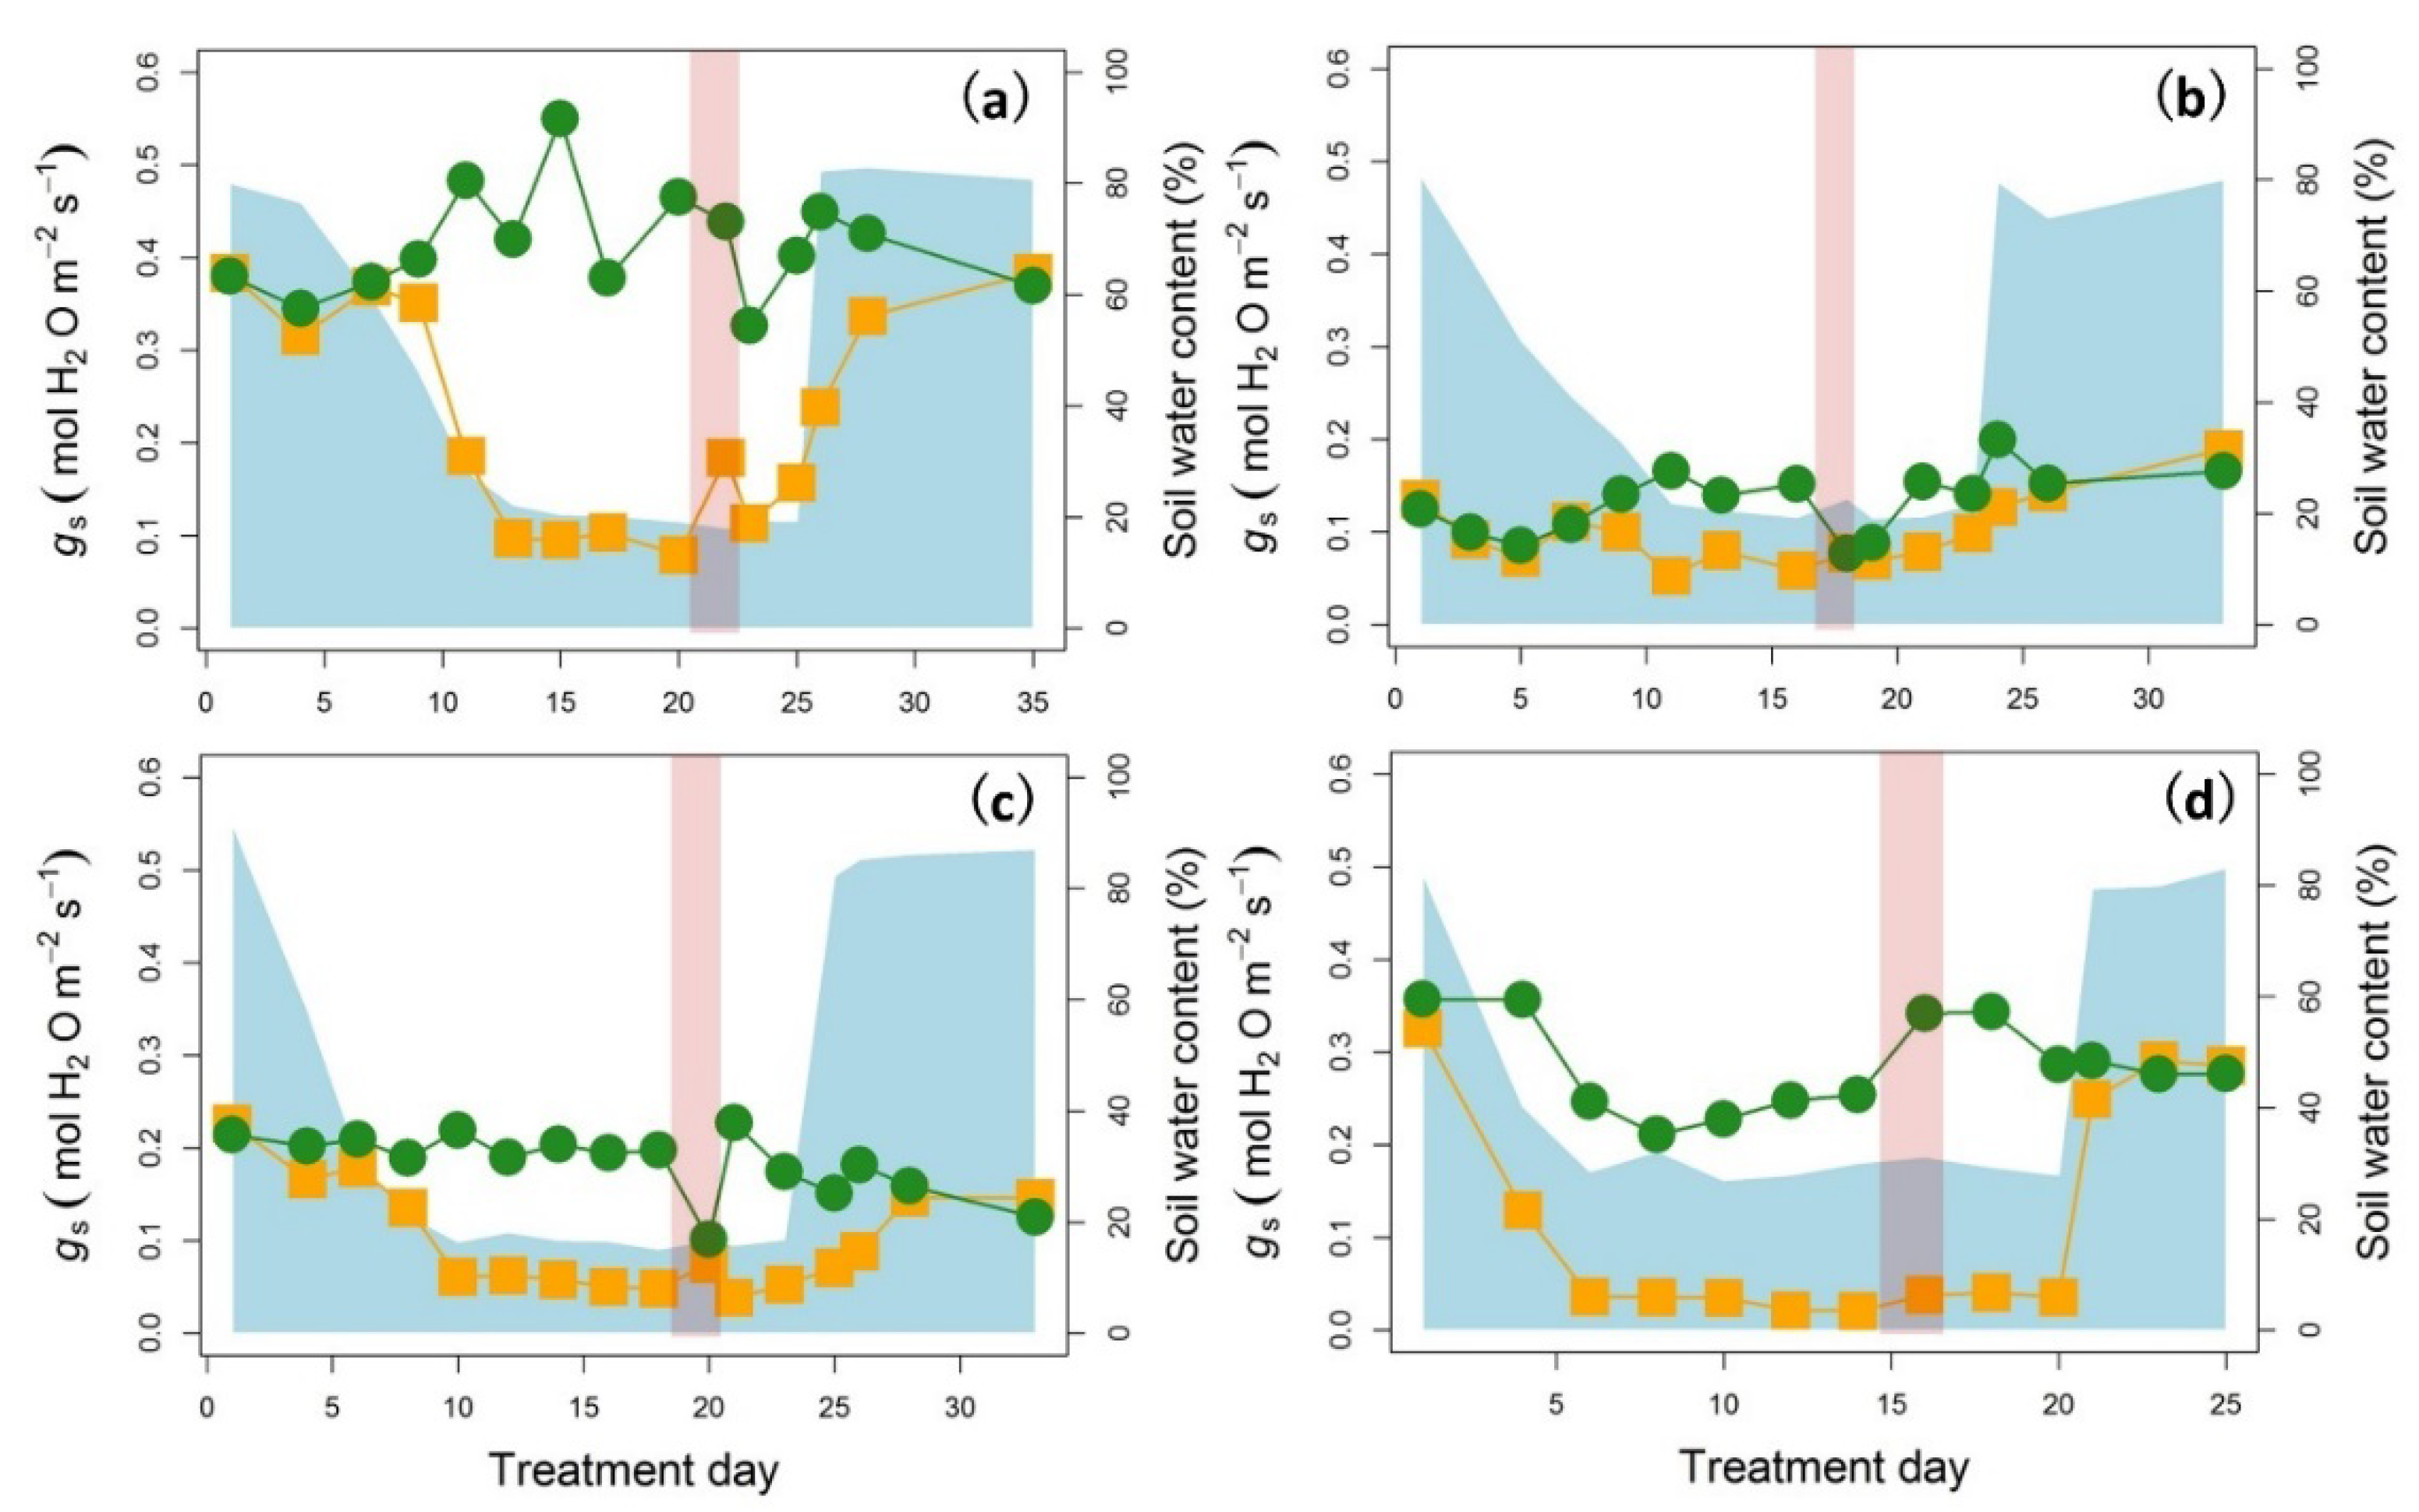
2. Results
3. Discussion
4. Materials and Methods
4.1. Plant Materials and Growth Conditions
4.2. Chlorophyll Fluorescence Measurements
4.3. Statistics
5. Conclusions
Supplementary Materials
Author Contributions
Funding
Institutional Review Board Statement
Informed Consent Statement
Data Availability Statement
Acknowledgments
Conflicts of Interest
References
- Allen, C.D.; Breshears, D.D.; McDowell, N.G. On underestimation of global vulnerability to tree mortality and forest die-off from hotter drought in the Anthropocene. Ecosphere 2015, 6, art129. [Google Scholar] [CrossRef]
- Lesk, C.; Rowhani, P.; Ramankutty, N. Influence of extreme weather disasters on global crop production. Nature 2016, 529, 84–87. [Google Scholar] [CrossRef] [PubMed]
- Ciais, P.; Reichstein, M.; Viovy, N.; Granier, A.; Ogee, J.; Allard, V.; Aubinet, M.; Buchmann, N.; Bernhofer, C.; Carrara, A.; et al. Europe-wide reduction in primary productivity caused by the heat and drought in 2003. Nature 2005, 437, 529–533. [Google Scholar] [CrossRef] [PubMed]
- Perkins-Kirkpatrick, S.E.; Lewis, S.C. Increasing trends in regional heatwaves. Nat. Commun. 2020, 11, 3357. [Google Scholar] [CrossRef]
- Trenberth, K.E.; Dai, A.; Van Der Schrier, G.; Jones, P.; Barichivich, J.; Briffa, K.; Sheffield, J. Global warming and changes in drought. Nat. Clim. Chang. 2013, 4, 17–22. [Google Scholar] [CrossRef]
- Wang, G.-P.; Hui, Z.; Li, F.; Zhao, M.-R.; Zhang, J.; Wang, W. Improvement of heat and drought photosynthetic tolerance in wheat by overaccumulation of glycinebetaine. Plant. Biotechnol. Rep. 2010, 4, 213–222. [Google Scholar] [CrossRef]
- Perdomo, J.A.; Carmo-Silva, E.; Hermida-Carrera, C.; Flexas, J.; Galmés, J. Acclimation of biochemical and diffusive components of photosynthesis in rice, wheat, and maize to heat and water deficit: Implications for modeling photosynthesis. Front. Plant. Sci. 2016, 7, 1–16. [Google Scholar] [CrossRef] [Green Version]
- Duan, H.; Wu, J.; Huang, G.; Zhou, S.; Liu, W.; Liao, Y.; Yang, X.; Xiao, Z.; Fan, H. Individual and interactive effects of drought and heat on leaf physiology of seedlings in an economically important crop. AoB PLANTS 2016, 9, 1–16. [Google Scholar] [CrossRef] [Green Version]
- Jiang, Y.; Huang, B. Effects of Drought or Heat stress alone and in combination on Kentucky bluegrass. Crop. Sci. 2000, 40, 1358–1362. [Google Scholar] [CrossRef]
- Zhu, L.; Li, H.; Thorpe, M.R.; Hocart, C.H.; Song, X. Stomatal and mesophyll conductance are dominant limitations to photosynthesis in response to heat stress during severe drought in a temperate and a tropical tree species. Trees 2021, 35, 1613–1626. [Google Scholar] [CrossRef]
- Zhu, L.; Cernusak, L.A.; Song, X. Dynamic responses of gas exchange and photochemistry to heat interference during drought in wheat and sorghum. Funct. Plant. Biol. 2020, 47, 611–627. [Google Scholar] [CrossRef]
- Mittler, R. Abiotic stress, the field environment and stress combination. Trends Plant. Sci. 2006, 11, 15–19. [Google Scholar] [CrossRef] [PubMed]
- Rizhsky, L.; Liang, H.; Mittler, R. The combined effect of drought stress and heat shock on gene expression in tobacco. Plant. Physiol. 2002, 130, 1143–1151. [Google Scholar] [CrossRef] [PubMed] [Green Version]
- Krause, G.H.; Weis, E. Chlorophyll fluorescence as a tool in plant physiology. Photosynth. Res. 1984, 5, 139–157. [Google Scholar] [CrossRef] [PubMed]
- Goltsev, V.; Chernev, P.; Zaharieva, I.; Lambrev, P.; Strasser, R.J. Kinetics of delayed chlorophyll a fluorescence registered in milliseconds time range. Photosynth. Res. 2005, 84, 209–215. [Google Scholar] [CrossRef] [PubMed]
- Kalaji, H.M.; Jajoo, A.; Oukarroum, A.; Brestic, M.; Zivcak, M.; Samborska, I.A.; Cetner, M.D.; Łukasik, I.; Goltsev, V.; Ladle, R.J. Chlorophyll a fluorescence as a tool to monitor physiological status of plants under abiotic stress conditions. Acta Physiol. Plant. 2016, 38, 1–11. [Google Scholar] [CrossRef] [Green Version]
- Strasser, R.J. Govindjee The Fo and the O-J-I-P Fluorescence rise in higher plants and Algae. In Regulation of Chloroplast Biogenesis; Springer: Berlin/Heidelberg, Germany, 1992; pp. 423–426. [Google Scholar] [CrossRef]
- Jedmowski, C.; Brüggemann, W. Imaging of fast chlorophyll fluorescence induction curve (OJIP) parameters, applied in a screening study with wild barley (Hordeum spontaneum) genotypes under heat stress. J. Photochem. Photobiol. B Biol. 2015, 151, 153–160. [Google Scholar] [CrossRef]
- Holland, V.; Koller, S.; Brüggemann, W. Insight into the photosynthetic apparatus in evergreen and deciduous European oaks during autumn senescence using OJIP fluorescence transient analysis. Plant. Biol. 2013, 16, 801–808. [Google Scholar] [CrossRef]
- Todorenko, D.; Volgusheva, A.; Timofeev, N.; Kovalenko, I.; Matorin, D.; Antal, T. Multiple in vivo effects of cadmium on photosynthetic electron transport in pea plants. Photochem. Photobiol. 2021. [Google Scholar] [CrossRef]
- Dąbrowski, P.; Baczewska, A.; Pawluśkiewicz, B.; Paunov, M.; Alexantrov, V.; Goltsev, V.; Kalaji, M. Prompt chlorophyll a fluorescence as a rapid tool for diagnostic changes in PSII structure inhibited by salt stress in Perennial ryegrass. J. Photochem. Photobiol. B Biol. 2016, 157, 22–31. [Google Scholar] [CrossRef]
- Kalaji, H.M.; Oukarroum, A.; Alexandrov, V.; Kouzmanova, M.; Brestic, M.; Zivcak, M.; Samborska, I.A.; Cetner, M.D.; Allakhverdiev, S.I.; Goltsev, V. Identification of nutrient deficiency in maize and tomato plants by in vivo chlorophyll a fluorescence measurements. Plant. Physiol. Biochem. 2014, 81, 16–25. [Google Scholar] [CrossRef]
- Stefanov, D.; Petkova, V.; Denev, I.D. Screening for heat tolerance in common bean (Phaseolus vulgaris L.) lines and cultivars using JIP-test. Sci. Hortic. 2011, 128, 1–6. [Google Scholar] [CrossRef]
- Brestic, M.; Zivcak, M.; Kalaji, H.M.; Carpentier, R.; Allakhverdiev, S.I. Photosystem II thermostability in situ: Environmentally induced acclimation and genotype-specific reactions in Triticum aestivum L. Plant. Physiol. Biochem. 2012, 57, 93–105. [Google Scholar] [CrossRef]
- Gautam, A.; Agrawal, D.; Saiprasad, S.V.; Jajoo, A. A quick method to screen high and low yielding wheat cultivars exposed to high temperature. Physiol. Mol. Biol. Plants 2014, 20, 533–537. [Google Scholar] [CrossRef] [Green Version]
- Jedmowski, C.; Ashoub, A.; Brüggemann, W. Reactions of Egyptian landraces of Hordeum vulgare and Sorghum bicolor to drought stress, evaluated by the OJIP fluorescence transient analysis. Acta Physiol. Plant. 2012, 35, 345–354. [Google Scholar] [CrossRef]
- Galić, V.; Mazur, M.; Šimić, D.; Zdunić, Z.; Franić, M. Special issue in honour of Prof. Reto J. Strasser—Plant biomass in salt-stressed young maize plants can be modelled with photosynthetic performance. Photosynthetica 2020, 58, 194–204. [Google Scholar] [CrossRef] [Green Version]
- Rapacz, M.; Wójcik-Jagła, M.; Fiust, A.; Kalaji, H.M.; Kocielniak, J. Genome-wide associations of chlorophyll fluorescence OJIP transient parameters connected with soil drought response in barley. Front. Plant. Sci. 2019, 10, 1–21. [Google Scholar] [CrossRef] [PubMed] [Green Version]
- Zeng, F.; Wang, G.; Liang, Y.; Guo, N.; Zhu, L.; Wang, Q.; Chen, H.; Ma, D.; Wang, J. Disentangling the photosynthesis performance in japonica rice during natural leaf senescence using OJIP fluorescence transient analysis. Funct. Plant. Biol. 2021, 48, 206. [Google Scholar] [CrossRef]
- Guha, A.; Sengupta, D.; Reddy, A.R. Polyphasic chlorophyll a fluorescence kinetics and leaf protein analyses to track dynamics of photosynthetic performance in mulberry during progressive drought. J. Photochem. Photobiol. B Biol. 2013, 119, 71–83. [Google Scholar] [CrossRef] [PubMed]
- Oukarroum, A.; El Gharous, M.; Goltsev, V.; Strasser, R.J. Delayed fluorescence emission as a probe for the response of photosynthetic organisms to high temperature exposure: A comparative study. J. Lumin. 2016, 180, 321–327. [Google Scholar] [CrossRef] [Green Version]
- Oukarroum, A.; Goltsev, V.; Strasser, R.J. Temperature effects on pea plants probed by simultaneous measurements of the kinetics of prompt fluorescence, delayed fluorescence and modulated 820 nm reflection. PLoS ONE 2013, 8, e59433. [Google Scholar] [CrossRef]
- Mathur, S.; Jajoo, A.; Mehta, P.; Bharti, S. Analysis of elevated temperature-induced inhibition of photosystem II using chlorophyll a fluorescence induction kinetics in wheat leaves (Triticum aestivum). Plant. Biol. 2010, 13, 1–6. [Google Scholar] [CrossRef]
- Chen, L.-S.; Li, P.; Cheng, L. Comparison of thermotolerance of sun-exposed peel and shaded peel of ‘Fuji’ apple. Environ. Exp. Bot. 2009, 66, 110–116. [Google Scholar] [CrossRef]
- Yi, X.-P.; Zhang, Y.-L.; Yao, H.-S.; Luo, H.-H.; Gou, L.; Chow, W.S.; Zhang, W.-F. Rapid recovery of photosynthetic rate following soil water deficit and re-watering in cotton plants (Gossypium herbaceum L.) is related to the stability of the photosystems. J. Plant. Physiol. 2016, 194, 23–34. [Google Scholar] [CrossRef]
- Ghouil, H.; Montpied, P.; Epron, D.; Ksontini, M.; Hanchi, B.; Dreyer, E. Thermal optima of photosynthetic functions and thermostability of photochemistry in cork oak seedlings. Tree Physiol. 2003, 23, 1031–1039. [Google Scholar] [CrossRef] [Green Version]
- Oukarroum, A.; El Madidi, S.; Schansker, G.; Strasser, R.J. Probing the responses of barley cultivars (Hordeum vulgare L.) by chlorophyll a fluorescence OLKJIP under drought stress and re-watering. Environ. Exp. Bot. 2007, 60, 438–446. [Google Scholar] [CrossRef]
- Lazár, D. The polyphasic chlorophyll a fluorescence rise measured under high intensity of exciting light. Funct. Plant. Biol. 2006, 33, 9–30. [Google Scholar] [CrossRef] [PubMed]
- Strasser, R.J.; Tsimilli-Michael, M.; Srivastava, A. Analysis of the chlorophyll a fluorescence transient. In Chlorophyll Fluorescence: A Signature of Photosynthesis; Springer: Dordrecht, The Netherlands, 2004; pp. 321–362. [Google Scholar]
- Demmig-Adams, B.; Adams, W.W., III. Photoprotection in an ecological context: The remarkable complexity of thermal energy dissipation. New Phytol 2006, 172, 11–21. [Google Scholar] [CrossRef] [PubMed]
- Goltsev, V.N.; Kalaji, H.; Paunov, M.; Bąba, W.; Horaczek, T.; Mojski, J.; Kociel, H.; Allakhverdiev, S. Variable chlorophyll fluorescence and its use for assessing physiological condition of plant photosynthetic apparatus. Russ. J. Plant. Physiol. 2016, 63, 869–893. [Google Scholar] [CrossRef]
- Bauweraerts, I.; Ameye, M.; Wertin, T.M.; McGuire, M.A.; Teskey, R.O.; Steppe, K. Water availability is the decisive factor for the growth of two tree species in the occurrence of consecutive heat waves. Agric. For. Meteorol. 2014, 189-190, 19–29. [Google Scholar] [CrossRef]
- Birami, B.; Gattmann, M.; Heyer, A.G.; Grote, R.; Arneth, A.; Ruehr, N.K. Heat waves alter carbon allocation and increase mortality of Aleppo pine under dry conditions. Front. For. Glob. Chang. 2018, 1, 8. [Google Scholar] [CrossRef]
- Ruehr, N.K.; Gast, A.; Weber, C.; Daub, B.; Arneth, A. Water availability as dominant control of heat stress responses in two contrasting tree species. Tree Physiol. 2015, 36, 164–178. [Google Scholar] [CrossRef] [PubMed] [Green Version]
- Henry, C.; John, G.P.; Pan, R.; Bartlett, M.K.; Fletcher, L.R.; Scoffoni, C.; Sack, L. A stomatal safety-efficiency trade-off constrains responses to leaf dehydration. Nat. Commun. 2019, 10, 1–9. [Google Scholar] [CrossRef] [PubMed] [Green Version]
- Jha, K.; Doshi, A.; Patel, P.; Shah, M. A comprehensive review on automation in agriculture using artificial intelligence. Artif. Intell. Agric. 2019, 2, 1–12. [Google Scholar] [CrossRef]
- Lausch, A.; Erasmi, S.; King, D.; Magdon, P.; Heurich, M. Understanding forest health with remote sensing—Part I—A review of spectral traits, processes and remote-sensing characteristics. Remote. Sens. 2016, 8, 1029. [Google Scholar] [CrossRef] [Green Version]
- Simone, P.; Stefano, P.; Raffaele, C.; Roshanak, D.; Wenjiang, H. Hyperspectral remote sensing of agriculture and vegetation. Remote. Sens. 2020, 12, 3665. [Google Scholar]
- Flexas, J.; Medrano, H. Drought-inhibition of photosynthesis in C3 plants: Stomatal and non-stomatal limitations revisited. Ann. Bot-Lond. 2002, 89, 183–189. [Google Scholar] [CrossRef] [PubMed] [Green Version]
- Ogbaga, C.C.; Stępień, P.; Johnson, G.N. Sorghum (Sorghum bicolor) varieties adopt strongly contrasting strategies in response to drought. Physiol. Plant. 2014, 152, 389–401. [Google Scholar] [CrossRef]
- R Development Core Team. R: A Language and Environment for Statistical Computing; R Foundation for Statistical Computing: Vienna, Austria, 2018; Available online: http://www.R-project.org (accessed on 1 December 2020).


| Fluorescence Parameters | Calculation | |
|---|---|---|
| Fo | Fluorescence signal at 50 μs | - |
| F300 | Fluorescence signal at 300 μs | - |
| FJ | Fluorescence signal at 2 ms | - |
| FI | Fluorescence signal at 30 ms | - |
| FM | Maximal fluorescence signal | - |
| Mo | Initial slope of the induction curve | 4 (F300 − Fo)/(FM − Fo) |
| VJ | Relative variable fluorescence at 2 ms | (FJ − Fo)/(FM − Fo) |
| VI | Relative variable fluorescence at 30 ms | (FI − Fo)/(FM − Fo) |
| VOJ | Relative variable fluorescence of the O–J phase at 300 μs | (F300 − Fo)/(FJ − Fo) |
| ΔVIP | Relative amplitude of the I–P (FM) phase | (FM − FI)/(FM − Fo) |
| Specific fluxes per active PSII reaction center | ||
| ABS/RC | Absorption flux, effective antenna size of an active reaction center | Mo (1/VJ) (1/ΦPo) |
| TRo/RC | Trapped energy flux leading to a reduction in QA | Mo (1/VJ) |
| ETo/RC | Electron transport flux further than QA | Mo (1/VJ) (1 − VJ) |
| DIo/RC | Dissipation flux | ABS/RC − TRo/RC |
| REo/RC | Electron flux leading to a reduction in the PSI end acceptor | Mo (1/VJ) (1 − VI) |
| Quantum efficiency/flux ratios | ||
| ΦPo | Quantum yield of primary photochemistry; probability that an absorbed photon leads to a reduction in QA | (FM − Fo)/FM |
| ΦEo | Quantum yield of electron transport; probability that an absorbed photon leads to electron transport further than QA | ETo/ABS |
| ΦDo | Probability that the energy of an absorbed photon is dissipated as heat | 1 − ΦPo |
| ΦRo | Probability that an absorbed photon leads to a reduction in the PSI end acceptor | REo/ABS |
| δRo | Probability that an electron from the intersystem electron carriers is transported to the PSI end acceptor | REo/ETo |
| φo | Probability that an absorbed photon leads to reduction further than QA. | 1 − VJ |
| Area above the induction curve | ||
| Area | Integrated area between the induction curve and F | FM |
| SM | Normalized area | Area/(FM − Fo) |
| Performance indices | ||
| PIabs | Performance index on an absorption basis: the efficiency of energy conservation from absorbed photons to a reduction in intersystem electron carriers | (RC/ABS) [(ΦPo/(1 − ΦPo)] [(1 − VJ)/(1 − (1 − VJ))] |
| PItot | Efficiency of energy conservation from the absorbed photons to a reduction in PSI end acceptors | PIabs δRo/(1 − δRo) |
| Treatments | ΦPO | PIabs | ABS/RC | DIO/RC | ||||
|---|---|---|---|---|---|---|---|---|
| t Value | p Value | t Value | p Value | t Value | p Value | t Value | p Value | |
| Heat | −12.449 | <0.0001 | −13.632 | <0.0001 | 3.332 | 0.0009 | 7.824 | <0.0001 |
| Drought | 2.136 | 0.033 | 1.653 | 0.0988 | −4.279 | <0.0001 | −3.625 | 0.0003 |
| Species | −3.386 | 0.0007 | 6.726 | <0.0001 | 9.705 | <0.0001 | 5.727 | <0.0001 |
| Heat × Drought | 6.734 | <0.0001 | 6.652 | <0.0001 | −2.859 | 0.004 | −4.478 | <0.0001 |
| Heat × Species | −4.765 | <0.0001 | −2.981 | 0.003 | 7.109 | <0.0001 | 5.999 | <0.0001 |
| Drought × Species | 4.414 | <0.0001 | 4.427 | <0.0001 | −2.713 | 0.0068 | −4.324 | <0.0001 |
| Heat × Drought × Species | 2.779 | 0.006 | −2.574 | 0.010 | −3.638 | 0.0003 | −3.024 | 0.002 |
| Treatments | ΦPO | PIabs | ABS/RC | DIO/RC | ||||
|---|---|---|---|---|---|---|---|---|
| t Value | p Value | t Value | p Value | t Value | p Value | t Value | p Value | |
| Heat Relief (DT) | 4.971 | <0.0001 | 6.531 | <0.0001 | −1.692 | 0.092 | −3.587 | 0.0004 |
| Species | −2.384 | 0.018 | −1.864 | 0.0640 | 5.651 | <0.0001 | 3.949 | 0.0001 |
| Heat Relief (DT) × Species | −1.873 | 0.0630 | −3.955 | 0.0001 | 0.097 | 0.922 | 1.034 | 0.302 |
| Heat Relief (WW) | −0.283 | 0.777 | 0.712 | 0.477 | 2.583 | 0.010 | 1.619 | 0.107 |
| Species | −2.468 | 0.014 | 2.689 | 0.008 | 6.950 | <0.0001 | 5.258 | <0.0001 |
| Heat Relief (WW) × Species | 2.544 | 0.012 | −2.223 | 0.027 | −4.517 | <0.0001 | −2.944 | 0.004 |
| Re-watering (DT) | −0.772 | 0.441 | −1.181 | 0.239 | 0.601 | 0.548 | 0.861 | 0.390 |
| Species | −2.303 | 0.022 | −3.518 | 0.001 | 6.166 | <0.0001 | 4.718 | <0.0001 |
| Re-watering (DT) × Species | −2.499 | 0.013 | −2.891 | 0.004 | 4.401 | <0.0001 | 3.696 | 0.0003 |
Publisher’s Note: MDPI stays neutral with regard to jurisdictional claims in published maps and institutional affiliations. |
© 2021 by the authors. Licensee MDPI, Basel, Switzerland. This article is an open access article distributed under the terms and conditions of the Creative Commons Attribution (CC BY) license (https://creativecommons.org/licenses/by/4.0/).
Share and Cite
Zhu, L.; Wen, W.; Thorpe, M.R.; Hocart, C.H.; Song, X. Combining Heat Stress with Pre-Existing Drought Exacerbated the Effects on Chlorophyll Fluorescence Rise Kinetics in Four Contrasting Plant Species. Int. J. Mol. Sci. 2021, 22, 10682. https://doi.org/10.3390/ijms221910682
Zhu L, Wen W, Thorpe MR, Hocart CH, Song X. Combining Heat Stress with Pre-Existing Drought Exacerbated the Effects on Chlorophyll Fluorescence Rise Kinetics in Four Contrasting Plant Species. International Journal of Molecular Sciences. 2021; 22(19):10682. https://doi.org/10.3390/ijms221910682
Chicago/Turabian StyleZhu, Lingling, Wei Wen, Michael R. Thorpe, Charles H. Hocart, and Xin Song. 2021. "Combining Heat Stress with Pre-Existing Drought Exacerbated the Effects on Chlorophyll Fluorescence Rise Kinetics in Four Contrasting Plant Species" International Journal of Molecular Sciences 22, no. 19: 10682. https://doi.org/10.3390/ijms221910682
APA StyleZhu, L., Wen, W., Thorpe, M. R., Hocart, C. H., & Song, X. (2021). Combining Heat Stress with Pre-Existing Drought Exacerbated the Effects on Chlorophyll Fluorescence Rise Kinetics in Four Contrasting Plant Species. International Journal of Molecular Sciences, 22(19), 10682. https://doi.org/10.3390/ijms221910682