Article

Imatinib Regulates miR-483-3p and Mitochondrial Respiratory Complexes in Gastrointestinal Stromal Tumors

1
Department of Oncology-Pathology, Karolinska Institutet, BioClinicum J6:20, Karolinska University Hospital, 171 64 Solna, Sweden
2
Division of Hematology-Oncology, Department of Internal Medicine, Chang Gung Memorial Hospital at Linkou, Taoyuan 33305, Taiwan
3
Department of Surgery, Chang Gung Memorial Hospital and GIST Team at Linkou, Chang Gung University College of Medicine, Taoyuan 33305, Taiwan
4
Department of Molecular Medicine and Surgery, Karolinska Institutet, 171 76 Stockholm, Sweden
*
Authors to whom correspondence should be addressed.
These authors contributed equally to this work.
Int. J. Mol. Sci. 2021, 22(19), 10600; https://doi.org/10.3390/ijms221910600
Submission received: 12 May 2021 / Revised: 25 September 2021 / Accepted: 26 September 2021 / Published: 30 September 2021
(This article belongs to the Special Issue Molecular Target and Action Mechanism of Anti-Cancer Agents)

Abstract

:
Metabolic adaptation to increased oxidative phosphorylation (OXPHOS) has been found in gastrointestinal stromal tumor (GIST) upon imatinib treatment. However, the underlying mechanism of imatinib-induced OXPHOS is unknown. Discovering molecules that mediate imatinib-induced OXPHOS may lead to the development of therapeutic strategies synergizing the efficacy of imatinib. In this study, we explored the role of microRNAs in regulating OXPHOS in GIST upon imatinib treatment. Using a microarray approach, we found that miR-483-3p was one of the most downregulated miRNAs in imatinib-treated tumors compared to untreated tumors. Using an extended series of GIST samples, we further validated the downregulation of miR-483-3p in imatinib-treated GIST samples by RT-qPCR. Using both gain- and loss-of-function experiments, we showed that miR-483-3p could regulate mitochondrial respiratory Complex II expression, suggesting its role in OXPHOS regulation. Functionally, miR-483-3p overexpression could rescue imatinib-induced cell death. These findings provide the molecular link for imatinib-induced OXPHOS expression and the biological role of miR-483-3p in regulating cell viability upon imatinib treatment.

1. Introduction

Gastrointestinal stromal tumor (GIST) is the most common type of gastrointestinal mesenchymal tumor, primarily harboring gain of function mutations in the KIT or platelet-derived growth factor receptor-alpha (PDGFRA) genes [1]. The tyrosine kinase inhibitor imatinib that blocks c-KIT and PDGFRA activation is the mainstay treatment for advanced GIST, which has led to improved survival with a median progression-free survival of 18–20 months and a median overall survival of 52–72 months [2,3,4,5]. However, most patients who initially respond to imatinib treatment develop acquired resistance and tumor progression after two years [6].
Deregulated cell metabolism has been recognized as a hallmark of cancer [7]. Although the Warburg effect is generally accepted as the synonym of metabolic reprogramming, recent emerging evidence disclosed that tumor cells could alternate their bioenergetics between glycolysis and oxidative phosphorylation (OXPHOS) in a context-dependent fashion [8]. Metabolic adaptation with shifting from glycolysis to OXPHOS has been reported to promote cancer cell survival under the stress of drug treatment [9,10]. As shown by us [11] and Vitiello et al. [12], GIST cells can upregulate OXPHOS levels of Complex II, III, and V as an adaptation to imatinib treatment. Targeting OXPHOS enhances the cytotoxic effect of imatinib in GIST [12].
The underlying mechanism of metabolic reprogramming upon imatinib treatment in GIST remains elusive. We previously demonstrated that imatinib also suppressed mitochondrial biogenesis [11], suggesting that imatinib does not induce OXPHOS through mitochondrial biogenesis. In the present study, we speculate that imatinib might induce OXPHOS through microRNA regulation in GIST.
MicroRNAs (miRNAs) are small non-coding RNA molecules with a length of 18–25 nucleotides that regulate gene expression in a sequence-specific manner. Several miRNAs have been demonstrated to regulate OXPHOS by targeting the expression of mitochondrial electron transport chain complexes. For example, miR-210 has been demonstrated to target multiple mitochondrial respiratory complexes, including Complex I (NDUFA4) [13,14], Complex II (SDHD) [14], and Complex IV (COX10) [15]. Both miR-181c and miR-338 can target Complex IV (COX1 [16] and COX4 [17], respectively), while miR-127-5p and miR-141 regulate Complex V (ATP synthases) [18,19].
Herein, we compared miRNA expression profiles between imatinib-treated and untreated GIST tumors and identified a subset of miRNAs that were differentially expressed between the two groups. Among them, miR-483-3p was further investigated for its association with imatinib treatment and its involvement in OXPHOS regulation. Our results suggest that miR-483-3p may contribute to imatinib-induced OXPHOS in GIST cells.

2. Results

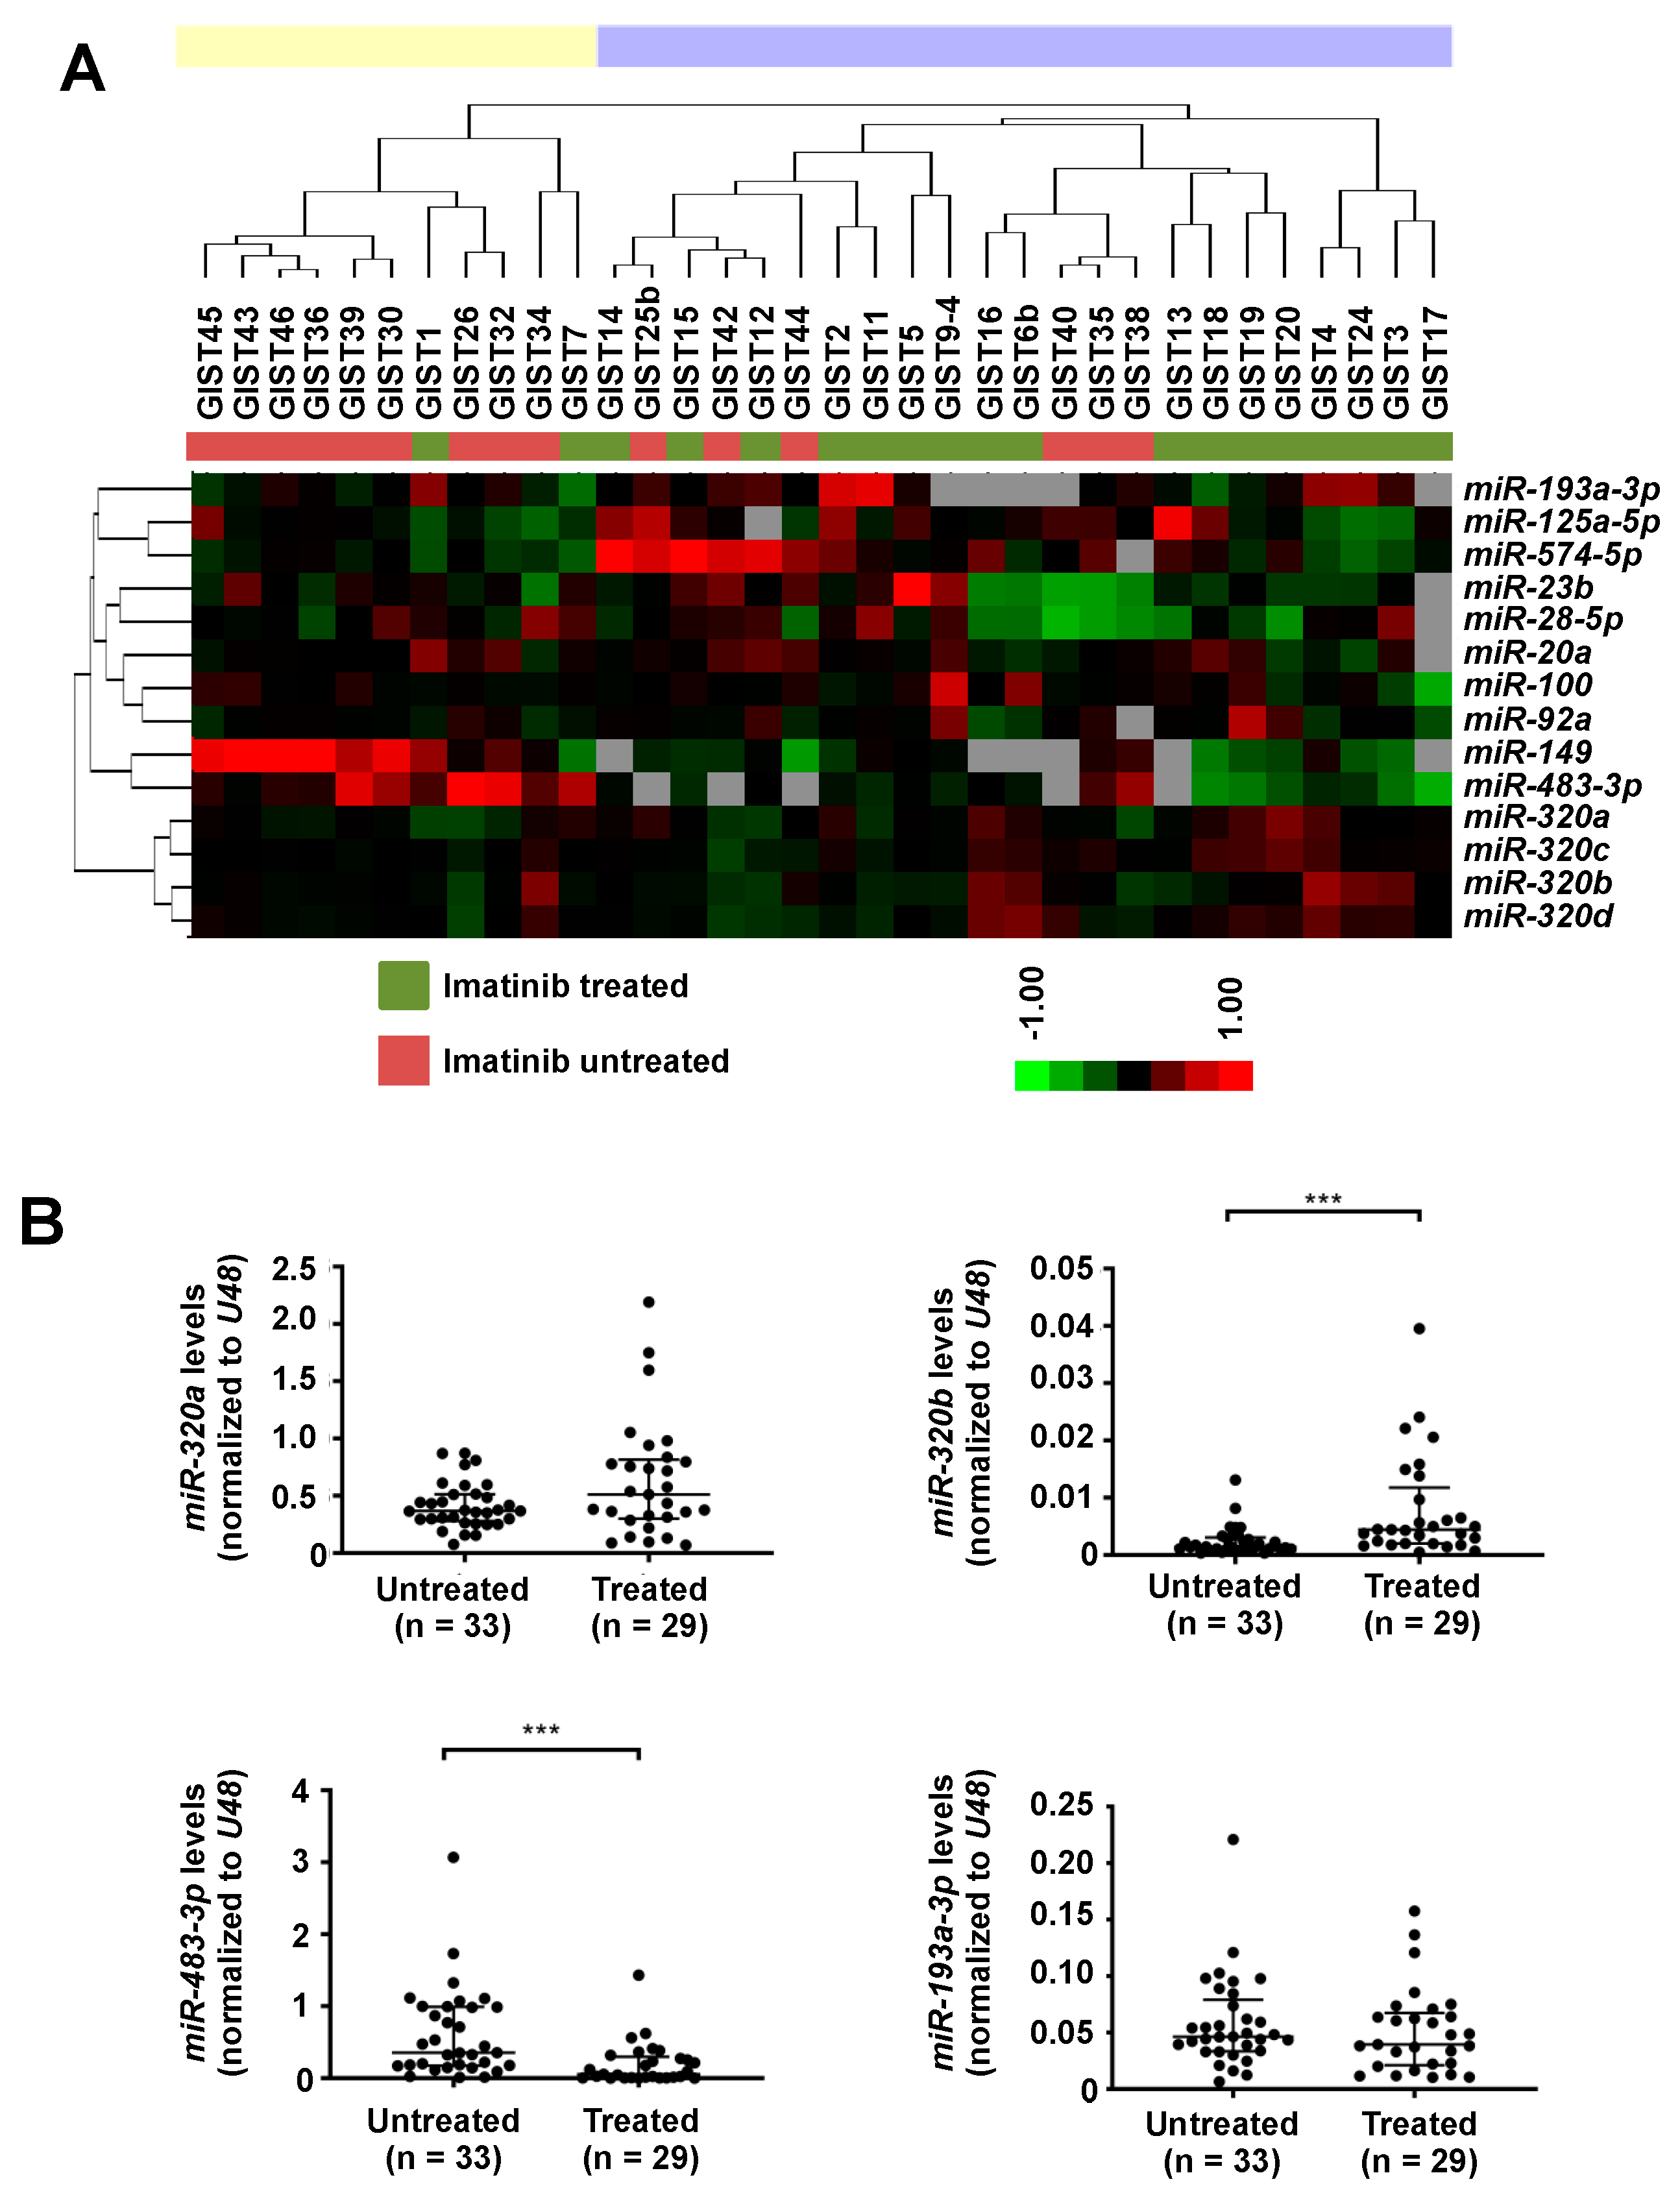
2.1. Differentially Expressed miRNAs between Imatinib-Treated and Untreated GISTs

Global miRNA expression levels of 34 GISTs, including 19 imatinib-treated and 15 untreated tumors, were characterized using a microarray-based platform. After normalization and filtering, 139 miRNAs were included for further analyses. Using SAM analysis, 12 up-regulated and 2 down-regulated miRNAs were identified with a false discovery rate (FDR, q-value) of <20% in the imatinib-treated compared to untreated GISTs (Table 1).
We then performed hierarchical clustering analysis of the 34 GIST samples using these 14 significant differentially expressed miRNAs. The analysis classified the samples into two main clusters: all imatinib untreated samples but two (GIST1 and GIST7) were grouped together, while the majority of the treated samples (17 out of 19) were clustered in a separate group (Figure 1A).
To validate the miRNA array data, we performed RT-qPCR analyses of four selected miRNAs in an extended cohort of 62 samples. We found significantly higher expression of miR-320b (p = 0.001, Mann–Whitney U-test) and lower expression of miR-483-3p (p < 0.001, Mann Whitney U-test) in imatinib-treated GISTs, as compared to untreated GISTs (Figure 1B). The expression of miR-320a and miR-193a-3p did not differ significantly between imatinib-treated and untreated tumors (Figure 1B).

2.2. miR-320b and miR-483-3p Expression in GIST Cells upon Imatinib Treatment

To determine whether miR-320b and miR-483-3p can be regulated by imatinib, we quantified their expressions in GIST cell lines after 24 h of imatinib treatment. Consistent with the observations in clinical samples, we found significant upregulation of miR-320b and downregulation of miR-483-3p in GIST 882 and GIST T1 upon treatment with 1 μM imatinib (Figure 2).

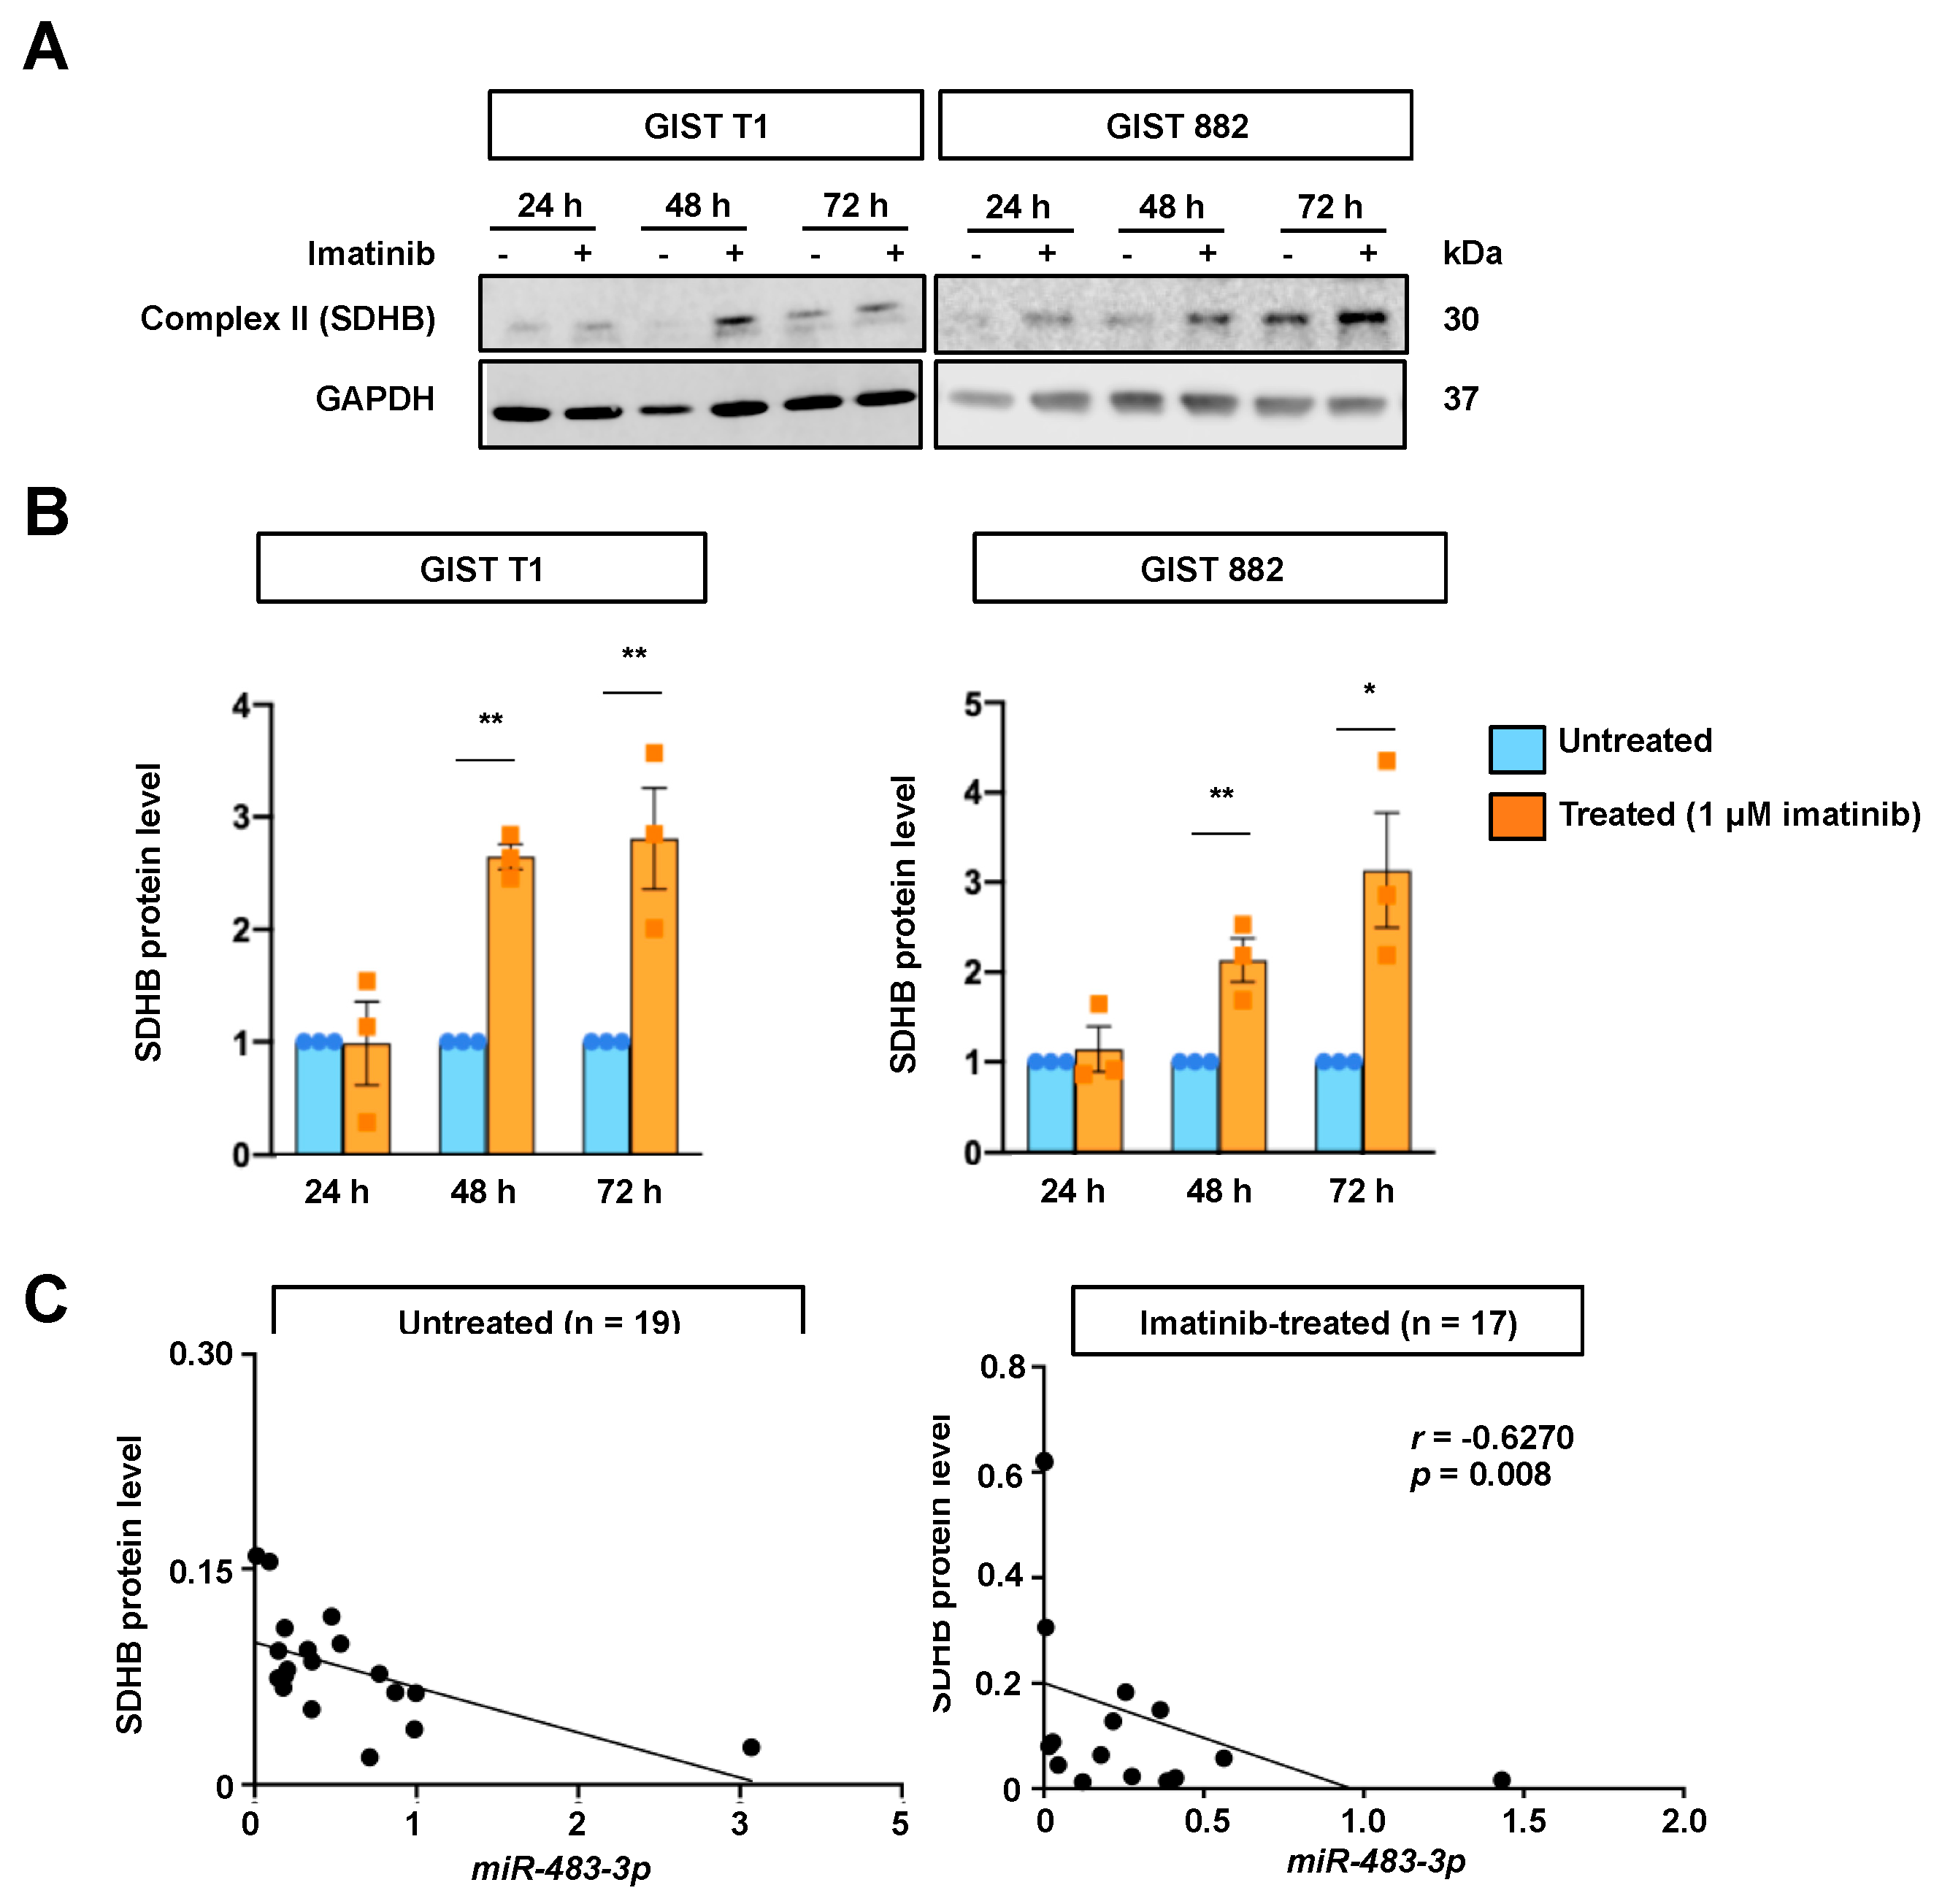
2.3. Effects of miR-483-3p on OXPHOS Protein Expressions

Vitiello et al. and our previous study have shown upregulated OXPHOS proteins upon imatinib treatment [11,12]. Given that miR-483-3p is involved in the insulin pathway and in glucose metabolism [20], we further investigated whether miR-483-3p plays a role in the regulation of OXPHOS proteins (Figure 3). In both GIST cell lines, we observed that inhibition of miR-483-3p, using miRNA inhibitor, increased protein expression of Complex II (SDHB), but not Complexes III (UQCRC2) or V (ATP5A) (Figure 3A,B). Conversely, overexpression of miR-483-3p, using miRNA mimic, reduced Complex II (SDHB) protein levels in both cell lines, while no significant changes were observed for Complex III (UQCRC2) or V (ATP5A) (Figure 3C,D). Notably, miR-483-3p overexpression or inhibition did not yield significant changes in SDHB mRNA levels (Figure 3E).

2.4. Relationship between miR-483-3p and SDHB Expression upon Imatinib Treatment

Given that imatinib decreased miR-483-3p expression, we evaluated the expression of the Complex II component SDHB in GIST cell lines with and without imatinib treatment. As shown in Figure 4A,B, we observed increased SDHB protein levels in both cell lines after imatinib treatment for 48 h and 96 h. To further establish the relationship between miR-483-3p and SDHB expression, we compared miR-483-3p and SDHB protein expression in GIST tumor samples. The results showed inverse correlations between miR-483-3p and SDHB expression for both untreated (r = −0.5801, p = 0.009) and imatinib-treated (r = −0.6270, p = 0.008) GISTs (Figure 4C).

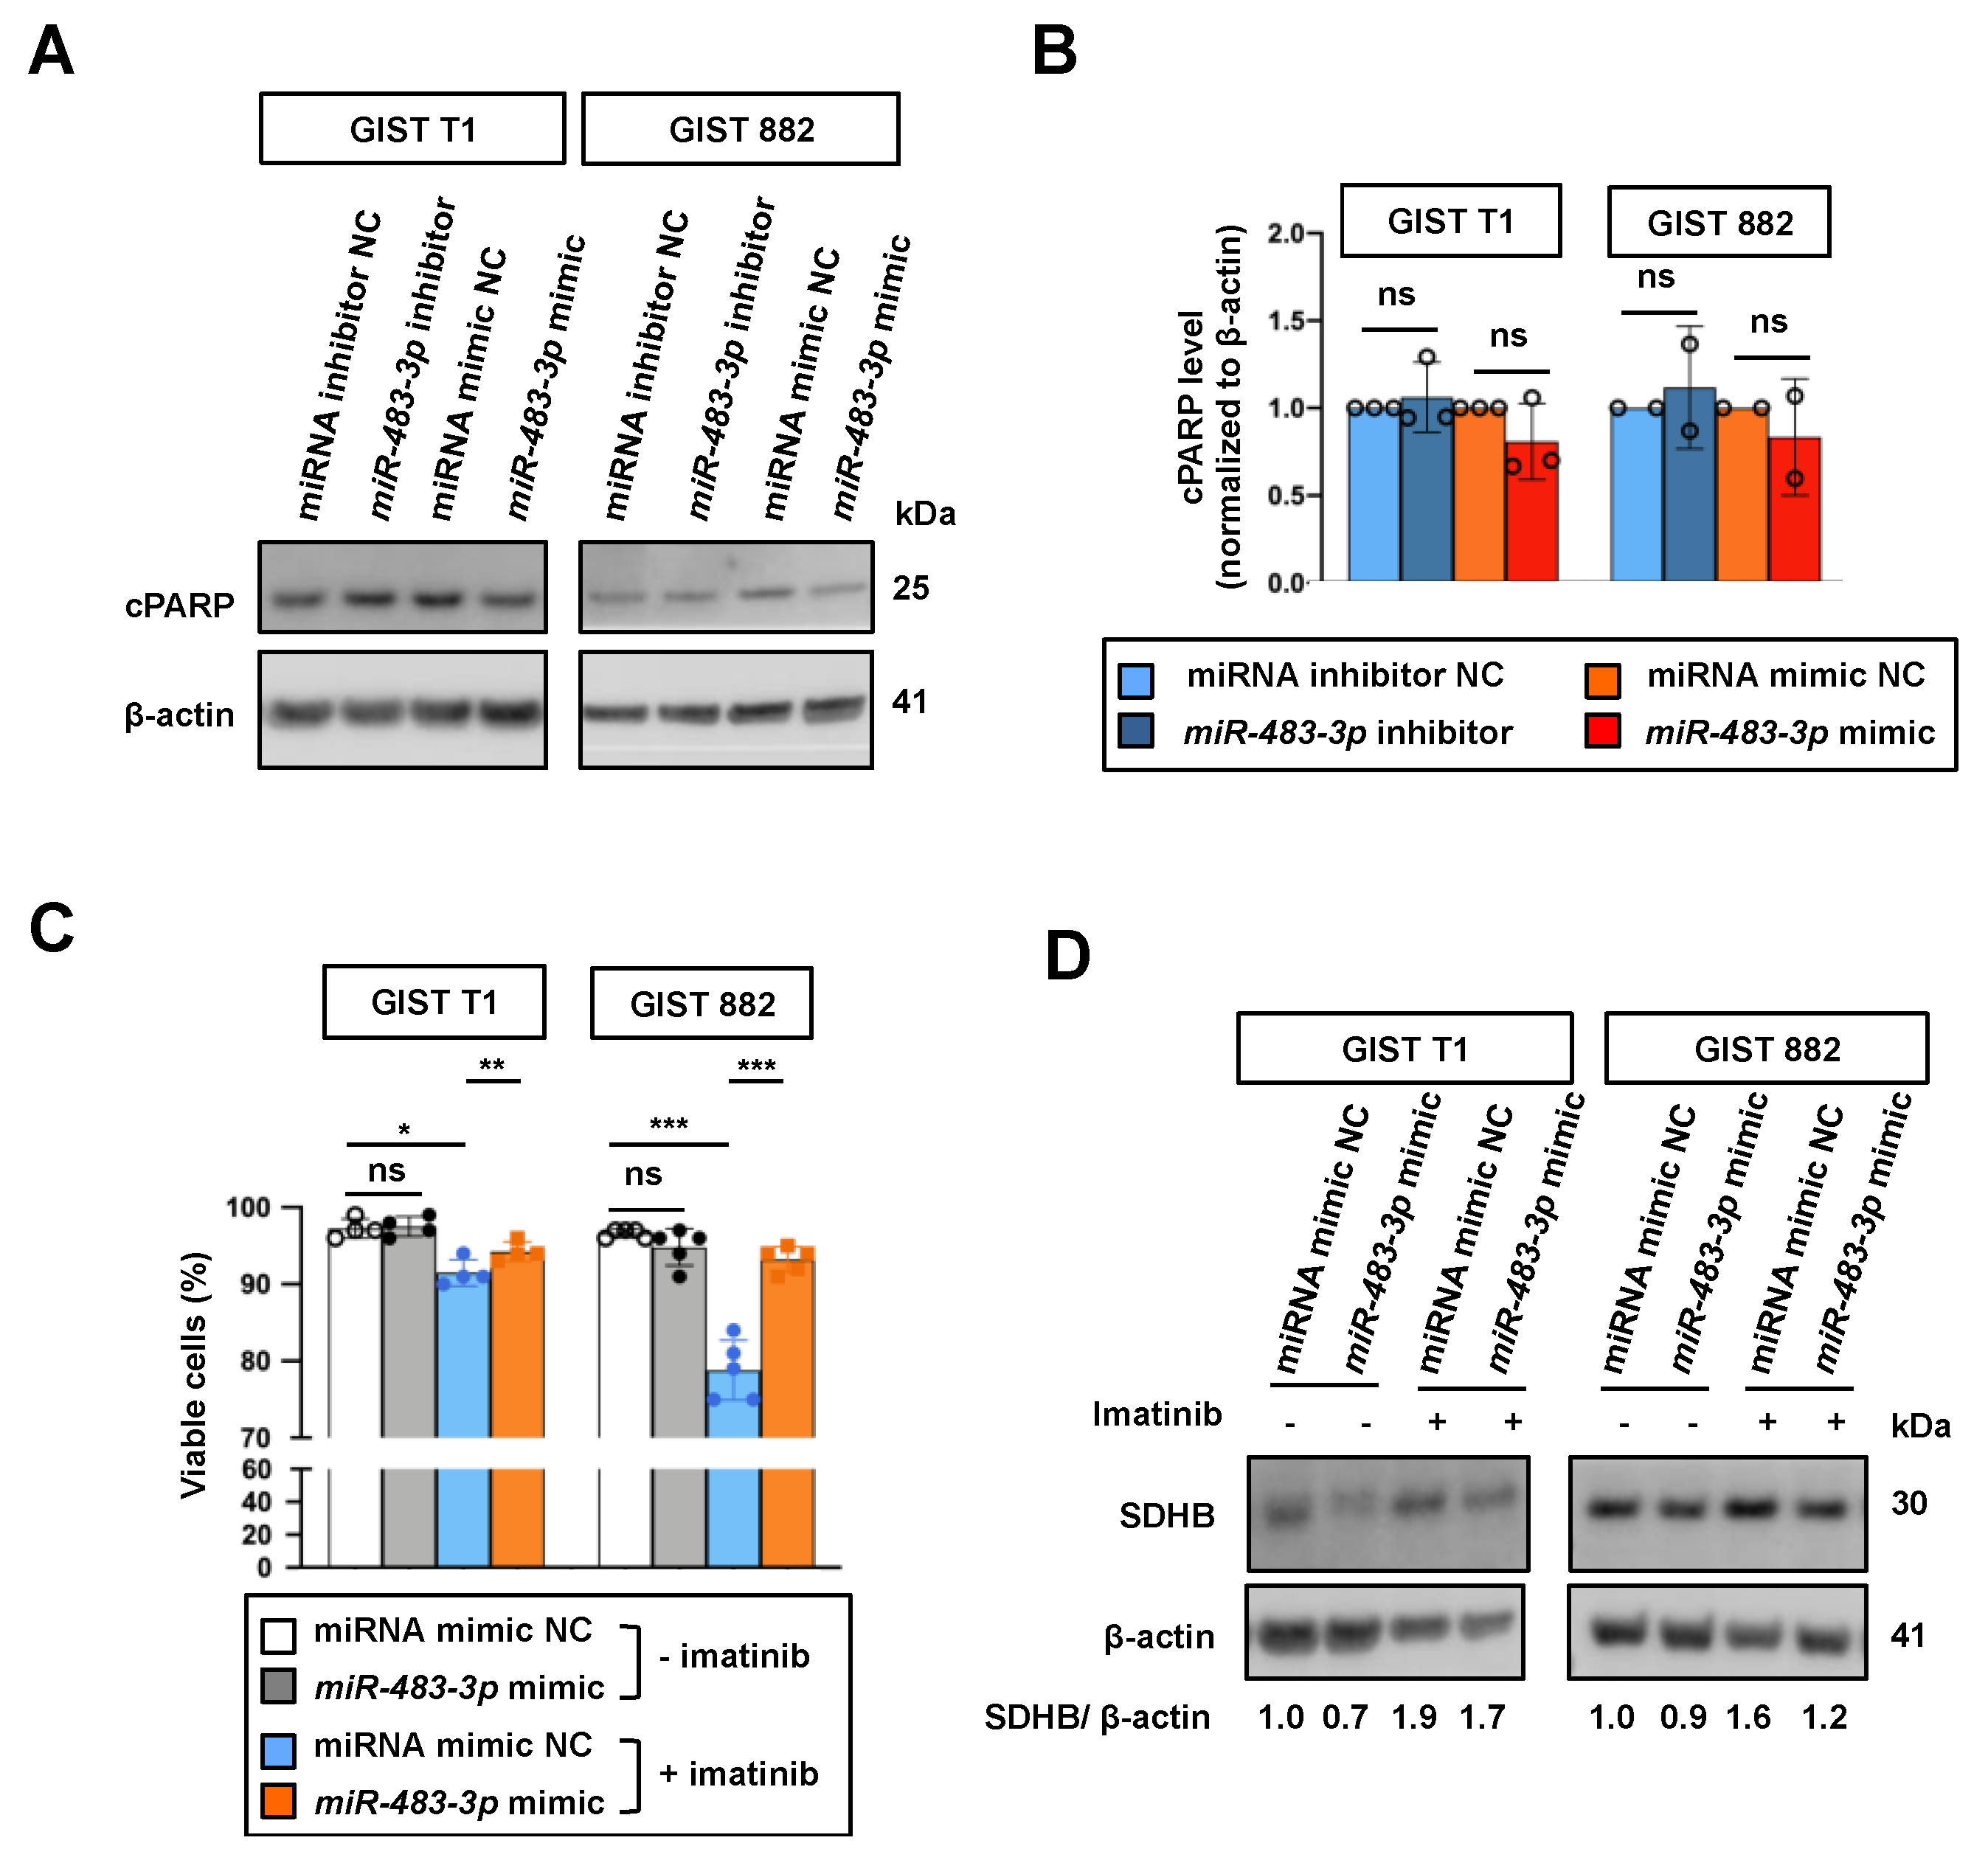
2.5. Functional Role of miR-483-3p in Regulation of Cell Viability upon Imatinib Treatment

To address the functional role of miR-483-3p in GIST cells, we assessed the effect of miR-483-3p inhibition or overexpression on the expression of cleaved PARP (cPARP), which is a marker for apoptosis. No significant changes were found on cPARP level upon inhibition or overexpression of miR-483-3p (Figure 5A,B), as well as cell viability in miR-483-3p overexpressing cells (Figure 5C). However, overexpression of miR-483-3p rescued cell death in imatinib treated cells, as assessed by trypan blue staining (Figure 5C). Notably, overexpression of miR-483-3p also reversed imatinib-induced SDHB expression (Figure 5D). Together, these results support the involvement of miR-483-3p in imatinib-induced SDHB expression and the important role of this regulation in protecting cell death induced by imatinib treatment.

3. Discussion

Cancer cells can exhibit metabolic adaptation in response to targeted therapy [21]. Several pieces of evidence have revealed that mitochondrial OXPHOS drives resistance to chemotherapy or targeted drugs in leukemia and solid tumors [22]. Similarly, GIST cells upregulate OXPHOS upon imatinib treatment [11,12]. However, the mechanism underlying such metabolic reprogramming is not fully understood. Here we propose the involvement of miR-483-3p in OXPHOS regulation in response to imatinib.
miR-483 is located in intron 7 of the insulin-like growth factor 2 gene (IGF2) in chromosomal region 11p15. Two mature miRNAs, miR-483-3p and miR-483-5p, are processed from the stem-loop structure of the precursor and both are known to play important roles in cancer development [23]. miR-483-3p is often aberrantly overexpressed in cancers such as adrenocortical carcinoma [24], pancreatic cancer [25], Wilms’ tumor [26], hepatocellular carcinoma [27], colon cancer [26], and prostate cancer [28]. In contrast, downregulation of miR-483-3p has been found in some other cancer types, including nasopharyngeal cancer [29], breast [30], and gastric [31] cancers. These findings suggest that miR-483-3p may function as an oncogene or tumor suppressor, depending on the cellular context. In GIST, overexpression of miR-483-3p was found in CD117 positive/KIT-mutated tumors as compared to CD117 negative/KIT-unmutated tumors [32]. Wild-type GIST is a distinct subgroup of GIST that lacks KIT and PDGFRA mutations, which can be further classified as SDH-deficient or SDH-competent. SDH-deficient GISTs commonly harbor inactivating mutations in SDH subunit genes (SDHA, SDHB, SDHC or SDHD) or promoter hypermethylation of SDHC [33,34]. Increased expression of the insulin-like growth factor 1 receptor (IGF1R) is commonly found in SDH-deficient GISTs but rarely in SDH-competent GISTs [35]. Of note, IGF2 is a ligand exerting its effects by binding to the IGF1R. Future studies are warranted to investigate the relationship between miR-483-3p, IGF2, and SDH.
Here we observed reduced expression of miR-483-3p upon imatinib treatment. Although it is unclear how imatinib regulates miR-483-3p expression, miR-483 transcription can be suppressed by glucose starvation and treatment with the glycolysis inhibitor 2-deoxy-d-glucose [36]. Given that imatinib can inhibit aerobic glycolysis and decrease glucose uptake [37], it is tempting to speculate that the reduction of miR-483-3p is caused by imatinib-mediated inhibition of glycolytic activity. The mechanism has yet to be elucidated.
Importantly, we demonstrate that miR-483-3p regulates Complex II but not Complexes III and V, suggesting the specificity of miR-483-3p in the regulation of Complex II. However, it is still unclear whether the regulation is direct or indirect. Complex II or SDH is a hetero-tetrameric protein complex consisting of SDHA, SDHB, SDHC and SDHD. Loss of any component of the SDH complex can lead to destabilization of the SDH complex and rapid degradation of the SDHB protein. Thus, loss of SDHB expression is a reliable marker for SDH deficiency [38,39], which leads to the question of which SDH subunit is a target of miR-483-3p. The interaction between miR-483-3p and SDH subunits is unknown. Although SDHB is not predicted as a target of miR-483-3p, SDHC is predicted as a putative target of miR-483-3p by RNAhybrid v2.2. Further investigation is needed to determine which SDH subunit is the potential direct target of miR-483-3p. To date, two miRNAs, miR-147b [40] and miR-210 [13] have been reported to regulate SDHD. In our study, we did not find miR-210 to be differentially expressed between imatinib-treated and untreated GIST samples, however, miR-147b was not detected.
Our previous work has shown that imatinib could increase the expression of several OXPHOS proteins, including Complexes II, III and V [11]. Given that miR-483-3p only regulates Complex II, it is possible that other miRNAs or factors could regulate OXPHOS proteins. It is worth mentioning that miR-483-5p was also downregulated in imatinib-treated as compared to untreated GIST tumors in our microarray data, however the FDR was 28.8%, which is higher than the arbitrary cut-off (20%) that we set in this study. This miRNA is predicted to target multiple genes involved in OXPHOS, including Complex I (NDUFC1, NDUFA9, NDUFV3, NDUFA11, and NDUFA5), Complex III (UQCR11), Complex IV (COX19, COX6B1) and Complex V (ATP5S, and ATP5G1) by TargetScanHuman release 7.2 [41]. The other downregulated miRNA, miR-149, has been demonstrated to target poly(ADP-ribose) polymerase-2 that activates the sirtuin-1/peroxisome proliferator–activated receptor γ coactivator-1α (PGC1α) pathway, leading to increased mitochondrial biogenesis [42]. The involvement of miR-149 in mitochondrial biogenesis may provide the explanation for the suppression of PGC1α-dependent mitochondrial biogenesis by imatinib treatment observed in our previous study [11].

4. Conclusions

In conclusion, our results reveal that specific miRNAs are responsive to imatinib treatment. We also show that miR-483-3p can regulate mitochondrial respiratory Complex II, suggesting that suppression of this miRNA could partly contribute to increased OXPHOS upon imatinib treatment.

5. Materials and Methods

5.1. Clinical Samples

A total of 64 snap-frozen tumors from 56 GIST patients were included in this study. Of these, 30 tumors were from 24 patients who had received neoadjuvant imatinib treatment, and 34 tumors were from 32 patients who had not been treated with imatinib prior to surgery (referred to as untreated tumors). For 36 of the samples (19 untreated and 17 imatinib-treated), SDHB protein expression levels were previously determined by Western blot analysis as published in our previous study [11].

5.2. GIST Cell Lines and Imatinib Treatment

Two imatinib-sensitive GIST cell lines were used, i.e., GIST 882 and GIST T1. GIST 882 was kindly provided by Dr. Jonathan Fletcher (Brigham and Women’s Hospital, Boston, MA, USA). This cell line was cultured in RPMI 1640 medium containing 15% fetal bovine serum, and 2 mM L-glutamine at 37 °C with 5% CO2. GIST T1 was purchased from Cosmo Bio Co., Ltd. (Tokyo, Japan) and cultured in DMEM supplemented with 10% fetal bovine serum. The authenticity of these cell lines was previously confirmed by short tandem repeat (STR) profiling [11]. GIST cell lines were treated with 1 μM imatinib for the indicated time periods. This imatinib concentration was according to previous publication [11].

5.3. RNA Extraction and Quantification

Total RNA was extracted with mirVana miRNA Isolation Kit (Thermo Fisher Scientific, Waltham, MA, USA) and RNA concentrations were measured using a NanoDrop spectrophotometer (NanoDrop Technologies, Wilmington, DE, USA).

5.4. miRNA Expression Profiling

Genome-wide miRNA expression profiles were determined for 19 imatinib-treated and 15 untreated tumors. Results for 17 of the imatinib-treated tumors have been previously reported [43]. All samples were analyzed using the human miRNA microarray system (Agilent, Santa Clara, CA, USA), which contains 903 human miRNAs (miRbase release 14). Array hybridizations and data analysis were according to the previously described methodology [44]. The data were normalized and centered to median using the Cluster 3.0 software (http://bonsai.hgc.jp/~mdehoon/software/cluster/software.htm, accessed on 2 November 2014). Normalized miRNAs with less than 20% of missing values were further analyzed using Significance Analysis of Microarrays (SAM) to identify differentially expressed miRNAs. Java TreeView software (http://jtreeview.sourceforge.net, accessed on 2 November 2014) was used to visualize the data from hierarchical clustering.

5.5. Reverse Transcription Quantitative PCR (RT-qPCR)

Four selected mature miRNAs, including miR-320a (ID 002277), miR-320b (ID 002844), miR-193a-3p (ID 002250) and miR-483-3p (ID 002339), were quantified using TaqMan-based RT-qPCR assays (Thermo Fisher Scientific, Waltham, MA, USA). To obtain cDNA, total RNA (20 ng) was reverse-transcribed using TaqMan MicroRNA Reverse Transcription Kit (Thermo Fisher Scientific, Waltham, MA, USA). RT-qPCR was performed using the TaqMan Universal PCR Master Mix (Thermo Fisher Scientific, Waltham, MA, USA) in the ABI Prism 7900HT Real-time PCR System (Thermo Fisher Scientific, Waltham, MA, USA). RNU48 (ID 001006) was used as an endogenous control. For quantification of SDHB mRNA, cDNA was synthesized from 100 ng total RNA using High Capacity cDNA Reverse Transcription kit (Thermo Fisher Scientific) and RT-qPCR was performed using TaqMan pre-designed gene expression assays SDHB (Hs01042482_m1) and ACTB (Hs01060665_g1). All reactions were performed in triplicate, and relative expression levels were calculated with the delta CT method (2−ΔCT). For imatinib treatment experiments, the 2−ΔCT values of treated cells were normalized to the untreated control cells.

5.6. In Vitro Transfection of GIST Cells and Cell Viability Analysis

mirVana miR-483-3p inhibitors and mimics, and their respective negative controls (mirVana miRNA mimic and inhibitor negative control#1), were purchased from Thermo Fisher Scientific (Waltham, MA, USA). A total of 3 × 10⁶ GIST T1 and 882 cells were transfected with 50 pmol of miRNA mimics or inhibitors using Amaxa Nucleofector (Lonza, Basel, Switzerland), and program X01 and T20, respectively, according to the manufacturer’s instructions. For Western blotting, cells were harvested after 72 h of transfection.
For cell viability analysis, cells at 24 h post-transfection were treated with or without 1 μM imatinib for another 24 h, followed by staining with 0.4% trypan blue stain (Thermo Fisher Scientific, Waltham, MA, USA). Viable cells were counted using the TC10 automatic cell counter (Bio-Rad).

5.7. Western Blot Analysis

GIST cells were homogenized in NP-40 Lysis buffer (Thermo Fisher Scientific, Waltham, MA, USA) with the addition of 1% protease inhibitor (Sigma-Aldrich, St. Louis, MO, USA), 1 mM phenylmethanesulfonyl fluoride (Sigma-Aldrich, St. Louis, MO, USA) and 1% phosphatase inhibitor cocktail (Sigma-Aldrich, St. Louis, MO, USA). Protein concentrations were measured using Pierce BCA Protein Assay Kit (Thermo Fisher Scientific, Waltham, MA, USA). Thirty to fifty micrograms of lysates were separated by 4–12% NuPAGE® Bis-Tris gels (Thermo Fisher Scientific, Waltham, MA, USA) and transferred to nitrocellulose membranes (Thermo Fisher Scientific, Waltham, MA, USA) at 4 °C with constant 35 V for 2 h. After blocking with 5% bovine serum albumin diluted in TBS with 0.5% Tween-20, membranes were incubated with primary antibody anti-pTyr719-KIT (#3391, Cell Signalling Technology, Danvers, MA, USA) at 1:1000, anti-KIT (#3308, Cell Signalling Technology, Danvers, MA, USA) at 1:1000, anti-SDHB (10620-1-AP, Proteintech) at dilution 1:1000, anti-ATP5A (ab14748, abcam) at 1:1000 or anti-UQCRC2 (14742-1-AP, Proteintech) at 1:1000. For normalization purpose, the membranes were incubated with anti-β-actin (A2228, Sigma-Aldrich, St. Louis, MO, USA) at 1:2000 or anti-GAPDH (#2118, Cell Signalling Technology, Danvers, MA, USA) at 1:2000. The secondary antibodies included anti-rabbit IRDye 680 (#926-68071, LI-COR, Lincoln, NE, USA) at dilution 1:10,000 or anti-mouse IRDye 680 (#926-32210, LI-COR, Lincoln, NE, USA) at 1:10000. Precision Plus Protein All Blue Standards (#161-0373; Bio-Rad Laboratories, Hercules, CA, USA) was used as an indicator of molecular weights. Detection was carried out with the Odyssey CLx scanner (LI-COR Biotechnology, Lincoln, NE, USA). Protein expression levels were quantified using the Odyssey ImageStudio Lite software (LI-COR Biotechnology, Lincoln, NE, USA). For analyses of expression levels in imatinib-treated cells, protein expression levels in treated cells were normalized to the levels in untreated control cells.

5.8. Statistical Analysis

All statistical analyses were performed using Graphpad Prism 8.0 (Graphpad software, La Jolla, CA, USA). Independent Student’s t-test or Mann-Whitney U-test was performed to compare the expression of miRNA and protein in different patient groups and cell lines. Paired t-test was used to compare two different conditions between the experimental groups. Correlation between miR-483-3p and SDHB protein levels was assessed by Spearman’s Rank Order Correlation. All p-values were based on two-tailed tests, and a p-value < 0.05 was considered as statistically significant.

Author Contributions

Conceptualization, W.-K.H., H.S., P.A. and W.-O.L.; Methodology, W.-K.H., H.S., P.A., K.Z., A.G. and S.C.; Software, S.C.; Validation, W.-K.H., H.S., P.A., K.Z., A.G. and S.C.; Formal Analysis, W.-K.H., H.S., P.A., K.Z., A.G. and S.C.; Investigation, W.-K.H., H.S., P.A., K.Z., A.G. and S.C.; Resources, S.C. and R.B.; Data Curation, W.-K.H., H.S., P.A., K.Z., A.G., S.C., R.B., C.L. and W.-O.L.; Writing–Original Draft Preparation, W.-K.H., P.A. and W.-O.L.; Writing–Review & Editing, W.-K.H., H.S., P.A., K.Z., A.G., S.C., R.B., C.-N.Y., C.L. and W.-O.L.; Visualization, W.-K.H. and P.A.; Supervision, C.-N.Y., R.B., C.L. and W.-O.L.; Project Administration, W.-O.L.; Funding Acquisition, C.L. and W.-O.L. All authors have read and agreed to the published version of the manuscript.

Funding

The study was financially supported by grants from the Swedish Cancer Foundation, the Cancer Research Funds of Radiumhemmet, Chang Gung Memorial Hospital (CMRPG3K1721), the Stockholm County Council and Karolinska Institutet. W.-K.H. was supported by a doctoral fellowship from the Chang Gung Memorial Hospital, Taiwan.

Institutional Review Board Statement

The collection and use of the tissue materials in this study was approved by the Karolinska Institutet Research Ethics Committee North at Karolinska University Hospital (Dnr 02-282, 03-595 and 03-596), and the Stockholm Regional Ethical Review Board (Dnr 2013/1979-31 and 2018/2124-32).

Informed Consent Statement

The tissue samples were collected with informed consent between 2003 and 2012 at the Karolinska University Hospital Biobank.

Data Availability Statement

The microarray data are publicly available at the NCBI Gene Expression Omnibus (GSE63159).

Acknowledgments

The authors would like to thank Elisabeth Ånfalk for excellent handling of tumor samples.

Conflicts of Interest

The authors declare no conflict of interest. The sponsors had no role in the design, execution, interpretation, or writing of the study.

References

  1. Von Mehren, M.; Joensuu, H. Gastrointestinal Stromal Tumors. J. Clin. Oncol. 2018, 36, 136–143. [Google Scholar] [CrossRef]
  2. Blanke, C.D.; Demetri, G.D.; von Mehren, M.; Heinrich, M.C.; Eisenberg, B.; Fletcher, J.A.; Corless, C.L.; Fletcher, C.D.; Roberts, P.J.; Heinz, D.; et al. Long-term results from a randomized phase II trial of standard- versus higher-dose imatinib mesylate for patients with unresectable or metastatic gastrointestinal stromal tumors expressing KIT. J. Clin. Oncol. 2008, 26, 620–625. [Google Scholar] [CrossRef]
  3. Patrikidou, A.; Chabaud, S.; Ray-Coquard, I.; Bui, B.N.; Adenis, A.; Rios, M.; Bertucci, F.; Duffaud, F.; Chevreau, C.; Cupissol, D.; et al. Influence of imatinib interruption and rechallenge on the residual disease in patients with advanced GIST: Results of the BFR14 prospective French Sarcoma Group randomised, phase III trial. Ann. Oncol. 2013, 24, 1087–1093. [Google Scholar] [CrossRef]
  4. Gold, J.S.; van der Zwan, S.M.; Gonen, M.; Maki, R.G.; Singer, S.; Brennan, M.F.; Antonescu, C.R.; De Matteo, R.P. Outcome of metastatic GIST in the era before tyrosine kinase inhibitors. Ann. Surg. Oncol. 2007, 14, 134–142. [Google Scholar] [CrossRef]
  5. DeMatteo, R.P.; Lewis, J.J.; Leung, D.; Mudan, S.S.; Woodruff, J.M.; Brennan, M.F. Two hundred gastrointestinal stromal tumors: Recurrence patterns and prognostic factors for survival. Ann. Surg. 2000, 231, 51–58. [Google Scholar] [CrossRef]
  6. Chen, P.; Zong, L.; Zhao, W.; Shi, L. Efficacy evaluation of imatinib treatment in patients with gastrointestinal stromal tumors: A meta-analysis. World J. Gastroenterol. 2010, 16, 4227–4232. [Google Scholar] [CrossRef]
  7. Hanahan, D.; Weinberg, R.A. Hallmarks of cancer: The next generation. Cell 2011, 144, 646–674. [Google Scholar] [CrossRef] [Green Version]
  8. Faubert, B.; Solmonson, A.; DeBerardinis, R.J. Metabolic reprogramming and cancer progression. Science 2020, 368, eaaw5473. [Google Scholar] [CrossRef]
  9. Farge, T.; Saland, E.; de Toni, F.; Aroua, N.; Hosseini, M.; Perry, R.; Bosc, C.; Sugita, M.; Stuani, L.; Fraisse, M.; et al. Chemotherapy-Resistant Human Acute Myeloid Leukemia Cells Are Not Enriched for Leukemic Stem Cells but Require Oxidative Metabolism. Cancer Discov. 2017, 7, 716–735. [Google Scholar] [CrossRef] [Green Version]
  10. Hirpara, J.; Eu, J.Q.; Tan, J.K.M.; Wong, A.L.; Clement, M.V.; Kong, L.R.; Ohi, N.; Tsunoda, T.; Qu, J.; Goh, B.C.; et al. Metabolic reprogramming of oncogene-addicted cancer cells to OXPHOS as a mechanism of drug resistance. Redox Biol. 2019, 25, 101076. [Google Scholar] [CrossRef]
  11. Huang, W.K.; Gao, J.; Chen, Z.; Shi, H.; Yuan, J.; Cui, H.L.; Yeh, C.N.; Branstrom, R.; Larsson, C.; Li, S.; et al. Heterogeneity of Metabolic Vulnerability in Imatinib -Resistant Gastrointestinal Stromal Tumor. Cells 2020, 9, 1333. [Google Scholar] [CrossRef]
  12. Vitiello, G.A.; Medina, B.D.; Zeng, S.; Bowler, T.G.; Zhang, J.Q.; Loo, J.K.; Param, N.J.; Liu, M.; Moral, A.J.; Zhao, J.N.; et al. Mitochondrial Inhibition Augments the Efficacy of Imatinib by Resetting the Metabolic Phenotype of Gastrointestinal Stromal Tumor. Clin. Cancer Res. 2018, 24, 972–984. [Google Scholar] [CrossRef] [Green Version]
  13. Puissegur, M.P.; Mazure, N.M.; Bertero, T.; Pradelli, L.; Grosso, S.; Robbe-Sermesant, K.; Maurin, T.; Lebrigand, K.; Cardinaud, B.; Hofman, V.; et al. miR-210 is overexpressed in late stages of lung cancer and mediates mitochondrial alterations associated with modulation of HIF-1 activity. Cell Death Differ. 2011, 18, 465–478. [Google Scholar] [CrossRef] [PubMed] [Green Version]
  14. Nakada, C.; Hijiya, N.; Tsukamoto, Y.; Yano, S.; Kai, T.; Uchida, T.; Kimoto, M.; Takahashi, M.; Daa, T.; Matsuura, K.; et al. A transgenic mouse expressing miR-210 in proximal tubule cells shows mitochondrial alteration: Possible association of miR-210 with a shift in energy metabolism. J. Pathol. 2020, 251, 12–25. [Google Scholar] [CrossRef]
  15. Chen, Z.; Li, Y.; Zhang, H.; Huang, P.; Luthra, R. Hypoxia-regulated microRNA-210 modulates mitochondrial function and decreases ISCU and COX10 expression. Oncogene 2010, 29, 4362–4368. [Google Scholar] [CrossRef] [PubMed] [Green Version]
  16. Das, S.; Ferlito, M.; Kent, O.A.; Fox-Talbot, K.; Wang, R.; Liu, D.; Raghavachari, N.; Yang, Y.; Wheelan, S.J.; Murphy, E.; et al. Nuclear miRNA regulates the mitochondrial genome in the heart. Circ. Res. 2012, 110, 1596–1603. [Google Scholar] [CrossRef] [PubMed] [Green Version]
  17. Aschrafi, A.; Schwechter, A.D.; Mameza, M.G.; Natera-Naranjo, O.; Gioio, A.E.; Kaplan, B.B. MicroRNA-338 regulates local cytochrome c oxidase IV mRNA levels and oxidative phosphorylation in the axons of sympathetic neurons. J. Neurosci. 2008, 28, 12581–12590. [Google Scholar] [CrossRef] [PubMed]
  18. Willers, I.M.; Martinez-Reyes, I.; Martinez-Diez, M.; Cuezva, J.M. miR-127-5p targets the 3’UTR of human beta-F1-ATPase mRNA and inhibits its translation. Biochim. Biophys. Acta 2012, 1817, 838–848. [Google Scholar] [CrossRef] [PubMed]
  19. Baseler, W.A.; Thapa, D.; Jagannathan, R.; Dabkowski, E.R.; Croston, T.L.; Hollander, J.M. miR-141 as a regulator of the mitochondrial phosphate carrier (Slc25a3) in the type 1 diabetic heart. Am. J. Physiol. Cell Physiol. 2012, 303, C1244–C1251. [Google Scholar] [CrossRef] [PubMed] [Green Version]
  20. Pepe, F.; Visone, R.; Veronese, A. The Glucose-Regulated MiR-483-3p Influences Key Signaling Pathways in Cancer. Cancers 2018, 10, 181. [Google Scholar] [CrossRef] [Green Version]
  21. Sarmento-Ribeiro, A.B.; Scorilas, A.; Goncalves, A.C.; Efferth, T.; Trougakos, I.P. The emergence of drug resistance to targeted cancer therapies: Clinical evidence. Drug Resist. Updates 2019, 47, 100646. [Google Scholar] [CrossRef]
  22. Valcarcel-Jimenez, L.; Gaude, E.; Torrano, V.; Frezza, C.; Carracedo, A. Mitochondrial Metabolism: Yin and Yang for Tumor Progression. Trends Endocrinol. Metab. 2017, 28, 748–757. [Google Scholar] [CrossRef] [PubMed]
  23. Zhou, W.; Yang, W.; Ma, J.; Zhang, H.; Li, Z.; Zhang, L.; Liu, J.; Han, Z.; Wang, H.; Hong, L. Role of miR-483 in digestive tract cancers: From basic research to clinical value. J. Cancer 2018, 9, 407–414. [Google Scholar] [CrossRef] [Green Version]
  24. Ozata, D.M.; Caramuta, S.; Velazquez-Fernandez, D.; Akcakaya, P.; Xie, H.; Hoog, A.; Zedenius, J.; Backdahl, M.; Larsson, C.; Lui, W.O. The role of microRNA deregulation in the pathogenesis of adrenocortical carcinoma. Endocr. Relat. Cancer 2011, 18, 643–655. [Google Scholar] [CrossRef] [PubMed] [Green Version]
  25. Hao, J.; Zhang, S.; Zhou, Y.; Hu, X.; Shao, C. MicroRNA 483-3p suppresses the expression of DPC4/Smad4 in pancreatic cancer. FEBS Lett. 2011, 585, 207–213. [Google Scholar] [CrossRef] [PubMed] [Green Version]
  26. Veronese, A.; Lupini, L.; Consiglio, J.; Visone, R.; Ferracin, M.; Fornari, F.; Zanesi, N.; Alder, H.; D’Elia, G.; Gramantieri, L.; et al. Oncogenic role of miR-483-3p at the IGF2/483 locus. Cancer Res. 2010, 70, 3140–3149. [Google Scholar] [CrossRef] [Green Version]
  27. Veronese, A.; Visone, R.; Consiglio, J.; Acunzo, M.; Lupini, L.; Kim, T.; Ferracin, M.; Lovat, F.; Miotto, E.; Balatti, V.; et al. Mutated beta-catenin evades a microRNA-dependent regulatory loop. Proc. Natl. Acad. Sci. USA 2011, 108, 4840–4845. [Google Scholar] [CrossRef] [PubMed] [Green Version]
  28. Korzeniewski, N.; Tosev, G.; Pahernik, S.; Hadaschik, B.; Hohenfellner, M.; Duensing, S. Identification of cell-free microRNAs in the urine of patients with prostate cancer. Urol. Oncol. 2015, 33, 16.e17–16.e22. [Google Scholar] [CrossRef]
  29. Yi, C.; Wang, Q.; Wang, L.; Huang, Y.; Li, L.; Liu, L.; Zhou, X.; Xie, G.; Kang, T.; Wang, H.; et al. MiR-663, a microRNA targeting p21(WAF1/CIP1), promotes the proliferation and tumorigenesis of nasopharyngeal carcinoma. Oncogene 2012, 31, 4421–4433. [Google Scholar] [CrossRef] [Green Version]
  30. Menbari, M.N.; Rahimi, K.; Ahmadi, A.; Mohammadi-Yeganeh, S.; Elyasi, A.; Darvishi, N.; Hosseini, V.; Abdi, M. miR-483-3p suppresses the proliferation and progression of human triple negative breast cancer cells by targeting the HDAC8>oncogene. J. Cell Physiol. 2020, 235, 2631–2642. [Google Scholar] [CrossRef]
  31. Yu, F.Y.; Zhou, C.Y.; Liu, Y.B.; Wang, B.; Mao, L.; Li, Y. miR-483 is down-regulated in gastric cancer and suppresses cell proliferation, invasion and protein O-GlcNAcylation by targeting OGT. Neoplasma 2018, 65, 406–414. [Google Scholar] [CrossRef] [Green Version]
  32. Wang, Y.; Li, J.; Kuang, D.; Wang, X.; Zhu, Y.; Xu, S.; Chen, Y.; Cheng, H.; Zhao, Q.; Duan, Y.; et al. miR-148b-3p functions as a tumor suppressor in GISTs by directly targeting KIT. Cell Commun. Signal. 2018, 16, 16. [Google Scholar] [CrossRef] [Green Version]
  33. Killian, J.K.; Miettinen, M.; Walker, R.L.; Wang, Y.; Zhu, Y.J.; Waterfall, J.J.; Noyes, N.; Retnakumar, P.; Yang, Z.; Smith, W.I., Jr.; et al. Recurrent epimutation of SDHC in gastrointestinal stromal tumors. Sci. Transl. Med. 2014, 6, 268ra177. [Google Scholar] [CrossRef]
  34. Miettinen, M.; Lasota, J. Succinate dehydrogenase deficient gastrointestinal stromal tumors (GISTs)-a review. Int. J. Biochem. Cell Biol. 2014, 53, 514–519. [Google Scholar] [CrossRef] [PubMed] [Green Version]
  35. Lasota, J.; Wang, Z.; Kim, S.Y.; Helman, L.; Miettinen, M. Expression of the receptor for type i insulin-like growth factor (IGF1R) in gastrointestinal stromal tumors: An immunohistochemical study of 1078 cases with diagnostic and therapeutic implications. Am. J. Surg. Pathol. 2013, 37, 114–119. [Google Scholar] [CrossRef] [Green Version]
  36. Pepe, F.; Pagotto, S.; Soliman, S.; Rossi, C.; Lanuti, P.; Braconi, C.; Mariani-Costantini, R.; Visone, R.; Veronese, A. Regulation of miR-483-3p by the O-linked N-acetylglucosamine transferase links chemosensitivity to glucose metabolism in liver cancer cells. Oncogenesis 2017, 6, e328. [Google Scholar] [CrossRef] [PubMed] [Green Version]
  37. Gottschalk, S.; Anderson, N.; Hainz, C.; Eckhardt, S.G.; Serkova, N.J. Imatinib (STI571)-mediated changes in glucose metabolism in human leukemia BCR-ABL-positive cells. Clin. Cancer Res. 2004, 10, 6661–6668. [Google Scholar] [CrossRef] [Green Version]
  38. van Nederveen, F.H.; Gaal, J.; Favier, J.; Korpershoek, E.; Oldenburg, R.A.; de Bruyn, E.M.; Sleddens, H.F.; Derkx, P.; Riviere, J.; Dannenberg, H.; et al. An immunohistochemical procedure to detect patients with paraganglioma and phaeochromocytoma with germline SDHB, SDHC, or SDHD gene mutations: A retrospective and prospective analysis. Lancet Oncol. 2009, 10, 764–771. [Google Scholar] [CrossRef] [Green Version]
  39. Gill, A.J. Succinate dehydrogenase (SDH)-deficient neoplasia. Histopathology 2018, 72, 106–116. [Google Scholar] [CrossRef]
  40. Zhang, W.C.; Wells, J.M.; Chow, K.H.; Huang, H.; Yuan, M.; Saxena, T.; Melnick, M.A.; Politi, K.; Asara, J.M.; Costa, D.B.; et al. miR-147b-mediated TCA cycle dysfunction and pseudohypoxia initiate drug tolerance to EGFR inhibitors in lung adenocarcinoma. Nat. Metab. 2019, 1, 460–474. [Google Scholar] [CrossRef] [PubMed]
  41. Agarwal, V.; Bell, G.W.; Nam, J.W.; Bartel, D.P. Predicting effective microRNA target sites in mammalian mRNAs. Elife 2015, 4, e05005. [Google Scholar] [CrossRef] [PubMed]
  42. Mohamed, J.S.; Hajira, A.; Pardo, P.S.; Boriek, A.M. MicroRNA-149 inhibits PARP-2 and promotes mitochondrial biogenesis via SIRT-1/PGC-1alpha network in skeletal muscle. Diabetes 2014, 63, 1546–1559. [Google Scholar] [CrossRef] [PubMed] [Green Version]
  43. Akcakaya, P.; Caramuta, S.; Ahlen, J.; Ghaderi, M.; Berglund, E.; Ostman, A.; Branstrom, R.; Larsson, C.; Lui, W.O. microRNA expression signatures of gastrointestinal stromal tumours: Associations with imatinib resistance and patient outcome. Br. J. Cancer 2014, 111, 2091–2102. [Google Scholar] [CrossRef] [Green Version]
  44. Caramuta, S.; Egyhazi, S.; Rodolfo, M.; Witten, D.; Hansson, J.; Larsson, C.; Lui, W.O. MicroRNA expression profiles associated with mutational status and survival in malignant melanoma. J. Investig. Dermatol. 2010, 130, 2062–2070. [Google Scholar] [CrossRef] [PubMed] [Green Version]
Figure 1. miRNA expressions in imatinib-treated and untreated gastrointestinal stromal tumor (GIST) samples. (A) Hierarchical clustering of the 14 differentially expressed miRNAs between imatinib-treated (n = 19) and untreated GISTs (n = 15) was performed based on the Spearman’s Rank Order Correlation and complete linkage. Red and green in the heatmap refer to higher and lower expressions, respectively. The two main clusters are indicated by yellow and blue bars above the dendrogram. (B) RT-qPCR analysis of four selected differentially expressed miRNAs in an extended cohort of 33 untreated and 29 treated GIST samples. *** p < 0.001 by Mann–Whitney U-test.
Ijms 22 10600 g001
Figure 2. Effect of imatinib treatment on miRNA expressions in GIST cell lines. (A) Western blot showing the effectiveness of imatinib treatment in GIST cell lines, as demonstrated by inhibition of KIT phosphorylation. (B) RT-qPCR analyses of miR-320b and miR-483-3p were performed in GIST T1 and GIST 882 cell lines after imatinib treatment (1 μM, 24 h). miRNA expression was normalized to U48. Fold change refers to the normalized miRNA expression values relative to their respective untreated cells. Differences between groups were calculated using paired t-test. * p < 0.05, ** p < 0.01.
Ijms 22 10600 g002
Figure 3. Effect of miR-483-3p overexpression and inhibition on oxidative phosphorylation (OXPHOS) protein expressions. (A,C) Representative Western blots showing OXPHOS proteins in GIST cell lines upon inhibition (A) or overexpression (C) of miR-483-3p and their respective non-targeting controls (NC) at 72 h post-transfection. Estimated protein sizes are given to the right of the blots in kiloDalton (kDa). (B,D) Bar plots showing quantification of OXPHOS proteins in (A,C). β-actin was used as a loading control. miRNA inhibitor and mimic non-targeting controls were set to 1.0. (E) RT-qPCR analysis of SDHB mRNA in GIST cells with overexpression or inhibition of miR-483-3p. Error bars refer to SD of two or three independent experiments. Differences between groups were calculated using paired t-test. * p < 0.05, ** p < 0.01, ns = not significant.
Ijms 22 10600 g003
Figure 4. Relationship between succinate dehydrogenase B (SDHB) protein expression and imatinib treatment or miR-483-3p. (A) Representative Western blots showing SDHB protein expression in GIST cell lines with and without imatinib treatment (1 μM). GAPDH was used as a loading control. (B) Quantification of SDHB expression upon imatinib treatment of GIST cell lines at different time points. Differences between groups were calculated using paired t-test. * p < 0.05, ** p < 0.01 (n = 3). (C) Inverse correlation between SDHB protein expression and miR-483-3p in untreated and imatinib-treated GIST tumor samples.
Ijms 22 10600 g004
Figure 5. Effect of miR-483-3p regulation on cell viability with and without imatinib treatment. (A) Western blots showing the effect of miR-483-3p inhibition or overexpression on cleaved PARP (cPARP) expression in GIST cell lines. β-actin was used as a loading control. (B) Quantification of cPARP protein level in (A). (C) GIST cells were transfected with miR-483-3p mimic or NC for 24 h, followed by imatinib treatment for another 24 h. Cell viability was assessed by trypan blue staining. (D) Western blots showing the effect of miR-483-3p overexpression on SDHB protein level after 48 h of imatinib treatment. * p < 0.05, ** p < 0.01, *** p < 0.001, ns = not significant by paired t-test. Error bars represent SD. Each replicate is depicted by a dot.
Ijms 22 10600 g005
Table 1. Microarray-based SAM results for top miRNAs in imatinib-treated (n = 19) vs. untreated (n = 15) tumors.
miRNAScore (d)FDR q-Value (%)
Over-expressed in imatinib-treated GISTs
hsa-miR-320a2.020.00
hsa-miR-193a-3p1.870.00
hsa-miR-320d1.800.00
hsa-miR-320c1.760.00
hsa-miR-320b1.4412.33
hsa-miR-574-5p1.4212.33
hsa-miR-23b1.3812.33
hsa-miR-125a-3p1.3712.33
hsa-miR-1001.3412.33
hsa-miR-20a1.3412.33
hsa-miR-28-5p1.3012.33
hsa-miR-92a1.3012.33
Under-expressed in imatinib-treated GISTs
hsa-miR-149−2.690.00
hsa-miR-483-3p−2.630.00
FDR = False discovery rate; only miRNAs with a q-value < 20% are listed.
Publisher’s Note: MDPI stays neutral with regard to jurisdictional claims in published maps and institutional affiliations.

